

Abstract
Population codes assume that neural systems represent sensory inputs through the firing rates of populations of differently tuned neurons. However, trial-by-trial variability and noise correlations are known to affect the information capacity of neural codes. Although recent studies have shown that stimulus presentation reduces both variability and rate correlations with respect to their spontaneous level, possibly improving the encoding accuracy, whether these second order statistics are tuned is unknown. If so, second-order statistics could themselves carry information, rather than being invariably detrimental. Here we show that rate variability and noise correlation vary systematically with stimulus direction in directionally selective middle temporal (MT) neurons, leading to characteristic tuning curves. We show that such tuning emerges in a stochastic recurrent network, for a set of connectivity parameters that overlaps with a single-state scenario and multistability. Information theoretic analysis shows that second-order statistics carry information that can improve the accuracy of the population code.
Cortical activity is highly variable during spontaneous activity (1–4) and even when tested under constant experimental conditions (5–8). This variability is thought to limit the capacity of individual neurons to transmit information (9). Furthermore, variability is often correlated among neurons, and thus, it cannot be completely removed by averaging the population response (9–12). Recent experimental studies have examined the second-order statistics of neural responses across a variety of species, cortical areas, tasks, and stimulus and/or attentional conditions (13–17). In particular, it has been shown that the Fano factor (FF)—that is, the ratio between the variance of the spike counts over trials and its mean—is reduced when a stimulus is applied (16), thus improving the encoding of the stimulus. Importantly, both preferred and nonpreferred stimuli reduced the FF. In addition, the evoked noise correlation—that is, the trial-to-trial covariance of stimulus induced activity between two simultaneously recorded neurons—is also reduced upon stimulus presentation (18), after stimulus adaptation (19) or perceptual learning (20), and under attention (14, 21), an effect that could, under certain conditions, lead to more reliable estimates of the mean population activity (22). Hence, there is a growing body of evidence suggesting that the encoding of a signal through cortical activity may be improved by minimizing both trial-by-trial variability and noise correlations. However, it remains an open experimental and theoretical question, whether these statistics are themselves tuned to different stimulus features, an aspect that may be overlooked when only analyzing preferred and nonpreferred stimuli.
Here, we examined the statistics of responses of area–middle temporal (MT) neurons in awake, fixating primates, to moving gratings and different plaid patterns of different directions, as well as moving gratings of different luminance contrasts. Specifically, we examined the baseline levels and the evoked directional and contrast tuning of the FF of individual neurons and the noise correlations between pairs of neurons with similar direction preferences. To get further theoretical insight, we investigated the effect of an applied stimulus on variability and correlations in an extended ring network model implementing direction selectivity (23).
We found that both the trial-by-trial variability and the noise correlations among MT neurons showed a directional tuning that is not trivially explained by firing rate variations alone. We demonstrated that the tuning of these second-order statistics is well explained by a ring model operating near or beyond a bifurcation separating a single homogeneous state regime and a regime of multistability. Finally, we evaluated the impact of tuned second-order statistics on the accuracy of the population code.
Results
Tuning of the Trial-by-Trial Variability.
Two experiments were analyzed to investigate the statistics of responses of area–MT neurons as a function of motion direction and contrast of visual stimuli. In our direction tuning experiment, we recorded 42 directionally selective cells from area MT in three awake fixating macaques and 50 direction selective cells from two awake fixating macaques in our contrast experiments (Methods and SI Methods). Directional tuning was measured with square wave gratings and plaid pattern stimuli (see Fig. 1 for a brief description of the different stimuli used). Based on the responses to different grating directions, we calculated a directional vector (SI Methods) for each neuron and the preferred direction (PD) was taken to be the stimulus direction most similar to this directional vector. Other directions were then assigned a value according to their proximity relative to PD [i.e., ±45°, ±90°, ±135°, 180° (anti-PD)]. We were interested in the rate variability after stimulus onset for different directions of motion relative to preferred. We therefore calculated the FF for the different stimulus directions, using a sliding time window of 100 ms length, moving in 10 ms steps. Fig. 1A shows the FFs for the population of cells for the different stimulus types and motion directions (example single cell activity is available in Fig. S1; FFs of different cell types are shown in Fig. S2). Before stimulus onset FFs are relatively high, as reported previously. Immediately after stimulus onset, FFs are strongly reduced, irrespective of the motion direction. However, within ∼100 ms the FFs associated with different directions of stimulus motion diverge. FFs associated with motion in PD stay at a low level, even if they increase slightly with time. FFs for motion directions further away from preferred were higher and seemed to peak for motion directions ±135° off preferred. Stimuli moving in anti-PD were again associated with lower FFs.
Fig. 1.

Tuning of FFs for different motion directions. (A) Time-resolved population FFs, indicated by color coding, for different stimuli and different directions of motion relative to preferred, were calculated in sliding windows of 100 ms shifted in 10 ms steps. The y-axis shows stimulus direction (PD-preferred). The left side of the figure indicates the stimuli used: coherently moving plaids (Top), noncoherently moving plaids (Upper Middle), depth ordered plaids (Lower Middle), and gratings (Bottom). (B) Averaged FF (±SEM) for different stimulus types calculated within the time window is indicated by the gray horizontal bar in A. The dashed line shows average (±SEM) of FF before stimulus onset. (C) Normalized mean firing rate (±SEM) for the different stimulus conditions and before stimulus onset (dashed line). (D) Time-resolved population (n = 50 cells) tuning of FFs for different luminance contrast (% Michelson contrast) when gratings of preferred motion direction were presented. (E) Averaged FF (±SEM) calculated within the time window is indicated by the gray horizontal bar in D. Dashed line, average FF (±SEM) before stimulus onset. (F) Normalized mean firing rate (±SEM) for the different stimulus contrasts and before stimulus onset (dashed line).
We quantified this apparent tuning by averaging the FFs during the time window within 100–400 ms after stimulus onset for each neuron (Fig. 1B). FFs showed an M-shaped tuning for most stimuli, whereby FFs associated with preferred stimulus motion were lowest, whereas those associated with stimulus motion ±135° relative to preferred were the highest. A two-factor repeated measures ANOVA revealed that the tuning of FF was significant (P = 0.0429, two-factor ANOVA)—that is, FFs significantly varied with direction of stimulus motion relative to preferred. There was a trend for FFs to differ between different stimulus types, but this did not reach significance (P = 0.0658, two-factor ANOVA). Importantly, there was no interaction between stimulus type and stimulus direction (P = 0.888, two-factor ANOVA), suggesting that the FF tuning does not depend on the stimulus type.
In principle the M-shaped tuning of the FF could reflect a nonlinear relation between variance and mean firing rate rather than direction tuning per se (see Fig. 1C and Figs. S3 and S4 for non-normalized mean firing rate and variance). If variance and mean firing rate invariably diverged at intermediate firing rates, then the FF tuning would thus not be useful for decoding strategies (see below). To examine the dependence of FF on response amplitude, we investigated the contrast-dependent FF tuning of MT neurons to moving stimuli, when either preferred (Fig. 1 D and E) or antipreferred motion was presented (see Fig. S5 for antipreferred motion effects). FFs decreased as stimulus contrast increased for both motion directions (although this was more pronounced for preferred motion stimuli). Importantly, the FF changes were monotonic throughout—that is, there was no increase of FFs at intermediate firing rates (Fig. 1 E and F). Thus, the FF directional tuning is not a by-product of a FF–firing rate nonlinear relation.
Tuning of the Noise Correlations of Neurons with Similar Direction Selectivity.
We next determined whether covariance of firing rates between neurons shows similar tuning to that of the FF. We calculated the noise correlation for neurons recorded from one or different recording electrodes (Methods and SI Methods), provided their PD was within ±45° from one another. We then took the overall PD to be the direction preferred by one of the two neurons and calculated noise correlations for the different stimulus directions relative to this PD. We recorded from 15 pairs with sufficiently similar PDs and calculated the tuning of the noise correlation (Fig. 2). Noise correlations during spontaneous activity were close to 0.1. Stimuli moving in PD resulted in noise correlations close to zero. Stimuli moving at 90° or 135° relative to preferred resulted in noise correlations close to those obtained during spontaneous activity. Although tuning of the noise correlation data overall looks noisier than the FF tuning, there still are indications of M-shaped tuning for all stimuli. Importantly, noise correlations significantly differed for different directions of motion (P = 0.0164, two-factor ANOVA)—that is, they were tuned. Noise correlations differed significantly between different stimulus types (plaid types and grating, P < 0.001, two-factor ANOVA), but there was no interaction between stimulus direction and stimulus type (P = 0.189, two-factor ANOVA).
Fig. 2.
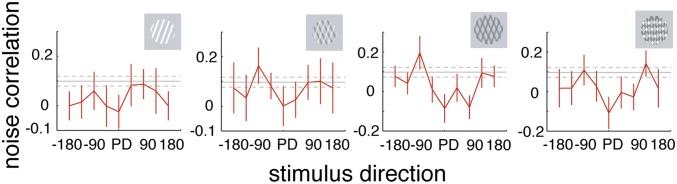
Noise correlation tuning for different stimulus types. Averaged noise correlations for different stimulus directions (relative to preferred). Neuronal pairs had similar PDs. Error bars represent SEM. Solid horizontal gray line represents mean value before stimulus onset (baseline), dashed lines the corresponding SEM. Stimuli yielding the different noise correlations are shown on the right.
Network Model.
We next studied the behavior of a stochastic rate-based network model (Methods and SI Methods) in spontaneous (baseline) and evoked conditions. Here, we concentrate on the statistics of the underlying firing rate and assume that spikes are generated via a Poisson process. Thus, the spiking process is doubly stochastic, and hence, the FF is the sum of the variance-to-mean ratios of the underlying rate and the spike emission.
MT neuronal responses were modeled using a version of the ring network model (23), composed of M neural populations, each containing N neurons of same direction preference, represented by an angle θ (Fig. 3A). Neurons receive external and lateral recurrent inputs and uncorrelated noise. Connectivity between populations θ and θ’ depends only on the difference between PDs and is given by: W(θ, θ’) = J0+J2cos(θ–θ’), where J0 is a global uniform excitation (J0 > 0) or inhibition (J0 < 0) and J2 is the magnitude of the spatial interaction that parameterizes the level of network recurrence. The phase diagram of the network―that is, its spontaneous state given the set of parameters {J0, J2} in the absence of noise―is shown in Fig. 3B. For low J2, the network converges to a homogeneous stable state in which all neurons have the same low firing rate (Fig. 3C). For J2 higher than a critical value (J2c), the network enters into a multistable regime, called marginal phase, and depending on the initial conditions (ICs), settles into one of M possible bumps of activity (Fig. 3D). For higher J2 and insufficient global inhibition (J0 < 0) or for sufficiently high global excitation (J0 > 0), the network activity saturates. Subject to stimulation, the steady-state response of the network peaks for the neural population whose angle matches the stimulus direction (Fig. 3 C and D)―independent of ICs.
Fig. 3.

Network phase diagram. (A) Neurons (small circles) are fully connected and clustered into M populations (large circles). Arrows represent spatially modulated connections from one population to the others. (B) Depending on J0 and J2, and the ICs, the network converges to a single stable state (homogeneous), to a bump of activity (marginal), or to a saturated state (instability). For each set of parameters, 10 random ICs were used. The red points indicate the parameters used in C and D. (C) Spontaneous (black) and evoked (blue) mean activity profile in the homogeneous phase (J0 = –40 and J2 = 20). (D) Spontaneous (for two different ICs, black and green, respectively) and evoked (blue) mean activity profile in the marginal phase (J0 = –40 and J2 = 33). Parameters, I0 = 1; β = 0.01; βI = 0.01; n = 20; M = 32, θ* = 180°, C = 1.
Approximation of Second-Order Statistics, Weak Noise.
To estimate the network’s statistics, we used the Augmented Moment Method (AMM) (24, 25) that approximates deterministic dynamical equations for statistical moments of network activity (Methods and SI Methods). This reduces the number of variables and allows for parameter exploration that, otherwise, is unpractical as moments estimation would require many simulations of the entire stochastic system. In the AMM, the activity of a population of N units is expressed by μ, the mean firing rate; γ, the averaged firing rate fluctuations; and ρ, averaged covariance between pairs of neurons. The degree of correlation inside a given population is given by the quantity S (Methods and SI Methods). A limitation of the AMM is that it is restricted to the case of weak noise (24). For this reason, in the AMM framework, changes of second-order statistics must be interpreted relative, between neural populations or between spontaneous and evoked conditions, because their absolute values depend on noise intensity. In addition, the AMM cannot handle stochastic transitions between multiple stable points, as it requires the distribution of the state variables to be unimodal (26). For this reason, the AMM was not used to calculate the spontaneous second-order statistics in the marginal phase―this case is treated below using direct simulations. In this phase, only evoked statistics were obtained, as the stimulus effectively clamped the network to a specific single bump state, and thus, the validity conditions of the AMM are met.
Using the AMM we calculated the spontaneous and evoked network’s mean activity (Fig. 4A), variances (Fig. 4B), and correlations (Fig. 4C). J0 was fixed to –30, for which the bifurcation is at J2c = 26.29. Notably, the variances and the correlations of the different neural populations depend on the connectivity parameters. Indeed, the derived equations for the second-order statistics show the contribution of network interactions (SI Methods). Far from the bifurcation (J2 < 26), the variance (/correlation) is very weakly tuned and it is minimal (/maximal) for the neural population for which the stimulus direction is the preferred (Fig. 4 B and C, Insets). The neural populations receiving the null stimulus are inhibited, and their variance is dominated by the additive noise—that is, for these populations, the network does not amplify the noise (SI Methods). Near the bifurcation (J2 = 26.1), the evoked variance and the correlation are strongly reduced compared with their spontaneous level and show a pronounced directional tuning, presenting an M-shape, with maxima for neural populations of intermediate preference. This tuning is also found in the marginal phase (Fig. 4 B and C, last three panels), and as shown below using direct simulations, both variances and correlations are reduced from their spontaneous levels. Interestingly, for sufficiently high spatial interaction, the tuning of the variance/correlation does not depend on the tested stimulus contrast.
Fig. 4.

Network first- and second-order statistics, weak noise. (A–C) The expected mean firing rates (μ), variances (γ), and intrapopulation correlations (S) of the neural populations using the AMM in both spontaneous (black) and evoked (green and red) conditions. J0 was fixed to –30, for which J2c = 26.29. The direction of the stimulus was θ* = 180°, and its contrast was C = 0.5 (green) or C = 1 (red). In C, the gray shaded area indicates negative values. Because the AMM cannot handle multistability, we did not treat the spontaneous second-order statistics in the marginal phase (thus the absence of a spontaneous line in B and C when J2 ≥ 27). Parameters, I0 = 1; β = 0.01; βI = 0.01; n = 20; M = 32.
Second-Order Statistics, High Noise.
We tested these predictions by performing explicit simulations of the network in the presence of high level of noise, which is ubiquitous in neural systems. In addition, the input noise was a slow colored noise (SI Methods), mimicking the slow fluctuations of ongoing activity and ensuring that the rate fluctuations have a longer time scale within a trial, instead of rapidly jittering around the mean level. We first examined the network in the homogeneous phase, near the bifurcation (Fig. 5 A–E). Network’s statistics were calculated in two periods, before the stimulus application and after the network stabilizes with a unique evoked bump of activity (Fig. 5 A and B). Spontaneous and evoked variances are shown in Fig. 5C. The resulting FF is reduced in the stimulus-elicited response, and it is maximal for neural populations of intermediate preference, replicating the empirical results (Fig. 5D). Note also that the dropdown of variance is less pronounced that for vanishing noise; this is due to the well-known noise-smoothing of the threshold of the neurons’ transfer function. Similarly, the evoked mean (Pearson) correlation coefficient among pairs of neurons in each neural population is reduced and tuned (Fig. 5E). Both FF and correlations are modulated by the stimulus contrast. In the marginal phase, we found qualitatively the same results as for the homogeneous phase (Fig. 5 G–J); however, the reduction of the evoked variability and correlations comes from a conceptually different way in the different phases. In the homogeneous phase, the network fluctuates around a single state (Fig. 5K) that has more variability/correlation than the evoked attractor, whereas, in the marginal phase, the network undergoes noise-driven transitions between the multiple spontaneous bump attractors (Fig. 5L) that increase the level of variability and correlations, but are suppressed when a stimulus stabilizes the network in one state.
Fig. 5.

Network statistics at the edge and beyond the bifurcation. (A–E) Network statistics in the homogeneous phase (J0 = –40; J2 = 32), near the bifurcation (J2c = 32.3). (A) Rates of three example neurons from different populations (color-indicated direction selectivity as in the inset), for three trials (i.e., simulations) among a total of 200 trials. The white line indicates the onset of a constant stimulus of direction θ* = 180° and contrast C = 3. (Inset) Color radiuses represent the stimulus intensity that neural populations (circles) receive. Colors indicate the PD of neural populations. (B and C) Spontaneous (black) and evoked (blue, C = 1; green, C = 2; red, C = 3) mean activity (B) and variance γ (C) in each population. (D) Relation between the mean rate and the total variance (rate variance plus expected Poisson variance), expressed as the FF. To compare with the empirical results, the FFs of neural populations with similar (i.e., |θ–θ’|<45°) direction preferences were averaged. (E) Spontaneous and evoked mean correlation coefficient. All spontaneous and evoked statistics were computed in the two corresponding time windows shown in A. (F–J) Same analysis as in A–E, but for a network in the marginal phase (J0 = –40; J2 = 33). (K–L) Spontaneous firing rates of the neurons (arranged according to their PD), in the homogeneous (K) and the marginal (l) phases (gray scale). (Insets) Mean activity profile, calculated in the time window shown in white. Parameters, I0 = 2, β = 0.01, σ = 0.3, n = 20, M = 16.
The empirical evoked FFs of MT neurons first decreased, irrespective of the motion direction, and then evolve to a function of stimulus direction (Fig. 1A). Following previous studies suggesting that a change in the field of view drives the initial phasic response of neurons from visual areas, which later represents specific features of the visual scene (27, 28), we showed that consecutive application of a transient nonselective stimulus followed by a directed stimulus might explain the sudden reduction of FF and subsequent directional tuning (SI Methods and Figs. S6 and S7).
Effect of Stimulus-Dependent Second-Order Statistics on Coding Accuracy.
The above experimental and theoretical results indicate that second-order statistics are stimulus-dependent. Surprisingly, both rate variability and noise correlations are maximal for neural populations for which small variations of stimulus direction lead to pronounced mean firing rate variations. Thus, these neural populations contribute the most to the encoding information through mean firing rate variation (29). The question arises of whether the directional tuning of the second-order statistics impairs or improves the encoding of the stimulus. We calculated the Fisher information (FI), which gives an upper bound to the accuracy that any population code can achieve (29). The FI takes into account the change of the mean activity and covariances with respect to a variation in the stimulus direction (SI Methods). It can be written as a sum of two quantities, FImean and FIcov, representing the contribution of the mean response and the covariance, respectively. Because empirical estimation of the covariance matrix and its derivative requires a prohibitive amount of data―composed of pairs of simultaneously recorded neurons for each combination of considered direction preferences―we used the model to calculate the FI. FImean and FIcov were calculated as a function of J2, for different stimulus contrasts (Fig. 6A). For low contrast and for increasing values of J2 approaching or exceeding the bifurcation value, the term FIcov is of the same order or even larger than FImean. For higher contrasts, the term FImean dominates. Therefore, depending on the network parameters and the stimulus contrast, a substantial part of the information can come from the tuning of second-order statistics. We tested these predictions by using direct simulations of the entire network with high colored noise and by comparing them to the case of a network with independent neurons, for which the covariances were set to zero and the variances were set to the mean value (Fig. 6B). We found that the presence of stimulus-dependent variances and noise correlations can make the population code as accurate as seen otherwise in a population of independent neurons.
Fig. 6.

Impact of tuned second-order statistics on coding accuracy. (A) FImean and FIcov (scaled by the total number of neurons) calculated using the AMM, for different J2 and different stimulus contrasts compared with the noise level (SN, signal-to-noise ratio). Because for low contrasts and high J2 the stimulus is not strong enough to stabilize a bump of activity centered at the stimulus direction θ*, only data for which the evoked bump’s center matches θ* are presented. (B) Scaled FImean and FIcov estimated using 2,000 direct simulations of the entire network, in the presence of colored noise. The red trace represents the FI of a network in which covariances between different neural populations are set to zero and variances are set to the mean value. Parameters in A, I0 = 1, β = 0.01, βI = 0.01, n = 20, M = 60; in B, I0 = 1, β = 0.01, σ = 0.3, n = 20, M = 60, C = 1.
Discussion
We have shown that trial-by-trial variability and noise correlations of MT neurons are significantly tuned to the direction of moving gratings and plaid pattern stimuli. This tuning cannot be explained by variation of the mean firing rate. Previous reports suggest that variance and correlations increase with increasing firing rate (8, 30), whereas here we showed that the FF is directionally tuned and that it is a not a side-product of a nonlinear dependence between FF and firing rate that would make FFs higher for intermediate firing rates. This suggests that the tuning of the second-order statistics arises from a network effect. Using a recurrent network, we show that the qualitative shape of the tuning of second-order statistics emerges close to or in the presence of multistability. In the model, trial-by-trial variability and noise correlations are assumed to be determined by fluctuations of the underlying rate functions that add an extra variability to the Poisson spike generation process. This assumption is reasonable as the reported variability of MT neurons is higher than the Poisson process—that is, FF > 1 (31–34) (Fig. 1B). Note that both the evoked trial-by-trial variability and noise correlations are reduced compared with their spontaneous levels, consistent with previous empirical observations (16, 18), a feature that is captured by the model.
Although the present model explains well the stationary distribution of variability and correlations, it hardly accounts for the rich temporal evolution of neural response statistics. As a first approximation, the sudden initial decrease of the empirical FF following the stimulus onset might be exogenously driven by nonselective pre-excitation (SI Methods). However, whether and how internal network dynamics govern the transient evolution of neural statistics remains an open question. Internal nonstationary dynamics might be governed by single-cell or network features, not considered in our simple model, such as excitation–inhibition unbalancing (35); time lag between excitation and inhibition (36), possibly mediated by different adaptation of excitatory and inhibitory cells (37); a change of the spiking-generation process due to an increase of feed-forward inputs (18); or even a complex interaction between sensory inputs and ongoing activity (38).
Previous empirical studies reported that FFs change with stimulus due to negative correlations between FF and firing rate (6, 39), whereas stimulus-dependent changes of trial-by-trial variability have only been observed in the midbrain and thalamus (40, 41). Variations of noise correlations with respect to speed of moving targets and movement direction have been reported in pairs of MT and motor–cortical neurons, respectively (42, 43). Our study provides a theoretical framework to test hypotheses on how a particular underlying connectivity and dynamical properties structure the fluctuations in neural networks.
Together, these results raise the question of how the structured variability and correlations impact the efficiency of the population code. Here, we showed that the covariance matrix evoked by the stimulus provides a substantial contribution to the information transmission, especially for low stimulus intensity. In this case, the encoding accuracy of correlated neuronal populations practically equals the accuracy of a population of independent neurons. Our results are consistent with previous theoretical work showing that information transmission in feed-forward models relies less on correlations than in the case of recurrent models (44). Indeed, the covariance increasingly contributes to the FI as model parameters change the network from feed-forward to highly recurrent (Fig. 6). Here, we provide experimental evidence suggesting that stimulus-dependent correlations might be used to transmit information. However, information readout from the covariance structure is nontrivial and requires nonlinear schemes (45), and it remains to be determined whether and how they are implemented by neural systems in vivo.
The empirical results are well explained by a ring network placed at the edge or beyond a bifurcation separating a stable point of low activity and a set of stable bump states. Although the rich spatiotemporal structure of spontaneous activity is often associated with multistability (1–3, 46–48), this view is subject to debate (49, 50). To elucidate the dynamical state of spontaneous activity in MT, more investigation, using large ensembles of simultaneously recorded neurons, is needed. Nevertheless, the low level of spontaneous correlations (∼0.1) reported here may be an indication that the network operates in a single state, but near the multistability. This view is supported by recent studies showing that spiking networks represent better both the FF reduction and the resting-state correlations of fMRI signals near criticality (51, 52). This scenario is functionally meaningful as, at this working point, the network can rapidly react to an external stimulus and represent it in one attractor.
Our results argue that variability and correlations of MT neurons are globally attenuated and tuned upon stimulus application, suggesting that second-order statistics are shaped in structured networks in a way that can improve the population code.
Methods
Recording Techniques.
After training, monkeys (Macaca mulatta) were implanted with a head holder and recording chambers above MT under general anesthesia and sterile conditions, as described previously (53). All procedures complied with the European Communities Council Directive RL 2010/63/EC, the US National Institutes of Health Guidelines for the Care and Use of Animals for Experimental Procedures, and the UK Animals Scientific Procedures Act. Single-unit activity from area MT was recorded using a 4-electrode devise (Alpha Omega), while grating and plaid pattern stimuli were presented. Spike sorting techniques are detailed in SI Methods.
Visual Stimuli.
Motion direction experiment.
Animals fixated a 0.48-diameter target (within 1.0–1.5°) during a 700 ms prestimulus and 2 s stimulus presentation period. For single grating motion and for each of the three-plaid pattern, eight different directions of motion were used (22.5–337.58, in steps of 45°). Motion direction for the plaid pattern is aligned to the motion of the grating under the assumption that the “coherent” motion direction corresponds to the motion direction of the single grating. Grating stimuli and plaid patterns were generated as described previously (53).
Contrast experiment.
Animals fixated a small target as described above during 0.5 s prestimulus and a 1s stimulus period. Generation of visual stimuli of different luminance (Michelson) contrast is detailed in SI Methods.
Data Analysis.
We analyzed the activity of single neurons and pairs of simultaneously recorded neurons that fulfilled our inclusion criteria (see SI Methods for details). The criteria were defined to select stable recordings (without drifts of activity) of neurons with significant directional selectivity as measured by a direction index. For pairs of cells to be included into the noise correlation analysis, their PD had to be within 45°. FFs and noise correlations were calculated separately for each stimulus condition. Noise correlation was calculated as the Pearson correlation coefficient (shift predictor corrected) between the single-trial spike-counts recorded from the two cells for each stimulus condition within the analysis window (SI Methods).
Model.
We studied M interconnected neural populations, each containing N neurons, using a rate-based model (SI Methods). Briefly, neural populations are arranged on a ring, so that they are labeled by a unique angle θ (23). Each neuron transforms rate inputs (u) into an output rate (r) through a saturating transfer function H(u). The dynamics are given by:
 |
and
 |
where riθ(t) is the firing rate of unit i (1≤i≤N) from the population m = θ, and τm = 10 ms. H(u) = tanh(u/a)Θ(u), where Θ is the Heaviside function acting as a threshold and a = 10. ξi(t) is an additive uncorrelated noise of size β. The connection weight between populations θ and θ’ is wθ,θ’ = J0+J2cos(θ–θ’). I0 is a constant input. In stimulus condition, all neurons from population θ receive an external input Iθ that is broadly tuned around θ* and taken as Iθ = C(1–ε+ε.cos(θ–θ*)), ε and C being the stimulus’ anisotropy (fixed to 0.1) and contrast, respectively. Uncorrelated noise of magnitude βI is added to Iθ. Rate variables were multiplied by 60 to get a biological range of firing rates.
AMM.
We used the AMM (24, 25) to express the system of stochastic differential Eqs. 1–3 in terms of means—that is,  ; variances—that is,
 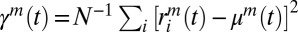 ; and covariances of network activity—that is,
  . Using the AMM, deterministic equations of motion of the moments are obtained (SI Methods). The level of correlation inside a given population is expressed by the synchronization ratio: Sm(t) = [Nρmm(t)/γm(t)–1]/(N–1) (SI Methods). Sm is null in the asynchronous state, and it is equal to 1 in the completely synchronous state in which all neurons have the same firing rate R(t) (24).
Supplementary Material
Acknowledgments
We are grateful to H. Sprekeler for critical comments. We acknowledge the support of the Spanish Research Project SAF2010-16085, the CONSOLIDER-INGENIO 2010 Prog. CSD2007-00012, the European Research Council Advanced Grant DYSTRUCTURE, the Brain Network Recovery Group through the James S. McDonnell Foundation, and the Seventh Framework Programme-Information and Communication Technologies BrainScales. A.T. was supported by Human Frontier Science Program and Biotechnology and Biological Sciences Research Council.
Footnotes
The authors declare no conflict of interest.
*This Direct Submission article had a prearranged editor.
This article contains supporting information online at www.pnas.org/lookup/suppl/doi:10.1073/pnas.1300098110/-/DCSupplemental.
References
- 1.Arieli A, Shoham D, Hildesheim R, Grinvald A. Coherent spatiotemporal patterns of ongoing activity revealed by real-time optical imaging coupled with single-unit recording in the cat visual cortex. J Neurophysiol. 1995;73(5):2072–2093. doi: 10.1152/jn.1995.73.5.2072. [DOI] [PubMed] [Google Scholar]
- 2.Arieli A, Sterkin A, Grinvald A, Aertsen A. Dynamics of ongoing activity: Explanation of the large variability in evoked cortical responses. Science. 1996;273(5283):1868–1871. doi: 10.1126/science.273.5283.1868. [DOI] [PubMed] [Google Scholar]
- 3.Kenet T, Bibitchkov D, Tsodyks M, Grinvald A, Arieli A. Spontaneously emerging cortical representations of visual attributes. Nature. 2003;425(6961):954–956. doi: 10.1038/nature02078. [DOI] [PubMed] [Google Scholar]
- 4.Fiser J, Chiu C, Weliky M. Small modulation of ongoing cortical dynamics by sensory input during natural vision. Nature. 2004;431(7008):573–578. doi: 10.1038/nature02907. [DOI] [PubMed] [Google Scholar]
- 5.Werner G, Mountcastle VB. The variability of central neural activity in a sensory system, and its implications for the central reflection of sensory events. J Neurophysiol. 1963;26:958–977. doi: 10.1152/jn.1963.26.6.958. [DOI] [PubMed] [Google Scholar]
- 6.Tolhurst DJ, Movshon JA, Dean AF. The statistical reliability of signals in single neurons in cat and monkey visual cortex. Vision Res. 1983;23(8):775–785. doi: 10.1016/0042-6989(83)90200-6. [DOI] [PubMed] [Google Scholar]
- 7.Vogels R, Spileers W, Orban GA. The response variability of striate cortical neurons in the behaving monkey. Exp Brain Res. 1989;77(2):432–436. doi: 10.1007/BF00275002. [DOI] [PubMed] [Google Scholar]
- 8.Shadlen MN, Newsome WT. The variable discharge of cortical neurons: Implications for connectivity, computation, and information coding. J Neurosci. 1998;18(10):3870–3896. doi: 10.1523/JNEUROSCI.18-10-03870.1998. [DOI] [PMC free article] [PubMed] [Google Scholar]
- 9.Shadlen MN, Newsome WT. Motion perception: Seeing and deciding. Proc Natl Acad Sci USA. 1996;93(2):628–633. doi: 10.1073/pnas.93.2.628. [DOI] [PMC free article] [PubMed] [Google Scholar]
- 10.Johnson KO. Sensory discrimination: Neural processes preceding discrimination decision. J Neurophysiol. 1980;43(6):1793–1815. doi: 10.1152/jn.1980.43.6.1793. [DOI] [PubMed] [Google Scholar]
- 11.Gawne TJ, Richmond BJ. How independent are the messages carried by adjacent inferior temporal cortical neurons? J Neurosci. 1993;13(7):2758–2771. doi: 10.1523/JNEUROSCI.13-07-02758.1993. [DOI] [PMC free article] [PubMed] [Google Scholar]
- 12.Lee D, Port NL, Kruse W, Georgopoulos AP. Variability and correlated noise in the discharge of neurons in motor and parietal areas of the primate cortex. J Neurosci. 1998;18(3):1161–1170. doi: 10.1523/JNEUROSCI.18-03-01161.1998. [DOI] [PMC free article] [PubMed] [Google Scholar]
- 13.Mitchell JF, Sundberg KA, Reynolds JH. Differential attention-dependent response modulation across cell classes in macaque visual area V4. Neuron. 2007;55(1):131–141. doi: 10.1016/j.neuron.2007.06.018. [DOI] [PubMed] [Google Scholar]
- 14.Cohen MR, Maunsell JH. Attention improves performance primarily by reducing interneuronal correlations. Nat Neurosci. 2009;12(12):1594–1600. doi: 10.1038/nn.2439. [DOI] [PMC free article] [PubMed] [Google Scholar]
- 15.Churchland MM, Yu BM, Ryu SI, Santhanam G, Shenoy KV. Neural variability in premotor cortex provides a signature of motor preparation. J Neurosci. 2006;26(14):3697–3712. doi: 10.1523/JNEUROSCI.3762-05.2006. [DOI] [PMC free article] [PubMed] [Google Scholar]
- 16.Churchland MM, et al. Stimulus onset quenches neural variability: A widespread cortical phenomenon. Nat Neurosci. 2010;13(3):369–378. doi: 10.1038/nn.2501. [DOI] [PMC free article] [PubMed] [Google Scholar]
- 17.Niebergall R, Khayat PS, Treue S, Martinez-Trujillo JC. Expansion of MT neurons excitatory receptive fields during covert attentive tracking. J Neurosci. 2011;31(43):15499–15510. doi: 10.1523/JNEUROSCI.2822-11.2011. [DOI] [PMC free article] [PubMed] [Google Scholar]
- 18.Oram MW. Visual stimulation decorrelates neuronal activity. J Neurophysiol. 2011;105(2):942–957. doi: 10.1152/jn.00711.2009. [DOI] [PubMed] [Google Scholar]
- 19.Gutnisky DA, Dragoi V. Adaptive coding of visual information in neural populations. Nature. 2008;452(7184):220–224. doi: 10.1038/nature06563. [DOI] [PubMed] [Google Scholar]
- 20.Gu Y, et al. Perceptual learning reduces interneuronal correlations in macaque visual cortex. Neuron. 2011;71(4):750–761. doi: 10.1016/j.neuron.2011.06.015. [DOI] [PMC free article] [PubMed] [Google Scholar]
- 21.Mitchell JF, Sundberg KA, Reynolds JH. Spatial attention decorrelates intrinsic activity fluctuations in macaque area V4. Neuron. 2009;63(6):879–888. doi: 10.1016/j.neuron.2009.09.013. [DOI] [PMC free article] [PubMed] [Google Scholar]
- 22.Ecker AS, Berens P, Tolias AS, Bethge M. The effect of noise correlations in populations of diversely tuned neurons. J Neurosci. 2011;31(40):14272–14283. doi: 10.1523/JNEUROSCI.2539-11.2011. [DOI] [PMC free article] [PubMed] [Google Scholar]
- 23.Ben-Yishai R, Bar-Or RL, Sompolinsky H. Theory of orientation tuning in visual cortex. Proc Natl Acad Sci USA. 1995;92(9):3844–3848. doi: 10.1073/pnas.92.9.3844. [DOI] [PMC free article] [PubMed] [Google Scholar]
- 24.Hasegawa H. Dynamical mean-field theory of spiking neuron ensembles: Response to a single spike with independent noises. Phys Rev E Stat Nonlin Soft Matter Phys. 2003;67(4 Pt 1):041903. doi: 10.1103/PhysRevE.67.041903. [DOI] [PubMed] [Google Scholar]
- 25.Hasegawa H. Population rate codes carried by mean, fluctuation and synchrony of neuronal firings. Physica A. 2009;388(4):499–513. [Google Scholar]
- 26.Deco G, Martí D. Extended method of moments for deterministic analysis of stochastic multistable neurodynamical systems. Phys Rev E Stat Nonlin Soft Matter Phys. 2007;75(3 Pt 1):031913. doi: 10.1103/PhysRevE.75.031913. [DOI] [PubMed] [Google Scholar]
- 27.Eriksson D, Valentiniene S, Papaioannou S. Relating information, encoding and adaptation: Decoding the population firing rate in visual areas 17/18 in response to a stimulus transition. PLoS ONE. 2010;5(4):e10327. doi: 10.1371/journal.pone.0010327. [DOI] [PMC free article] [PubMed] [Google Scholar]
- 28.Roland PE. Six principles of visual cortical dynamics. Front Syst Neurosci. 2010;4:28. doi: 10.3389/fnsys.2010.00028. [DOI] [PMC free article] [PubMed] [Google Scholar]
- 29.Abbott LF, Dayan P. The effect of correlated variability on the accuracy of a population code. Neural Comput. 1999;11(1):91–101. doi: 10.1162/089976699300016827. [DOI] [PubMed] [Google Scholar]
- 30.de la Rocha J, Doiron B, Shea-Brown E, Josić K, Reyes A. Correlation between neural spike trains increases with firing rate. Nature. 2007;448(7155):802–806. doi: 10.1038/nature06028. [DOI] [PubMed] [Google Scholar]
- 31.Britten KH, Shadlen MN, Newsome WT, Movshon JA. Responses of neurons in macaque MT to stochastic motion signals. Vis Neurosci. 1993;10(6):1157–1169. doi: 10.1017/s0952523800010269. [DOI] [PubMed] [Google Scholar]
- 32.Buracas GT, Zador AM, DeWeese MR, Albright TD. Efficient discrimination of temporal patterns by motion-sensitive neurons in primate visual cortex. Neuron. 1998;20(5):959–969. doi: 10.1016/s0896-6273(00)80477-8. [DOI] [PubMed] [Google Scholar]
- 33.Snowden RJ, Treue S, Andersen RA. The response of neurons in areas V1 and MT of the alert rhesus monkey to moving random dot patterns. Exp Brain Res. 1992;88(2):389–400. doi: 10.1007/BF02259114. [DOI] [PubMed] [Google Scholar]
- 34.Uka T, DeAngelis GC. Contribution of middle temporal area to coarse depth discrimination: Comparison of neuronal and psychophysical sensitivity. J Neurosci. 2003;23(8):3515–3530. doi: 10.1523/JNEUROSCI.23-08-03515.2003. [DOI] [PMC free article] [PubMed] [Google Scholar]
- 35.Gur M, Snodderly DM. High response reliability of neurons in primary visual cortex (V1) of alert, trained monkeys. Cereb Cortex. 2006;16(6):888–895. doi: 10.1093/cercor/bhj032. [DOI] [PubMed] [Google Scholar]
- 36.Brunel N, Wang XJ. Effects of neuromodulation in a cortical network model of object working memory dominated by recurrent inhibition. J Comput Neurosci. 2001;11(1):63–85. doi: 10.1023/a:1011204814320. [DOI] [PubMed] [Google Scholar]
- 37.Okun M, Lampl I. Instantaneous correlation of excitation and inhibition during ongoing and sensory-evoked activities. Nat Neurosci. 2008;11(5):535–537. doi: 10.1038/nn.2105. [DOI] [PubMed] [Google Scholar]
- 38.Heiss JE, Katz Y, Ganmor E, Lampl I. Shift in the balance between excitation and inhibition during sensory adaptation of S1 neurons. J Neurosci. 2008;28(49):13320–13330. doi: 10.1523/JNEUROSCI.2646-08.2008. [DOI] [PMC free article] [PubMed] [Google Scholar]
- 39.MacLean JN, Watson BO, Aaron GB, Yuste R. Internal dynamics determine the cortical response to thalamic stimulation. Neuron. 2005;48(5):811–823. doi: 10.1016/j.neuron.2005.09.035. [DOI] [PubMed] [Google Scholar]
- 40.Mochol G, Wójcik DK, Wypych M, Wróbel A, Waleszczyk WJ. Variability of visual responses of superior colliculus neurons depends on stimulus velocity. J Neurosci. 2010;30(9):3199–3209. doi: 10.1523/JNEUROSCI.3250-09.2010. [DOI] [PMC free article] [PubMed] [Google Scholar]
- 41.Kara P, Reinagel P, Reid RC. Low response variability in simultaneously recorded retinal, thalamic, and cortical neurons. Neuron. 2000;27(3):635–646. doi: 10.1016/s0896-6273(00)00072-6. [DOI] [PubMed] [Google Scholar]
- 42.Huang X, Lisberger SG. Noise correlations in cortical area MT and their potential impact on trial-by-trial variation in the direction and speed of smooth-pursuit eye movements. J Neurophysiol. 2009;101(6):3012–3030. doi: 10.1152/jn.00010.2009. [DOI] [PMC free article] [PubMed] [Google Scholar]
- 43.Maynard EM, et al. Neuronal interactions improve cortical population coding of movement direction. J Neurosci. 1999;19(18):8083–8093. doi: 10.1523/JNEUROSCI.19-18-08083.1999. [DOI] [PMC free article] [PubMed] [Google Scholar]
- 44.Seriès P, Latham PE, Pouget A. Tuning curve sharpening for orientation selectivity: Coding efficiency and the impact of correlations. Nat Neurosci. 2004;7(10):1129–1135. doi: 10.1038/nn1321. [DOI] [PubMed] [Google Scholar]
- 45.Shamir M, Sompolinsky H. Nonlinear population codes. Neural Comput. 2004;16(6):1105–1136. doi: 10.1162/089976604773717559. [DOI] [PubMed] [Google Scholar]
- 46.Tsodyks M, Kenet T, Grinvald A, Arieli A. Linking spontaneous activity of single cortical neurons and the underlying functional architecture. Science. 1999;286(5446):1943–1946. doi: 10.1126/science.286.5446.1943. [DOI] [PubMed] [Google Scholar]
- 47.Ringach DL. Neuroscience: States of mind. Nature. 2003;425(6961):912–913. doi: 10.1038/425912a. [DOI] [PubMed] [Google Scholar]
- 48.Blumenfeld B, Bibitchkov D, Tsodyks M. Neural network model of the primary visual cortex: From functional architecture to lateral connectivity and back. J Comput Neurosci. 2006;20(2):219–241. doi: 10.1007/s10827-006-6307-y. [DOI] [PMC free article] [PubMed] [Google Scholar]
- 49.Goldberg JA, Rokni U, Sompolinsky H. Patterns of ongoing activity and the functional architecture of the primary visual cortex. Neuron. 2004;42(3):489–500. doi: 10.1016/s0896-6273(04)00197-7. [DOI] [PubMed] [Google Scholar]
- 50.Murphy BK, Miller KD. Balanced amplification: A new mechanism of selective amplification of neural activity patterns. Neuron. 2009;61(4):635–648. doi: 10.1016/j.neuron.2009.02.005. [DOI] [PMC free article] [PubMed] [Google Scholar]
- 51.Deco G, Hugues E. Neural network mechanisms underlying stimulus driven variability reduction. PLOS Comput Biol. 2012;8(3):e1002395. doi: 10.1371/journal.pcbi.1002395. [DOI] [PMC free article] [PubMed] [Google Scholar]
- 52.Deco G, Jirsa VK. Ongoing cortical activity at rest: Criticality, multistability, and ghost attractors. J Neurosci. 2012;32(10):3366–3375. doi: 10.1523/JNEUROSCI.2523-11.2012. [DOI] [PMC free article] [PubMed] [Google Scholar]
- 53.Thiele A, Stoner G. Neuronal synchrony does not correlate with motion coherence in cortical area MT. Nature. 2003;421(6921):366–370. doi: 10.1038/nature01285. [DOI] [PubMed] [Google Scholar]
Associated Data
This section collects any data citations, data availability statements, or supplementary materials included in this article.