

Abstract
A theory of the unzipping of double-stranded DNA is presented and is compared to recent micromanipulation experiments. It is shown that the interactions that stabilize the double helix and the elastic rigidity of single strands simply determine the sequence-dependent ≈12-pN force threshold for DNA strand separation. Using a semimicroscopic model of the binding between nucleotide strands, we show that the greater rigidity of the strands when formed into double-stranded DNA, relative to that of isolated strands, gives rise to a potential barrier to unzipping. The effects of this barrier are derived analytically. The force to keep the extremities of the molecule at a fixed distance, the kinetic rates for strand unpairing at fixed applied force, and the rupture force as a function of loading rate are calculated. The dependence of the kinetics and of the rupture force on molecule length is also analyzed.
In cells, proteins apply forces to unzip and stretch DNA. These forces can be studied in single-molecule experiments (Fig. 1) (1–8) and are of biophysical as well as biological interest. Our focus here is primarily on unzipping experiments where forces are applied across the double helix to adjacent 5′ and 3′ strands (Fig. 1A) (1, 5, 9–11). In experiments, the control parameters may be the force f itself, the distance between the last base pairs 2r, or the rate of force increase or “loading rate” (Fig. 1B). We discuss the results expected in all these situations.
Figure 1.

Sketches of some experiments referred to in the text. All experiments are at room temperature and in physiological liquid buffers (PBS or Tris). Arrows symbolize the applied forces. (A) Unzipping experiment of Essevaz-Roulet et al. (1, 2): the 3′–5′ extremities of a λ-phage DNA (49 kbp) are attached to a glass microscope slide (with translational velocity v = 40 nm/sec) and a polystyrene bead connected to a glass microneedle (with stiffness k = 1.7 pN/μm). The loading rate equals λ = kv = 0.06 pN/sec. When the force approaches 12 pN, the DNA starts to open. As unzipping proceeds, the distance between the two single-strand extremities is controlled, and the force varies between 10 and 15 pN depending on the sequence. (B) Parameters used in the theoretical description: force f, torque Γ, and distance 2r between the two single-strand extremities. (C) Stretching experiment of Strunz et al. (6): a short ssDNA (10, 20, or 30 bp, with about 60% GC content) is attached by one 5′-end to a surface, and the complementary ssDNA is attached by the other 5′-end to an AFM tip. On approach of the surface to the tip, a duplex may form that is loaded on retract until unbinding occurs. The distribution of the rupture forces is obtained for loading rates ranging from 16 to 4,000 pN/sec. (D) Stretching and unzipping experiment of Rief et al. (5): DNA of poly(dA-dT) (5,100 bp) or poly(dG-dC) (1,260 bp) are attached between a gold surface and an AFM tip and stretched. Through a melting transition, single DNA strands are prepared; these strands on relaxation reanneal into hairpins as a result of their self-complementary sequences. The forces of unzipping of these hairpins are 20 ± 3 pN for poly(dG-dC) and 9 ± 3 pN for poly(dA-dT). (E) Dissociation experiment of Bonnet et al. (8): The rate of unzipping, ν_, and closing, ν+, of a 5-bp DNA hairpin (CCCAA-TTGGG) is investigated by fluorescence energy transfer and correlation spectroscopy techniques. The hairpin is closed by a loop of 12–21 thymine (T) or adenine (A). The characteristic time of opening t_ = 1/ν_ is found to be largely independent of the loop length and equal to t_ ≃ 0.5 msec.
We first use a thermodynamical equilibrium approach to show that the sequence-dependent force associated with unzipping of large DNAs, fu ≃ 12 pN, can be simply deduced from the known free energy of DNA denaturation and the elasticity of single-stranded (ss)DNA. The unzipping experiments of Essevaz-Roulet et al. (Fig. 1A) (1, 2) and Rief et al. (Fig. 1D) (5) are accurately described at this macroscopic level.
Other experimentally observable aspects of unzipping can be investigated only by using a more detailed description of base-pairing interactions. We therefore present a semimicroscopic model that accounts for hydrogen bonds and stacking interactions (12–16). We show that a free-energy potential barrier originates from the greater range of conformational fluctuation of DNA strands when isolated, relative to when they are bound together to form double-stranded (ds)DNA (Fig. 2). Our model can be investigated in detail and allows precise calculation of the effects of this barrier for the initiation of unzipping and the kinetics of strand dissociation.
Figure 2.

Base-pair potentials in unit of kBT as a function of the base radius r (in angstroms), without (Inset) and with (main picture) entropic contributions. (Inset) Morse potential U(r) accounting for the hydrogen bond interaction. Main picture: total potential V(r) for zero torque. When entropic contributions are considered, small r values are less favorable, and a barrier appears. The free-energy gdsDNA = g0 of the dsDNA is lower than the single-strand free-energy gssDNA = 0. Note the difference of scales on the horizontal axis between the two figures.
We compute the force necessary to keep apart the two extremities of the DNA molecules at some distance 2r as well as the shape of the opening fork (Fig. 3). Because of the potential barrier, this force is much larger at small r (and can reach some hundreds of piconewtons) than the asymptotic value fu at large r. Analysis of unzipping in thermal equilibrium at the high level of precision possible in atomic force microscopy (AFM) experiments would allow unambiguous verification of this predicted force barrier.
Figure 3.

Force f(r) (in piconewtons) to be exerted on the DNA to keep extremities at a distance 2r apart (in angstroms). The peak force f ≃ 270 pN, reached at r ≃ 10.5 Å, is much larger than the asymptotic value ≃ 12 pN, equal to the equilibrium force fu (at zero torque, and in the Gaussian approximation) for unzipping a large portion of the molecule. (Inset): phase diagram, in the plane of torque Γ (kBT) and of force f (piconewtons). The lines shows the critical unzipping force fu as a function of Γ with formula 2 (full line) and formula 3 (dashed line) for the stretching free energy of the single strand. Below the line, dsDNA is the stable thermodynamical configuration, whereas for forces larger than fu(Γ), denaturation takes place. fu vanishes at the critical torque Γu ≃ −2.4 kBT and is equal to 11 pN (full line) and 12 pN (dashed line) at zero torque.
The barrier makes strand dissociation an activated process with dynamics that can be analyzed by using nucleation theory (17). Unzipping starts with a transition “bubble” a few (≃4) bases long (Fig. 4). We calculate the free energy of this bubble and determine how the dissociation rate depends on applied force and molecule length (Fig. 5). Results are compared to the experiments of Bonnet et al. (8) and of Pörschke (18).
Figure 4.

Transition states involved in the theoretical calculation of the kinetic rates. (A) Unzipping: opening of dsDNA is favorable at forces f > fu, and the unzipping rate ν_ is calculated directly. The nucleation bubble is of (≃4) base pairs, weakly depending on the force. (B) Annealing: when f < fu, dsDNA is thermodynamically stable; the dissociation rate ν_ is obtained indirectly through the calculation of the annealing rate ν+ of the metastable ssDNA, ν = ν+e−NΔg(f)/kBT, where Δg(f) > 0 is the excess of free energy per base pair of ssDNA with respect to dsDNA. The nucleation bubble is of (≃4) base pairs.
Figure 5.

Time of dissociation t_ (in sec) as a function of the force f (in piconewtons). Three regimes can be distinguished. For f < fu = 12 pN, the dissociation times depend on the length N of the sequence (N = 10, 20, 30 bp from Lower to Upper). For fu < f < fb = 230 pN, the dissociation time is length independent and decreases as the energetic barrier to overcome lowers. For f > fb, no barrier is left, and dissociation is immediate. The slope of the logarithm of t_ near fu is d log t_/df = −8 Å (f > fu), −2duN + 31 Å with du = 5 Å (f < fu). (Inset) Time of thermal dissociation t_ (for zero force) as a function of the number of base pairs N.
Extending Evans and Ritchie's theory for the breaking of single bonds (19) to the case of a one-dimensional polymer (20), we then calculate the most probable rupture force when the DNA molecule is subjected to a force that increases at a constant “loading rate” (Fig. 6). The dependence of the rupture force on loading rate and molecular length could be quantitatively tested by AFM unzipping experiments; these results also shed light on the AFM DNA-stretching experiments of Strunz et al. (6) and of Rief et al. (5).
Figure 6.

Rupture force (piconewtons) as a function of the loading rate λ (piconewtons/sec) for five different molecule lengths N = 10, 20, 30, 50, and 100. Arrows indicate the different critical loading rates for N = 10. Below λ1 (=100.8 for N = 10), rupture occurs at essentially zero force through thermal dissociation. For loading rates ranging from λ1 to λ2 (=104.6 for N = 10), the rupture force is finite, and thermal tunneling is responsible for the strong dependence on N, until the force reaches the equilibrium value fu = 12 pN. For larger loading rates, the rupture force is length independent. It increases again as λ > λ3 = 105.5 pN/sec, because the molecule is unable to respond to the force before it becomes very large.
Thermodynamic Description of Unzipping
An unstressed double helix is stabilized against spontaneously dissociating into its two strands by the interaction free energy per base pair, which from a thermodynamic perspective we may take to be some average amount g0. Although it is dependent on sequence, we may consider g0 = −1.4 kBT, the value determined from single-molecule experiments on an AT-rich sequence in λ phage (7), as a reference for the free-energy difference between dsDNA and separated ssDNAs. Our emphasis is on an understanding of the free-energy balance in unzipping rather than on studying inhomogeneous sequence effects (9, 10).
In the presence of applied torque Γ and unzipping force f (Fig. 1B), the free-energy difference per base pair between unzipped and base-paired DNA strands is
 |
1 |
When Δg < 0, opening is thermodynamically favorable. The last two terms represent mechanical work done per base pair unzipping the double helix. In order, they are the work done by the torque (θ0 = 2π/10.5 is simply the change in strand winding angle during conversion of dsDNA to separated strands) and the stretching free energy of the unzipped single strands.
The function gs(f) in Eq. 1 is the ssDNA-stretching free energy per base at fixed force. The leading factor of 2 simply reflects the fact that two bases of ssDNA are created for each base pair of dsDNA that is unzipped. The ssDNA elastic behavior is complicated by nucleotide-interaction effects (21), but experimental force-extension curves for λ phage ssDNA in 150 mM Na+ are well described by a freely jointed chain-like (FJCL) elastic response for forces >1 pN, with Kuhn length d = 15 Å (5, 22, 23). The corresponding free energy for forces up to ≈20 pN is
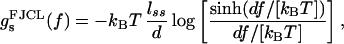 |
2 |
where the contour length per base pair is lss = 27 μm/48.5 kb ≃ 5.6 Å.
At zero applied force, gs(0) = 0, thus ssDNA is stable when Γ < Γu = g0/θ0 = −2.4 kBT, in good agreement with an experimental estimate of the twisting torque needed to denature an AT-rich sequence in a λ phage DNA (7) (the sign indicates a left-handed dsDNA-unwinding torque). In this case, the work done by the torque during opening is simply −g0 = 1.4 kBT per base pair.
In the opposite case, where torque is zero (i.e., for dsDNA with no constraint of its strand-linking number), the critical unzipping force [at which Δg(f) = 0] is f = 11 pN. These results are in good agreement with the midrange of unzipping forces encountered with experiments on inhomogeneous-sequence DNAs by Essevaz-Roulet et al. (Fig. 1A): 12-pN threshold to start, then 10–15 pN during unzipping λ DNA (1, 2). Data of Rief et al. [Fig. 1D; 20 ± 3 pN for poly(dG-dC), 9 ± 3 pN for poly(dA-dT) (5)] gives, via Eq. 1, denaturation free energies of 1.1 and 3.5 kBT per AT and GC base pair, respectively, in good agreement with thermodynamical data (25). Finally, the projected length of one ssDNA nucleotide along the force direction at the unzipping transition is given as d
 ≃ 4 Å. Bockelman et al. used a similar theory to analyze unzipping force dependence on sequence (1, 2).
Fig. 3 Inset shows the curve in the torque-force plane on which Δg = 0, which is the “phase boundary” separating dsDNA and unzipped ssDNAs. This boundary is predicted to have the shape fu ∝ (Γ − Γu)1/2 for small fu.
For forces up to 15 pN, Eq. 2 is approximated to 0.15 kBT accuracy by the simple quadratic form
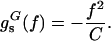 |
3 |
where the ssDNA effective elastic constant is C = 0.12 kBT/Å2. Using this form allows analytical solution for the unzipping force, f = (C|g0|/2)1/2 = 12 pN (10, 11, 20); at this force, the projection of ssDNA monomer length along the force direction is d
 = (2|g0|/C)1/2 ≃ 5 Å. This quadratic approximation is quantitatively nearly equivalent to the nonlinear model (Eq. 2) at forces up to ≈15 pN (e.g., note the accord between the torque-force “phase boundaries” in Fig. 3 Inset); this will be key to the continuum theory below.
Semimicroscopic Model of Strand Binding
Features at the nucleotide scale relevant to the onset of unzipping are ignored in models like Eq. 1. We therefore move to a model that uses the distances 2r(n) between corresponding nth base pairs of the two strands as degrees of freedom. The energy of the DNA strands is:
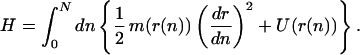 |
4 |
This model is similar to models previously used to describe thermal denaturation (13, 14). The precise form of Eq. 4 follows from our previously developed model for denaturation by torque (15,‖ 16) by integration over angular degrees of freedom, followed by continuum limit for the base index n.
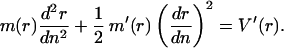
The first term in Eq. 4 describes interactions between neighboring bases along each strand and must depend strongly on the interbase half-distance r(n), because conformational fluctuations of the strands are highly quenched inside the double helix, relative to those along ssDNA. The strand rigidity is m(r) = Ee−b(r−R0) + C, where R0 = 10 Å is the double helix radius, and where 1/b = 0.6 Å is the separation at which the strand rigidity changes from its double-helix value E + C to the much smaller ssDNA value C. We use the value C = 0.12 kBT/Å2 from the previous section. The rigidity of the strands inside the double helix has been determined from Raman measurements of internal vibrations of dsDNA to be E = 58 kBT/Å2 (16, 26).
The second term in Eq. 4 is a potential, acting between the two strands, made up of the hydrogen-bonding energy between corresponding bases plus a torque energy: U(r) = UH(r) − ΓR1/r, where R1 = 6 Å (15). We use the Morse potential form (27) for the hydrogen-bonding interaction (12, 13): UH(r) = D[(e−a(r−R) − 1)2 − 1], with D = 5.84 kBT and a = 6.3 Å−1 (Fig. 2 Inset).
In thermal equilibrium, strand unpairing is described by the partition function Z = ∫ 𝒟r(n) e−H/kBT. Z can be computed by use of a continuum transfer matrix technique along the n coordinate, leading to a Schrödinger-like equation:
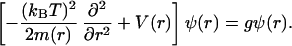 |
5 |
The free-energy potential V(r) = U(r) + (kBT/2)ln[m(r)/m(∞)] includes an entropic contribution caused by the decrease in the rigidity m(r) with strand unbinding. This entropic potential (Fig. 2) arises when going from the path integral to the Schrödinger equation (24) with nonconstant mass (14), and here it generates a large force barrier to the initiation of unzipping, which strongly affects the kinetics of strand separation.
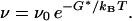
The lowest eigenvalue g0 is the equilibrium free energy, and the corresponding ψ0(r) describes thermal fluctuations of distance between the two strands. For g ≥ 0, the eigenvalue spectrum becomes continuous, corresponding to the appearance of completely separated ssDNAs at g = 0. When DNA is the thermodynamical favorable state, g0 < 0 represents the free energy per base pair of a long dsDNA, relative to separated ssDNAs. The fluctuations of r are confined to the Morse well, so g0 is well approximated if we take V(r) = V(R0) + UH(r) − UH(R0) and m(r) = m(R0), for which Eq. 5 is exactly soluble (27). Inside the well, ψ0(r) is the Morse ground state (27); outside the well, it can be computed by using the Wentzel, Kramers, Brillouin approximation (28). By using the parameters listed above, and at zero torque, the lowest eigenvalue is g0 = −1.4 kBT, in accord with the corresponding number assumed in the previous section. Application of an unwinding torque gradually increases g0 until at Γu = −2.4 kBT, it becomes zero and the DNA unwinds, exactly as occurs in the thermodynamic model of the previous section (Fig. 3 Inset).
Force Required to Hold ssDNA Ends at a Given Distance.
This situation can be analyzed simply in terms of ψ0(r), without further computation. This is because, for a semi-infinite dsDNA, the function ψ0(r) corresponding to g0 is the probability distribution for the two ssDNA ends to fluctuate a distance 2r apart. Therefore, the free energy associated with a fluctuation that separates the two ssDNA ends by a distance 2r (or equivalently the total work done separating the two ends to a distance 2r) is
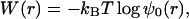 |
6 |
up to an additive constant that is unimportant for our analysis. Note that, neglecting surface interactions, this is half the free energy associated to separate a distance 2r in the middle of a long dsDNA, because an interior “bubble” is made of two “forks.”
The unzipping force that must be supplied to hold the two ssDNA ends a distance 2r (Fig. 1B) apart is thus just the derivative of Eq. 6, f(r) = dW(r)/d(2r). This is in Fig. 3, which displays a large force barrier of ≈270 pN as the strands are forced apart. The barrier peak occurs for a half-separation r − R0 = 0.5 Å and then decays to the long-molecule unzipping force fu ≃ 12 pN by r − R0 ≈ 4 Å. At large distances, the work done per base pair by unzipping is 2fudu ≃ 3 kBT, twice as much as the denaturation −g0 free energy; this is because the force must unzip the DNA and extend the highly flexible ssDNAs. The peak force is large compared to the fluctuations in force associated with sequence (1, 2). The force barrier will not be observable in large-scale unzipping experiments (1, 2) but should be observable in AFM studies. A stiff cantilever with roughly 0.1 Å thermal noise should be used to measure the force barrier as a function of essentially fixed opening distance.
In this fixed-distance experiment, one might also measure the shape of the opening “fork” by determining the relation between opening distance and base position, n(r) (Fig. 1B). The most probable configuration n(r) satisfies the equation of motion associated with Eq. 5, which expresses force balance along the chain,
 |
7 |
We integrate Eq. 7 to obtain r(n), the shape of the opening “fork.” Starting from the opening point where r = R0 and dr/dn = 0, n(r) = 2[E(r − R0)/V′(R0)]1/2. Far from the opening point, n(r) = r/d ≃ r/(5 Å) (11).
Unzipping Kinetics at Fixed Force.
Many experiments on short (10- to 100-bp) dsDNAs (refs. 4, 6, 8, 18 and caption of Fig. 1) probe the kinetics of strand separation. The equilibrium results discussed above are a starting point for a kinetic theory of unzipping based on nucleation theory (17). The Schrödinger equation (Eq. 5) with the fluctuation-corrected potential V(r) describes dsDNA and ssDNA as locally stable molecular states. The general problem faced in unzipping kinetics is the transition from an initially metastable state (dsDNA or ssDNA, depending on the force; see below) to a final stable (lower-free-energy) state. Strand dissociation requires the whole polymer chain to cross the free-energy potential barrier of V(r) (Fig. 2), which makes the transition rate strongly length and force dependent. Using the effective potential V(r) (including the entropic barrier) corresponds to averaging over microscopic fluctuations of individual bases, restricting us to consider unzipping rates slow compared to those of these microscopic fluctuations (the experimentally relevant regime).
The transition rate (equivalently the inverse lifetime) has the form familiar from transition-state theory (17):
 |
8 |
It requires the activation free energy G* of a transition state, relative to the initial metastable state. The transition state is the saddle-point configuration of the free energy, with one unstable direction leading monotonically down to the initial and final states, and is the dominant transition pathway (17).
Our transition states are just the partially unzipped configurations r*(n) determined from Eq. 7 for force-dependent boundary conditions consistent with the initial (ri) and final (rf) states. The activation free energy is
 |
9 |
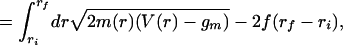 |
i.e., the free energy associated with Eq. 7 minus the free energy of the metastable state (Gm = Ngm) from which the transitions occur. G* is in practice the free energy of the few-base-pair “bubble” portion of the transition state, which separates the unzipped and double-stranded regions.
Finally, the rate prefactor ν0 is the linear growth rate of unstable perturbations around the saddle-point configuration (17). We assume viscous dynamics with a friction coefficient per base ζ = 6πηR0 [water viscosity η = 1 × 10⁻³ kg/(m⋅sec)]. From a detailed calculation, we find ν0 ≈ Da2/(4ζ) = 1 × 10¹² sec−1, essentially the ratio of the negative curvature of the Morse potential near the top of the well, to the friction coefficient. We now describe how to compute the dissociation rate and the nucleation bubble shape (i.e., boundary condition ri, rf), depending on the unzipping force.
Kinetics of Unzipping Where ssDNA Is Stable (f > fu).
If a steady force is applied that is slightly bigger than the equilibrium unzipping threshold fu, then the initial dsDNA is metastable relative to separated strands: Δg(f) = −g0 − 2f2/C < 0 (Eq. 1), and formula (Eq. 8) is directly applicable (Fig. 4A) to calculation of the dissociation rate ν_. The free energy of the initial metastable state is gm = g0. The transition state in this case is a short ssDNA “nucleus” of n* bases at the open end (n = 0) of the dsDNA, with boundary conditions at the ends of fixed force f [dr/dn = 2f/m[r(n)]] and free energy equal to the metastable dsDNA value [V(r(n)) − 2f2/m[r(n)] = g0]. This determines ri = r(n*) and rf = r(0).
The size of the nucleation “bubble” depends weakly on the force and is n*(f) ≃ 4 bases, independent of the overall DNA molecule length. Therefore, the dissociation time t_ = 1/ν_ (Fig. 5) is length-independent for forces above fu = 12 pN. The decrease in dissociation time with forces > fu is because of reduction of G* by the applied force. Beyond fb ≃ 230 pN, the barrier in V(r) is completely overcome, and unzipping is immediate (t_ = 1/ν0). Our computation addresses only the initial unzipping barrier-crossing event and does not include the time necessary to push the fork down the dsDNA, which would introduce a weak molecular-length dependence for forces > fu in Fig. 5. Fork motion near fu may also be retarded by additional barriers introduced by inhomogeneous sequence.
Kinetics of Unzipping Where ssDNA Is Metastable (f < fu).
Below the equilibrium unzipping force threshold, an infinitely long molecule is stable as a dsDNA. However, relatively short (<20 bp) oligomers have a finite strand-dissociation time that can be accelerated by applied force. Here the final ssDNA state is metastable (although with a possibly long lifetime) relative to the initial dsDNA state. Therefore our calculation scheme applies not to unzipping (off-rate ν_) but instead to annealing of ssDNAs (on-rate ν+, Fig. 4B). We compute the off-rate from the on-rate, using the equilibrium condition ν_/ν+ = e−NΔg(f)/KBT, where N is the number of base pairs in the molecule, and where Δg(f) is the force-dependent free-energy difference per base pair between the paired and unpaired states.
The calculation of the on-rate requires computation of a saddle-point configuration with a nucleation bubble of dsDNA at the end of ssDNAs to which the force is applied (Fig. 4B). The relevant boundary conditions are analogous to those above, apart from the requirement that the ssDNAs be in close proximity but not base-paired (i.e., slightly outside the potential barrier of Fig. 2), and the free energy of the metastable initial state equals gm = 2gs(f) = −2f2/C. The dsDNA nucleation “bubble” remains near 4 bp as the force f decreases from fu to zero, leading to an essentially N-independent on-rate ν+ (again the time necessary for the actual “zipping up” is not included). Then, the N dependence from the energy difference of paired and unpaired DNA results in a strong molecular-length dependence of ν_, as shown in Fig. 5 for forces less than fu.
At zero force, this becomes a calculation of dissociation time for free dsDNAs in solution with result t_ = 100.6N−6.3 sec. Fig. 5 Inset shows this as a function of dsDNA length; a 10-bp dsDNA has a lifetime of roughly 1 sec; the exponential length dependence results in a 30-bp DNA being stable for ≈1012 sec ≈ 30,000 yr. Our estimate of t_ for N = 5, t_ ≈ 0.3 msec, is in agreement with the results of Bonnet et al. (8) (Fig. 1E). The prediction for the nucleation bubble size, n* = 4, is close to the value n* = 3 measured by Pörschke for a poly(A)poly(U) acid (18).
Rupture of dsDNA During Gradual Loading.
The previous two sections discuss fixed-force experiments; an alternate experiment is to steadily increase force (f = λt, where λ is the “loading rate” in piconewtons/sec), and then to measure the force at which rupture occurs. Generally, rapid loading rates result in rupture at large forces. We are able to predict the most probable rupture force versus loading rate and molecular length, and our results display a rich range of possibilities (Fig. 6).
Using the calculations of off-rates presented above, the probability distribution for rupture with force is (19)
 |
10 |
For a number of molecular lengths, Fig. 6 shows the location of the peak of this distribution, the most probable rupture force that would be measured experimentally. For sufficiently slow loading rate, rupture occurs at zero force simply by thermal dissociation; for molecules >20-bp thermal dissociation is practically unobservable.
At some loading rate λ1, the peak in P(f) jumps to finite force and then increases, with each length of molecule following a different curve. In this regime, the forces at rupture are typically below the equilibrium unzipping threshold fu, because there is time for many thermal attempts at barrier crossing to the metastable ssDNA state during loading. The length dependence follows from the calculation of formation of metastable ssDNA discussed above and has been qualitatively observed for 5′–5′ pulling experiments (Fig. 1C) (6).
At a higher loading rate λ2, the peak of the rupture force distribution hits fu, which remains the most likely rupture force up to a loading rate λ3. For λ > λ2, dissociation is occurring at forces large enough that the ssDNA final state is stable, resulting in no N-dependence. Finally, beyond the very large loading rate λ3 ≈ 105.5 pN/sec, the rupture force gradually increases simply because the molecule is unable to respond to the force before it becomes very large. λ3 separates equilibrium and nonequilibrium time scales for very long sequences (N → ∞): the rupture force is independent of the loading rate and equal to fu when λ < λ3 and increases above.
Our framework treats nonequilibrium rupture of a one-dimensional object, a development of previous theory (19) necessary for interpretation of unzipping experiments. In light of our detailed predictions, 3′–5′ AFM unzipping experiments (Fig. 1A) should yield interesting results and would be of help for an accurate determination of the free-energy potential V(r).
Acknowledgments
We thank C. Bouchiat, G. Bonnet, V. Croquette, and F. Pincet for useful discussions. Work at the University of Illinois at Chicago was supported by National Science Foundation (NSF) Grant DMR-9734178, by the Petroleum Research Foundation of the American Chemical Society, and by the Research Corporation. S.C. is partly funded by an A. della Riccia grant. R.M. is supported in part by the Materials Research Science and Engineering Center Program of the NSF under Award Number DMR-9808595.
Abbreviations
- ds
double-stranded
- ss
single-stranded
- AFM
atomic force microscopy
Footnotes
Note that in this previous version of ref. 15, the base-pair index is discrete. The passage to the continuum will be exposed in detail in a forthcoming work.
References
- 1.Essevaz-Roulet B, Bockelmann U, Heslot F. Proc Natl Acad Sci USA. 1997;94:11935–11940. doi: 10.1073/pnas.94.22.11935. [DOI] [PMC free article] [PubMed] [Google Scholar]
- 2.Bockelmann U, Essevaz-Roulet B, Heslot F. Phys Rev E. 1998;58:2386–2394. [Google Scholar]
- 3.Leger J F, Robert J, Bourdieu L, Chatenay D, Marko J F. Proc Natl Acad Sci USA. 1998;95:12295–12299. doi: 10.1073/pnas.95.21.12295. [DOI] [PMC free article] [PubMed] [Google Scholar]
- 4.Lee G U, Chrisey L A, Colton R J. Science. 1994;266:771–773. doi: 10.1126/science.7973628. [DOI] [PubMed] [Google Scholar]
- 5.Rief M, Clausen-Schaumann H, Gaub H E. Nat Struct Biol. 1999;6:346–349. doi: 10.1038/7582. [DOI] [PubMed] [Google Scholar]
- 6.Strunz T, Oroszlan K, Schäfer R, Güntherodt H J. Proc Natl Acad Sci USA. 1999;96:11277–11282. doi: 10.1073/pnas.96.20.11277. [DOI] [PMC free article] [PubMed] [Google Scholar]
- 7.Strick T R, Bensimon D, Croquette V. Genetica. 1999;106:57–62. doi: 10.1023/a:1003772626927. [DOI] [PubMed] [Google Scholar]
- 8.Bonnet G, Krichevsky O, Libchaber A. Proc Natl Acad Sci USA. 1998;95:8602–8606. doi: 10.1073/pnas.95.15.8602. [DOI] [PMC free article] [PubMed] [Google Scholar]
- 9.Thompson R E, Siggia E D. Europhys Lett. 1995;31:335–340. [Google Scholar]
- 10.Lubensky D K, Nelson D R. Phys Rev Lett. 2000;85:1572–1575. doi: 10.1103/PhysRevLett.85.1572. [DOI] [PubMed] [Google Scholar]
- 11.Bhattacharjee S M. J Phys A. 2000;33:L423–L428. [Google Scholar]
- 12.Prohofsky E. Statistical Mechanics and Stability of Macromolecules. Cambridge, U.K.: Cambridge Univ. Press; 1995. [Google Scholar]
- 13.Dauxois T, Peyrard M. Phys Rev E. 1995;51:4027–4040. doi: 10.1103/physreve.51.4027. [DOI] [PubMed] [Google Scholar]
- 14.Cule D, Hwa T. Phys Rev Lett. 1997;79:2375–2378. [Google Scholar]
- 15.Cocco S, Monasson R. Phys Rev Lett. 1999;83:5178–5181. [Google Scholar]
- 16.Cocco S, Monasson R. J Chem Phys. 2000;112:10017–10033. [Google Scholar]
- 17.Langer J S. Ann Phys (NY) 1969;34:258–275. [Google Scholar]
- 18.Pörschke D. J Mol Biol. 1971;62:361–381. doi: 10.1016/0022-2836(71)90433-5. [DOI] [PubMed] [Google Scholar]
- 19.Evans E, Ritchie K. Biophys J. 1997;72:1541–1555. doi: 10.1016/S0006-3495(97)78802-7. [DOI] [PMC free article] [PubMed] [Google Scholar]
- 20.Sebastian K L. Phys Rev E. 2000;62:1128–1132. doi: 10.1103/physreve.62.1128. [DOI] [PubMed] [Google Scholar]
- 21.Maier B, Bensimon D, Croquette V. Proc Natl Acad Sci USA. 2000;97:12002–12007. doi: 10.1073/pnas.97.22.12002. [DOI] [PMC free article] [PubMed] [Google Scholar]
- 22.Smith S B, Cui Y, Bustamante C. Science. 1996;271:795–799. doi: 10.1126/science.271.5250.795. [DOI] [PubMed] [Google Scholar]
- 23.Bustamante C, Smith S B, Liphardt J, Smith D. Curr Opin Struct Biol. 2000;10:279–285. doi: 10.1016/s0959-440x(00)00085-3. [DOI] [PubMed] [Google Scholar]
- 24.De Gennes P G. Scaling Concepts in Polymer Physics. Ithaca, NY: Cornell Univ. Press; 1985. [Google Scholar]
- 25.Breslauer K J, Frank R, Blocker H, Marky L A. Proc Natl Acad Sci USA. 1986;83:3746–3750. doi: 10.1073/pnas.83.11.3746. [DOI] [PMC free article] [PubMed] [Google Scholar]
- 26.Urabe H, Tominaga Y. J Phys Soc Japan. 1981;50:3543–3544. [Google Scholar]
- 27.Morse P M. Phys Rev. 1929;34:57–64. [Google Scholar]
- 28.Bohm D. Quantum Theory. New York: Prentice–Hall; 1951. [Google Scholar]