Abstract
Despite the numerous vital functions of proteins in the cytosolic compartment, less attention has been paid to the delivery of protein drugs to the cytosol than to the plasma membrane. To address this issue and effectively deliver charged proteins into the cytoplasm, we used endosomolytic, thiol-triggered degradable polyelectrolytes as carriers. The cationic, reducible polyelectrolyte RPC-bPEI0.8kDa2 was synthesized by the oxidative polymerization of thiolated branched polyethyleneimine (bPEI). The polymer was converted to the anionic, reducible polyelectrolyte RPA-bPEI0.8kDa2 by introducing carboxylic acids. The two reducible polyelectrolytes (RPC-bPEI0.8kDa2 and RPA-bPEI0.8kDa2) were complexed with counter-charged model proteins (bovine serum albumin (BSA) and lysozyme (LYZ)), forming polyelectrolyte/protein complexes of less than 200 nm in size at weight ratios (WR) of ≥ 1. The resultant complexes maintained a proton buffering capacity nearly equivalent to that of the polyelectrolytes in the absence of protein complexation and were cytocompatible with MCF7 human breast carcinoma cells. Under cytosol-mimicking thiol-rich conditions, RPC-bPEI0.8kDa2/BSA and RPA-bPEI0.8kDa2/LYZ complexes increased significantly in size and released the loaded protein, unlike the protein complexes with non-reducible polyelectrolytes (bPEI25kDa and bPEI25kDaCOOH). The polyelectrolyte/protein complexes showed similar cellular uptake to the corresponding proteins alone, but the former allowed more protein to escape into the cytosol from endolysosomes than the latter as a result of the endosomolytic function of the polyelectrolytes. In addition, the proteins in the polyelectrolyte/protein complexes kept their intrinsic secondary structures. In conclusion, the results show the potential of the designed endosomolytic, reducible polyelectrolytes for the delivery of proteins to the cytosol.
Keywords: Cytosolic delivery, Endosomolytic polymer, Polyelectrolyte, Polyethyleneimine, Protein delivery, Reducible polymer
INTRODUCTION
Proteins are the final product of the central dogma in biology1 and perform almost all of the biological functions in the body.2,3 Disorders or diseases often develop when proteins are mislocated and/or changes in concentration occur in extracellular environments,4,5 on the cell membrane,6 and/or in intracellular compartments. For example, in the cytoplasm, the levels of caspases and bcl-2 proteins, among others, are strongly associated with chemoresistance, cell viability, and apoptosis.7–10 Thus, delivery of proteins into the cell can remedy pathological problems.11
Exogenous proteins encounter various barriers to cytosolic delivery, including serum instability, membrane impermeability, endosomal sequestration, and protein discharge. In the blood or extracellular environment, proteins often possess short half-lives as a result of lysis by serum proteases.12 To improve the stability in serum, proteins can be chemically modified with biocompatible polymers, such as poly(ethylene glycol),13–16 or physically incorporated into various types of nanocarriers.17,18 However, the direct chemical modification of proteins often causes a decrease or heterogeneity in the therapeutic efficacy16 as a result of structural changes in the proteins15 and/or low site-specificity of the modifications.13,14
Although physical methods such as electroporation and microinjection assist delivery to the cytosol,19,20 most proteins are negatively charged in physiological environments, and their electrostatic repulsion prevents their permeation through cell membranes.21 Additionally, although positively charged proteins show some benefit in cellular internalization, some proteins, including cytochrome C17 and ribosome-inactivating proteins (e.g., gelonin, amaranthin, bouganin),22 lack membrane permeability.17,22 Thus, proteins frequently have been administered with lipid-based,18 peptide-based,19 inorganic,17 or polymeric23–26 nanocarriers to which they are coupled by direct conjugation, physical adsorption/interactions, or encapsulation.21 Liposomal protein carriers have an aqueous lumen into which proteins are physically loaded, but the efficacy of these carriers is compromised by a low protein loading capacity, shear force-induced protein denaturation during preparation processes, and allergic reactions.18 Cell penetrating peptides and amphiphatic peptides carry proteins by direct conjugation or physical interaction, respectively.19 However, peptide-based protein carriers are costly and often immunogenic, and they possess only a weak capacity to escape the endosome.19 Using inorganic materials (e.g., carbon nanotubes, quantum dots, mesoporous silica nanoparticles, gold nanoparticles, or magnetic nanoparticles), proteins can be chemically linked or physically adsorbed or trapped.21 Some inorganic protein carriers, however, have high intrinsic cytotoxicity, can be trapped in endosomes, or cannot be excreted from the body after delivering their cargo.17 Polymer-based protein carriers include nanogels,27 nanospheres,28 polymersomes29 (via physical entrapment), nanocomplexes,23,25,26,30–32 layer-by-layer nanostructures33 (via electrostatic attraction), nanocapsules24,34,35 (via in situ polymerization), and cationization agents36 (via chemical modification); they exhibit tailor-made chemical and physical characteristics and enhance the cellular internalization of the carried proteins.
Although polymeric protein carriers have garnered much attention, they still face physical barriers such as endosomal membranes and challenges such as protein release into cytosol. In general, after uptake by endocytotic pathways, protein carriers are located in the endosomal and lysosomal compartments. If certain chemical bonds in protein-loaded nanocarriers or polymer-protein conjugates (without endolysosomolytic functions) can be specifically degraded at endolysosomal pH29,30,33 or by endolysosomal enzymes,27 then the protein delivery systems can release the protein cargo into the endolysosomes. However, regardless of whether the protein is release into the endolysosomes, sequestered carriers and proteins are subject to degradation in this compartment because of the presence of lytic enzymes.37,38 Thus, the endosomolytic function of the carriers is an essential component. However, few protein carriers have proton buffering moieties such as imidazoles and secondary or tertiary amines23,26 to disrupt the endosomal membrane.
Once in the cytoplasm, a high-efficacy carrier should discharge its cargo for high efficacy. To this end, protein carrier systems are commonly equipped with disulfide bonds or specific peptide sequences that are cleaved at high concentrations of the reducing agent gluthathione23,26,33,34 or of endoprotease,35 both of which are present in the cytosol.
To address these two major issues (i.e., endosomal escape and protein discharge) in cytosolic protein delivery, we designed both cationic and anionic polyelectrolytes that can complex with counter-charged proteins, possess endosomolytic activity to facilitate the escape of the polyelectrolyte/protein complexes from the endolysosomal compartments, and feature cytosolspecific degradability for quick release of the proteins from the complexes. Thus, low molecular weight (LMW) branched polyethyleneimine (bPEI) was selected as an endosomolytic component because it has proton buffering activity, i.e., the so-called “proton sponge effect” at endolysosomal pH. LMW bPEI-based cationic reducible polyelectrolytes were prepared from LMW bPEI via thiolation and oxidative polymerization (as previously reported39) and can complex with anionic proteins. To aid complexation with cationic proteins, carboxylic acid groups were extended from the primary amine groups on the cationic reducible polyelectrolyte to yield the anionic reducible polyelectrolyte. The complexation, endosomolysis, protein release, and cytocompatibility were investigated to evaluate the potential of the two reducible polyelectrolytes for cytosolic protein delivery.
MATERIALS AND METHODS
Materials and cell culture
Bovine serum albumin (BSA), chicken egg white lysozyme (LYZ), bPEI0.8kDa (Mw 0.8 kDa, Mn 0.6 kDa), bPEI25kDa (Mw 25 kDa, Mn 10 kDa), 2-iminothiolane, l-cysteine hydrochloride monohydrate, 3-(4,5-dimethylthiazol-2-yl)-2,5-diphenyltetrazolium bromide (MTT), RPMI1640 medium, Ca2+-free and Mg2+-free Dulbecco’s phosphate buffered saline (DPBS), triethylamine (TEA), dimethyl sulfoxide (DMSO), 4-(2-hydroxy-ethyl)-1-piperazine (HEPES), D-glucose, sodium bicarbonate, insulin, dithiothreitol (DTT), succinic anhydride (SA), methanol, 2,4,6,-trinitrobenzene sulfonic acid (TNBSA), rhodamine B isothiocyanate (RITC), sodium dodecyl sulfate (SDS), fetal bovine serum (FBS), penicillin-streptomycin, trypsin-EDTA solution, Hoechst 33342, and paraformaldehyde (PFA) were purchased from Sigma-Aldrich Co. (St. Louis, MO, USA). LysoTracker® Green was purchased from Invitrogen, Inc. (Carlsbad, CA, USA).
MCF7 cells (a human breast adenocarcinoma cell line) were cultured in RPMI 1640 medium supplemented with D-glucose (2 g/L), insulin (4 mg/L), and 10% FBS under humidified air containing 5% CO2 at 37 °C.
Synthesis and characterization of the reducible polyelectrolytes
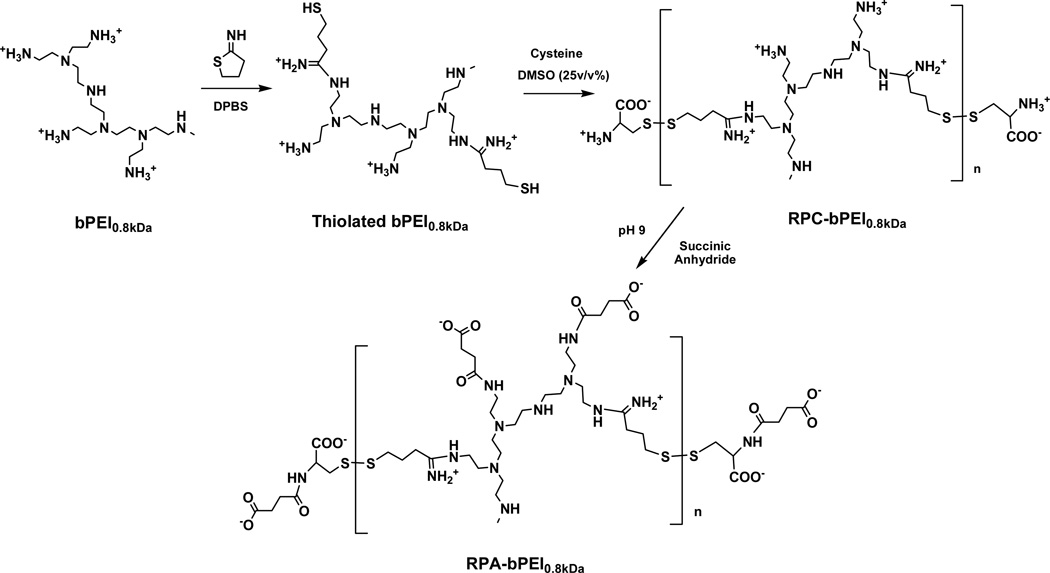
Via thiolation and oxidation, LMW bPEI0.8kDa was polymerized into LMW bPEI0.8kDa-based reducible polycations RPC-bPEI0.8kDa (Figure 1) and the RPC-bPEI0.8kDa2, as previously synthesized,39 was used for this study. Briefly, the primary amines of bPEI0.8kDa (550 mg, 687.5 µmol of bPEI0.8kDa based on the Mw of 0.8 kDa; 3.2 mmol of amines based on the theoretical ratio (i.e., 1°:2°:3°=25%:50%:25%) of amines in bPEI) were thiolated with 2-iminothiolane (2 equivalents of bPEI0.8kDa) in DPBS (55 mL; pH 7.0–7.4) for 12 hr at room temperature (RT). Upon completion, DMSO (18.33 mL; one-third DPBS by volume) and l-cysteine hydrochloride monohydrate (0.24 mmol) were added to the solution, and the DMSO-induced oxidative polymerization of thiolated bPEI0.8kDa was conducted for 24 hr at RT. To remove DMSO and excess reactants, the polymer solution was dialyzed for 24 hr in deionized water (DIW) using a dialysis membrane with a molecular weight cut-off (MWCO) of 3.5 kDa. Finally, the product, named RPC-bPEI0.8kDa2, was lyophilized and stored at −20 °C prior to use. The chemical structure of RPC-bPEI0.8kDa2, previously reported,39 was confirmed by 1H-NMR spectroscopy in D2O, and its MW was estimated by the viscosities of the polymer solution.
Figure 1.
Synthesis scheme for reducible polycations and polyanions derived from bPEI.
To produce the LMW bPEI0.8kDa-based reducible polyanion RPA-bPEI0.8kDa, all of the primary amines in RPC-bPEI0.8kDa2 were carboxylated with excess SA (Figure 1),40,41 and the resultant derivative was named RPA-bPEI0.8kDa2. Briefly, RPC-bPEI0.8kDa2 (20 mg) was dissolved in 0.5 M sodium bicarbonate (20 mL) and reacted with excess SA (20 equivalents of primary amines in RPC-bPEI0.8kDa2) for 3 hr under vigorous stirring. The resultant polymer solution was dialyzed using a dialysis membrane (MWCO 6–8 kDa) against 0.5 M sodium bicarbonate for 2 d, and then DIW for an additional 1 d. The resultant RPA-bPEI0.8kDa2 was lyophilized, and its modification was confirmed by a TNBSA assay. As a control, carboxylated bPEI25kDa (bPEI25kDaCOOH) was similarly prepared and used.
The proton buffering capacities of the polyelectrolytes (i.e., RPC-bPEI0.8kDa2, RPA-bPEI0.8kDa2, bPEI25kDa, and bPEI25kDaCOOH) were evaluated via traditional acid-base titration methods.41,42 Briefly, polymer (1 mg) was dissolved in 10 mM NaCl (2 mL), and the pH of the polymer solution was adjusted to 10 with 1 N HCl or NaOH. The polymer solution (0.5 mg/mL; 2 mL) was then titrated with 0.1 N HCl at RT, and the change in pH was monitored. Next, the proton buffering capacities of the polyelectrolytes were compared in the pH range of 7.4–5.1 to determine the behavior of the polymers at endolysosomal pH. The buffering capacities were calculated as follows:
where ΔVHCl is the volume of 0.1 N HCl required to change the pH of the polymer solution from 7.4 to 5.1, CHCl is the concentration of the HCl solution (0.1 N), and msample is the mass (1 mg) of the polymer.
The cytotoxicity of the reducible polyelectrolytes (RPC-bPEI0.8kDa2 and RPA-bPEI0.8kDa2) on MCF7 cells was measured by MTT assay,39 and was compared with that of the non-reducible polyelectrolytes (bPEI25kDa and bPEI25kDaCOOH). Twenty-four hours after seeding MCF7 cells at 5×10³ cells per well, the cells were exposed to the polyelectrolyte for 24 hr. At the end of the 24 hr treatment, MTT was added to the polyelectrolyte-exposed MCF7 cells, and the cells were incubated for an additional 4 hr. After the removal of the MTT-containing culture medium from each well, DMSO was added to dissolve the formazan crystals formed by the reduction of MTT by live cells. The absorbance of each sample was recorded on a microplate reader at 570 nm.39
Preparation and physicochemical characterization of the polyelectrolyte/protein complexes
Polyelectrolyte/protein complexes were prepared from charged polyelectrolytes and their counter-charged proteins. In this study, cationic polyelectrolytes (i.e., RPC-bPEI0.8kDa2 and bPEI25kDa) and anionic polyelectrolytes (i.e., RPA-bPEI0.8kDa2 and bPEI25kDaCOOH) were paired with an anionic model protein (i.e., BSA) and a cationic model protein (i.e., LYZ), respectively. The charged polyelectrolyte/protein solution was mixed in HEPES solution (25 mM, pH 7.4) and incubated for 30 min at RT. In the complexes, the concentration of protein was fixed at 0.25 mg/mL. The complexation ratios of the polyelectrolyte/protein complexes were calculated as the weight ratios (WRs) of polyelectrolyte to protein.
The particle size and surface charge of the polyelectrolyte/protein complexes dispersed in 25 mM HEPES solution (pH 7.4) were measured at RT using a Zetasizer 3000HSA (Malvern Instruments Inc., Worcestershire, UK) with a fixed wavelength of 677 nm and a constant angle of 90°. To analyze the thiol-triggered dissociation/decomplexation, the particle size of the complexes (WR 1 and WR 2) was measured at RT after the complexes had been exposed to DTT (20 mM) at 37 °C for 30 min. Dissociation kinetics of the complexes was also monitored at RT after the addition of DTT (20 µM or 20 mM). The change in the particle size over time was recorded.
The complexes were imaged using Field Emission-Scanning Electron Microscopy (FE-SEM) and were prepared in DIW, instead of HEPES solution, to avoid salt formation. After preparation, the complexes were dried and then sputtered with gold. The complexes were monitored by FE-SEM (JSM-7000F, JEOL, Japan).
Thiol-triggered protein release from the polyelectrolyte/protein complexes was tested to distinguish the difference between the non-reducible polyelectrolytes (bPEI25kDa and bPEI25kDaCOOH) and the reducible polyelectrolytes (RPC-bPEI0.8kDa2 and RPA-bPEI0.8kDa2). After polymer/protein complex formation, the complexes were exposed to DTT (10 mM) for 30 min at 37 °C. The released proteins were then separated by a centrifugation-based ultrafiltrate tube (MWCO 1000 kDa) at 3800 g for 40 min at 4 °C. The dialysates were diluted 10 times to avoid an incompatible concentration of DTT in the BCA™ protein assay method. The released proteins were quantified by the protein assay.
As described above, the proton buffering capacities of the polyelectrolyte/protein complexes (WR 1) were tested. Four mL of the complexes in DIW was prepared at a protein concentration of 0.25 mg/mL, and the complex solution was lyophilized. Then 10 mM NaCl solution (2 mL) was added to the dried complexes, and the final protein concentration of the reconstituted polyelectrolyte/protein complexes was 0.5 mg/mL.
The pH of the complex solution was adjusted to 10 with 1 N NaOH. A titration was performed with 0.1 N HCl at RT, and the pH change of the complex solution was monitored. The proton buffering capacities of the polyelectrolyte/protein complexes from pH 7.4 to 5.1 were compared with those of the polyelectrolytes to evaluate the impact of the complexation process on the proton buffering capacity at endolysosomal pH. The buffering capacity was calculated using the aforementioned equation.
Structural characterization of the proteins in the polyelectrolyte/protein complexes
The secondary structure of the protein molecules in the polyelectrolyte/protein complexes was evaluated by means of circular dichroism (CD) spectroscopy. Briefly, the complexes (WR 1) were constructed in 20 mM DPBS solution (pH 7.4) at a protein concentration of 0.25 mg/mL. The CD spectra of the complexes were obtained from 200–260 nm with a resolution of 1 nm on a Jasco J-720 spectropolarimeter. The corresponding polymers were used as blanks for the complexes, and the resultant spectra of the complexes were compared with the spectra of the protein at the same concentration. The α-helix content in the protein was calculated by CD spectra deconvolution software CDNN (v. 2.1).
Cellular activity characterization of the polyelectrolyte/protein complexes
In this study, MCF7 cells were used to characterization the in vitro activity of the complexes, including their cytotoxicity, cellular uptake, and intracellular localization. The cytotoxicities of the reducible polyelectrolyte/protein complexes were tested similarly to those of the polyelectrolytes and were then compared with the non-reducible polyelectrolyte/protein complexes.
RITC-labeled proteins were prepared for the cell studies. Briefly, the RITC labeling was performed in DPBS (pH 7.4),43,44 and the target RITC label was 1 wt% of the protein weight. The RITC-labeled proteins were dialyzed against DPBS (pH 7.4) for 24 hr and then against DIW for 4 hr using a dialysis tube (MWCO 3.5 kDa) at 4 °C to remove unreacted RITC and salt.43,44 The purified RITC-labeled proteins were lyophilized and stored at −20 °C prior to use.
To test the cellular uptake of the complexes, MCF7 cells were plated at 5×10⁵ cells per well for polycation/BSA and at 1×10⁵ cells per well for polyanion/LYZ on a 6-well plate. After 24-hr incubation, the polyelectrolyte/protein complexes prepared with RITC-labeled BSA or LYZ were added to the cells that had been cultured in a complete cell culture medium containing 10% FBS. The tested protein concentrations were 5–50 µg/mL. After 4-hr treatment of the complexes, the cells were collected, rinsed with DPBS, and fixed with a 4% PFA solution. The complex-containing MCF7 cells were analyzed by a FACSAria-II SORP (Becton Dickinson, Franklin Lakes, NJ, USA) with a 563 nm laser and a fluorescence detector (610 ± 10 nm). The total event number was 10,000 per sample. The complex-treated test groups were compared with the corresponding protein-treated group.
To determine the subcellular distribution of the polyelectrolyte/protein complexes, MCF7 cells were seeded on a coverslip at 5×10⁵ cells per well for free BSA and polycation/BSA complexes and at 1×10⁵ cells per well for free LYZ and polyanion/LYZ complexes in a 6-well plate.5,45,46 After 24-hr incubation, the complexes that had been prepared using a model protein (i.e., RITC-labeled BSA and RITC-labeled LYZ) were added to the cells cultured in a complete cell culture medium containing 10% FBS. The protein concentration used was 10 µg/mL for BSA or 25 µg/mL for LYZ. After 4-hr treatment of the complexes, the cells were rinsed with DPBS and fixed with a 4% PFA solution. Thirty minutes prior to sampling, LysoTracker® Green and Hoechst 33342 were added to stain the acidic intracellular compartments and the nucleus, respectively. The cells were evaluated using a laser scanning confocal microscope with excitation lasers (543 nm for HeNe and 408 nm for the diode) and variable band-pass emission filters. Confocal images were taken in 500-nm sections, and cumulative images were constructed for the entire cell. The fluorescence intensity of the green channel of the polycation/BSA groups, which characterizes the amount of endosome and early lysosome, was quantified by ImageJ program. The corrected total cell fluorescence (CTCF) was calculated using the following equation:47–49
RESULTS AND DISCUSSION
For the nanocarriers described here to deliver protein into the cytosol, the polymers in the protein/polymer complexes must have cytocompatibility, bear complementary charges to the protein (to allow complexation), and exhibit endosomolytic function (for endosomal escape). In addition, the resultant complexes need to be stable in the extracellular fluid but able to release proteins into the cytosolic environment. Thus, this study was designed to investigate endosomolytic, reducible polyelectrolytes and their protein complexes.
Synthesis of the polyelectrolytes
For complexation with negatively charged proteins, RPC-bPEI0.8kDa2, which was one of the polymers prepared and reported in our previous study,39 was selected. RPC-bPEI0.8kDa2 was synthesized from endosomolytic bPEI0.8kDa and 2-iminothiolane via thiolation and oxidation (Figure 1). Its chemical structure was confirmed by 1H-NMR spectroscopy, and its viscosity-based MW was 52.7 kDa.39 To allow the complexation of the reducible polyelectrolytes with positively charged proteins, RPC-bPEI0.8kDa, which is cationic, was transformed into a reducible polyanion (RPA) by the introduction of carboxylic acids. In the presence of excess SA, the primary amines of RPC-bPEI0.8kDa2 were converted to carboxylic groups, forming RPA-bPEI0.8kDa2 (Figure 1). The successful synthesis of RPA-bPEI0.8kDa2 was confirmed by the detection of a succinic acid derivative (δ 2.3) in the 1H-NMR spectra (Figure S1) and by the absence of primary amines, as confirmed by a TNBSA assay. Similarly, bPEI25kDaCOOH was prepared from bPEI25kDa as a non-reducible RPA. It is notable that RPC-bPEI0.8kDa2 possesses a much higher MW than other reducible poly(amidoamine)s (5–9 kDa) used for protein delivery23,26 because HMW polymers are one of the important factors in maintaining the stability of their protein complexes in the blood.
Complexation of the polyelectrolyte/protein complexes
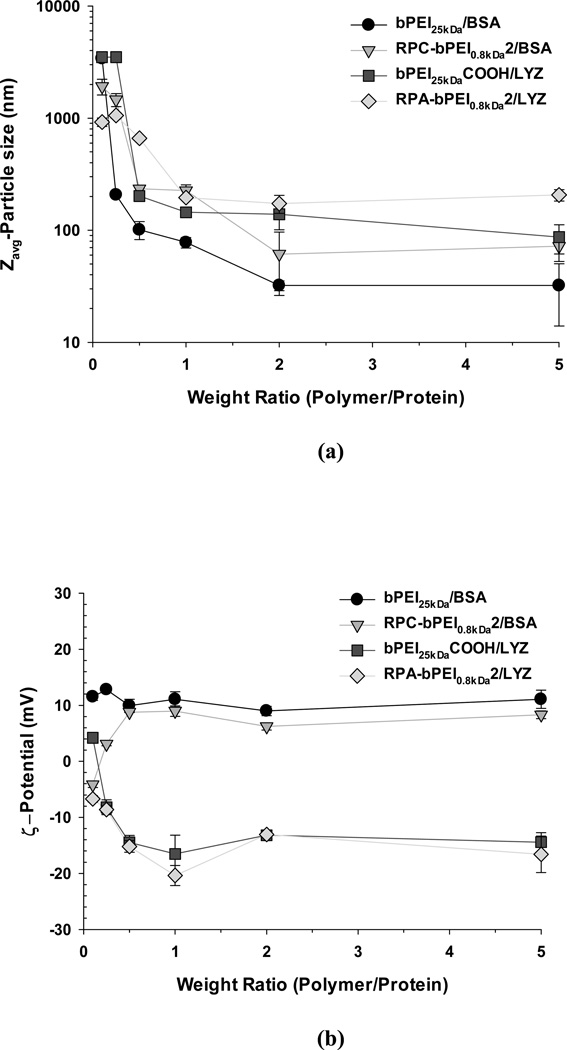
Electrostatic attraction between the polymers and the counter-charged proteins is the primary driving force underlying the formation of the nano-sized complexes. After preparing the polymer/protein complexes at various WRs, the resultant complexes’ sizes and surface charges were evaluated, and the result is shown in Figure 2. For both complexes, the size decreased from the micron-scale to the nanoscale with increasing WR. At WR <1, microparticles were formed, perhaps because the amount of polyelectrolyte added was insufficient to completely cover the proteins, resulting in the coexistence of partially anionic and partially cationic surfaces in the complex, which causes large, micron-sized aggregates. However, when the WR was increased to 1–2, the size dropped below 200 nm (Figure 2(a)). The WRs in this study were much lower (WR 1–2) than the WR, ≥12, used to produce other reducible poly(amidoamine)/protein complexes with similar nanosizes.23,26
Figure 2.
(a) Particle size and (b) surface charge of the polyelectrolyte/protein complexes (mean ± standard deviation; n=10).
The non-reducible polyelectrolytes formed nanoparticles of similar or smaller sizes than the reducible polyelectrolytes. Although different proteins were used, most non-reducible polycation/protein complexes (e.g., ~80 nm at WR 1 and ~35 nm at WR 2 for bPEI25kDa/BSA and ~220 nm at WR 1 and ~60 nm at WR 2 for RPC-bPEI0.8kDa2/BSA) had similar or smaller sizes at the same WR than their counterpart polyanion/protein complexes (e.g., ~145 nm at WR 1 and ~140 nm at WR 2 for bPEI25kDaCOOH/LYZ and ~200 nm at WR 1 and ~175 nm at WR 2 for RPA-bPEI0.8kDa2/LYZ). This observation can be explained by the introduction of amidine moieties and cysteine residues into the reducible polycations (RPC-bPEI0.8kDa2) or polyanions (RPA-bPEI0.8kDa2), a modification that reduces the positive or negative charge per unit mass (i.e., charge density) compared to the non-reducible counterparts (bPEI25kDa and bPEI25kDaCOOH).
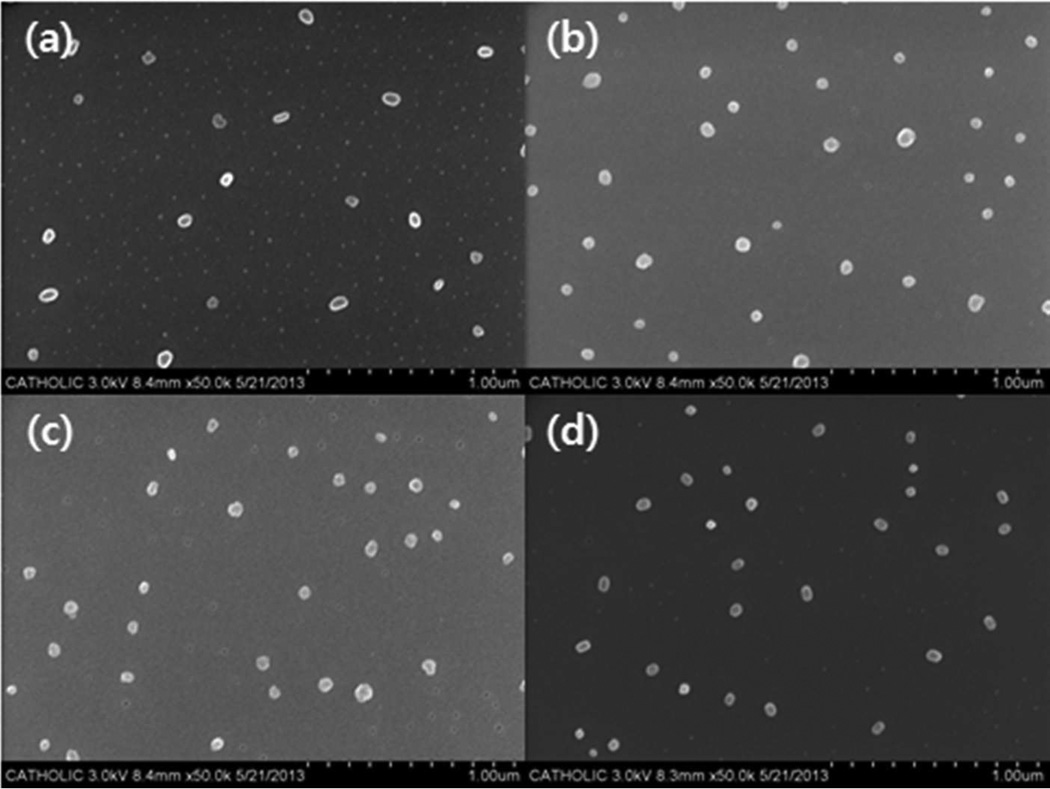
In addition, the particle sizes of the charged polyelectrolyte/protein complexes were confirmed by SEM. To observe the complexes, DIW instead of HEPES buffer was applied to avoid unwanted salt crystals. As shown in Figure 3, all polyelectrolyte/protein complexes were approximately 50 nm in diameter, and their sizes were smaller than those measured by the dynamic light scattering-based size analyzer (Figure 2(a)). As generally accepted, the size difference may arise from the difference between dried and hydrated complexes.
Figure 3.
SEM images of (a) bPEI25kDa/BSA (WR 1), (b) RPC-bPEI0.8kDa2/BSA (WR 1), (c) bPEI25kDaCOOH/LYZ (WR 1), and (d) RPA-bPEI0.8kDa2/LYZ (WR 1).
The intrinsic surface charges of the proteins are based on their isoelectric points and the environmental pH (BSA has a negative surface charge and LYZ has a positive surface charge at pH 7.4). As the amount of counter-charged polyelectrolyte increases, the absolute value of the surface charge of the resultant complexes increases from neutral, where the complexes aggregate regardless of the nature of the charge (positive or negative). In the complexes of WR ≥1 examined in this study, the surface charges were dominated by the polyelectrolytes, with values of 6~12 mV for polycation/BSA and approximately −6~−20 mV for polyanion/LYZ complexes (Figure 2(b)). These results suggest that the polyelectrolytes completely shield the proteins and cover the complex surface; owing to charge-charge repulsion, this prevents the particles from aggregating, and they form nano-sized particles that are 200 nm or smaller in diameter. Thus, polyelectrolyte/protein complexes prepared at WR 1 or 2 were used in further evaluations.
Thiol-triggered decomplexation of the polyelectrolyte/protein complexes
For effective cytosolic release of the proteins from the nanoparticles, polymers containing disulfide linkages, which can be degraded in thiol-rich environments, were selected in this study. This choice is based on the finding that shorter polyelectrolytes have weaker interactions with counter-charged biomolecules, leading to the accelerated release of biotherapeutics.39,50 The concentration of glutathione (a biological thiol compound) in the cytoplasm and the nucleus (i.e., 0.5–20 mM)51–53 is much higher than in the extracellular fluid (i.e., 2–20 µM).54,55 The cytosol-selective release of payloads from nanocomplexes helps sustain the bioactivity of therapeutic proteins because most proteins have short half-lives in the blood and can be degraded by lytic enzymes in lysosomes. Thus, the response of our polyelectrolyte/protein complexes to cytoplasmic conditions was tested by evaluating the change in the size of the complexes. Increasing complex size is a good indication of weaker interactions,56 which may in turn accelerate protein release from the complex.
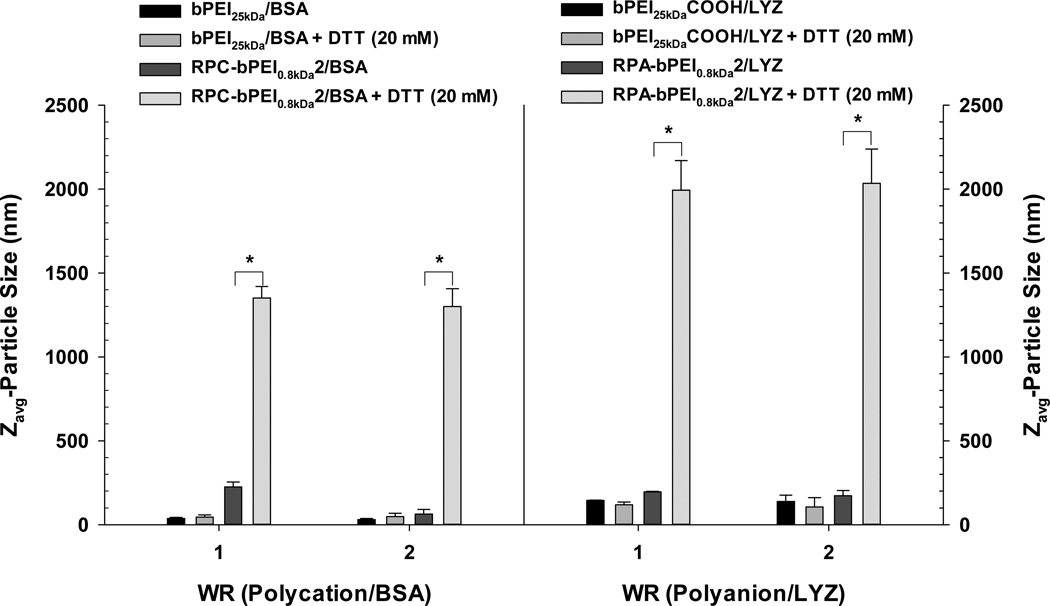
First, the reducible polymer/protein complexes (RPC-bPEI0.8kDa2/BSA and RPA-bPEI0.8kDa2/LYZ) were exposed to DTT (20 mM to mimic cytosolic conditions) at 37 °C for 30 min. Their size changes were monitored and compared with those of the non-reducible polymer/protein complexes (bPEI25kDa/BSA and bPEI25kDaCOOH/LYZ). As shown in Figure 4— and as anticipated—the sizes of the bPEI25kDa/BSA and bPEI25kDaCOOH/LYZ complexes incubated in the absence and presence of DTT remained almost constant. These results indicate that thiols may not trigger the release of the proteins from bPEI25kDa/BSA or bPEI25kDaCOOH/LYZ nanocomplexes. However, when DTT (20 mM) was added to the RPC-bPEI0.8kDa2/BSA and RPA-bPEI0.8kDa2/LYZ complexes, their sizes increased significantly to approximately 1–2 µm, whereas the sizes of the complexes were unchanged in the absence of DTT (60–200 nm). To understand clearly whether the polymer in the RPC-bPEI0.8kDa2/BSA complexes is degraded to form LMW fragments such as bPEI0.8kDa in the presence of DTT, bPEI0.8kDa was complexed with BSA at WR 1; the size of the resultant bPEI0.8kDa/BSA (WR 1) was ~1 µm. Based on these results, the thiol-induced size change of the reducible polymer/protein complexes suggests that thiols disrupt the disulfide bonds in the reducible polymer, and the shortened polymer fragments then form weaker interactions with the countercharged proteins.
Figure 4.
DTT-induced change in the size of the polyelectrolyte/protein complexes (WR 1 and WR 2) after 30 min incubation at 37 °C in the presence or absence of DTT (20 mM) (mean ± standard deviation; n=10; *p<0.01, Student's t-test).
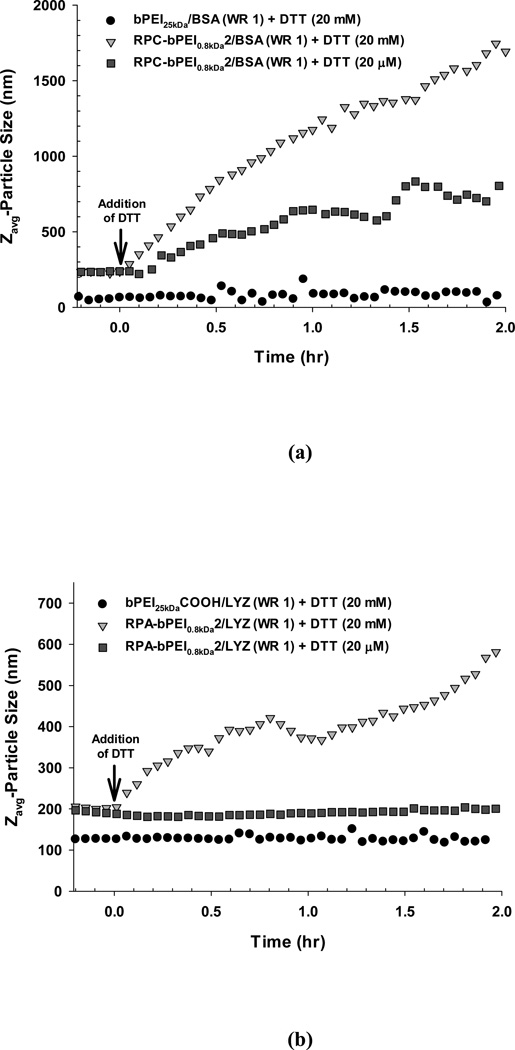
To monitor the kinetics of the response to different thiol concentrations, the time-dependent size change of the polymer/protein complexes at RT was monitored (Figure 5). Upon adding DTT (20 mM), the sizes of RPC-bPEI0.8kDa2/BSA (WR 1) and RPA-bPEI0.8kDa2/LYZ (WR 1) continuously increased over time. This indicates the potential for gradual and sustained protein release in the cytosol. An alternative concentration of DTT (10 mM) was additionally tested because some reports consider cytosolic glutathione levels to be 10 mM. As shown in Figure S2, Figure 10 mM and 20 mM of DTT did not have significantly different effects on the particle size.
Figure 5.
Time-dependent DTT-induced change in the size of the polyelectrolyte/protein complexes (WR 1) at RT in the presence or absence of DTT (20 ìM or 20 mM).
Figure 10.
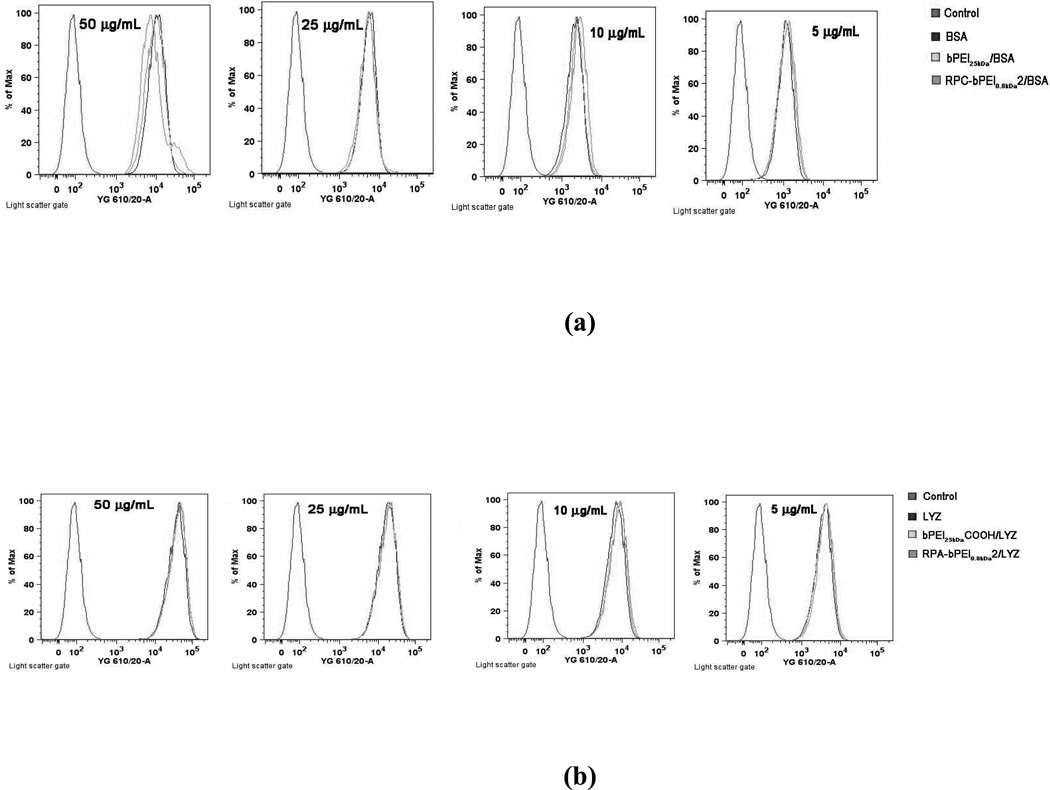
Cellular uptake of (a) the polyelectrolyte/BSA complexes (WR 1) and BSA and (b) the polyelectrolyte/LYZ complexes (WR 1) and LYZ at various protein concentrations (5–50 ìg/mL) into MCF 7 cells. The 5×10⁵ cells for BSA delivery or 1×10⁵ cells for LYZ delivery were initially seeded in each well of a 6-well plate and were exposed to the polyelectrolytes and the complexes for 4 hr. The proteins used were labeled with RITC.
Although under thiol-rich conditions RPC-bPEI0.8kDa2/BSA (WR 1) and RPA-bPEI0.8kDa2/LYZ (WR 1) swell and then release protein, the complexes should be able to protect the protein from the thiol levels in the blood or extracellular environments. Recently, Leroux et al. reported that polymeric gene carriers with disulfide bonds can release their cargo in extracellular environments.57 Thus, the DTT concentration at an extracellular level was added into the complexes, and their sizes were monitored. RPA-bPEI0.8kDa2/LYZ (WR 1) showed no size change when treated with DTT at 20 µM. However, interestingly, this low concentration of DTT caused an increase in size over time for RPC-bPEI0.8kDa2/BSA (WR 1), but the effect was significantly smaller than at 20 mM. At this low thiol concentration, the size change of RPC-bPEI0.8kDa2/BSA was reduced with increasing WR (Figure S3). These findings suggest that negatively charged RPA/protein complexes may be more stable against thiol-induced degradation than positively charged RPC/protein complexes. This is possibly due to the electrostatic repulsion that forms between RPA-bPEI0.8kDa2 and the negatively charged thiolate (-S−) required for thiol-disulfide exchange.
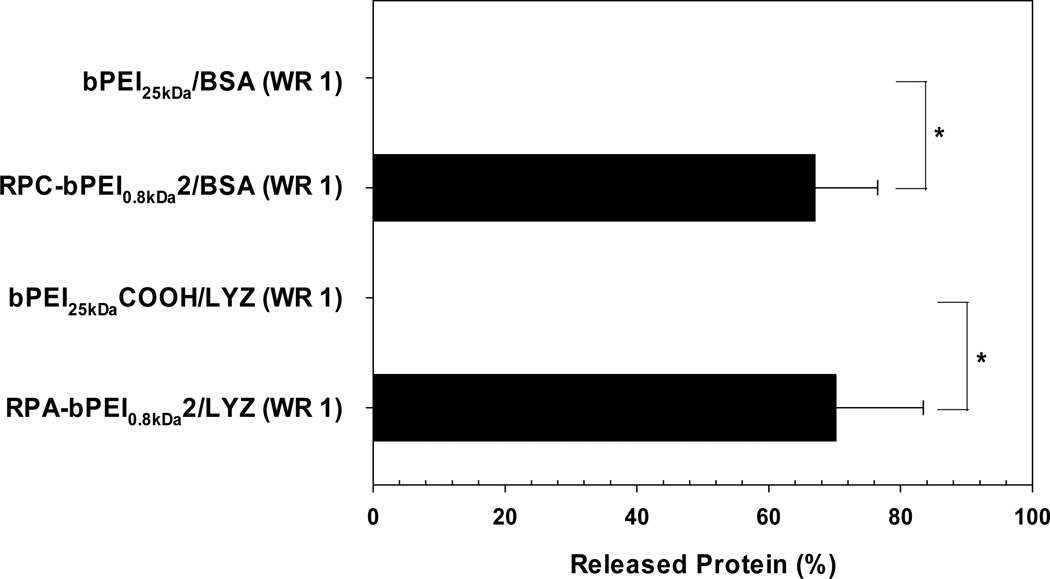
The protein release from the reducible polyelectrolyte/protein complexes in thiol-rich conditions was investigated further. After the complexes (WR 1) were exposed to DTT (10 mM) for 30 min at 37 °C, the released protein from the complexes was separated and quantified. As shown in Figure 6, released protein from both non-reducible polymer/protein complexes (bPEI25kDa/BSA and bPEI25kDaCOOH/LYZ) was not detected. However, the reducible polyelectrolyte/protein complexes (RPC-bPEI0.8kDa2/BSA and RPA-bPEI0.8kDa2/LYZ) released approximately 70% of their protein cargo.
Figure 6.
Protein released from the polyelectrolyte/protein complexes (WR 1) after exposure to DTT (10 mM) for 1 hr (mean ± standard deviation; n=3).
The findings suggest a potential for the cytosol-selective protein release of reducible polyelectrolyte/protein complexes. For RPC/protein complexes, although they might show quicker or increased protein release in the cytoplasm, a fraction of the protein loaded into the complexes would be released in the blood or extracellular fluid; this could be minimized by optimizing the WR.
Buffering capacity of the polyelectrolyte/protein complexes
The proton buffering capacities of the reducible polyelectrolytes (RPC-bPEI0.8kDa2 and RPA-bPEI0.8kDa2) and their protein complexes (RPC-bPEI0.8kDa2/BSA (WR 1) and RPA-bPEI0.8kDa2/LYZ (WR 1)), which are relevant to the mechanism of endosomal escape, were monitored and compared with those of the non-reducible polyelectrolytes (bPEI25kDa and bPEI25kDaCOOH) and their protein complexes (bPEI25kDa/BSA (WR 1) and bPEI25kDaCOOH/LYZ (WR 1)).
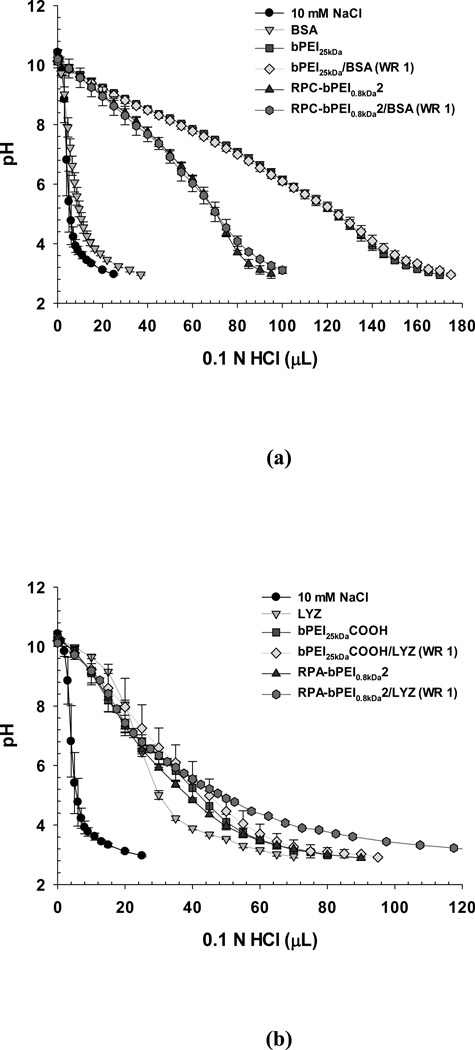
For polycations (bPEI25kDa and RPC-bPEI0.8kDa2) and their albumin complexes (bPEI25kDa/BSA (WR 1) and RPC-bPEI0.8kDa2/BSA (WR 1)), the resultant acid-base titration curves are represented in Figure 7(a). For the entire pH range that was tested, bPEI25kDa buffered the pH because of its primary, secondary, and tertiary amines. RPC-bPEI0.8kDa2 has three types of amines from the bPEI and additional amidines. When complexed at pH 7.4, the ionized primary amines and amidines are shielded by the negative charges from the BSA and will not contribute to the buffering capacity. Thus, as shown in Figure 7(a) and Table S1, the proton buffering capacities of bPEI25kDa and RPC-bPEI0.8kDa2 at pH values between 7.4 and 5.1 (physiological pH to endosomal pH) were approximately 10.0 µmol/mg and 5.1 µmol/mg, respectively; these capacities are attributable to the secondary and tertiary amines. However, unlike the polyelectrolytes, it is difficult to determine the proton buffering capacity of complexes such as bPEI25kDa/BSA (WR 1) and RPC-bPEI0.8kDa2/BSA (WR 1). Thus, when the pH of the individual solutions of proteins, polymers, or complexes was dropped from pH 7.4 to pH 5.1 by titration with 0.1 N HCl, the consumed volume of titrant (ΔVHCl) was used to evaluate whether protein complexation causes a decrease in the proton buffering of polymers, as previously reported.41 If the proton buffering of the polycations is not compromised in the complexation, the complexes would consume the sum ofΔVHCl (pH 7.4–5.1) for BSA (4.3 µL) and the polycations (50.1 µL for bPEI25kDa and 25.4 µL for RPC-bPEI0.8kDa2). However, both bPEI25kDa/BSA (WR 1) and RPC-bPEI0.8kDa2/BSA (WR 1) consumed a similarΔVHCl as the polycations when the pH dropped from 7.4 to 5.1 (Figure 7(a) and Table S1). This supports our expectation that complex formation only slightly decreases the proton buffering capacity of the polycations.
Figure 7.
Acid-base titrations of the polyelectrolytes and polyelectrolyte/protein complexes (WR 1) in 10 mM NaCl (mean ± standard deviation; n=3).
Similarly, the proton buffering capacities of the polyanions (bPEI25kDaCOOH and RPA-bPEI0.8kDa2) and their LYZ complexes (bPEI25kDaCOOH/LYZ (WR 1) and RPA-bPEI0.8kDa2/LYZ (WR 1) were evaluated (Figure 7(b) and Table S1). In the range of pH 7.4–5.1, the buffering capacities of bPEI25kDaCOOH and RPA-bPEI0.8kDa2 were approximately 4.0 µmol/mg and 3.6 µmol/mg, respectively; these capacities may be attributed to the secondary and tertiary amines and a portion of the carboxylic acid groups. Although it is unclear, the proton buffering of bPEI25kDaCOOH/LYZ (WR 1) was less than that of bPEI25kDaCOOH before protein complexation. However, RPA-bPEI0.8kDa2/LYZ (WR 1) maintained a similar proton buffering capacity to that of RPA-bPEI0.8kDa2.
Overall, bPEI25kDa/BSA (WR 1) showed approximately two-fold higher proton buffering than RPC-bPEI0.8kDa2/BSA (WR 1), whereas RPA-bPEI0.8kDa2/LYZ (WR 1) provided similar proton buffering to RPC-bPEI0.8kDa2/BSA (WR 1) (Table S1). Although the polyelectrolyte/protein complexes displayed proton buffering capacity in endolysosomal pH ranges, further experiments are needed to confirm whether the proton buffering capacity is sufficient to disrupt the endosomal membrane during endocytosis of the complex.
Retention of the protein structure after complexation
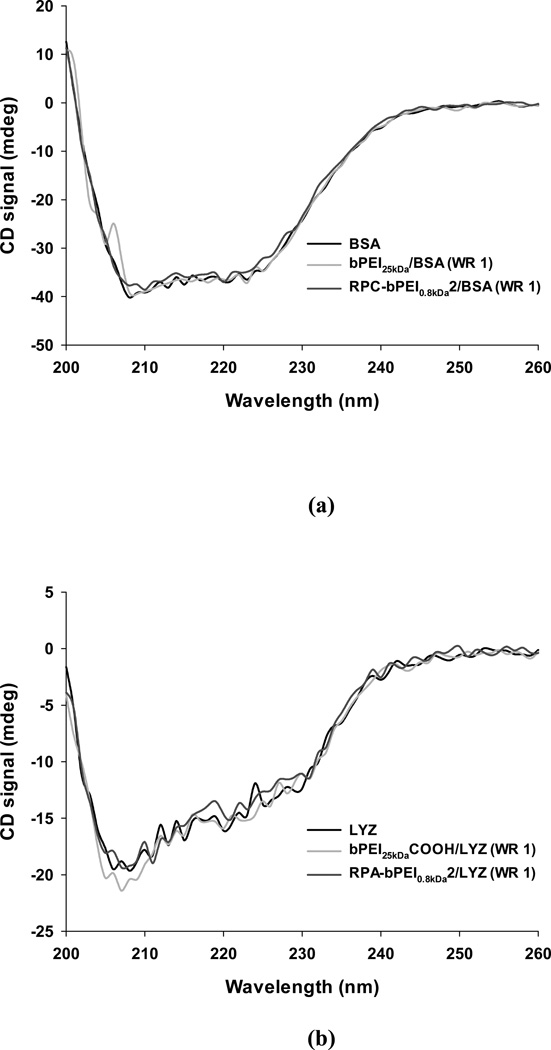
Proteins that have been complexed with polyelectrolytes should keep their intrinsic bioactivity, which can be indicated by the protein’s stability. Thus, to test the stability of the protein in the complex, the secondary structure of the protein was evaluated by CD spectroscopy. As a parameter for the protein stability, the α-helical content of the proteins alone and in polymer/protein complexes were calculated and compared. As shown in Figure 8(a), the CD spectrum revealed that the α-helical content of native BSA was 51%. This result is similar to a previously reported value.58 After the complexation of BSA with bPEI25kDa and RPC-bPEI0.8kDa2, the α-helical content in both cationic polyelectrolyte/BSA complexes was the same (~51%). This indicates no damage to BSA’s secondary structure due to complexation. Similarly, Figure 8(b) showed that the α-helical contents of the LYZ complexes with and without anionic polyelectrolytes (i.e., bPEI25kDaCOOH and RPA-bPEI0.8kDa2) were 29%, in accordance with a reported value.59 In conclusion, a constant α-helical content in the proteins indicates that the electrostatic interaction-driven protein complexation does not damage the secondary structure of the protein, which is relevant to their intrinsic bioactivity.
Figure 8.
Representative CD spectra of the protein and reducible polyelectrolyte/protein complex (WR 1) in 20 mM DPBS. The protein concentration was 0.25 mg/mL.
Cytotoxicity of the polyelectrolyte/protein complexes
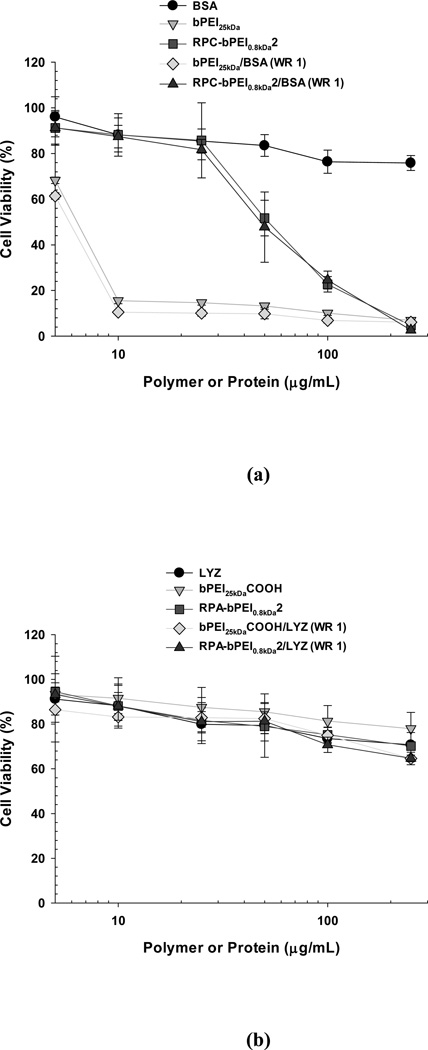
Materials expected to be introduced into the body should be biocompatible. Among various biocompatibility tests, the cytotoxicity of the polyelectrolytes and their protein complexes was evaluated. The cytotoxicity of the reducible polymers was evaluated using MCF7 cells and was compared with that of the non-reducible polymers (Figure 9). The results from this study coincide with our previous findings39 that the cytotoxicity of RPC-bPEI0.8kDa2 to MCF7 cells was lower than that of bPEI25kDa; the IC50 of RPC-bPEI0.8kDa2 was approximately eight- to nine-fold higher than that of bPEI25kDa (Figure 9(a)). These results may be attributed to the reducible character of RPC-bPEI0.8kDa2 in the intracellular environment. When the cationic materials interact with vital intracellular components, longer cationic chains result in stronger interactions and higher toxicity. The viabilities of the cells treated with the two anionic polymers, RPA-bPEI0.8kDa2 and bPEI25kDaCOOH, were above 75% throughout the range of the tested polymer concentrations (Figure 8(b)) and were far higher than those of RPC-bPEI0.8kDa2 and bPEI25kDa. These findings were consistent with our expectations that the anionic polymers should be less toxic because they interact to a lesser extent with vital intracellular components than cationic polymers.
Figure 9.
Cytotoxicity of the polyelectrolytes and polyelectrolyte/protein complexes (WR 1) on MCF7 cells (mean ± standard error; n=6). The 5000 cells that were initially seeded in each well of a 96-well plate were exposed to the polyelectrolytes and the complexes for 24 hr.
After the formation of the polyelectrolyte/protein complexes, their cytotoxicities were compared to those of their corresponding polyelectrolytes. As shown in Figures 9(a) and 9(b), the cytotoxicity curve for each polyelectrolyte/protein complex essentially overlapped with that of the corresponding polyelectrolyte alone. Thus, it can be concluded that RPC-bPEI0.8kDa2 is more cytocompatible than non-degradable polycations and that RPA-bPEI0.8kDa2 is cytocompatible at all the tested concentrations for intracellular protein delivery.
Cellular uptake of the polyelectrolyte/protein complexes
The intrinsic surface charges of proteins strongly influence their cellular uptake; proteins with positively charged surfaces generally show more cellular uptake than proteins with negatively charged surfaces, as a result of attraction by negatively charged cellular membranes. However, in the blood and in extracellular environments, negatively charged serum proteins can associate with exogenous positively charged proteins, leading to reduced protein uptake by the cells of interest. The effects of surface charge on cellular uptake also apply to nanoparticle-based drug carriers. Thus, the cellular uptake of the reducible polyelectrolyte/protein complexes (5–50 µg/mL of protein; WR 1) was evaluated using MCF7 cells (5×10⁵ cells/well for BSA studies or 1×10⁵ cells/well for LYZ studies were seeded) in the presence of serum and was compared with the uptake of the non-reducible polyelectrolyte/protein complexes and the proteins alone. RITC-labeled proteins were used to measure the cellular uptake of the proteins, with and without the aid of nanocarriers, by flow cytometry.
In the presence of the serum, the cellular uptake of the polyelectrolyte/protein complexes were similar to those of the proteins alone, regardless of which polyelectrolyte was used (Figure 10). In general, proteins and complexes with positive surface charges can be internalized more efficiently than those with neutral or negative surface charges. However, the presence of serum might shield the positive surface charges of some complexes (i.e., polycation/BSA) and proteins (i.e., LYZ), transforming the positive charges into negative ones, resulting in similar cellular uptakes among groups with different ζ-potentials. This study suggests the feasibility of using polyelectrolyte/protein complexes in vivo for the protection of proteins from lytic environments (e.g., blood).
Intracellular trafficking of the polyelectrolyte/protein complexes
Although the buffering capacities of RPC-bPEI0.8kDa2 and RPA-bPEI0.8kDa2 provide potential for “proton sponge effect”-mediated endosomolysis and cytosol-specific protein release, it remained unclear whether the carriers could effectively deliver proteins in the cytoplasm. To answer this question, the subcellular compartments were stained with LysoTracker® Green dye (which stains the acidic late endosomal and lysosomal compartments) and Hoechst 33342 (which stains the nucleus), allowing the identification of the intracellular localization of model RITC-labeled proteins (RITC-BSA and RITC-LYZ) by confocal microscopy.
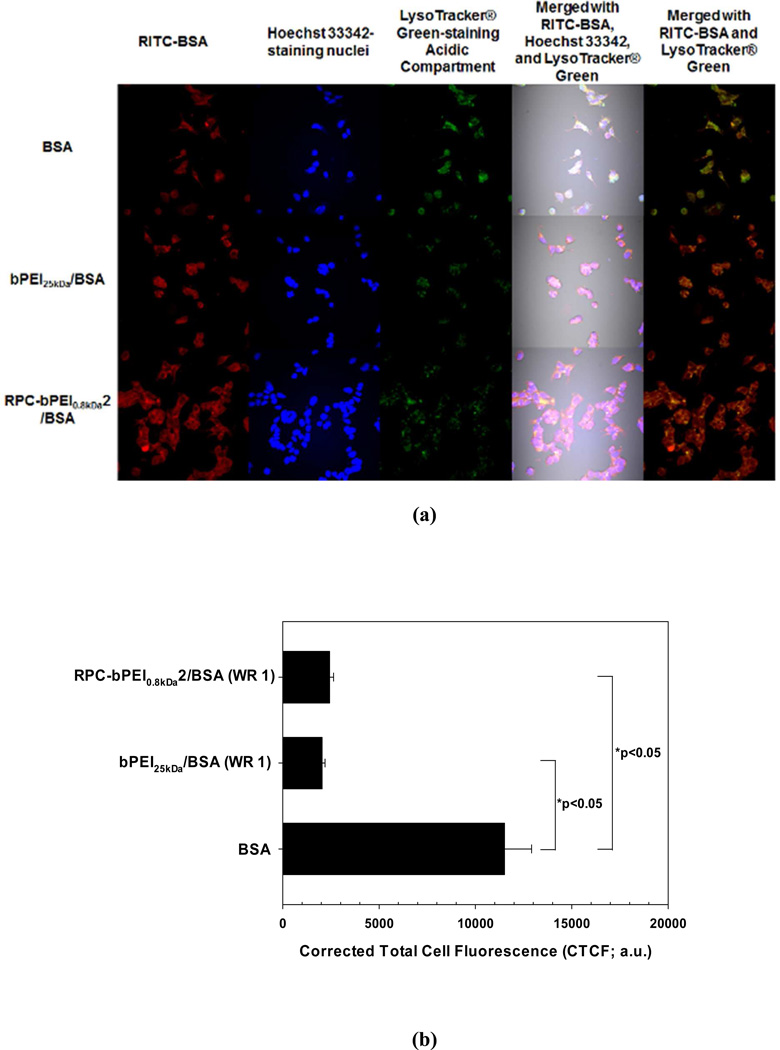
In the accumulated images of the MCF7 cells (5×10⁵ cells/well) exposed to polycation/BSA (WR 1) or BSA with a concentration of 10 µg/mL (Figure 11(a)), bPEI25kDa/BSA (WR 1) exhibited a similar cellular uptake to that of RPC-bPEI0.8kDa2/BSA (WR 1) and BSA alone, as shown in Figure 10(a). However, a more intense fluorescence of LysoTracker® Green, which accumulates in late endosomes and lysosomes, was detected in BSA-treated MCF7 cells than in polycation/BSA-treated cells. Further quantification by ImageJ proved that the corrected total cell fluorescence (CTCF) of LysoTracker® Green in the RPC-bPEI0.8kDa2/BSA- and bPEI25kDa/BSA-treated cells was 5–6 times lower than in the BSA-treated cells (p <0.05 by Kruskal-Wallis One Way Analysis of Variance on Ranks followed by post-hoc Dunn’s analysis). However, no significant difference in the CTCF between RPC-bPEI0.8kDa2/BSA- and bPEI25kDa/BSA-treated cells was observed (Figure 11(b)). In addition, the fluorescence intensity of the colocalized polyelectrolyte/BSA complexes with LysoTracker® Green was much less than that of BSA alone (Figure 11(a)). These findings indicate that the polyelectrolytes disrupted more endolysosomes than BSA alone because the endocytosed BSA is generally sequestered and degraded in the lysosomes, unlike endosomolytic polyelectrolytes. Moreover, it seems that the RPC-bPEI0.8kDa2/BSA complexes were more evenly distributed in the cytoplasm than the bPEI25kDa/BSA complexes. The different cytoplasmic distribution of BSA carried by bPEI25kDa and RPC-bPEI0.8kDa2 might indicate more protein release or quicker protein release from RPC-bPEI0.8kDa2/BSA than from bPEI25kDa/BSA.
Figure 11.
(a) Accumulated confocal images for intracellular trafficking of the cationic polyelectrolyte/BSA complexes (WR 1) and BSA (10 ìg/mL) in MCF7 cells and (b) the intracellular endolysosome amount, as determined by CTCF, of the BSA- and polycation/BSA-treated cells (n ≥20, *p<0.05 by Kruskal-Wallis One Way Analysis of Variance on Ranks followed by post-hoc Dunn’s analysis). MCF7 cells (5×10⁵ cells) for studying uptake of the polycation/BSA complexes and free BSA were seeded in each well of a 6-well plate and were exposed to free BSA and the complexes for 4 hr. Free BSA was labeled with RITC (red). Acidic compartments and nuclei were stained with LysoTracker® Green (green) and Hoechst 33342 (blue), respectively.
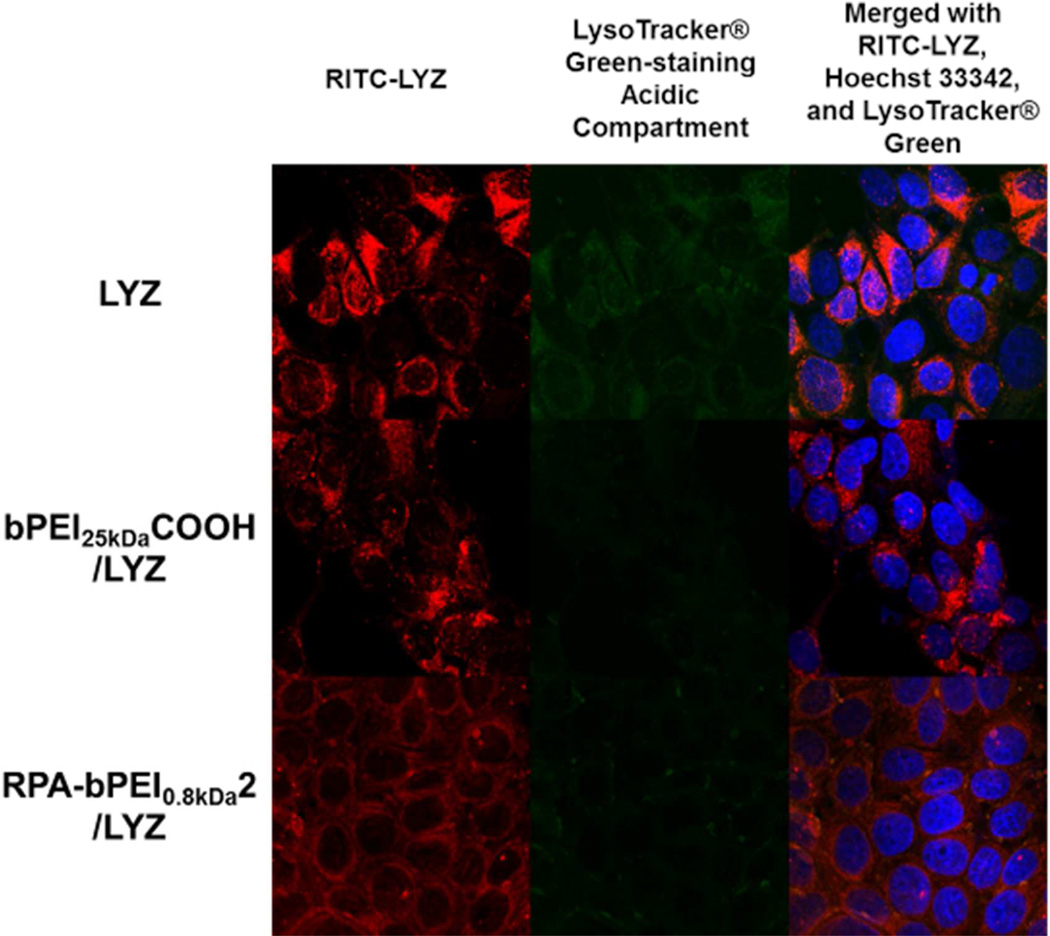
Using MCF7 cells (1×10⁵ cells/well) and polyanion/LYZ (WR 1) or LYZ with a final concentration of 25 µg/mL, intracellular trafficking of the polyanion/LYZ complexes was investigated and compared with that of LYZ (Figure 12). It appears that the cellular uptake of bPEI25kDaCOOH/LYZ complexes, RPA-bPEI0.8kDa2/LYZ complexes, and free LYZ was similar. However, a more intense fluorescence of LysoTracker® Green was detected in the LYZ-treated MCF7 cells than in the polyanion/LYZ-treated cells. These findings indicate that the polyanions disrupted more endolysosomes than the free LYZ alone. In addition, in terms of colocalization with LysoTracker® Green, the bPEI25kDaCOOH/LYZ complexes showed similar behavior to the RPA-bPEI0.8kDa2/LYZ complexes because their proton buffering was similar (Figure 7(b)). RITC-LYZ in the RPA-bPEI0.8kDa2/LYZ-treated cells was evenly distributed in the cytoplasm, whereas the LYZ- and bPEI25kDaCOOH/LYZ-treated cells showed some localized spots of RITC-LYZ. This difference between the RPA-bPEI0.8kDa2/LYZ- and bPEI25kDaCOOH/LYZ-treated cells might be caused by different amounts of proteins released from the complexes, indicating a better or quicker protein release from the RPA-bPEI0.8kDa2/LYZ complexes than the bPEI25kDaCOOH/LYZ complexes.
Figure 12.
Accumulated confocal images for intracellular trafficking of the anionic polyelectrolyte/LYZ complexes (WR 1) and LYZ (25 ìg/mL) in MCF7 cells. The MCF7 cells (1×10⁵ cells) for imaging uptake of the polyanion/LYZ complexes and free LYZ were seeded in each well of a 6-well plate and were exposed to free LYZ and the complexes for 4 hr. Free LYZ was labeled with RITC (red). Acidic compartments and nuclei were stained with LysoTracker® Green (green) and Hoechst 33342 (blue), respectively.
CONCLUSIONS
Endosomolytic reducible polycations were synthesized from LMW bPEI via thiolation followed by oxidative polymerization; the anionic counterparts were prepared by the subsequent introduction of carboxylic acids. The synthesized reducible polyelectrolytes were complexed with counter-charged proteins such as BSA and LYZ, forming nano-sized complexes at WR 1 or higher. The reducible polyelectrolyte/protein complexes exhibited negligible cytotoxicity, proton buffering capacity in endolysosomal pH ranges, no structural damage due to complexation, improved capacity to escape from the endosome, and thiol-triggered protein release in thiol-rich environments (e.g., the cytosol and the nucleus). Thus, endosomolytic, reducible polyelectrolytes are promising carriers for the efficient delivery of proteins to the cytosol.
Supplementary Material
ACKNOWLEDGMENTS
This work was supported by NIH grant GM72612 and CA122356.
Footnotes
The authors declare no competing financial interests.
Supporting Information Available.
The supporting information includes details about the titrant volume against polyelectrolytes, proteins, and polyelectrolyte/protein complexes; 1H-NMR analyses of RPC-bPEI0.8kDa2 and RPA-bPEI0.8kDa2; time-dependent changes in the size of RPC-bPEI0.8kDa2/BSA complexes (WR 1) in the presence of 10 mM or 20 mM DTT; and time-dependent changes in the size of RPC- bPEI0.8kDa2/BSA complexes (WR 2) in the presence of 20 mM or 20 µM DTT. This information is available free of charge via the Internet at http://pubs.acs.org.
REFERENCES
- 1.Crick F. Nature. 1970;227:561–563. doi: 10.1038/227561a0. [DOI] [PubMed] [Google Scholar]
- 2.Levy O. Antimicrob. Agents Chemother. 2000;44:2925–2931. doi: 10.1128/aac.44.11.2925-2931.2000. [DOI] [PMC free article] [PubMed] [Google Scholar]
- 3.Blokhina O, Virolainen E, Fagerstedt KV. Ann Bot. 2003;91:179–194. doi: 10.1093/aob/mcf118. [DOI] [PMC free article] [PubMed] [Google Scholar]
- 4.Reaven GM. Diabetes. 1988;37:1595–1607. doi: 10.2337/diab.37.12.1595. [DOI] [PubMed] [Google Scholar]
- 5.Kang HC, Kim S, Lee M, Bae YH. J. Controlled Release. 2005;105:164–176. doi: 10.1016/j.jconrel.2005.03.013. [DOI] [PubMed] [Google Scholar]
- 6.Fambrough DM, Drachman DB, Satyamurti S. Science. 1973;182:293–295. doi: 10.1126/science.182.4109.293. [DOI] [PubMed] [Google Scholar]
- 7.Semenza GL. Trends Mol. Med. 2002;8:S62–S67. doi: 10.1016/s1471-4914(02)02317-1. [DOI] [PubMed] [Google Scholar]
- 8.Cotter TG. Nat. Rev. Cancer. 2009;9:501–507. doi: 10.1038/nrc2663. [DOI] [PubMed] [Google Scholar]
- 9.Johnstone RW, Ruefli AA, Lowe SW. Cell. 2002;108:153–164. doi: 10.1016/s0092-8674(02)00625-6. [DOI] [PubMed] [Google Scholar]
- 10.Devarajan E, Sahin AA, Chen JS, Krishnamurthy RR, Aggarwal N, Brun AM, Sapino A, Zhang F, Sharma D, Yang XH, Tora AD, Mehta K. Oncogene. 2002;21:8843–8851. doi: 10.1038/sj.onc.1206044. [DOI] [PubMed] [Google Scholar]
- 11.Leader B, Baca QJ, Golan DE. Nat. Rev. Drug Discovery. 2008;7:21–39. doi: 10.1038/nrd2399. [DOI] [PubMed] [Google Scholar]
- 12.Hooper NM. Proteases in Biology and Medicine. Vol. 38. London: Portland Press Ltd; 2002. [Google Scholar]
- 13.Abzalimov RR, Frimpong AK, Kaltashov IA. Methods Mol. Biol. 2012;896:365–373. doi: 10.1007/978-1-4614-3704-8_24. [DOI] [PubMed] [Google Scholar]
- 14.Wang YS, Youngster S, Grace M, Bausch J, Bordens R, Wyss DF. Adv. Drug Delivery Rev. 2002;54:547–570. doi: 10.1016/s0169-409x(02)00027-3. [DOI] [PubMed] [Google Scholar]
- 15.Harris JM, Martin NE, Modi M. Clin. Pharmacokinet. 2001;40:539–551. doi: 10.2165/00003088-200140070-00005. [DOI] [PubMed] [Google Scholar]
- 16.Liu J, Wang T, Chen J, Wang S, Ye Z. Urology. 2006;67:201–203. doi: 10.1016/j.urology.2005.07.058. [DOI] [PubMed] [Google Scholar]
- 17.Igor I, Trewyn BG, Victor SYL. J. Am. Chem. Soc. 2007;129:8845–8849. doi: 10.1021/ja0719780. [DOI] [PubMed] [Google Scholar]
- 18.Cesaro S, Calore E, Messina C, Zanesco L. Support Care Cancer. 1999;7:284–286. doi: 10.1007/s005200050262. [DOI] [PubMed] [Google Scholar]
- 19.Lo SL, Wang S. Macromol. Rapid Commun. 2010;31:1134–1141. doi: 10.1002/marc.200900934. [DOI] [PubMed] [Google Scholar]
- 20.Choi SO, Kim YC, Lee JW, Park JH, Prausnitz MR, Allen MG. Small. 2012;8:1081–1091. doi: 10.1002/smll.201101747. [DOI] [PMC free article] [PubMed] [Google Scholar]
- 21.Gu Z, Biswas A, Zhao M, Tang Y. Chem. Soc. Rev. 2011;40:3638–3655. doi: 10.1039/c0cs00227e. [DOI] [PubMed] [Google Scholar]
- 22.Puri M, Kaur I, Perugini MA, Gupta RC. Drug Discovery Today. 2012;17:774–783. doi: 10.1016/j.drudis.2012.03.007. [DOI] [PubMed] [Google Scholar]
- 23.Coue G, Engbersen JFJ. J. Controlled Release. 2011;152:90–98. doi: 10.1016/j.jconrel.2011.01.023. [DOI] [PubMed] [Google Scholar]
- 24.Yan M, Du J, Gu Z, Liang M, Hu Y, Zhang W, Priceman S, Wu L, Zhou ZH, Liu Z, Segura T, Tang Y, Lu Y. Nat. Nanotechnol. 2010;5:48–53. doi: 10.1038/nnano.2009.341. [DOI] [PubMed] [Google Scholar]
- 25.Kim SH, Jeong JH, Joe CO, Park TG. J. Controlled Release. 2005;103:625–634. doi: 10.1016/j.jconrel.2005.01.006. [DOI] [PubMed] [Google Scholar]
- 26.Cohen S, Coue G, Beno D, Korenstein R, Engbersen JFJ. Biomaterials. 2012;33:614–623. doi: 10.1016/j.biomaterials.2011.09.085. [DOI] [PubMed] [Google Scholar]
- 27.Ayame H, Morimoto N, Akiyoshi K. Bioconjugate Chem. 2008;19:882–890. doi: 10.1021/bc700422s. [DOI] [PubMed] [Google Scholar]
- 28.Wang X, Uto T, Sato K, Ide K, Akagi T, Okamoto M, Kaneko T, Akashi M, Baba M. Immunol. Lett. 2005;98:123–130. doi: 10.1016/j.imlet.2004.10.028. [DOI] [PubMed] [Google Scholar]
- 29.Zhang J, Wu L, Meng F, Wang Z, Deng C, Liu H, Zhong Z. Langmuir. 2011;28:2056–2065. doi: 10.1021/la203843m. [DOI] [PubMed] [Google Scholar]
- 30.Lee Y, Fukushima S, Bae Y, Hiki S, Ishii T, Kataoka K. J. Am. Chem. Soc. 2007;129:5362–5363. doi: 10.1021/ja071090b. [DOI] [PubMed] [Google Scholar]
- 31.Pattrick NG, Richardson SC, Casolaro M, Ferruti P, Duncan R. J. Controlled Release. 2001;77:225–232. doi: 10.1016/s0168-3659(01)00476-x. [DOI] [PubMed] [Google Scholar]
- 32.Lavignac N, Lazenby M, Foka P, Malgesini B, Verpilio I, Ferruti P, Duncan R. Macromo.l Biosci. 2004;4:922–929. doi: 10.1002/mabi.200400093. [DOI] [PubMed] [Google Scholar]
- 33.Shu S, Zhang X, Wu Z, Wang Z, Li C. Biomaterials. 2010;31:6039–6049. doi: 10.1016/j.biomaterials.2010.04.016. [DOI] [PubMed] [Google Scholar]
- 34.Zhao M, Biswas A, Hu B, Joo KI, Wang P, Gu Z, Tang Y. Biomaterials. 2011;32:5223–5230. doi: 10.1016/j.biomaterials.2011.03.060. [DOI] [PubMed] [Google Scholar]
- 35.Biswas A, Joo KI, Liu J, Zhao M, Fan G, Wang P, Gu Z, Tang Y. ACS Nano. 2011;5:1385–1394. doi: 10.1021/nn1031005. [DOI] [PubMed] [Google Scholar]
- 36.Murata H, Sakaguchi M, Futami J, Kitazoe M, Maeda T, Doura H, Kosaka M, Tada H, Seno M, Huh N-h, Yamada H. Biochemistry. 2006;45:6124–6132. doi: 10.1021/bi052642a. [DOI] [PubMed] [Google Scholar]
- 37.Tjelle TE, Brech A, Juvet LK, Griffiths G, Berg T. J. Cell Sci. 1996;109(Pt 12):2905–2914. doi: 10.1242/jcs.109.12.2905. [DOI] [PubMed] [Google Scholar]
- 38.Pillay CS, Elliott E, Dennison C. Biochem. J. 2002;363:417–429. doi: 10.1042/0264-6021:3630417. [DOI] [PMC free article] [PubMed] [Google Scholar]
- 39.Kang HC, Kang HJ, Bae YH. Biomaterials. 2011;32:1193–1203. doi: 10.1016/j.biomaterials.2010.08.079. [DOI] [PMC free article] [PubMed] [Google Scholar]
- 40.Lee Y, Miyata K, Oba M, Ishii T, Fukushima S, Han M, Koyama H, Nishiyama N, Kataoka K. Angew. Chem. Int. Ed. Engl. 2008;47:5163–5166. doi: 10.1002/anie.200800963. [DOI] [PubMed] [Google Scholar]
- 41.Kang HC, Lee JE, Bae YH. J. Controlled Release. 2012;160:440–450. doi: 10.1016/j.jconrel.2012.02.024. [DOI] [PMC free article] [PubMed] [Google Scholar]
- 42.Kang HC, Bae YH. Adv. Funct. Mater. 2007;17:1263–1272. [Google Scholar]
- 43.Leamon CP, Low PS. Proc. Natl. Acad. Sci. U.S.A. 1991;88:5572–5576. doi: 10.1073/pnas.88.13.5572. [DOI] [PMC free article] [PubMed] [Google Scholar]
- 44.Xie H, Tkachenko AG, Glomm WR, Ryan JA, Brennaman MK, Papanikolas JM, Franzen S, Feldheim DL. Anal. Chem. 2003;75:5797–5805. doi: 10.1021/ac034578d. [DOI] [PubMed] [Google Scholar]
- 45.Kang HC, Bae YH. Pharm. Res. 2006;23:1797–1808. doi: 10.1007/s11095-006-9027-0. [DOI] [PubMed] [Google Scholar]
- 46.Kang HC, Samsonova O, Bae YH. Biomaterials. 2010;31:3071–3078. doi: 10.1016/j.biomaterials.2010.01.001. [DOI] [PMC free article] [PubMed] [Google Scholar]
- 47.Potapova TA, Sivakumar S, Flynn JN, Li R, Gorbsky GJ. Mol. Biol. Cell. 2011;22:1191–1206. doi: 10.1091/mbc.E10-07-0599. [DOI] [PMC free article] [PubMed] [Google Scholar]
- 48.Gavet O, Pines J. Dev. Cell. 2010;18:533–543. doi: 10.1016/j.devcel.2010.02.013. [DOI] [PMC free article] [PubMed] [Google Scholar]
- 49.Burgess A, Vigneron S, Brioudes E, Labbé J-C, Lorca T, Castro A. Proc. Natl. Acad. Sci. U.S.A. 2010;107:12564–12569. doi: 10.1073/pnas.0914191107. [DOI] [PMC free article] [PubMed] [Google Scholar]
- 50.Gary DJ, Puri N, Won YY. J. Controlled Release. 2007;121:64–73. doi: 10.1016/j.jconrel.2007.05.021. [DOI] [PubMed] [Google Scholar]
- 51.Soliman M, Allen S, Davies MC, Alexander C. ChemCommun (Camb) 2010;46:5421–5433. doi: 10.1039/c0cc00794c. [DOI] [PubMed] [Google Scholar]
- 52.Hwang HS, Kang HC, Bae YH. Biomacromolecules. 2013;14:548–556. doi: 10.1021/bm301794d. [DOI] [PMC free article] [PubMed] [Google Scholar]
- 53.Wan L, Manickam DS, Oupický D, Mao G. Langmuir. 2008;24:12474–12482. doi: 10.1021/la802088y. [DOI] [PMC free article] [PubMed] [Google Scholar]
- 54.Meng F, Hennink WE, Zhong Z. Biomaterials. 2009;30:2180–2198. doi: 10.1016/j.biomaterials.2009.01.026. [DOI] [PubMed] [Google Scholar]
- 55.Kang HC, Lee M, Bae YH. Crit. Rev. Eukaryot. Gene Expr. 2005;15:317–342. doi: 10.1615/critreveukargeneexpr.v15.i4.30. [DOI] [PubMed] [Google Scholar]
- 56.Wang Y-Q, Su J, Wu F, Lu P, Yuan L-F, Yuan W-E, Sheng J, Jin T. Int. J. Nanomed. 2012;7:693–704. doi: 10.2147/IJN.S27849. [DOI] [PMC free article] [PubMed] [Google Scholar]
- 57.Brulisauer L, Gauthier MA, Leroux JC. 39th Annual Meeting of Controlled Release Society. Quebec, Canada: 2012. p. 241. [Google Scholar]
- 58.Kim JH, Taluja A, Knutson K, Bae YH. J. Controlled Release. 2005;109:86–100. doi: 10.1016/j.jconrel.2005.09.016. [DOI] [PubMed] [Google Scholar]
- 59.Greenfield NJ, Fasman GD. Biochemistry. 1969;8:4108–4116. doi: 10.1021/bi00838a031. [DOI] [PubMed] [Google Scholar]
Associated Data
This section collects any data citations, data availability statements, or supplementary materials included in this article.


