Abstract
Purifying selection at many linked sites alters patterns of molecular evolution, reducing overall diversity and distorting the shapes of genealogies. Recombination attenuates these effects; however, purifying selection can significantly distort genealogies even for substantial recombination rates. Here, we show that when selection and/or recombination are sufficiently strong, the genealogy at any single site can be described by a time-dependent effective population size, Ne(t), which has a simple analytic form. Our results illustrate how recombination reduces distortions in genealogies and allow us to quantitatively describe the shapes of genealogies in the presence of strong purifying selection and recombination. We also analyze the effects of a distribution of selection coefficients across the genome.
Keywords: coalescent, purifying selection, genealogies, recombination, linkage
PURIFYING selection acts to remove deleterious mutations, and variation linked to these mutations, as they continually arise in a population. This leads to reduced genetic diversity at both selected sites and linked neutral sites. This effect, known as background selection, can significantly affect the patterns of diversity evident in sequence data. In recent years, substantial empirical evidence has arisen, suggesting that these effects may be pervasive in humans and other organisms (McVicker et al. 2009; Haddrill et al. 2010; Lohmueller et al. 2011; see Charlesworth 2012 for review).
When selection is very strong, these effects are well understood. Deleterious mutations are purged almost immediately, leading to an overall reduction in diversity to the level expected in a neutrally evolving population with a reduced population size Ne (Charlesworth 1994; Hudson and Kaplan 1994, 1995a; Nordborg et al. 1996). The size of this reduction depends upon the recombination rate, which determines the extent to which each site is linked to potentially deleterious mutations. This effect is captured by a simple analytic formula showing how Ne depends upon mutation rates, selection strengths, and recombination rates and has been widely used to interpret patterns of molecular evolution (Hudson and Kaplan 1995b; Charlesworth 2013).
However, it has long been recognized that in addition to overall reductions in diversity, purifying selection also distorts the shapes of genealogies (Charlesworth et al. 1993, 1995; Zeng and Charlesworth 2011). These distortions arise because purifying selection does not act instantaneously, and hence deleterious mutations can persist transiently in the population, lengthening coalescence times in the recent past relative to those in the distant past (Williamson and Orive 2002; Barton and Etheridge 2004). A number of recent studies have addressed these distortions in the completely nonrecombining (asexual) case (O’Fallon et al. 2010; Seger et al. 2010; Nicolaisen and Desai 2012; Walczak et al. 2012; see Charlesworth 2013 for review). However, very little is quantitatively known about the shape and magnitude of these distortions in the presence of recombination.
To address this question, Zeng and Charlesworth (2011) recently developed a structured coalescent algorithm to simulate genealogies in the presence of purifying selection with recombination, analogous to the asexual structured coalescent (Hudson and Kaplan 1994). They used this method to analyze distortions in statistics such as the mean coalescence time and the ratio of external branch length to total branch length. This approach makes it possible to rapidly simulate any statistic describing the shape of genealogies, including those involving multiple sites (e.g., the correlation in coalescence times at two sites). Although this approach is valid only for sufficiently strong selection, it has led to many novel conclusions and offers great promise as a useful practical tool.
However, despite these advantages, one of the main difficulties of simulation-based methods is that they cannot provide simple analytical insight into how distortions in genealogies depend upon the relevant parameters, and it is thus difficult to incorporate results into practical inference or estimation methods. In this article, we show that the distortions in genealogies may be described by a neutral population with a time-dependent effective population size Ne(t), and we compute a simple analytical formula describing how this Ne(t) depends upon mutation rates, selection strengths, and recombination rates. Our approach is closely related to our earlier analysis of the effects of purifying selection in completely nonrecombining regions (Nicolaisen and Desai 2012), and many of our results are closely analogous, demonstrating that many of the effects of selection in asexual populations remain qualitatively similar in the presence of substantial recombination.
Our analysis is limited to describing genealogies at a single site and is valid only provided purifying selection and recombination are sufficiently strong. Thus, it is unable to describe the topological distortions in genealogies that begin to appear as selection and recombination become weaker. However, despite these limitations, our results show that the effects of strong purifying selection and recombination may be described by a time-varying population size and explicitly describe the analytical dependence of this time-varying population size on the underlying parameters. This result can therefore be directly incorporated into preexisting neutral methods of inference and estimation in a time-varying population to describe or infer the effects of selection and recombination. As we will see, it is also straightforward to incorporate the effects of variation in selection strengths across sites into our analysis.
We begin in the next section by describing our model, which is closely related to earlier studies of background selection with recombination (Charlesworth et al. 1993; Hudson and Kaplan 1994, 1995a,b; Nordborg et al. 1996). We focus on a single focal site in a randomly sampled individual, and we trace that individual’s ancestral history backward in time. We calculate the probability that a single linked site carries a deleterious mutation as a function of time in the past. In general, selection acts against individuals carrying deleterious mutations, such that the probability an ancestor carried such a mutation decreases as we look farther into the past. We refer to this probability as the “ancestral fitness distribution”, and we use this to calculate the probability that two individuals contain the same set of deleterious mutations across all linked sites. This calculation relies upon the key assumption that we may treat the ancestral fitness distribution at each site as independent (Supporting Information, File S1). Finally, we use this to calculate the probability of coalescence over time and thus Ne(t).
Analysis
We consider a haploid population of N individuals. For simplicity, throughout most of our analysis we assume that each site experiences deleterious mutations at rate μ to an allele carrying selective cost s. In a section below, we show how our results can be straightforwardly generalized to the case where each site has an arbitrary mutation rate and selection coefficient. Throughout, we assume that there is no epistasis and that fitnesses combine multiplicatively, so that an individual with k deleterious mutations has fitness (1 − s)k. We note that this haploid model is analogous to that of Zeng and Charlesworth (2011) and is closely related to earlier diploid models of purifying selection and recombination (Charlesworth et al. 1993; Hudson and Kaplan 1994, 1995a,b; Nordborg et al. 1996)—resulting equations can be compared with simple modifications.
The ancestral fitness distribution
We consider a single individual, randomly sampled from the population. We wish to trace the ancestral history of that individual at a single focal site backward in time, to calculate the probability that the ancestor carries a mutation at a particular linked site (referred to as the “index site”), as a function of time in the past.
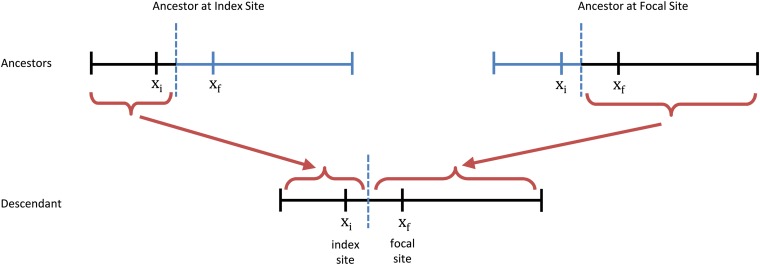
In the present, we know that the probability an individual carries a deleterious mutation at a particular site is given by the classical mutation–selection balance result, pmut = μ/s (Kimura and Maruyama 1966; Haigh 1978). However, there are two types of events that may occur in the ancestral history. First, a deleterious mutation may occur, which will move the ancestor from the mutant state into the nonmutant state. This will occur at rate , where we have neglected terms of higher order in μ/s. Second, a recombination event may occur between the index and focal sites at rate r(xi, xf), where xi denotes the index site and xf denotes the focal site. When a recombination event separates the focal site from the index site, the ancestor at the index site is randomly chosen from the population (Figure 1). Thus, the ancestor will carry a mutation with probability pmut = μ/s. Writing this out, we have that
where Pmut(t) is the probability the ancestral lineage carries a deleterious mutation at the index site at time t. We note that we have neglected the effects of back mutations, which introduce terms of higher order in μ/s. However, it is straightforward to include these terms (see File S2). Solving the above differential equation, we have that the ancestral fitness distribution is simply
| (1) |
Figure 1.
A recombination event in an ancestral lineage. Each parent has part of the genome ancestral to the descendant lineage (black); these have an ancestral fitness distribution unaffected by the recombination event. The nonancestral parts of the parental genomes (blue) are effectively sampled at random from the population and hence have a fitness distribution reflective of the steady-state mutation–selection balance. Throughout this article, we focus only on the genealogies at a single focal site xf and hence track only the parent with the ancestral sequence at this site (right branch).
We note that Equation 1 allows for recombination rates to vary in any arbitrary way across the genome. However, to illustrate our main results, it is often helpful to make the simplifying assumption that recombination occurs at constant per-site rate r. In this case, denoting x ≡ |xf − xi|, Equation 1 reduces to
| (2) |
For clarity we use this simpler expression throughout most of our subsequent analysis, but we note that our results can all be generalized to account for the effects of variation in recombination rates by replacing Equation 2 with Equation 1 throughout.
Intuitively, Equation 2 reflects the fact that sites far from the focal site will typically recombine away more frequently and hence have an ancestral fitness distribution that is closer to that given by the steady-state mutation–selection balance, μ/s. By contrast, sites very close to the focal site are unlikely to recombine away, and the ancestral lineage at these sites is biased to be more fit than average. The distance is the boundary between these two regimes and represents the natural length scale on which the effects of selection are diminished. On distances small compared to L∗, the ancestral fitness distribution is comparable to the nonrecombining case, since recombination occurs very infrequently compared to selection. By contrast, on distances large compared to L∗, recombination occurs so rapidly that selection does not have time to remove mutations from the ancestral lineage before it is reset by recombination.
We note that, in analogy with earlier work on background selection with recombination, as well as the structured coalescent method of Zeng and Charlesworth (2011), this derivation assumes that all sites may be treated deterministically. This approximation will be reasonable provided no individual lineage becomes a significant fraction of the population (or, analogously, if the typical timescale on which deleterious mutations are removed form the population is short relative to the population size), which holds when . When this approximation breaks down, mutant lineages may grow to a significant fraction of the total population, and our results will no longer accurately capture the ancestral fitness distribution.
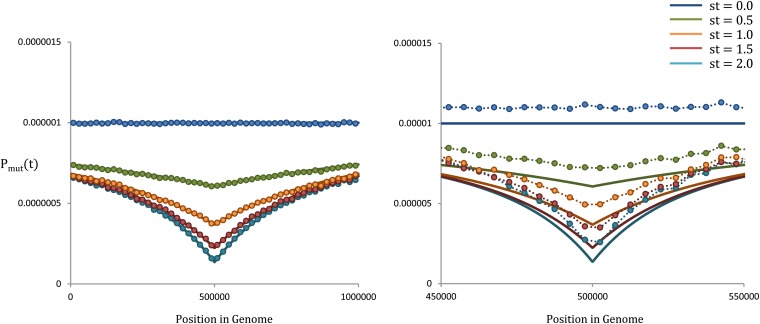
We compare our theoretical result in Equation 2 with forward-time simulations in Figure 2. We compare the ancestral fitness distribution at five different ancestral time points, in two different parameter regimes. We see that for strong selection/recombination, Equation 2 accurately describes the ancestral fitness distribution at each time point, as predicted. By contrast, when selection and/or recombination become weaker, we see that our Equation 2 systematically overestimates the ancestral fitness. Thus, as expected, our results become less accurate as Nes becomes small and the deterministic approximation breaks down. This is a consequence of fluctuations: as the strong-selection/recombination condition breaks down, mutant lineages may occasionally grow to a substantial fraction of the population. This will systematically bias mean mutation probabilities to higher values. As we will later see, despite these events, we will still be able to accurately predict the shape of genealogies as the strong-selection/recombination condition begins to be violated. However, strong violations of this condition will cause our results to break down by introducing additional distortions that we are not able to address.
Figure 2.
The ancestral fitness distribution as a function of position. In both left and right, μ = 10−8, N = 104, and r = 4 × 10⁻⁸. The focal site is located at the center of a genome of length L = 106. Our theoretical results are shown as solid lines, while the simulations are represented with circles. On the left, s = 10−2, such that . On the right, s = 10−3, such that . We see that as Nes becomes smaller, the deterministic approximation begins to break down, and fluctuations in the population occasionally allow lineages carrying deleterious mutations to become a large fraction of the population. This, in turn, leads to less-fit ancestral lineages than predicted by our theoretical results.
We note that in deriving Equation 2, we have assumed a continuous approximation that requires the per-generation rate of recombination to be small (rx ≪ 1). This will be strictly valid only if the total genome-wide recombination rate is small, rL ≪ 1. However, in practice, our result will still be valid even when rL > 1, since only sites close to the focal site contribute to the effects of selection on genealogies. To be specific, only sites within x ≲ L∗ of the focal site are significantly affected by selection, so Equation 2 will in fact be roughly valid provided only that rL∗ ≈ s ≪ 1, which we generally expect to hold. In a similar vein, instead of approximating r(x) = rx, it would be more appropriate to use a mapping function such as the Haldane formula, (Haldane 1919). However, this is also roughly equivalent to our approximation within the relevant range, provided only that s ≪ 1. This was earlier noted by Nordborg et al. (1996), who observed that the choice of mapping function was not significant since only closely linked sites contribute to the effects of selection.
We have derived an ancestral fitness distribution, which captures the probability that the ancestor of an individual will have a mutation at a particular site in the past. We now use this ancestral fitness distribution to calculate the probability that two or more individuals share the same set of mutations, which will enable us to calculate the probability of coalescence as a function of time.
The effective population size
When two ancestral lineages have the same set of mutations across all sites (i.e., they are in the same “configuration”), they coalesce with per-generation probability 1/Nconfig, where Nconfig is the total number of individuals in that configuration. Thus the probability that two arbitrary ancestral lineages coalesce a time t in the past is the probability they exist in the same configuration divided by the number of individuals in that configuration,
As in earlier work on background selection with recombination, provided the deterministic approximation holds and μ/s ≪ 1, we may treat each site as independent (see File S1 for further details about this approximation). We then have
where we have neglected terms of order or higher. As before, it is possible to keep this entirely general, allowing the focal site to be at any position along a genome of arbitrary length. However, to illustrate our results, we assume that the focal site is located at the center of a genome of length L. Approximating the sum as an integral, this becomes
Carrying out the integral, we find
| (3) |
where we have defined rL ≡ R and μL ≡ Ud. Although we derived this result by considering a sample of size two, we arrive at the same Ne(t) for arbitrary sample sizes provided we may treat lineages as independent and exchangeable. This assumption holds provided the typical timescale for backward-in-time mutation events is short relative to the typical coalescence time [e.g., when , where n is the sample size]. We note that this condition becomes more restrictive for larger samples, but provided it holds, the coalescence probabilities are described by the Ne(t) given above.
We see from Equation 3 that in the recent past, the effective population size is simply Ne(0) = N. However, as time recedes into the past, the ancestral lineages become biased toward more fit configurations and are correspondingly more likely to coexist in the same configuration concurrently. This implies that the rate of coalescence increases with time. As t→∞, our results reduce to , the haploid version of the original background selection result.
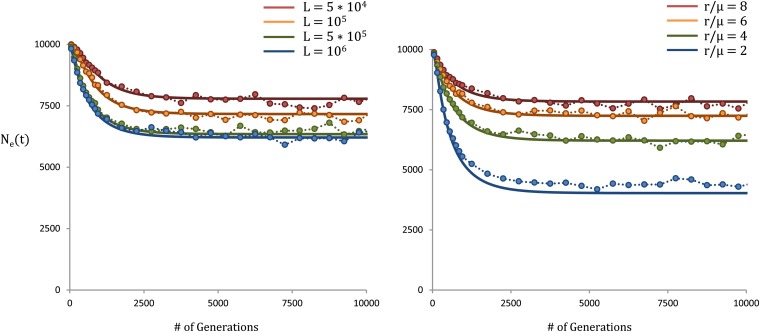
We compare our result for Ne(t) in Equation 3 with forward-time simulations in Figure 3, as a function of genome size and recombination rate. Figure 3 illustrates the significant period of transition from the larger Ne in the recent past, prior to reaching the long-term result, which results in distortions in the shapes of genealogies. The agreement is generally good, but we note that for smaller recombination rates our analysis systematically underestimates Ne(t). This is a consequence of the deterministic approximation breaking down as the recombination rate decreases, leading to strong fluctuations in the population.
Figure 3.
Effective population size as a function of time. In both left and right, μ = 10−8, s = 10−3, and N = 104. Our theoretical results are shown as solid lines, while the simulations are represented with circles. On the left, r = 4 × 10⁻⁸ and L varies from 5 × 10⁴ to 106, such that varies from 6.2 to 7.8. On the right, L = 106 and r/μ varies from 2 to 8, such that varies from 4.0 to 7.8. The agreement is generally good, however, as seen on the right, as the recombination rate decreases and Nes falls off, the deterministic approximation begins to break down, and our results become less accurate.
Our results differ from the classical background selection results by incorporating the transient period during which deleterious alleles may segregate in the population prior to being removed. The timescale of this transition period is, roughly, of order 1/s generations. In the deterministic regime, we have assumed that Nes ≫ 1, such that this transition period is, by definition, short relative to the typical coalescence times. However, despite this, as seen in Figure 3, by accounting for this transition period we are able to capture a significant deviation from the classical result. This deviation is ultimately a primary source of the distortions we expect to see in genealogies, and thus our results are able to show how selection can lead to distortions in genealogies and in genealogical statistics and how these effects depend upon the parameters involved. However, we note that our analysis is restricted to addressing the distortions that arise due to this transient period—when the deterministic approximation breaks down, fluctuations in the population become significant and lead to further distortions, including topological distortions, which our analysis is not able to capture.
Coalescence times and other single-site statistics
Our result for Ne(t) leads immediately to an expression for the distribution of times to the next coalescence event in a sample of size n,
| (4) |
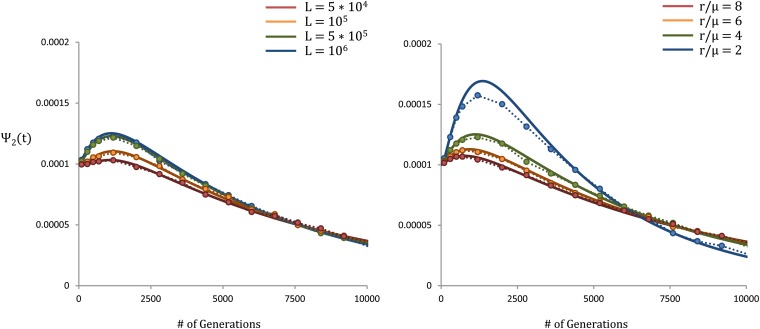
We compare this prediction to forward-time simulations for a sample of two individuals in Figure 4; we see that there are significant distortions introduced by the time dependence of Ne(t), which lead to a nonzero peak in the distribution of coalescence times.
Figure 4.
Coalescence probability as a function of time for a sample of size two. In both left and right, μ = 10−8, s = 10−3, and N = 104. Our theoretical results are shown as solid lines, while the simulations are represented with circles. On the left, r = 4 × 10⁻⁸ and L varies from 5 × 10⁴ to 106, such that varies from 6.2 to 7.8. On the right, L = 106 and r/μ varies from 2 to 8, such that varies from 4.0 to 7.8.
Using the distributions of coalescence times, we can calculate various statistics describing genetic diversity. For example, the distribution of pairwise heterozygosity at a neutral focal site is given by
| (5) |
In contrast, if the site is a selected site, then we have from Equation 2 that the probability the ancestor carries a deleterious mutation is . Backward in time, an individual carrying such a mutation will undergo a deleterious mutation from the nonmutant state at rate . Thus, the backward-in-time mutation rate is simply μe−st (Nicolaisen and Desai 2012). Therefore, we can estimate that
| (6) |
Using similar logic, we can explicitly calculate more complex statistics, using neutral methods incorporating a time-varying population size. For example, the mean time to the most recent common ancestor may be calculated using Equation 4 of Austerlitz et al. (1997), and arbitrary moments of the total branch length may be calculated using Equation 20 of Eriksson et al. (2010). Similarly, if the focal site is a neutral site, the site frequency spectrum may be calculated using Equation 2 of Polanski and Kimmel (2003).
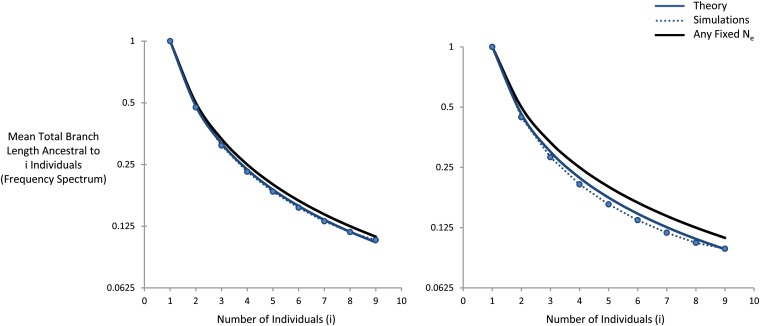
This approach is illustrated in Figure 5. Here, we consider the total lengths of branches ancestral to i individuals in a sample of size 10 (normalized by the length of branches ancestral to 1 individual). We compare forward-time simulations (represented by circles) with our theoretical result. For comparison, we also show the result expected for any fixed effective population size. We see that there is a noticeable deviation from the neutral expectation, characterized by an excess of rare branch lengths relative to more common branches.
Figure 5.
Total branch length ancestral to i individuals for a sample of size 10. In both left and right, μ = 10−8, s = 10−3, r/μ = 4, and N = 104. On the left, L = 2.5 × 10³, such that [compared to ]. On the right, L = 200 × 103, such that . Our theoretical result is shown as a solid line, while the simulations are represented with circles. The fixed effective population size result is shown as a solid black line.
If the focal site is a neutral site, mutations occur uniformly along the branch lengths. Thus, our result in Figure 5 would be directly analogous to the site frequency spectrum and implies an excess of rare alleles relative to common ones. In contrast, if the focal site is a selected site, deleterious mutations occur at a backward-in-time rate of μe−st. In this case, deleterious mutations will be further biased toward recent branches, leading to an even more pronounced excess of rare alleles relative to common ones. To understand the expected frequency spectrum in this case, or to calculate any other complicated genealogical statistic, we can implement purely neutral and nonrecombining coalescent simulations that account for the effects of selection and recombination simply by using the appropriate Ne(t).
Incorporating a distribution of fitness effects
Our analysis can be easily extended to account for variation in recombination rates, mutation rates, and selection coefficients across the genome. Using the same logic described above, we find that in this more general case the time-dependent effective population size is given by
| (7) |
where μ(xi) and s(xi) are the mutation rate and the selection coefficient at site xi, respectively, and r(xi, xf) is the total recombination rate between xi and the focal site xf. When t → ∞, this reduces to the classical background selection result (Hudson and Kaplan 1995b; Charlesworth 1996; Nordborg et al. 1996; Loewe and Charlesworth 2007).
A particularly interesting case is the situation where mutation and recombination rates are constant across the genome, but each selected site has a fitness effect drawn from some distribution ρ(s). In this case, we find
| (8) |
We note that this result assumes that lineages can be treated deterministically, which requires that no lineage become a significant fraction of the total population, and thus Nes ≫ 1. Thus, we expect Equation 8 to hold only when the bulk of the mutations are either in this regime, Nesi ≫ 1, or nearly neutral, Nesi ≪ 1. Although our analysis is still reasonable when a small number of mutations exist in the intermediate regime, it requires that the bulk of the deviation from neutrality satisfies the strong-selection/recombination condition, such that these mutations of intermediate effect can be neglected. This issue was also addressed in earlier work considering a distribution of fitness effects (see, e.g., Nordborg et al. 1996).
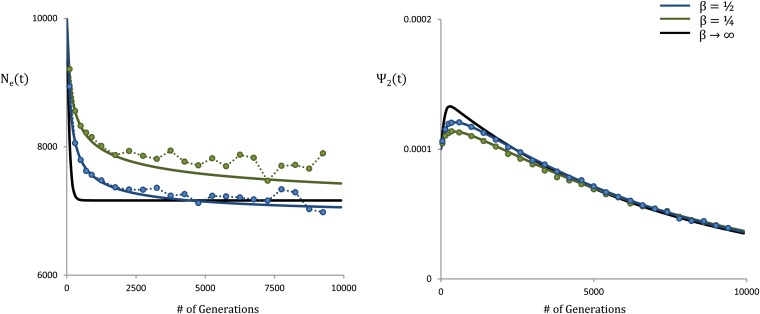
Several recent studies have suggested that the distribution of deleterious fitness effects in humans and Drosophila may be characterized by a gamma distribution with shape parameter β < 1. For example, Keightley and Eyre-Walker (2007) estimated a shape parameter of β ∼ 0.2 for human populations and β ∼ 0.35 for Drosophila. Motivated by these findings, we compare our theoretical results in Equation 8 with forward-time simulations for two populations with gamma distributions of fitness effects, using shape parameters of 0.5 and 0.25, in Figure 6. For reference, we also show the theoretical result expected under a single-s case, where s is the mean fitness effect. We see that our results accurately characterize the time dependence of the effective population size under a distribution of fitness effects.
Figure 6.
Effective population size and coalescence times for a distribution of fitness effects. The blue curve shows a gamma distribution with shape parameter and mean s∗ = 10−2. The green curve shows a gamma distribution with shape parameter and mean s∗ = 10−2. The circles represent forward-time simulations, while solid lines represent our theoretical results from Equation 8. The black line shows our theoretical results in the single-s case with s = s∗. The parameters are N = 104, u = 10−8, L = 106, and r/μ = 4.
Incorporating temporal variation in the population size
A key feature of our analysis is that, within this deterministic regime, the dynamics of ancestral lineages are independent of the population size. The implication of this is that the ancestral fitness distribution in Equation 2 is independent of the population size, and thus Equation 3 depends only upon an overall multiplication by N. This phenomenon was recently discussed in Zeng (2012) and was used as the basis for incorporating a changing population size into structured coalescent simulations. Similarly, we can incorporate a changing population size into our analysis, simply by replacing N with N(t) in our Equation 3.
We caution, however, that this framework implicitly assumes that the population remains in mutation–selection balance throughout its history and is characterized by the same mutation rates, recombination rates, and selection coefficients throughout. If these other parameters are also changing with time, this will not hold. Similarly, the strong-selection/recombination condition must hold throughout the timescale of coalescence.
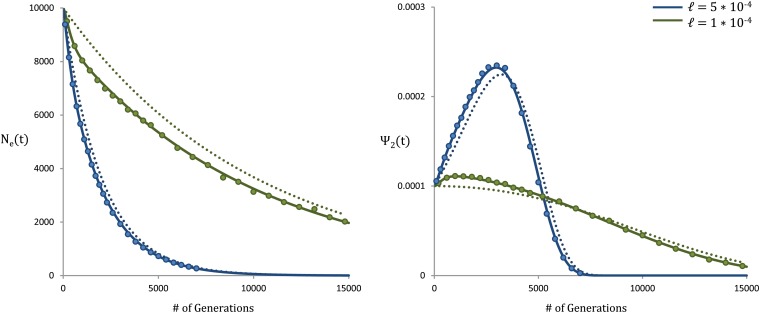
To illustrate this, in Figure 7 we compare forward-time simulations for a population experiencing exponential growth N(t) = Ne−ℓt (with t measured backward in time from the present) with our theoretical results from Equation 3. For reference, we include the predicted theoretical result in the absence of selection.
Figure 7.
Effective population size and coalescence times for an exponentially growing population. The blue curves represent an exponentially growing population with growth rate ℓ = 5 × 10⁻⁴. The green curves represent an exponentially growing population with growth rate ℓ = 1 × 10⁻⁴. The circles represent forward-time simulations, while solid lines represent our theoretical results from Equation 3 with N replaced by N(t) = Ne−ℓt. The dotted lines represent the predictions under a neutral model. The parameters are N = 104, s = 0.003, Ud = 0.0005, and R/Ud = 4.
Forward-time simulations
Our forward-time simulations are closely modeled off those of Zeng and Charlesworth (2011). Specifically, we simulate a haploid population of constant size N, with a genome of length L. Each generation, we introduce a Poisson-distributed number of new deleterious mutations uniformly throughout the population, with mean NUd. We then simulate reproduction, introducing a Poisson-distributed number of recombination events uniformly throughout the population. For any nonrecombinant offspring, one ancestor is chosen, weighted according to its fitness. For recombinant offspring, two ancestors are chosen, again weighted according to their fitnesses. The appropriate number of breakpoints is randomly chosen along the genome, and one of the two resulting genotypes is randomly selected as the offspring. These steps are repeated each generation.
We note that one key difference between our simulations and those of Zeng and Charlesworth (2011) is that we allow multiple recombination events to occur within a single individual. This makes it possible to consider the L → ∞ limit, where multiple recombination events become common. We ran all simulations for a minimum of at least 10N generations to achieve equilibrium. When incorporating a distribution of fitness effects, we chose the fitness effect at each site according to the fitness distribution ρ(s). At least 10,000 trials were completed for each parameter regime.
Discussion
Our analysis demonstrates that the effects of strong purifying selection and recombination can be summarized in terms of a time-dependent effective population size, Ne(t). This Ne(t) characterizes the distortions we expect to see in genealogies and can be used as the basis for quick and efficient methods to analyze single-site statistics. It illustrates how these statistics depend upon parameters such as the selection coefficient, position in the genome, and variation in the recombination rate.
Our results extend earlier work that summarized the effects of purifying selection and recombination by using a reduced but constant effective population size (Charlesworth et al. 1993; Hudson and Kaplan 1995b). The simplicity of this earlier result has made it broadly useful in interpreting patterns in sequence data—for example, in determining whether background selection can be responsible for observed relationships between diversity and local recombination rates in humans and Drosophila (Hudson and Kaplan 1995b). Our analysis represents the simplest analytical extension of this earlier work that can describe distortions from neutrality in addition to overall reductions in diversity.
By summarizing these effects in a time-dependent effective population size, our approach makes it possible to continue to use neutral methods for inference and estimation even in the presence of background selection, simply by allowing the population size to vary appropriately with time. For example, our results could be used in combination with a recent method developed by O’Fallon (2011) to incorporate a time-varying coalescent rate into genealogy samplers as a means to improve genealogical inference. This method considered a coalescence rate that declines linearly as time recedes into the past, but by instead incorporating the Ne(t) we have calculated here, we can incorporate background selection and recombination into this and other existing neutral methods in a principled way.
We note that the Ne(t) derived here is very similar to the purely nonrecombining case we analyzed in earlier work (Nicolaisen and Desai 2012). In both cases, Ne(t) begins at the actual population size in the present and then declines into the past before eventually reaching a long-term reduced size, Ne(∞). Although the explicit form of the Ne(t) depends on the recombination rate, its qualitative features are similar to and lead to similar distortions to the asexual case. This similarity suggests that the general conclusions of earlier analyses of background selection in the nonrecombining case may often be qualitatively robust to the presence of recombination.
The reasons for this qualitative similarity (and the extent to which it holds) remain an open question. One appealing possibility is that local, closely linked genomic regions can be treated as effectively nonrecombining blocks, while loci separated by larger distances can be treated as freely recombining. Thus, a recombining population would be analogous to an asexual population with a particular “block length”, which would depend upon the strength of selection and the recombination rate. However, there are several problems with this intuition. In particular, it is not clear that there is a sufficiently sharp transition between regions that are effectively nonrecombining and those that are effectively freely recombining. Furthermore, the size of the effective block length may typically depend upon other parameters (such as the sample size).
We can naively attempt to quantify this similarity between a recombining population and an asexual population: if we define an effective genome size L∗ (the “effectively nonrecombining block length”, such that ) and an effective selection strength s∗, then by demanding that the long-term effective population size Ne(∞) and the typical transition time to this long-term result are equivalent between the two populations, we arrive at
Using these effective parameters, we find a close (though not identical) match between our results and those of the corresponding asexual model. However, it is not clear whether this rough equivalence or the effective parameters L∗ and s∗ have any predictive power beyond the statistics we have used here to define them. This remains an important topic for future work.
We note that our analysis rests on the assumption that mutation frequencies can be treated deterministically and that ancestral lineages can be treated independently. The implication of this latter assumption is that all pairs of lineages are considered independent and exchangeable, independent of the history of the sample. A consequence of this assumption is that, since all pairs of lineages are equally likely to coalesce, genealogies will be topologically neutral. As selection becomes weaker and these assumptions are violated, correlations between the lineages become important, topological distortions will arise, and our analysis breaks down. Furthermore, when this begins to occur, fluctuations in the sizes of lineages become very significant, and the deterministic assumption is also violated. Thus, methods capable of describing these fluctuations are required to fully understand the effects of purifying selection and recombination in the weak selection regime. Very little is currently known about this regime, which is an important direction for future work.
We note that recent work has begun to address these fluctuations and the effects of weak purifying selection, but only in the purely asexual case. For example, (O’Fallon et al. 2010) developed a semianalytical approach to understand these effects in the Ns ≈ 1 regime. Their approach is to divide the population into a continuous distribution of fitness classes and calculate a corresponding ancestral fitness distribution and, in turn, coalescent rate. An alternative approach by Good et al. (2013) has suggested that the effects of many weakly selected mutations on sequence diversity are identical to the effects of fewer strongly selected mutations, making it possible to “map” weakly selected populations onto their equivalent strongly selected counterparts. An important question for future work is whether these weak selection methods may be extended to include recombination. A detailed understanding of the “effective” similarity between asexual and recombining populations, hinted at by our results, may potentially provide a way forward, by suggesting that these new asexual methods might also apply in the presence of recombination, with a suitable reinterpretation of the parameters.
Supplementary Material
Acknowledgments
We thank Benjamin Good for many useful discussions. This work was supported by the James S. McDonnell Foundation, the Harvard Milton Fund, and the Alfred P. Sloan Foundation. L.E.N. is supported by the Department of Defense through the National Defense Science and Engineering Graduate Fellowship Program. Simulations were run on the Odyssey cluster supported by the FAS Sciences Division Research Computing Group at Harvard University.
Footnotes
Communicating editor: Y. S. Song
Literature Cited
- Austerlitz F., Jung-Muller B., Godelle B., Gouyon P.-H., 1997. Evolution of coalescence times, genetic diversity and structure during colonization. Theor. Popul. Biol. 51(2): 148–164. [Google Scholar]
- Barton N. H., Etheridge A. M., 2004. The effect of selection on genealogies. Genetics 166: 1115–1131. [DOI] [PMC free article] [PubMed] [Google Scholar]
- Charlesworth B., 1994. The effect of background selection against deleterious mutations on weakly selected, linked variants. Genet. Res. 63: 213–227. [DOI] [PubMed] [Google Scholar]
- Charlesworth B., 1996. Background selection and patterns of genetic diversity in Drosophila melanogaster. Genet. Res. 68(2): 131–150. [DOI] [PubMed] [Google Scholar]
- Charlesworth B., 2012. The effects of deleterious mutations on evolution at linked sites. Genetics 190: 5–22. [DOI] [PMC free article] [PubMed] [Google Scholar]
- Charlesworth B., 2013. Background selection 20 years on: The Wilhelmine E. Key 2012 invitational lecture. J. Hered. 104: 161–171. [DOI] [PubMed] [Google Scholar]
- Charlesworth B., Morgan M., Charlesworth D., 1993. The effect of deleterious mutations on neutral molecular variation. Genetics 134: 1289. [DOI] [PMC free article] [PubMed] [Google Scholar]
- Charlesworth D., Charlesworth B., Morgan M. T., 1995. The pattern of neutral molecular variation under the background selection model. Genetics 141: 1619–1632. [DOI] [PMC free article] [PubMed] [Google Scholar]
- Eriksson A., Mehlig B., Rafajlovic M., Sagitov S., 2010. The total branch length of sample genealogies in populations of variable size. Genetics 186: 601–611. [DOI] [PMC free article] [PubMed] [Google Scholar]
- Good, B. H., A. M. Walczak, R. A. Neher, and M. M. Desai, 2013 Interference limits resolution of selection pressures from linked neutral diversity. arXiv:1306.1215. Available at: http://arxiv.org/abs/1306.1215.
- Haddrill P., Loewe L., Charlesworth B., 2010. Estimating the parameters of selection on nonsynonymous mutations in Drosophila pseudoobscura and D. miranda. Genetics 185: 1381–1396. [DOI] [PMC free article] [PubMed] [Google Scholar]
- Haigh J., 1978. The accumulation of deleterious genes in a population—Muller’s ratchet. Theor. Popul. Biol. 14: 251–267. [DOI] [PubMed] [Google Scholar]
- Haldane J., 1919. The combination of linkage values and the calculation of distances between the loci of linked factors. J. Genet. 8(29): 309–320. [Google Scholar]
- Hudson, R., and N. Kaplan, 1994 Gene trees with background selection, pp. 140–153 Non-Neutral Evolution: Theories and Molecular Data, edited by B. Golding. Chapman & Hall, New York. [Google Scholar]
- Hudson R., Kaplan N., 1995a The coalescent process and background selection. Philos. Trans. R. Soc. Lond. B Biol. Sci. 349(1327): 19–23. [DOI] [PubMed] [Google Scholar]
- Hudson R., Kaplan N., 1995b Deleterious background selection with recombination. Genetics 141: 1605–1617. [DOI] [PMC free article] [PubMed] [Google Scholar]
- Keightley P., Eyre-Walker A., 2007. Joint inference of the distribution of fitness effects of deleterious mutations and population demography based on nucleotide polymorphism frequencies. Genetics 177: 2251–2261. [DOI] [PMC free article] [PubMed] [Google Scholar]
- Kimura M., Maruyama T., 1966. The mutational load with epistatic gene interactions in fitness. Genetics 54: 1337. [DOI] [PMC free article] [PubMed] [Google Scholar]
- Loewe L., Charlesworth B., 2007. Background selection in single genes may explain patterns of codon bias. Genetics 175: 1381–1393. [DOI] [PMC free article] [PubMed] [Google Scholar]
- Lohmueller K., Albrechtsen A., Li Y., Kim S., Korneliussen T., et al. , 2011. Natural selection affects multiple aspects of genetic variation at putatively neutral sites across the human genome. PLoS Genet. 7(10): e1002326. [DOI] [PMC free article] [PubMed] [Google Scholar]
- McVicker G., Gordon D., Davis C., Green P., 2009. Widespread genomic signatures of natural selection in hominid evolution. PLoS Genet. 5(5): e1000471. [DOI] [PMC free article] [PubMed] [Google Scholar]
- Nicolaisen L., Desai M., 2012. Distortions in genealogies due to purifying selection. Mol. Biol. Evol. 29: 3589–3600. [DOI] [PubMed] [Google Scholar]
- Nordborg M., Charlesworth B., Charlesworth D., 1996. The effect of recombination on background selection. Genet. Res. 67: 159–174. [DOI] [PubMed] [Google Scholar]
- O’Fallon B., 2011. A method for accurate inference of population size from serially sampled genealogies distorted by selection. Mol. Biol. Evol. 28(11): 3171–3181. [DOI] [PMC free article] [PubMed] [Google Scholar]
- O’Fallon B., Seger J., Adler F., 2010. A continuous-state coalescent and the impact of weak selection on the structure of gene genealogies. Mol. Biol. Evol. 27(5): 1162. [DOI] [PMC free article] [PubMed] [Google Scholar]
- Polanski A., Kimmel M., 2003. New explicit expressions for relative frequencies of single-nucleotide polymorphisms with application to statistical inference on population growth. Genetics 165: 427–436. [DOI] [PMC free article] [PubMed] [Google Scholar]
- Seger J., Smith W. A., Perry J. J., Hunn J., Kaliszewska Z. A., et al. , 2010. Gene genealogies strongly distorted by weakly interfering mutations in constant environments. Genetics 184: 529–545. [DOI] [PMC free article] [PubMed] [Google Scholar]
- Walczak A. M., Nicolaisen L. E., Plotkin J. B., Desai M. M., 2012. The structure of genealogies in the presence of purifying selection: A “fitness-class coalescent”. Genetics 190: 753–779. [DOI] [PMC free article] [PubMed] [Google Scholar]
- Williamson S., Orive M., 2002. The genealogy of a sequence subject to purifying selection at multiple sites. Mol. Biol. Evol. 19(8): 1376. [DOI] [PubMed] [Google Scholar]
- Zeng K., 2012. A coalescent model of background selection with recombination, demography and variation in selection coefficients. Heredity 110: 363–371. [DOI] [PMC free article] [PubMed] [Google Scholar]
- Zeng K., Charlesworth B., 2011. The joint effects of background selection and genetic recombination on local gene genealogies. Genetics 189: 251–266. [DOI] [PMC free article] [PubMed] [Google Scholar]
Associated Data
This section collects any data citations, data availability statements, or supplementary materials included in this article.


