

Background: G protein-coupled receptors (GPCRs) interact with regulator of G protein signaling (RGS) proteins, but the mechanistic/physiological importance is unclear.
Results: A GPCR-RGS interaction is mapped that localizes RGS to the plasma membrane, a requirement for physiological signaling.
Conclusion: The interaction spatially regulates RGS activity to the activated GPCR.
Significance: Compartmentalized RGS activity could be a novel mechanism for modulating numerous GPCR signaling pathways.
Keywords: Cell Compartmentation, Cell Signaling, G Protein-coupled Receptors (GPCR), GTPase, Kinetics, Mathematical Modeling, RGS Proteins, Signal Transduction
Abstract
G protein-coupled receptors (GPCRs) can interact with regulator of G protein signaling (RGS) proteins. However, the effects of such interactions on signal transduction and their physiological relevance have been largely undetermined. Ligand-bound GPCRs initiate by promoting exchange of GDP for GTP on the Gα subunit of heterotrimeric G proteins. Signaling is terminated by hydrolysis of GTP to GDP through intrinsic GTPase activity of the Gα subunit, a reaction catalyzed by RGS proteins. Using yeast as a tool to study GPCR signaling in isolation, we define an interaction between the cognate GPCR (Mam2) and RGS (Rgs1), mapping the interaction domains. This reaction tethers Rgs1 at the plasma membrane and is essential for physiological signaling response. In vivo quantitative data inform the development of a kinetic model of the GTPase cycle, which extends previous attempts by including GPCR-RGS interactions. In vivo and in silico data confirm that GPCR-RGS interactions can impose an additional layer of regulation through mediating RGS subcellular localization to compartmentalize RGS activity within a cell, thus highlighting their importance as potential targets to modulate GPCR signaling pathways.
Introduction
A wide variety of external signals are detected through the use of G protein-coupled receptor (GPCR)3 signaling pathways to control essential cellular processes. Most GPCRs share a common signaling mechanism of coupling to and activating G proteins, which propagate the signaling reaction (1, 2). GPCRs couple to a heterotrimeric G protein complex consisting of a nucleotide binding Gα subunit and a Gβγ dimer. Agonist binding to the GPCR promotes nucleotide exchange on Gα, such that GDP is replaced with GTP, resulting in dissociation of the heterotrimer and downstream effector activation (3, 4). Whether the G protein is in the GTP- or GDP-bound state and for how long determines the extent of signal that will be transmitted through the pathway (5) and therefore requires tight regulation.
Crucial regulatory molecules influencing the nucleotide-bound state of Gα subunits are the regulators of G protein signaling (RGS) proteins. These can increase rates of intrinsic GTP hydrolysis on Gα subunits by up to 2000-fold (6), therefore playing a pivotal role in determining the strength and duration of a G protein signaling response. RGS proteins are defined by the presence of a highly conserved 120-amino acid RGS domain that accelerates GTP hydrolysis either by stabilizing the intermediate transition state (7) or by destabilizing the active state. Hydrolysis is promoted by contact of the RGS domain with Switch regions of the Gα subunit. G proteins typically only activate downstream effectors when in their GTP-bound state; therefore, because RGS proteins enhance hydrolysis to the inactive GαGDP conformation, they are commonly regarded as negative regulators of signaling. However, in some cases, RGS proteins can have a positive effect on signal potentiation (8) (e.g. through kinetic scaffolding (9), whereby the rapid kinetics associated with GPCR-mediated GTP binding and GTPase-activating protein (GAP)-accelerated hydrolysis allows greater interaction time between the G protein and the receptor than possible collision coupling mediated via passive diffusion (5)).
Altered subcellular localization of RGS proteins to attenuate signal following activation can provide additional regulation. Sometimes spatial distribution is constant, whereas at other times it is dynamic to regulate interactions with the G protein and other signaling components. Despite interacting with signaling molecules that commonly reside at the plasma membrane, many RGS proteins are localized to the cytosol and the nucleus (10). Controlling membrane localization of RGS proteins therefore presents another mechanism for modulation of signaling. Some cellular mechanisms contributing to RGS membrane targeting have previously been identified. Plasma membrane recruitment of RGS proteins can occur as a result of G protein activation (11, 12), enhanced expression of specific unactivated Gα subunits or GPCRs (1, 2, 13), intrinsic transmembrane-spanning regions (3, 4, 14), post-translational lipid modifications (5, 15), or electrostatic interactions with membrane lipids (6, 16) or via scaffolding proteins (6, 7). Specific domains, namely the disheveled, Egl-10, and pleckstrin (DEP) domains within some RGS proteins, can interact directly with internal loop regions (8, 17) and the intracellular C-terminal tail of GPCRs to promote selectivity of RGS activity at the plasma membrane (9, 18). For example, RGS2 selectively binds directly to the third intracellular loop of the M1 muscarinic acetylcholine receptor (5, 19), and the Saccharomyces cerevisiae RGS protein Sst2 interacts with the C-terminal tail of its cognate receptor Ste2 via DEP domains present in its N terminus (10, 18). Other RGS-like proteins that interact with GPCRs are the G protein-coupled receptor kinases, which specifically phosphorylate agonist-occupied or activated GPCRs to trigger desensitization (reviewed in Ref. 20). Despite the presence of RGS domains in these proteins, GAP activity of G protein-coupled receptor kinases has not been demonstrated, and the role of this domain in G protein-coupled receptor kinases is poorly understood. For such proteins, GAP-independent inhibition of Gα activity may occur via effector antagonism (21). Despite the lack of GAP activity, the RGS domains may also be required for selectivity of interaction with certain Gα subunits (6). GPCR signaling in human cells is complex, and cross-talk between pathways is commonplace. At any give time, a typical human cell can contain 16 different Gα subtypes, ∼400 different GPCRs, and ∼35 different RGS proteins.
The mating response in fission yeast Schizosaccharomyces pombe provides an ideal eukaryotic cell system to study RGS regulation of Gα signaling in isolation. It provides an example of regulation by RGS proteins whereby RGS behaves both as a negative and positive regulator of signaling, depending on the level of ligand stimulation of the pathway (22). Mating is initiated through the reciprocal exchange of pheromones between haploid cells of opposite mating types. Binding of pheromone to its cognate GPCR results in nucleotide exchange and activation of the Gα subunit Gpa1. GTP hydrolysis on Gpa1, catalyzed by the RGS protein Rgs1, returns Gpa1 to its inactive GDP-bound form. Paradoxically, Rgs1-catalyzed GTP hydrolysis has been shown to be required to achieve maximal levels of signaling, an observation explained with the aid of a computational kinetic model proposing a requirement for Rgs1 as a kinetic scaffold to recycle Gpa1 (22). Such a kinetic model represents the most widely used type of GPCR signaling network model, which aims to link the time course of GPCR ligand binding and other receptor level events with the kinetics of early (e.g. G protein activation) and later (e.g. effector activation and downstream MAPK cascades) phases. Signaling propagates from GPCRs at the cell membrane to the inside of the cell, and many molecules within the cell are likely to be released from discrete sources in response; therefore, there are likely to be not only temporal but also spatial gradients of the signaling molecules inside the cell. Rgs1 contains DEP domains, which are considered important for facilitating interaction with GPCRs to direct subcellular localization at the plasma membrane and specificity for G protein signaling pathways. The GTPase cycle model based on Gα signaling in S. pombe (22) omits interaction between GPCR and RGS and does not include any element of spatial regulation of the RGS proteins that is likely to be important in coordinating signal transduction.
Here we confirm an interaction between Mam2 and Rgs1 that is essential for signal transduction and mating. Additionally, fusion studies confirm a Mam2-Rgs1 complex to be a fully functional regulatory unit for signal propagation. We map the interaction sites to a specific region of the C-terminal tail of Mam2 and the DEP domain-containing N terminus of Rgs1. Furthermore, this interaction is required to direct plasma membrane localization of Rgs1 and consequently Rgs1 function, catalyzing GTP hydrolysis on Gpa1. A novel computational kinetic model4 incorporating interactions influencing RGS localization and subsequently their capacity to interact with substrate Gα species predicts that plasma membrane localization of Rgs1 is sufficient for its function. Enhancing Rgs1 plasma membrane localization in a Mam2-Rgs1 interaction null background compensates for the effects of a lack of interaction on signal transduction, thus validating the model's prediction. Through kinetic modeling, we have extended the classic quaternary complex (ligand-GPCR-G-RGS) to include an additional layer of regulation through GPCR-RGS interactions, which facilitate the compartmentalization of RGS activity into plasma membrane and non-plasma membrane compartments. This interaction represents a possible target for the modulation of GPCR signaling cascades.
EXPERIMENTAL PROCEDURES
Strains, Reagents, and General Methods
Yeast strains used in this study are listed in Table 1. With the exception of JY444, JY478, JY1354, JY1025, and AH109, all yeast strains were derived from JY546, which contains the sxa2>lacZ construct for quantification of P-factor-dependent transcription (23, 24). General yeast procedures were performed as described previously (25, 26) using yeast extract medium for routine cell growth and selective, defined minimal medium for all assays. Oligonucleotides were synthesized by Invitrogen. Amplification by PCR used the FastStart high fidelity polymerase blend (Roche Applied Science). All constructs generated by PCR were sequenced.
TABLE 1.
Strains used in this study
| Strain | Genotype | Source |
|---|---|---|
| JY444 | mat1-M, Δmat2/3::LEU2−, leu1-32, ura4-D18 | Ref. 23 |
| JY478 | mat1-M, Δmat2/3::LEU2−, leu1-32, ura4-D18, rgs1::ura4+ | Ref. 62 |
| JY544 | mat1-M, Δmat2/3::LEU2−, leu1−, ade6-M216, ura4-D18, cyr1-D51, sxa2 >lacZ | Ref. 23 |
| JY630 | mat1-M, Δmat2/3::LEU2−, leu1−, ade6-M216, ura4-D18, cyr1-D51, rgs1::ura4+, sxa2>lacZ | Ref. 22 |
| JY948 | mat1-M, Δmat2/3::LEU2−, leu1−, ura4-D18, cyr1-D51, Δpmp1, sxa2>lacZ | Ref. 23 |
| JY1025 | mat1-P, Δmat2/3::LEU2−, leu1−, ura4-D18 | Ref. 23 |
| JY1169 | mat1-M, Δmat2/3::LEU2−, leu1−, ura4-D18, cyr1-D51, mam2-D10, sxa2>lacZ | Ref. 35 |
| JY1285 | mat1-M, Δmat2/3::LEU2−, leu1−, ura4-D18, cyr1-D51, gpa1-D12, sxa2>lacZ | Ref. 24 |
| JY1291 | mat1-M, Δmat2/3::LEU2−, leu1−, ura4-D18, cyr1-D51, mam2-D10, rgs1-D14 sxa2>lacZ | Ref. 23 |
| JY1353 | mat1-M, Δmat2/3::LEU2-, leu1-32, ura4-D18, mam2::ura4+ | This study |
| JY1354 | mat1-M, Δmat2/3::LEU2−, leu1-32, ura4-D18, gpa1::ura4+ | This study |
| JY1717 | mat1-M, Δmat2/3::LEU2−, leu1−, ade6-M216, ura4-D18, cyr1-D51, rgs1::ura4+, sxa2>lacZ | This study |
| JY1719 | mat1-M, Δmat2/3::LEU2−, leu1−, ura4-D18, cyr1-D51, Δpmp1, rgs1-D14, sxa2>lacZ | This study |
| AH109 | MATa, TRP-901, LEU2–3, 112, URA3-52, HIS3-200, GAL4Δ,GAL80Δ,LYS2::GAL1UAS-GAL1TATA-HIS3,MEL1, GAL2UAS-GAL2TATA-ADE2, URA3::MEL1UAS-MEL1TATA-lacZ | BD Biosciences Clontech |
Plasmids
Plasmid-borne gene expression was from pREP vectors, which allow expression of genes under the control of the thiamine-repressible, nmt1 promoter; pREP3x contains the nutritional selection marker LEU2, and pREP4x contains ura4 (27). Single transformants were expressing the transformed gene within pREP3x, whereas double transformants co-express a single gene within pREP3x and a single gene within pREP4x. S. pombe genes were amplified from genomic DNA using PCR and cloned into the pREP vectors. Fluorescent constructs were generated using a two-step cloning technique as described previously (28).
β-Galactosidase Assay
An assay of β-galactosidase activity was performed as detailed previously (23, 29). Activity is displayed as A420 per 106 cells after a 16-h stimulation with P-factor pheromone at concentrations of 0–100 μm. Cell number was determined using a Z2 Coulter Channelyzer (Beckman Coulter).
Yeast Two-hybrid Analysis
S. cerevisiae strain AH109 was co-transformed with the plasmids pGBKT7 and pGADT7 (BD Biosciences) expressing the proteins of interest (Rgs1 and Mam2tail variants) and the positive controls SV40 and p53. Co-transformants containing the two plasmids were selected by growth on SD medium lacking leucine and tryptophan. Upon protein interaction, the GAL4 transcription factor is reconstituted, and the appropriate reporter genes are activated, resulting in growth on medium also lacking histidine and adenine and blue colony formation in the presence of X-α-gal.
Immunoblotting
Whole-cell protein extracts were prepared from strains expressing GFP and the C-terminal fusion proteins Rgs1-GFP, Rgs1(N-term)-GFP, Rgs1(C-term)-GFP, Rgs1N420A-GFP, and Gpa1(1–40)-Rgs1-GFP from pREP3x (30). Protein samples were resolved using denaturing SDS-PAGE and transferred to a polyvinyl difluoride membrane (Bio-Rad). Western blotting was achieved using a primary anti-GFP rabbit monoclonal antibody (Millipore, Durham, UK) and a secondary donkey anti-rabbit IgG HRP conjugate (Promega, Southampton, UK). Bound antibody was detected using enhanced chemiluminescence reagents (GE Healthcare) and visualized with a Syngene G:Box gel documentation system (Syngene, Cambridge, UK).
Mating Efficiency Assay
Many quantitative strains used in this study are Sxa2 null mutants and are therefore sterile (31, 32). To enable mating assays to be performed, we generated mating type M strains deleted for endogenous mam2, rgs1, or gpa1 from JY444 (mat1-M, cyr1+). Mam2, Mam2Δtail, Rgs1, and Gpa1R218C was expressed back in the equivalent knock-out strains from pREP3x. To quantify mating efficiency, yeast cultures were grown to a density of ∼5 × 10⁶ cells/ml in minimal medium, and 200 μl of each test strain was mixed with P cells from the opposite mating type JY1025 (mat1-P, cyr1+). Cells were harvested at 2000 rpm for 3 min, and the pellet was resuspended in 10 μl of sterile water and spotted onto a defined minimal medium plate with a 1:100 dilution of nitrogen. After a 72-h incubation at 29 °C, each spot was picked into 1 ml of water. 500 μl of this culture was taken, and vegetative growing cells were heat-inactivated at 55 °C for 10 min. Heated and unheated samples were plated onto yeast extract plates and incubated for a further 48 h at 29 °C to allow spores to form colonies. Mating efficiency (percentage recovery) was determined as the ratio, colonies formed after heat treatment/colonies formed with no heating.
Microscopy
All images for this study were taken on a Personal DeltaVision microscope (Applied Precision, Issaquah, WA) equipped with a Photometric CoolSNAP HQ camera (Roper Scientific). Deconvolution was applied to images for visual clarity.
Model Simulations
Chemical kinetic models based upon the reaction schemes shown in Figs. 4 and 7 were generated as systems of ordinary differential equations (ODEs). Systems of ODEs were solved using the xCellerator (California Institute of Technology, Pasadena, CA) add-on package for Mathematica version 8.0 (Wolfram Research Inc, Champaign, IL). To simulate incubation of cells followed by stimulation with ligand, the initial ligand concentration (L(0)) was set to zero for a period of time equivalent to the prestimulation incubation period (t0 = 14 h) to allow the system to reach steady state. It was then rapidly, but not discontinuously, increased to the specified concentration (L(t0)) for the experiment, using the expression,
 |
Simulated response was calculated by measuring the integral of the number of active effector molecules (GαGTP-effector for the models in Figs. 4 and 7 and Gβγ-effector for a modified model in which Gβγ is the signal transducer) after applying a cascade of linear relaxation elements (z1(t)′, z2(t)′, and z3(t)′) that reflect the time required for the reporter protein, β-galactosidase, to be expressed. This simulated response is calculated for a range of ligand concentrations at time t0 + tassay, where tassay = 16 h, to give a simulated dose-response relationship. The genotypes of yeast strains used in quantitative assays were simulated by altering the relevant reaction rate constants and initial conditions in the appropriate models (Tables 2 and 3).
FIGURE 4.

Chemical reaction scheme; GTPase cycle with compartmentalized regulation by RGS. This is an extension to the core GTPase cycle model (22) to incorporate the spatial regulation and trafficking of RGS into membrane RGSm and non-membrane-localized RGSc species. Only the membrane-localized RGSm can influence signal transduction. L, ligand; R, receptor.
FIGURE 7.

Chemical reaction scheme; GPCR-RGS fusion. The reaction scheme described in Fig. 4 was modified such that the receptor (R) and RGS species are fused into a single RRGS species.
TABLE 2.
Initial concentrations of species in the computational models
Values for the receptor R, Gα, Gβγ, and RGSc were assumed to be the same as in S. cerevisiae (33). In the GPCR-RGS fusion model, the fusion complex RRGS was chosen to equal the receptor concentration. All other species and complexes are initialized at 0 nm.
| Species | Initial concentration | Equivalent molecules/cell (approximately) |
|---|---|---|
| nm | ||
| Model: GTPase cycle with compartmentalized regulation by RGS (and Gβγ as propagator model) | ||
| L | 0–100,000 (dose-dependent) | 0–4,000,000 |
| R | 205 | 8000 |
| GαGDP | 205 | 8000 |
| Gβγ | 205 | 8000 |
| RGSc | 60 | 2400 |
| Effector | 305 | 8000 |
| Model: GPCR-RGS fusion | ||
| L | 0–100,000 (dose-dependent) | 0–4,000,000 |
| R | 205 | 8000 |
| GαGDP | 205 | 8000 |
| Gβγ | 205 | 8000 |
| RRGS | 205 | 8000 |
| Effector | 305 | 8000 |
TABLE 3.
Parameter modifications required for simulations of yeast strains
Specific parameters or species concentrations were manipulated to mimic the genotypes of yeast strains used in quantitative assays.
| Simulated strain | Modifications to reaction rate constants | Modifications to initial concentrations |
|---|---|---|
| GTPase cyclea | ||
| RGS | ||
| No RGS | [RGSc] = 0 | |
| No R-RGS interaction/no interaction + RGS | k15 = 0, k17 = 0, k19 = 0, k21 = 0 | |
| Gα−GTP hydrolysis | k26 = 0, k28 = 0, k30 = 0, k32 = 0, k33 = 0, k35 = 0, k37 = 0 | |
| 2× RGS | [RGSc] = 120 | |
| 3× RGS | [RGSc] = 180 | |
| RGSm | k13 = 5 | |
| No interaction + RGSm | k15 = 0, k17 = 0, k19 = 0, k21 = 0, k13 = 5 | |
| No receptor (1×, 2×, 3× RGS) | [R] = 0, [RGSc] = 60 (1×), 120 (2×), 180 (3×) | |
| GPCR-RGS fusion | ||
| R-RGS fused | ||
| GTPase cycleb | ||
a With compartmentalized regulation by RGS.
b With compartmentalized regulation by RGS (Gβγ as propagator). Reaction k12 was modified such that Gβγ binds to and activates the effector species instead of Gα. Subsequently, reactions involving GαGTP-effector were removed because this species is never formed when Gβγ is the signal transducer.
Initial Model Conditions
Initial concentrations of species within the models (Table 2) were based on those used in the GTPase cycle model for S. cerevisiae, which themselves were taken from published in vivo measurements (33). S. pombe and S. cerevisiae have been shown to have an equivalent number of pheromone receptors (24). Previous in vivo experimental data demonstrate that the concentration of Gα is the limiting step in the cycle (22); therefore, the initial concentration of free effector molecules was chosen to be equal to the total number of Gα subunits. Initial parameter values for the core GTPase cycle were, where possible, taken from the literature. Any values that had not previously been experimentally determined were subjected to hand tuning to best fit the experimental data.
Model Developments
The kinetic model of the GTPase cycle incorporates spatial regulation of RGS. Spatial translocations of RGS are mimicked simply by compartmentalization of the model into two compartments, representing the plasma membrane and non-plasma membrane regions of a cell. Two RGS species are defined: non-membrane-bound RGS (RGSc), which is unable to influence the GTPase cycle, and membrane-bound RGS (RGSm), which is able to influence the GTPase cycle. Reactions are defined to represent trafficking events of RGS to and from the compartments such that RGSc can enter the membrane compartment and become RGSm either spontaneously or through interaction with other species. Simulating a condition whereby the GPCR protein is fused to the RGS protein required modification to give a new model having a single species representing both GPCR and RGS as one species (RRGS). All reactions and reaction rate parameters involving the GPCR and RGS species were unchanged, but the species involved in the reaction is the fusion species RRGS. This model forces the GPCR and RGS species to be initiated at the same concentration, defined as [RRGS] = 205 nm, to maintain the same GPCR concentration as in the original model.
Data Analysis
Empirical and simulated dose-response data were analyzed using linear and non-linear regression as appropriate using GraphPad Prism version 5.0d for Mac OS X (GraphPad Software Inc., San Diego, CA). Statistical significance was determined using a one-way analysis of variance with a Tukey multiple-comparison post-test or an unpaired Student's t test as appropriate.
RESULTS
Interaction between the C-terminal Tail of Mam2 and Rgs1 Is Physiologically Required to Promote Rgs1-catalyzed GTP Hydrolysis on Gpa1 at the Plasma Membrane
GPCR C-terminal tails have been implicated in many aspects of GPCR behavior (reviewed in Ref. 34), including regulation of receptor localization, trafficking to the plasma membrane, and desensitization to prolonged stimulation through promoting internalization. The 45 amino acids constituting the C-terminal tail of Mam2 consist of a number of lysine and serine/tyrosine residues (Fig. 1A), which appear to be ubiquitinated and phosphorylated to target the receptor for degradation and internalization.5 Crucially, the C-terminal tail could also dictate the level and nature of the signaling response by providing a scaffold for downstream signaling components, such as RGS proteins (6, 35).
FIGURE 1.

The C-terminal tail of Mam2 interacts with Rgs1 to mediate its plasma membrane localization and functionality. A, illustration of the C-terminal tail of Mam2, indicating sites of truncation and the experimentally determined Rgs1 binding domain. B, signaling profile of Mam2Δtail compared with GTPase-deficient strains. P-factor-dependent transcription of β-galactosidase was measured from strains expressing full-length Mam2 (pMam2), strains expressing Mam2 truncated for its C-terminal tail (pMam2Δtail), strains deleted for rgs1 (ΔRgs1), and strains expressing a GTPase-deficient Gpa1 mutant (pGpa1R218C). C, signaling activity of strains expressing Rgs1 (WT), strains deleted for rgs1 (ΔRgs1), strains deleted for Pmp1 (ΔPmp1), and double deletion strains lacking Rgs1 and Pmp1 (ΔRgs1ΔPmp1) or lacking Rgs1 and Gap1 (ΔRgs1ΔGap1). D, mating efficiencies of Mam2Δtail compared with GTPase-deficient strains. Wild-type non-sterile P cells were mated with wild-type, ΔMam2, pMam2Δtail, ΔRgs1, and pRgs1 non-sterile M cells. Efficiency is quantified as the mean ± S.E. (error bars) percentage of colony-forming units recovered from three independent experiments. Significant difference from wild type is determined by unpaired t test. E, representative ΔMam2ΔRgs1 cells co-transformed with Rgs1-GFP and Mam2/Mam2Δtail fused in-frame to mCherry and expressed from the nmt1 promoter. Scale bar, 10 μm. F, comparative signaling profiles of Mam2Δtail and Mam2Δtail-mCherry, Rgs1, and Rgs1-GFP as measured using P-factor-dependent transcription of β-galactosidase. G, signaling profiles of strains expressing Mam2 with increasing portions of the C-terminal tail truncated. Results from B, C, and E are means ± S.E. of triplicate determinations.
Utilizing modified yeast strains where the P-factor pheromone-inducible sxa2 gene has been replaced with the bacterial LacZ gene (23), we investigated the influence of the C-terminal tail of Mam2 on signaling. Plasmid-borne Mam2 truncated for its C-terminal tail (pMam2Δtail, illustrated in Fig. 1A) was expressed at levels similar to wild-type Mam2 (36) from a constitutive nmt1 promoter in a strain deleted for the endogenous mam2 gene. The signaling profile (transcriptional response after a 16-h stimulation with 0–100 μm P-factor) of this strain was reminiscent of strains that are incapable of GTP hydrolysis on Gpa1 (Fig. 1B). These GTPase-deficient strains included a strain deleted for endogenous rgs1 (ΔRgs1) and a strain expressing a Gpa1 variant (pGpa1R218C) having a mutation in a highly conserved arginine residue in the Switch I domain that is necessary for GTPase activity (37). Unstimulated cells expressing Mam2 truncated for its C-terminal tail displayed a 3-fold increase in basal signaling, and stimulated cells showed a 2-fold reduction in maximal response compared with cells expressing full-length Mam2. Further, removing the tail increased sensitivity to P-factor stimulation (pEC50; pMam2Δtail = 4.77 nm, Mam2 = 131.82 nm). These signaling characteristics were similarly observed in GTPase-deficient cells ΔRgs1 (pEC50 = 4.67 nm) and pGpa1R218C (pEC50 = 16.21 nm) (Fig. 1B). Rgs1 has been demonstrated to regulate signaling through GTP hydrolysis of the Gα subunit Gpa1, having a dual negative and positive influence on signal transduction (22). At low P-factor concentrations (<100 nm), Rgs1 inhibited signal transduction, whereas at high concentrations (>100 nm), Rgs1 was required to achieve a maximal response (compare ΔRgs1 with pMam2; Fig. 1B). The counterintuitive attenuation of maximal signaling upon the removal of Rgs1 has previously been confirmed to be a consequence of a reduction in the rate of GTP hydrolysis on Gpa1 (22), suggesting the possibility of an inactive Gpa1GTP-effector complex that is unable to facilitate further signal transduction. An alternative possibility that a downstream desensitization mechanism is responsible for the attenuation was ruled out by deletion of the only two known negative regulators acting downstream of Gpa1. Neither the deletion of Gap1, a negative regulator of downstream Ras1 (38),6 nor the deletion of Pmp1, a negative regulator of the downstream mitogen-activated protein kinase cascade (23), resulted in recovery of maximal signaling in a ΔRgs1 background (Fig. 1C). The striking similarities in signaling activity between GTP hydrolysis-deficient and Mam2Δtail cells suggested a potential role for the receptor tail in facilitating Rgs1-catalyzed GTP hydrolysis on Gpa1.
We next sought to determine a potential physiological role of the C-terminal tail of Mam2 through investigation of its effects on the ability of cells to undergo mating. Mating efficiency was calculated through mixing wild-type or transformed M-type cells with wild-type cells of the opposite mating type (P-type) and quantifying new colonies formed from mating events. Sterile strains deleted for mam2 were transformed to exogenously express Mam2 or Mam2Δtail and quantified for mating efficiency. Wild type mating efficiency (24.37 ± 1.23%) was also quantified for comparison. Plasmid-borne expression of Mam2 recovered mating efficiency (17.33 ± 2.27%), whereas cells expressing Mam2Δtail displayed only limited mating (1.9 ± 0.98%). In comparison, mating was also reduced (<0.1 ± 0.32%) in GTPase-deficient cells lacking Rgs1 or expressing Gpa1R218C, indicating that both the tail of Mam2 and GTP hydrolysis on Gpa1 are required for efficient mating (Fig. 1D).
RGS proteins act allosterically to promote GTP hydrolysis through contact with Switch regions of Gα subunits (39). This direct interaction of Gα with RGS requires these proteins to be in close proximity within the cell. Given this, one possible mechanism for how the tail of Mam2 influences GTP hydrolysis on Gpa1 could be through interaction with Rgs1 to potentiate its localization at the plasma membrane in close enough proximity to contact its substrate, Gpa1GTP. Quantitative yeast two-hybrid studies confirmed a strong interaction between the tail of Mam2 and Rgs1, as determined by growth on selective medium and quantifiable readout (4.7 ± 0.5 β-galactosidase activity units) resulting from the interaction (Fig. 1E). To define the region of the tail responsible for this interaction, smaller C-terminal truncations of Mam2 (Δ5, Δ13, Δ21, and Δ29; illustrated in Fig. 1A) were also investigated for their capability to interact with Rgs1. The interaction was demonstrated to occur in the N-terminal portion of the tail and was independent of at least 13 C-terminal amino acids (Fig. 1E; illustrated in Fig. 1A). Yeast two-hybrid analysis has confirmed interaction between Rgs1 and Mam2tail, but this is within a foreign host organism, S. cerevisiae. To further confirm an in vivo interaction within S. pombe and to investigate the influence of interaction on subcellular localization of Rgs1, C-terminal in-frame fusions of Rgs1 to GFP and of Mam2 or Mam2 truncated variant to mCherry were co-expressed in strains deleted for endogenous rgs1 and mam2. The C-terminal fusion of a fluorescent protein to Mam2 has been shown previously to have no effect on its signaling activity (28). Additionally, no effects were observed for Mam2Δtail or Rgs1 when fused to mCherry and GFP, respectively (Fig. 1F). Previous studies have shown Mam2 to be localized to the plasma membrane and some internal structures believed to be vacuoles (28). Rgs1 also displays plasma membrane localization at the cell tips and colocalizes with full-length Mam2. Plasma membrane localization of Rgs1 was lost when the interaction was abolished upon deletion of ≥29 C-terminal amino acids from Mam2 (Fig. 1E), thus confirming the yeast two-hybrid data. Additionally, truncations of length ≥29 amino acids appear to inhibit receptor internalization, because these truncated Mam2 variants are more prominent at the plasma membrane and are no longer evident in vacuoles within the cell.
Signaling activity of strains expressing full-length Mam2 and Mam2 truncated variants reveals that the removal of ≥29 amino acids from the C terminus gives a signaling phenotype with raised basal signaling, increased sensitivity, and decreased maximal signaling compared with full-length Mam2 (Fig. 1G). This phenotype is similar to observations for GTP hydrolysis-deficient strains (Fig. 1B) and coincides with the tail truncations whereby both interaction with Rgs1 and Rgs1 plasma membrane localization are no longer observed (Fig. 1, E and F). The removal of 5 C-terminal amino acids had little effect on signaling compared with full-length Mam2, whereas a removal of 13 amino acids from the C terminus resulted in an increased sensitivity (pEC50; pMam2Δ13 = 38.02 nm, pMam2 = 40.73 nm), but maximal signaling was maintained. Further truncation to 21 amino acids showed similar sensitivity (pEC50; pMam2Δ21 = 22.91 nm) and slightly reduced maximal signaling activity (16.33 ± 0.47) compared with full-length Mam2 (Fig. 1F).
Two DEP Domains on Rgs1 Are Essential for Interaction with the Tail of Mam2
Specific domains, namely the DEP domains within RGS proteins, have been shown to interact directly with internal loop regions (17) and the intracellular C-terminal tail of GPCRs to promote selectivity of RGS activity (40). Rgs1 contains two of these conserved DEP domains located at its N terminus. The RGS domain, common to all RGS protein family members, is located at the C terminus of Rgs1 (Fig. 2A).
FIGURE 2.

Two N-terminal DEP domains are cooperatively required for plasma membrane localization and function of Rgs1. A, illustration of the domains within Rgs1. The N terminus (residues 1–344) contains two DEP domains (DEPA and DEPB), and the C terminus (residues 345–481) contains the RGS domain. The inactivating N420A mutation lies within the RGS domain. B, signaling activity of isolated Rgs1 domains and an Rgs1 mutant incapable of catalyzing GTP hydrolysis on Gpa1. P-factor-dependent transcription was measured from ΔRgs1 cells transformed to express Rgs1 truncated variants: N terminus (pN-Rgs1), C terminus (pC-Rgs1), and inactive Rgs1 (pRgs1N420A). C, investigating the influence of individual DEP domains on Rgs1 signaling activity. P-factor-dependent transcription was measured from ΔRgs1 cells expressing Rgs1N420A or Rgs1 lacking DEPA (pRgs1ΔDEPA) or DEPB (pRgs1ΔDEPB). Results from B and C are means ± S.E. (error bars) of triplicate determinations. D, expression of each GFP-Rgs1 variant. Immunoblotting of the GFP-Rgs1 fusions was confirmed using an anti-GFP monoclonal antibody. E, representative ΔMam2ΔRgs1 cells co-transformed with Mam2 fused at its C terminus to mCherry and Rgs1 variants fused at their C terminus to GFP, both expressed from separate nmt1 promoters. Scale bar, 10 μm.
To investigate the requirement for DEP domains to regulate signaling, shortened versions of Rgs1 were constructed to contain the DEP domains only (N-Rgs1) or to contain the RGS domain only (C-Rgs1). These constructs were expressed in reporter strains deleted for endogenous rgs1. In addition, a predicted inactive mutant, Rgs1N420A, that contains both DEP domains and the RGS domain but is incapable of catalyzing GTP hydrolysis was investigated for comparison (Fig. 2B). Expressing C-Rgs1 as the sole Rgs1 protein resulted in elevated basal, reduced maximal, and increased sensitivity to P-factor, similar to a strain lacking any Rgs1 (Fig. 2B). Expressing N-Rgs1, which lacks the catalytic RGS domain, displayed a similar profile, but signaling levels were dampened across all P-factor concentrations, suggesting a possible negative regulatory role of Rgs1 that is independent of GAP activity, possibly due to Rgs1 behaving as an effector antagonist. Data analogous to those for the N-Rgs1 construct were also obtained for the predicted GAP inactive Rgs1N420A.
To probe which specific DEP domains were responsible for facilitating regulation of signaling, Rgs1 lacking residues 114–156 (Rgs1ΔDEPA) and Rgs1 lacking residues 250–309 (Rgs1ΔDEPB) were expressed in strains lacking endogenous rgs1 (Fig. 2C). The removal of either DEPA or DEPB results in similar ΔRgs1-like signaling profiles, having raised basal signaling (pRgs1ΔDEPA = 1.46 ± 0.63, Rgs1ΔDEPB = 1.47 ± 0.47), increased sensitivity (pEC50; pRgs1ΔDEPA = 19.50 nm, Rgs1ΔDEPB = 18.62 nm), and reduced maximal signaling (pRgs1ΔDEPA = 12.02 nm, Rgs1ΔDEPB = 15.14 nm) that is characteristic of cells lacking GTP hydrolysis on Gpa1. This indicates that both DEP domains of Rgs1 are cooperatively required to regulate the GTPase cycle of Gpa1.
All Rgs1 variants were tested for their ability to interact with the tail of Mam2 by quantitative yeast two-hybrid analysis and for their ability to colocalize with Mam2 at the plasma membrane (Fig. 2E). For localization studies, Rgs1 variants were C-terminally fused to GFP (their expression was confirmed via immunoblotting (Fig. 2D)) and co-expressed with Mam2 fused to mCherry in strains lacking endogenous rgs1 and mam2. Data indicate that N-Rgs1 interacts strongly (5.0 ± 0.4 β-galactosidase activity units) and colocalizes with Mam2 at the plasma membrane, whereas C-Rgs1 neither interacts (0.2 ± 0.2 β-galactosidase activity units) nor colocalizes (Fig. 2E). The removal of either DEPA or DEPB causes a loss of interaction and little plasma membrane localization, thus indicating the requirement for both DEP domains for the spatial regulation of Rgs1 directed by interaction with the C-terminal tail of Mam2. The inactive Rgs1N420A mutant displays strong interaction (5.6 ± 0.4 β-galactosidase activity units) and localization similar to Rgs1 at the plasma membrane.
Taken together, signaling, interaction, and localization data suggest that to achieve the full regulatory influence of Rgs1, it must interact via its N-terminal DEP domains with the C-terminal tail of Mam2 to achieve plasma membrane localization required to facilitate GTP hydrolysis activity. The requirement for both DEP domains to achieve plasma membrane localization and hence facilitate RGS function suggests a cooperative relationship between DEPA and DEPB for Mam2 C-terminal tail interaction.
Rgs1 Can Negatively Regulate Basal Signaling Independently of Mam2 and Can Form a Functional Rgs1-Mam2 Signaling Complex
To investigate the regulatory effect of Rgs1 that is independent of an interaction with Mam2, basal signaling levels were quantified in strains expressing varying Rgs1 concentrations but lacking endogenous mam2 (Fig. 3A). Rgs1 in strains lacking Mam2 does not show localization in close proximity to its substrate, Gpa1, which resides at the plasma membrane (Fig. 3A, inset). Having removed the receptors, any signal transduction from Gpa1 to give basal levels can only be due to spontaneous Gpa1 activity (24). Reporter strains deleted for both mam2 and rgs1 (ΔRgs1), deleted for mam2 (1xRgs1), deleted for mam2 + exogenously expressing Rgs1 (2xRgs1) and deleted for mam2 + exogenously expressing two plasmid-borne copies of Rgs1 (3xRgs1) were assayed for signaling activity. Data indicate that basal β-galactosidase activity decreases with increasing Rgs1 concentration from 1.03 ± 0.09 for ΔRgs1 to 0.19 ± 0.01 for 3xRgs1; therefore, Rgs1 is able to down-regulate basal signaling without the requirement for interaction with Mam2 (Fig. 3A). Interestingly, negative regulation of basal signaling was observed when the C-terminal (containing RGS domain) but not the N-terminal (containing DEP domains) fragment of Rgs1 was overexpressed (Fig. 3, B and C, respectively). Taken together, these data suggest that the RGS domain alone is able to negatively regulate Gpa1 activity in the absence of an interaction with Mam2.
FIGURE 3.

Rgs1 can regulate signal transduction both in the absence of interaction with Mam2 and when in complex with Mam2. A, basal signaling activity of ΔMam2 strains with increasing concentrations of Rgs1. P-factor-independent transcription was measured in strains lacking endogenous rgs1 (ΔRgs1), expressing one copy of rgs1 from the nmt1 promoter (1× Rgs1), expressing two copies from nmt1 promoters (2× Rgs1), and expressing rgs1 from its endogenous promoter plus two copies from nmt1 promoters (3× Rgs1). Insets, representative cells expressing Gpa1 fused at its C terminus to GFP and ΔMam2ΔRgs1 cells transformed with Rgs1-GFP. Scale bar, 10 μm. B, basal signaling activity of ΔMam2 strains with increasing concentrations of the C-terminal RGS domain-containing region of Rgs1 (C-Rgs1). P-factor-independent transcription was measured in strains lacking endogenous rgs1 (ΔRgs1), expressing one copy of c-rgs1 from the nmt1 promoter (1× C-Rgs1), expressing two copies from nmt1 promoters (2 × C-Rgs1), and expressing c-rgs1 from its endogenous promoter plus two copies from nmt1 promoters (3× C-Rgs1). C, basal activity of ΔMam2 strains with increasing concentrations of the N-terminal, DEP domain-containing region of Rgs1 (N-Rgs1). Results in A, B, and C are means ± S.E. of triplicate determinations, and significant difference from ΔRgs1 is determined. D, signaling activity of a Mam2-Rgs1 fusion complex. ΔMam2ΔRgs1 cells were transformed to express Mam2 fused at its C terminus to Rgs1 (pMam2-Rgs1), fused to the C-terminal RGS domain-containing region of Rgs1 (pMam2-C-Rgs1), or co-transformed with Mam2 or Mam2Δtail and Rgs1 (pMam2 + pRgs1 and pMam2Δtail + pRgs1). P-factor-dependent transcription was measured; results are means ± S.E. of triplicate determinations. E, proposed mechanisms facilitating the plasma membrane localization of Rgs1 via transient interaction with Gpa1GTP or tethered through interaction with the tail of Mam2.
Evidence from yeast two-hybrid and localization studies suggests interaction between Rgs1 and the C-terminal tail of Mam2 in unstimulated conditions, but it remained unclear as to whether Mam2 and Rgs1 could maintain a functional signaling complex when stimulated. To investigate this possibility, the interaction was forced by fusing Rgs1 or the RGS domain containing C-terminal Rgs1 fragment in frame to the C terminus of Mam2. Similar fusions have been demonstrated previously in yeast cells of mammalian GPCRs fused to RGS4 (41). Strains lacking endogenous mam2 and rgs1 were transformed to express the fusion constructs (pMam2-Rgs1 and pMam2-C-Rgs1). Signaling activity was compared with cells deleted for mam2 and rgs1 that were expressing Mam2 and Rgs1 (pMam2 + pRgs1) or Mam2Δtail and Rgs1 (pMam2Δtail + pRgs1). Signaling activity of both the Mam2-Rgs1 and the Mam2-C-Rgs1 fusions showed similar basal signaling activity, sensitivity, and maximal signaling activity compared with strains expressing both Mam2 and Rgs1 (Fig. 3D). This confirms that Mam2 and Rgs1 can form a functional complex with both proteins capable of regulating signal transduction when in a complex with each other. Further, the functional Mam2-C-Rgs1 fusion suggested that the interaction is required (for plasma membrane localization of Rgs1) to enable GAP activity on Gpa1 by the RGS domain alone, a role ordinarily taken by the N-terminal DEP domains of Rgs1.
Taken together, the data suggest a possible model for Rgs1 regulation on Gpa1, whereby the plasma membrane localization of Rgs1 is crucial. The substrate for Rgs1 is the Gα protein Gpa1, which itself is plasma membrane-localized; therefore, to be in close enough proximity to catalyze hydrolysis on Gpa1, Rgs1 must achieve plasma membrane localization. Transient, Mam2-independent events of Rgs1 plasma membrane localization due, for example, to random diffusion must be possible to limit spontaneous signal transduction through Gpa1. In addition, to facilitate stable plasma membrane localization of Rgs1, possibly allowing greater efficiency for prolonged GTP hydrolysis on Gpa1, we propose that an interaction between Rgs1 and the C-terminal tail of Mam2 is explicitly required (Fig. 3E).
A New Kinetic Model, Compartmentalized Regulation of the GTPase Cycle by RGS
The previous model of the core GTPase cycle fails to include any influence of interaction between GPCR and RGS species on signal propagation (22). Given our observations, we propose an extended kinetic ODE model of the GTPase cycle that contains an additional layer of regulation through controlling the subcellular localization of Rgs1 (Figs. 4 (reaction scheme) and 5 (simplified schematic)). The new model incorporates modifications to the GTPase cycle model defined previously (22) in that following signal transduction beyond a downstream effector, the Gα protein becomes sequestered in a complex with the effector that is unable to undergo further signal transduction until its release from this complex via hydrolysis of GαGTP. Additional regulation is also built into the model through the inclusion of GPCR-RGS interactions and spatial regulation of RGS proteins. We suggest a compartmentalized model of Rgs1 catalytic activity whereby there are two pools of RGS in the system, one that is non-membrane-bound (RGSc) and therefore unable to interact with Gα and one that is membrane-bound (RGSm) and therefore is able to interact with Gα to catalyze the GTP hydrolysis reaction. Based on our empirical evidence, RGS is given the capability to enter the “plasma membrane” compartment via interaction with the receptor, interaction with activated Gα (GGTP), and direct interaction with the membrane. The latter possibility is attributed to the random diffusion of molecules that occurs inside a cell. It is within the plasma membrane compartment of the model that the core GTPase cycle can occur (Fig. 5). This kinetic model was validated against experimental data by perturbing reaction rate parameters and species concentrations (Tables 2 and 3) within the model to simulate specific genotypes of strains used in signaling assays.
FIGURE 5.

Schematic representation of the kinetic model describing the requirement for plasma membrane trafficking of RGS to allow RGS-mediated regulation of the GTPase cycle. The diagram represents compartmentalized RGS activity with RGS species able to transfer between the cytosol, where they are inactive (RGSc), and the plasma membrane, where they are active (RGSm). Positive influences on signal propagation are indicated by green nodes, and negative influence is indicated by a red node. RGS only regulates signal propagation through contact with GTP-bound Gα species (GGTP) when in the plasma membrane compartment. Translocation of RGSc to the plasma membrane occurs via direct contacts with the membrane, interaction with the receptor (R), or interaction with its substrate (GGTP). The core GTPase cycle (22) occurs at the plasma membrane compartment, with signal propagation being positively regulated via R promoting GGDP → GGTP exchange. Opposing this, RGSm species can promote hydrolysis of GGTP → GGDP prior to effector activation events. Propagation beyond GGTP resulting in signal transduction away from the plasma membrane is via interaction of GGTP with an effector. Following a single effector activation event, an inactive complex, GGTP-effector off, cannot propagate any further signal and requires RGSm-catalyzed hydrolysis to recycle GGDP and effector for further activation.
Simulations from the model (Fig. 6, A–D) are in qualitative agreement with signaling data obtained previously in Figs. 1B, 2B, and 3 (A and B), respectively. Simulation of a Mam2Δtail equivalent strain was achieved by blocking any possible receptor-RGS interaction in the model (Fig. 6A, No R-RGS). The model can therefore capture the behavior of the system when this interaction is compromised. Simulations of the system whereby GTPase activity is lost, either through removal of the RGS species (No RGS) or through blocking GTPase activity on Gα (Gα−GTPase), are also in qualitative agreement with signaling activity observed for ΔRgs1 and Gpa1R218C strains (compare Fig. 6A with Fig. 1B). Simulating the equivalent of Rgs1 N/C-terminal fragments and Rgs1N420 required introducing constraints on the behavior of the RGS species in the model consistent with what had been observed for the Rgs1 variants. Simulations qualitatively agree with empirical signaling data for these variants showing ΔRgs1-like signaling phenotypes for simulated Rgs1N420A and N/C-terminal fragments (compare Fig. 6B with Fig. 2B). The model therefore captures the behavior of independent domains of RGS species, such as the RGS domain for Gα binding and GAP activity and DEP domains for receptor binding. The negative regulatory activity of Rgs1 observed independently of Mam2 is maintained within the model system (compare Fig. 6C with Fig. 3A). This is due to RGS species in the model having the capability to interact with GαGTP at the plasma membrane both with and without the aid of receptor interaction (RGS trafficking reactions; Fig. 4).
FIGURE 6.

Simulations from the GTPase cycle with compartmentalized regulation by RGS model display qualitative agreement with empirically determined signaling profiles. A, simulating a lack of receptor-RGS interaction and GTPase-deficient systems. Simulations were in the presence (RGS) or absence (No RGS) of RGS activity, when receptor-RGS interaction is blocked (No R-RGS interaction, Mam2Δtail equivalent), and when Gα cannot hydrolyze GTP (Gα−GTP hydrolysis, Gpa1R218C equivalent). B, simulations of no RGS versus RGS with GAP activity but no receptor binding (C-RGS, C-Rgs1 equivalent), RGS lacking Gα binding (N-RGS, N-Rgs1 equivalent), and RGS lacking GAP activity (Rgs1N420A equivalent). C, simulation of receptor-independent RGS activity. Simulations were in the absence of any receptors and in the presence of no RGS and 1×, 2×, and 3× RGS concentrations. D, simulating receptor and RGS fused as a single species. Shown are simulations from a “wild-type” model (RGS) and a model lacking receptor-RGS interaction compared with simulated output from a modified model whereby free receptor and RGS are replaced with a single receptor-RGS species (R-RGS fused, Mam2-Rgs1 fusion equivalent). E, simulating Gβγ as the signal propagator. Shown is the simulated response when the signal propagator was converted from GαGTP to Gβγ in the presence/absence of RGS activity and when Gα was rendered GTPase-deficient.
To simulate Mam2-Rgs1 fusion data required the development of a modified kinetic model adapted to include an RRGS complex species (imitating the Mam2-Rgs1 fusion) in place of free R and RGS species (Fig. 7). Empirical data show that a Mam2-Rgs1 fusion complex signaling phenotype is reminiscent of that observed from cells expressing Mam2 and Rgs1 separately (Fig. 3B); therefore, the RRGS species in this modified model is given the capability to proceed in all reactions that the separate R and RGS species would be capable of alone. Simulations of this fusion model resulted in a wild-type-like signaling profile as observed by a quantitative assay (compare Fig. 6D with Fig. 3B).
Model validation was extended further to the mating response in the distantly related yeast S. cerevisiae, which provides a system whereby spatial regulation of the RGS protein through interaction with a GPCR could be important in influencing signal transduction. A major difference between the S. pombe and S. cerevisiae mating response is that in S. pombe it is the Gα that transduces the signal, whereas in S. cerevisiae, the signal transducer is Gβγ (42). We extended the model further by creating a modified version whereby Gβγ is the signal transducer instead of Gα within the same framework of compartmentalized regulation by RGS. Simulations from this model having removed RGS, or blocked GTP hydrolysis of Gα have the same effect, increasing basal/maximal response and sensitivity to ligand (Fig. 6E). The results of these simulations are in close agreement with published data (43), indicating that in systems where Gβγ is the signal propagator, RGS proteins may only negatively regulate signaling. This also demonstrates that the new model is transferable to simulate G protein signaling systems in other organisms.
The new kinetic model incorporates an additional layer of regulation on signal transduction through the plasma membrane trafficking of RGS and, as a result the reaction scheme of the model (Fig. 4), has been extensively modified from the original (22). Despite these modifications, the core GTPase cycle model remains largely unchanged; therefore, the model maintains the unimodal relationship observed between RGS concentration and signal output (22) (Fig. 8). Further, our model can reproduce all of the simulations shown in (22) with the same accuracy (data not shown).
FIGURE 8.
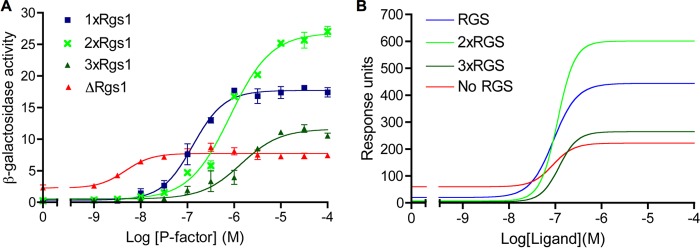
Model validation against empirical data; the influence of Rgs1 concentration. A, signaling activity of strains with varying levels of Rgs1 expression. P-factor-dependent transcription was measured from strains expressing Rgs1 as one endogenous copy (1xRgs1), expressing Rgs1 as two exogenous copies (2xRgs1), expressing Rgs1 as one endogenous copy and two exogenous copies (3xRgs1), and deleted for rgs1 (ΔRgs1). Results are the mean ± S.E. (error bars) of triplicate determinations. B, simulations are in the presence of 1×, 2×, and 3× RGS concentration and no RGS. Ligand concentration was varied over the range 0–100 μm following simulation of 16-h induction. Output from the model shows accumulation of GαGTP-effector complexes over the duration of the simulated assays.
Targeting Rgs1 to the Plasma Membrane Compensates for a Lack of Mam2-Rgs1 Interaction
We hypothesized that it is the correct subcellular localization of Rgs1 at the plasma membrane, primarily directed through interaction with the C-terminal tail of Mam2, that is essential for Rgs1 to function as a GAP for Gpa1. Our model could be perturbed to generate predictions related to this hypothesis. Increasing the reaction rate of RGSc → RGSm 104-fold in the model (equivalent to increasing the translocation rate to the plasma membrane) has a positive influence on the simulated signaling response, evident as increased maximal signaling (Fig. 9A). To test this prediction required a mechanism for enhancing plasma membrane localization of Rgs1 independently of an interaction with the C-terminal tail of Mam2. The first 40 N-terminal amino acid residues of the Gα subunit Gpa1 are sufficient for membrane targeting due to this region containing no other regulatory domains other than myristoylation and palmitoylation sites. Fusing this amino acid 1–40 region of Gpa1 to a protein of interest promotes plasma membrane localization of the protein.7 In cells deleted for rgs1, an exogenously expressed Gpa1(1–40)-Rgs1 fusion protein was shown to enhance maximal β-galactosidase activity compared with cells expressing Rgs1 (maximum: pGpa1(1–40)-Rgs1 = 23.49 ± 0.48, pRgs1 = 18.75 ± 0.36), thus confirming the prediction that increasing Rgs1 localized at the plasma membrane has a positive effect on signal transduction (Fig. 9B).
FIGURE 9.

Simulations predict and empirical data confirm that plasma membrane localization of RGS compensates for a lack of receptor-RGS interaction. A, simulations of a wild-type RGS versus an RGS with increased membrane localization (RGSm). B, the addition of a membrane-targeting signal to Rgs1 increases maximal signaling activity. P-factor-dependent transcription was measured from ΔRgs1 cells transformed to express Rgs1 (pRgs1) or Gpa1(1–40)-Rgs1 (p1–40Gpa1-Rgs1). C, model simulations predict that enhancement of RGS in the plasma membrane compartment will compensate for a lack of receptor-RGS interaction. Simulations are of a “wild-type” system (RGS), a system lacking Receptor-RGS interaction (No interaction + RGS), and a system lacking receptor-RGS interaction but containing RGS with increased membrane localization (No interaction + RGSm). D, representative ΔMam2ΔRgs1 cells co-transformed to express Mam2-mCherry + Rgs1-GFP, Mam2-mCherry + Gpa1(1–40)-Rgs1-GFP, Mam2Δtail-mCherry + Rgs1-GFP, or Mam2Δtail-mCherry + Gpa1(1–40)-Rgs1-GFP. Scale bar, 10 μm. E, P-factor-dependent signaling activity of strains co-transformed with Mam2 + Rgs1, Mam2Δtail + Rgs1, and Mam2Δtail + Gpa1(1–40)-Rgs1. Results in B and C are means ± S.E. (error bars) of triplicate determinations.
Given the proposed importance of the GPCR C-terminal tail in facilitating RGS localization at the plasma membrane, simulations were generated in a system whereby receptor-RGS interaction was blocked but simultaneously RGS membrane trafficking was increased (Fig. 9C, No Interaction + RGSm). The model predicts that enhancing RGS translocation to the plasma membrane compartment will compensate for a lack of receptor-RGS interaction and return signaling activity to be reminiscent of simulation from a “wild-type” system (Fig. 9C). Enhanced membrane localization of the Gpa1(1–40)-Rgs1 fusion was confirmed through tagging with GFP, demonstrating that colocalization of Rgs1 and Mam2Δtail at the plasma membrane can be recovered through the addition of the Gpa1(1–40) domain to Rgs1 (Fig. 9D). We co-expressed Mam2Δtail with Rgs1 or Rgs1 fused at its C terminus to the first 40 amino acid residues of Gpa1 (pGpa1(1–40)-Rgs1) in cells deleted for endogenous mam2 and rgs1 and assayed for signaling activity. Cells co-expressing Mam2 and Rgs1 were also assayed for comparison (Fig. 6E). Expression of membrane-targeted Rgs1 in cells expressing Mam2Δtail and therefore lacking Mam2-Rgs1 interaction recovered both basal and maximal signaling activity (basal: pMam2Dtail + pGpa1(1–40)-Rgs1 = 1.87 ± 0.59, pMam2 + pRgs1 = 1.73 ± 0.76; maximum: pMam2Dtail + pGpa1(1–40)-Rgs1 = 11.98 ± 0.47, pMam2 + pRgs1 = 11.58 ± 0.38). Simulations and empirical evidence imply that plasma membrane localization of Rgs1 is sufficient for Rgs1 to regulate the GTPase cycle through GAP activity on Gpa1 and that the C-terminal tail of Mam2 has a key role in facilitating this plasma membrane localization.
DISCUSSION
The key interactions within GPCR signaling cascades are traditionally between ligand-GPCR, receptor-Gα, and Gα-RGS proteins. Indeed, such combinations have influence over the extent of signal that is transduced, and as a result, these interactions, particularly ligand-GPCR, are excellent targets for modulation of GPCR signaling responses. However, there is increasing evidence for further interactions that could prove to be just as important, namely between GPCRs and RGS proteins (44). RGS proteins themselves and their interactions are emerging as potential small molecule drug targets (45, 46). Many mammalian GPCRs, including the D2 dopaminergic, M1 and M2 muscarinic, adrenergic, angiotensin AT1, and μ-opioid receptors, have been identified as RGS protein targets (13, 19, 47, 48), but mechanistic explanations as to why such interactions are required are often unfounded. We present an example and mechanistic explanation of interaction between a GPCR and RGS protein that is physiologically essential for signal propagation.
S. pombe Rgs1 was shown to interact strongly with the C-terminal tail of the GPCR Mam2 in order to facilitate maximal signaling and efficient mating in response to pheromone stimulation. This represents an example whereby a GPCR-RGS interaction is physiologically required. It is conceivable that Rgs1 could be contacting Mam2 to modulate its activity, as has been shown for RGS4 and RGS17, yielding different effects on the steady state activity of the M2 muscarinic receptor activity (49). Evidence suggests that the Mam2-Rgs1 interaction is not to modulate GPCR activity but rather to regulate the subcellular localization of Rgs1 by promoting its recruitment to the plasma membrane.
In “resting” S. pombe cells, Rgs1 has previously not been observed at the plasma membrane, instead being localized in nuclear and cytoplasmic regions (50). Given that the substrate for Rgs1 is Gpa1, which localizes at the plasma membrane, this is counterintuitive. The reasons for nuclear localization of RGS proteins are unclear, but one plausible explanation could be the sequestration of RGS away from Gα, thus allowing increased sensitivity to ligand. Some RGS proteins have functional roles in the nucleus (51). Nuclear RGS12 has been shown to inhibit DNA synthesis in COS-7 cells (52), and RGS6 is recruited to the nucleus to release transcriptional inhibition (53). Such nuclear functions are often independent of the RGS domain, therefore implicating different domains as having different functional roles. Because the ΔRgs1 mutation in S. pombe is non-lethal, we assume that its potential nuclear role is non-essential.
We observed Rgs1 localized to the plasma membrane when exogenously expressing Mam2 but not Mam2Δtail in the same cell. This suggests, first, that Rgs1 interacts either directly or indirectly with the receptor tail and, second, that a trigger is required in terms of increased receptor expression for translocation of Rgs1 to the plasma membrane. Indeed, Mam2 expression increases as a result of both nitrogen starvation and activation of the signaling pathway following P-factor stimulation (54, 55). It is possible that only transient plasma membrane localization of Rgs1 occurs in unstimulated cells, and this could be stabilized by increased concentration of Mam2. Purely the expression of some receptors, regardless of their activation state, can be sufficient to localize RGS proteins to the plasma membrane, as has been demonstrated for the mammalian RGS2 and RGS4 proteins (13). In other cases (e.g. RGS4 and other B/R4 family members), the activated form of the G protein is sufficient to trigger translocation to the plasma membrane (11, 16). In preliminary experiments expressing the GTP-bound form of Gpa1, plasma membrane localization of Rgs1 was not observed, indicating that activation of Gpa1 does not efficiently maintain Rgs1 at the membrane, which suggests that interaction of Rgs1 with Gpa1GTP is transient.
For Rgs1, it is a specific region of the C-terminal receptor tail that is required to direct plasma membrane localization, thus placing importance on the receptor tail as a regulator of signaling. The C-terminal tail of the S. cerevisiae GPCR Ste2 has been shown to promote plasma membrane localization of its RGS protein Sst2 via DEP domains in Sst2 (18). This docking only occurs when the receptor tail is in an unphosphorylated state. Rgs1 has two N-terminal DEP domains, but whether its plasma membrane localization is dependent on phosphorylation states of the Mam2 tail is yet to be determined. Due to the functional significance of plasma membrane localization of Rgs1, if plasma membrane recruitment is phosphorylation state-dependent, GPCR kinases may also have an important role in controlling Rgs1 localization. There are two candidates in S. pombe, Cki1 and Cki2, homologues of the S. cerevisiae casein kinases Yck1/2 (56), that could potentially impact regulation of signaling through indirectly influencing Rgs1 localization.
In many G protein signaling pathways, it is unclear whether signaling components function as multiprotein complexes or whether proteins freely dissociate from each other. Mam2-Rgs1 fusion data suggest that the fused complex functions as wild type, indicating that functional multiprotein signaling complexes can exist in the mating response pathway. It is possible that Mam2 behaves as a molecular scaffold, organizing the formation of a multiprotein signaling complex at the plasma membrane. Fusion data and computational kinetic models suggest that a complex consisting of ligand-GPCR-Gα-RGS is capable of transducing the signal. This complex may even include other downstream proteins, such as the effector for Gpa1, Ras1, and components of the MAPK cascade Byr2 and Byr1, placing them all in close proximity docked at the plasma membrane. Receptors as scaffolds could selectively recruit functionally related proteins, which would be especially advantageous for mammalian GPCR signaling in a crowded environment with multiple different GPCRs, G proteins, and RGS proteins present. Multiprotein or microdomain signaling complexes would enable close localization and continual contact of proteins engaged in specific signal transduction cascades, helping to achieve rapidity as well as specificity. Further investigation is required to confirm the presence of such complexes in GPCR signaling pathways.
An ODE model, compartmentalized regulation of the GTPase cycle by RGS, has been developed that proposes mechanisms for RGS translocation to a functional domain at the plasma membrane and captures empirically determined essential interaction with the GPCR to facilitate RGS function. The model includes three proposed mechanisms of RGS plasma membrane translocation: via interaction with the membrane, interaction with GαGTP, and interaction with the GPCR. Interaction of Rgs1 with Mam2 to direct plasma membrane localization of Rgs1 has been empirically determined, whereas the other two mechanisms have not. These are implied by the hypothesis that plasma membrane localization is a requirement for Rgs1 function and because Rgs1 negatively regulates signaling even in the absence of Mam2. If the hypothesis is true, as evidence suggests, then such alternative mechanisms allowing translocation of Rgs1 must be possible. Most RGS proteins do not contain specific motifs for membrane targeting, but some contain exposed cysteine residues, which can rapidly and reversibly incorporate palmitate at the cell membrane. The addition of thioester-linked palmitate can contribute to membrane localization in addition to affecting protein interactions (57).
Many mathematical models have been generated to describe GPCR signaling pathways, including thermodynamic equilibrium models common in pharmacology (58–60). A kinetic model of a receptor-G protein-RGS signaling unit based on a similar system, the mating response in S. cerevisiae, has been developed (61) and extended to include many of the known complexes and interactions in the pathway (62). These include the association of a large complex of scaffold proteins, the Gβγ subunit, and members of the MAPK cascade, which allows FUS3, the MAPK, to activate transcription, cell cycle arrest, and projectile growth. The main differences of these models compared with that presented here is that the aforementioned models do not include any element of spatial regulation, there is a lack of GPCR-RGS interactions, and RGS behaves solely as a negative regulator. The extension of models to include the increasingly important roles of subcellular protein distribution and protein gradients in regulation of GPCR signaling pathways will enable more predictive models. Our model predicts and empirical data confirmed that signaling activity could be recovered in strains lacking GPCR-RGS interaction by enhancing the Rgs1 plasma membrane localization through the addition of a small membrane-targeting region of Gpa1. This highlights the spatial regulation of Rgs1 as being a significant event in the overall regulation of the signaling pathway. Targeting spatial regulation of RGS proteins, possibly through small molecules blocking interaction with the GPCR, presents a possible avenue to explore for therapeutic intervention of GPCR/Gα/RGS protein-related diseases.
This work was supported by a Warwick Postgraduate Research Scholarship (to M. B.), the University Hospitals of Coventry and Warwickshire National Health Service Trust (to G. L.), Biotechnology and Biological Sciences Research Council Grant BB/G01227X/1 (to W. C., J. B., and G. L.), and the Birmingham Science City Research Alliance (to G. L.).
The model for compartmentalized regulation of the GTPase cycle by RGS species discussed in this work was deposited in the BioModels Database (63) and assigned the identifier MODEL1305280000.
K. Richardson, W. Croft, E. McCann, and G. Ladds, manuscript in preparation.
C. Weston, M. Bond, W. Croft, and G. Ladds, submitted for publication.
M. Mos and G. Ladds, submitted for publication.
- GPCR
- G protein-coupled receptor
- RGS
- regulator of G protein signaling
- DEP
- disheveled, Egl-10, and pleckstrin
- GAP
- GTPase-activating protein
- ODE
- ordinary differential equation
- R
- receptor
- L
- ligand
- RRGS
- GPCR-RGS fusion species.
REFERENCES
- 1. Elliott C. M., Stinner B., Venkataraman C. (2012) Modelling cell motility and chemotaxis with evolving surface finite elements. J. R. Soc. Interface 9, 3027–3044 [DOI] [PMC free article] [PubMed] [Google Scholar]
- 2. Pierce K. L., Premont R. T., Lefkowitz R. J. (2002) Seven-transmembrane receptors. Nat. Rev. Mol. Cell Biol. 3, 639–650 [DOI] [PubMed] [Google Scholar]
- 3. Sprang S. R. (1997) G proteins, effectors and GAPs. Structure and mechanism. Curr. Opin. Struct. Biol 7, 849–856 [DOI] [PubMed] [Google Scholar]
- 4. Johnston C. A., Siderovski D. P. (2007) Receptor-mediated activation of heterotrimeric G-proteins. Current structural insights. Mol. Pharmacol. 72, 219–230 [DOI] [PubMed] [Google Scholar]
- 5. Ross E. M. (2008) Coordinating speed and amplitude in G-protein signaling. Curr. Biol. 18, R777–R783 [DOI] [PMC free article] [PubMed] [Google Scholar]
- 6. Hepler J. R. (1999) Emerging roles for RGS proteins in cell signalling. Trends Pharmacol. Sci. 20, 376–382 [DOI] [PubMed] [Google Scholar]
- 7. Berman D. M., Kozasa T., Gilman A. G. (1996) The GTPase-activating protein RGS4 stabilizes the transition state for nucleotide hydrolysis. J. Biol. Chem. 271, 27209–27212 [DOI] [PubMed] [Google Scholar]
- 8. Milligan G. (1998) New aspects of G-protein-coupled receptor signalling and regulation. Trends Endocrinol. Metab. 9, 13–19 [DOI] [PubMed] [Google Scholar]
- 9. Zhong H., Wade S. M., Woolf P. J., Linderman J. J., Traynor J. R., Neubig R. R. (2003) A spatial focusing model for G protein signals. Regulator of G protein signaling (RGS) protein-mediated kinetic scaffolding. J. Biol. Chem. 278, 7278–7284 [DOI] [PubMed] [Google Scholar]
- 10. Willars G. B. (2006) Mammalian RGS proteins. Multifunctional regulators of cellular signalling. Semin. Cell Dev. Biol. 17, 363–376 [DOI] [PubMed] [Google Scholar]
- 11. Druey K. M., Sullivan B. M., Brown D., Fischer E. R., Watson N., Blumer K. J., Gerfen C. R., Scheschonka A., Kehrl J. H. (1998) Expression of GTPase-deficient Giα2 results in translocation of cytoplasmic RGS4 to the plasma membrane. J. Biol. Chem. 273, 18405–18410 [DOI] [PubMed] [Google Scholar]
- 12. Dulin N. O., Sorokin A., Reed E., Elliott S., Kehrl J. H., Dunn M. J. (1999) RGS3 inhibits G protein-mediated signaling via translocation to the membrane and binding to Gα11. Mol. Cell Biol. 19, 714–723 [DOI] [PMC free article] [PubMed] [Google Scholar]
- 13. Roy A. A., Lemberg K. E., Chidiac P. (2003) Recruitment of RGS2 and RGS4 to the plasma membrane by G proteins and receptors reflects functional interactions. Mol. Pharmacol. 64, 587–593 [DOI] [PubMed] [Google Scholar]
- 14. Faurobert E., Hurley J. B. (1997) The core domain of a new retina specific RGS protein stimulates the GTPase activity of transducin in vitro. Proc. Natl. Acad. Sci. U.S.A. 94, 2945–2950 [DOI] [PMC free article] [PubMed] [Google Scholar]
- 15. De Vries L., Elenko E., Hubler L., Jones T. L., Farquhar M. G. (1996) GAIP is membrane-anchored by palmitoylation and interacts with the activated (GTP-bound) form of Gαi subunits. Proc. Natl. Acad. Sci. U.S.A. 93, 15203–15208 [DOI] [PMC free article] [PubMed] [Google Scholar]
- 16. Srinivasa S. P., Bernstein L. S., Blumer K. J., Linder M. E. (1998) Plasma membrane localization is required for RGS4 function in Saccharomyces cerevisiae. Proc. Natl. Acad. Sci. U.S.A. 95, 5584–5589 [DOI] [PMC free article] [PubMed] [Google Scholar]
- 17. Sandiford S. L., Slepak V. Z. (2009) The Gβ5-RGS7 complex selectively inhibits muscarinic M3 receptor signaling via the interaction between the third intracellular loop of the receptor and the DEP domain of RGS7. Biochemistry 48, 2282–2289 [DOI] [PMC free article] [PubMed] [Google Scholar]
- 18. Ballon D. R., Flanary P. L., Gladue D. P., Konopka J. B., Dohlman H. G., Thorner J. (2006) DEP-domain-mediated regulation of GPCR signaling responses. Cell 126, 1079–1093 [DOI] [PubMed] [Google Scholar]
- 19. Bernstein L. S., Ramineni S., Hague C., Cladman W., Chidiac P., Levey A. I., Hepler J. R. (2004) RGS2 binds directly and selectively to the M1 muscarinic acetylcholine receptor third intracellular loop to modulate Gq/11α signaling. J. Biol. Chem. 279, 21248–21256 [DOI] [PubMed] [Google Scholar]
- 20. Pitcher J. A., Freedman N. J., Lefkowitz R. J. (1998) G protein-coupled receptor kinases. Annu. Rev. Biochem. 67, 653–692 [DOI] [PubMed] [Google Scholar]
- 21. Carman C. V. (1999) Selective regulation of Gαq/11 by an RGS domain in the G protein-coupled receptor kinase, GRK2. J. Biol. Chem. 274, 34483–34492 [DOI] [PubMed] [Google Scholar]
- 22. Smith B., Hill C., Godfrey E. L., Rand D., van den Berg H., Thornton S., Hodgkin M., Davey J., Ladds G. (2009) Dual positive and negative regulation of GPCR signaling by GTP hydrolysis. Cell. Signal. 21, 1151–1160 [DOI] [PubMed] [Google Scholar]
- 23. Didmon M., Davis K., Watson P., Ladds G., Broad P., Davey J. (2002) Identifying regulators of pheromone signalling in the fission yeast Schizosaccharomyces pombe. Curr. Genet. 41, 241–253 [DOI] [PubMed] [Google Scholar]
- 24. Ladds G., Goddard A., Hill C., Thornton S., Davey J. (2007) Differential effects of RGS proteins on Gαq and Gα11 activity. Cell. Signal. 19, 103–113 [DOI] [PubMed] [Google Scholar]
- 25. Davey J., Egel R., Nielsen O. (1995) Pheromone procedures in fission yeast in Methods in Molecular Genetics, Vol. 6B, pp. 247–263, Elsevier, San Diego, CA [Google Scholar]
- 26. Ladds G., Rasmussen E., Young T., Nielsen O., Davey J. (1996) Sxa2-dependent inactivation of the P-factor mating pheromone in the fission yeast Schizosaccharomyces pombe. Mol. Microbiol. 20, 35–42 [DOI] [PubMed] [Google Scholar]
- 27. Maundrell K. (1993) Thiamine-repressible expression vectors pREP and pRIP for fission yeast. Gene 123, 127–130 [DOI] [PubMed] [Google Scholar]
- 28. Ladds G., Davis K., Das A., Davey J. (2005) A constitutively active GPCR retains its G protein specificity and the ability to form dimers. Mol. Microbiol. 55, 482–497 [DOI] [PubMed] [Google Scholar]
- 29. Ladds G., Davis K., Hillhouse E. W., Davey J. (2003) Modified yeast cells to investigate the coupling of G protein-coupled receptors to specific G proteins. Mol. Microbiol. 47, 781–792 [DOI] [PubMed] [Google Scholar]
- 30. Ladds G., Davis K., Powner D., Davey J. (2000) A temperature-sensitive Krp1 allows in vivo characterization of kexin activation. Mol. Microbiol. 37, 606–618 [DOI] [PubMed] [Google Scholar]
- 31. Imai Y., Yamamoto M. (1992) Schizosaccharomyces pombe sxa1+ and sxa2+ encode putative proteases involved in the mating response. Mol. Cell Biol. 12, 1827–1834 [DOI] [PMC free article] [PubMed] [Google Scholar]
- 32. Ladds G., Davey J. (2000) Sxa2 is a serine carboxypeptidase that degrades extracellular P-factor in the fission yeast Schizosaccharomyces pombe. Mol. Microbiol. 36, 377–390 [DOI] [PubMed] [Google Scholar]
- 33. Yildirim N., Hao N., Dohlman H. G., Elston T. C. (2004) Mathematical modeling of RGS and G-protein regulation in yeast. Methods Enzymol. 389, 383–398 [DOI] [PubMed] [Google Scholar]
- 34. Bockaert J., Marin P., Dumuis A., Fagni L. (2003) The “magic tail” of G protein-coupled receptors. An anchorage for functional protein networks. FEBS Lett. 546, 65–72 [DOI] [PubMed] [Google Scholar]
- 35. Hepler J. R. (2003) RGS protein and G protein interactions. A little help from their friends. Mol. Pharmacol. 64, 547–549 [DOI] [PubMed] [Google Scholar]
- 36. Ladds G., Davey J. (2004) Analysis of human GPCRs in fission yeast. Curr. Opin. Drug Discov. Devel. 7, 683–691 [PubMed] [Google Scholar]
- 37. Majumdar S., Ramachandran S., Cerione R. A. (2006) New insights into the role of conserved, essential residues in the GTP binding/GTP hydrolytic cycle of large G proteins. J. Biol. Chem. 281, 9219–9226 [DOI] [PubMed] [Google Scholar]
- 38. Imai Y., Miyake S., Hughes D. A., Yamamoto M. (1991) Identification of a GTPase-activating protein homolog in Schizosaccharomyces pombe. Mol. Cell Biol. 11, 3088–3094 [DOI] [PMC free article] [PubMed] [Google Scholar]
- 39. Ross E. M., Wilkie T. M. (2000) GTPase-activating proteins for heterotrimeric G proteins. Regulators of G protein signaling (RGS) and RGS-like proteins. Annu. Rev. Biochem. 69, 795–827 [DOI] [PubMed] [Google Scholar]
- 40. Chen S., Hamm H. E. (2006) DEP domains. More than just membrane anchors. Dev. Cell 11, 436–438 [DOI] [PubMed] [Google Scholar]
- 41. Hill C., Brownlie Z., Davey J., Milligan G., Ladds G. (2008) Isolation and characterization of a novel human RGS mutant displaying gain-of-function activity. Cell. Signal. 20, 323–336 [DOI] [PubMed] [Google Scholar]
- 42. Hoffman C. S. (2005) Except in every detail. Comparing and contrasting G-protein signaling in Saccharomyces cerevisiae and Schizosaccharomyces pombe. Eukaryot. Cell 4, 495–503 [DOI] [PMC free article] [PubMed] [Google Scholar]
- 43. Dohlman H. G. (2002) G proteins and pheromone signalling. Annu. Rev. Physiol. 64, 129–152 [DOI] [PubMed] [Google Scholar]
- 44. Abramow-Newerly M., Roy A. A., Nunn C., Chidiac P. (2006) RGS proteins have a signalling complex. Interactions between RGS proteins and GPCRs, effectors, and auxiliary proteins. Cell. Signal. 18, 579–591 [DOI] [PubMed] [Google Scholar]
- 45. Turner E. M., Blazer L. L., Neubig R. R., Husbands S. M. (2012) Small molecule inhibitors of regulator of G protein signalling (RGS) proteins. ACS Med. Chem. Lett. 3, 146–150 [DOI] [PMC free article] [PubMed] [Google Scholar]
- 46. Sjögren B., Neubig R. R. (2010) Thinking outside of the “RGS box”. New approaches to therapeutic targeting of regulators of G protein signaling. Mol. Pharmacol. 78, 550–557 [DOI] [PMC free article] [PubMed] [Google Scholar]
- 47. Hague C., Bernstein L. S., Ramineni S., Chen Z., Minneman K. P., Hepler J. R. (2005) Selective inhibition of α1A-adrenergic receptor signaling by RGS2 association with the receptor third intracellular loop. J. Biol. Chem. 280, 27289–27295 [DOI] [PubMed] [Google Scholar]
- 48. Garzón J., Rodríguez-Muñoz M., López-Fando A., García-España A., Sánchez-Blázquez P. (2004) RGSZ1 and GAIP regulate μ- but not δ-opioid receptors in mouse CNS. Role in tachyphylaxis and acute tolerance. Neuropsychopharmacology 29, 1091–1104 [DOI] [PubMed] [Google Scholar]
- 49. Mao H., Zhao Q., Daigle M., Ghahremani M. H., Chidiac P., Albert P. R. (2004) RGS17/RGSZ2, a novel regulator of Gi/o, Gz, and Gq signaling. J. Biol. Chem. 279, 26314–26322 [DOI] [PubMed] [Google Scholar]
- 50. Pereira P. S., Jones N. C. (2001) The RGS domain-containing fission yeast protein, Rgs1p, regulates pheromone signalling and is required for mating. Genes Cells 6, 789–802 [DOI] [PubMed] [Google Scholar]
- 51. Sethakorn N., Yau D. M., Dulin N. O. (2010) Non-canonical functions of RGS proteins. Cell. Signal. 22, 1274–1281 [DOI] [PMC free article] [PubMed] [Google Scholar]
- 52. Chatterjee T. K., Fisher R. A. (2000) Cytoplasmic, nuclear, and Golgi localization of RGS proteins. Evidence for N-terminal and RGS domain sequences as intracellular targeting motifs. J. Biol. Chem. 275, 24013–24021 [DOI] [PubMed] [Google Scholar]
- 53. Liu Z., Fisher R. A. (2004) RGS6 interacts with DMAP1 and DNMT1 and inhibits DMAP1 transcriptional repressor activity. J. Biol. Chem. 279, 14120–14128 [DOI] [PubMed] [Google Scholar]
- 54. Mata J., Bähler J. (2006) Global roles of Ste11p, cell type, and pheromone in the control of gene expression during early sexual differentiation in fission yeast. Proc. Natl. Acad. Sci. U.S.A. 103, 15517–15522 [DOI] [PMC free article] [PubMed] [Google Scholar]
- 55. Xue-Franzén Y., Kjaerulff S., Holmberg C., Wright A., Nielsen O. (2006) Genomewide identification of pheromone-targeted transcription in fission yeast. BMC Genomics 7, 303. [DOI] [PMC free article] [PubMed] [Google Scholar]
- 56. Robinson L. C., Menold M. M., Garrett S., Culbertson M. R. (1993) Casein kinase I-like protein kinases encoded by YCK1 and YCK2 are required for yeast morphogenesis. Mol. Cell Biol. 13, 2870–2881 [DOI] [PMC free article] [PubMed] [Google Scholar]
- 57. Mumby S. M. (1997) Reversible palmitoylation of signaling proteins. Curr. Opin. Cell Biol. 9, 148–154 [DOI] [PubMed] [Google Scholar]
- 58. Kenakin T. (2004) Principles. Receptor theory in pharmacology. Trends Pharmacol. Sci. 25, 186–192 [DOI] [PubMed] [Google Scholar]
- 59. Sayar K., Uğur O., Liu T., Hilser V. J., Onaran O. (2008) Exploring allosteric coupling in the α-subunit of heterotrimeric G proteins using evolutionary and ensemble-based approaches. BMC Struct. Biol. 8, 23. [DOI] [PMC free article] [PubMed] [Google Scholar]
- 60. Onaran H. O., Costa T., Rodbard D. (1993) βγ subunits of guanine nucleotide-binding proteins and regulation of spontaneous receptor activity. Thermodynamic model for the interaction between receptors and guanine nucleotide-binding protein subunits. Mol. Pharmacol. 43, 245–256 [PubMed] [Google Scholar]
- 61. Hao N., Yildirim N., Wang Y., Elston T. C., Dohlman H. G. (2003) Regulators of G protein signaling and transient activation of signaling. Experimental and computational analysis reveals negative and positive feedback controls on G protein activity. J. Biol. Chem. 278, 46506–46515 [DOI] [PubMed] [Google Scholar]
- 62. Kofahl B., Klipp E. (2004) Modelling the dynamics of the yeast pheromone pathway. Yeast 21, 831–850 [DOI] [PubMed] [Google Scholar]
- 63. Li C., Donizelli M., Rodriguez N., Dharuri H., Endler L., Chelliah V., Li L., He E., Henry A., Stefan M. I., Snoep J. L., Hucka M., Le Novère N., Laibe C. (2010) BioModels Database. An enhanced, curated and annotated resource for published quantitative kinetic models. BMC Syst. Biol. 4, 92. [DOI] [PMC free article] [PubMed] [Google Scholar]