Abstract
Background
Chronic progressive external ophthalmoplegia (CPEO) is a classical mitochondrial ocular disorder characterised by bilateral progressive ptosis and ophthalmoplegia. These ocular features can develop either in isolation or in association with other prominent neurological deficits (CPEO+). Molecularly, CPEO can be classified into two distinct genetic subgroups depending on whether patients harbour single, large-scale mitochondrial DNA (mtDNA) deletions or multiple mtDNA deletions secondary to a nuclear mutation disrupting mtDNA replication or repair. The aim of this magnetic resonance imaging (MRI) study was to investigate whether the ophthalmoplegia in CPEO is primarily myopathic in origin or whether there is evidence of contributory supranuclear pathway dysfunction.
Methods
Ten age-matched normal controls and twenty patients with CPEO were recruited nine patients with single, large-scale mtDNA deletions and eleven patients with multiple mtDNA deletions secondary to mutations in POLG, PEO1, OPA1, and RRM2B. All subjects underwent a standardised brain and orbital MRI protocol, together with proton magnetic resonance spectroscopy in two voxels located within the parietal white matter and the brainstem.
Results
There was evidence of significant extraocular muscle atrophy in patients with single or multiple mtDNA deletions compared with controls. There was no significant difference in metabolite concentrations between the patient and control groups in both the parietal white matter and brainstem voxels. Volumetric brain measurements revealed marked cortical and cerebellar atrophy among patients with CPEO+ phenotypes.
Conclusion
The results of this study support a primary myopathic aetiology for the progressive limitation of eye movements that develops in CPEO.
Introduction
Chronic progressive external ophthalmoplegia (CPEO) is a slowly progressive extraocular muscle disorder characterised by bilateral, usually symmetrical, limitation of eye movements and ptosis [1]. This classical manifestation of mitochondrial diseases can develop either in isolation or in association with other disabling neurological features, referred to as CPEO+ [2], [3]. Unsurprisingly, CPEO results in significant morbidity with a marked negative impact on the patient’s quality of life [4]. Molecularly, CPEO can be classified into two distinct genetic subgroups depending on whether patients harbour single, large-scale mitochondrial DNA (mtDNA) deletions or multiple mtDNA deletions secondary to a nuclear mutation disrupting mtDNA replication or repair [5], [6].
The aim of this magnetic resonance imaging (MRI) study was to investigate whether the limitation of eye movements in CPEO is myopathic in origin or whether there is evidence of contributory brainstem dysfunction with magnetic resonance spectroscopy (MRS). Brain volumetric measurements were also performed to assess the extent of central nervous system involvement and whether this correlated with the development of extraocular neurological features in patients with CPEO+ phenotypes.
Patients and Methods
Study Cohort
The study cohort included: (i) nine patients with single, large-scale mtDNA deletions (six females and three males, mean age = 50.8 years, standard deviation (SD) = 3.0 years), (ii) eleven patients with multiple mtDNA deletions (four females, seven males, mean age = 51.6 years, SD = 2.8 years), and (iii) ten age-matched normal controls (seven females and three males, mean age 50.3, SD = 2.3 years) ( Table 1 ). Recruitment was limited to patients younger than 70 years of age to exclude possible age-related confounding factors, and to those with disease duration of more than five years. This study had the relevant institutional ethical approval (County Durham & Tees Valley 1 Research Ethics Committee, 08/H0905/106) and it was carried out in compliance with the Declaration of Helsinki. Participants provided their written consent for participation into this study.
Table 1. Clinical and molecular genetic characteristics of the CPEO cohort.
| Patient | Genetic defect | Age | Sex | EOM limitation | Ptosis severity | Diplopia | Additional neurological complications |
| 1 | Single mtDNA deletion (2.9 Kb) | 66 | M | −3 | Moderate | Yes | Myopathy, cerebellar dysfunction, migraine |
| 2 | Single mtDNA deletion (5.0 Kb) | 45 | F | −3 | Severe | Yes | Myopathy, cerebellar dysfunction, fatigue |
| 3 | Single mtDNA deletion (7.7 Kb) | 61 | F | −4 | Moderate | Yes | Myopathy |
| 4 | Single mtDNA deletion (5.0 Kb) | 57 | F | −3 | Moderate | Yes | Myopathy |
| 5 | Single mtDNA deletion (6.5 Kb) | 42 | F | −3 | Nil | Yes | Fatigue |
| 6 | Single mtDNA deletion (5.0 Kb) | 54 | M | −3 | Severe | No | – |
| 7 | Single mtDNA deletion (4.8 Kb) | 46 | M | −4 | Severe | No | – |
| 8 | Single mtDNA deletion (4.6 Kb) | 41 | F | −3 | Moderate | Yes | – |
| 9 | Single mtDNA deletion (5.0 Kb) | 45 | M | −3 | Severe | Yes | Myopathy, epilepsy |
| 10 | Multiple mtDNA deletions (POLG; p.A467T/p.Arg1096Cys) | 42 | M | −3 | Severe | No | Myopathy, cerebellar dysfunction, peripheral neuropathy |
| 11 | Multiple mtDNA deletions (POLG; p.Trp748Ser/p.Arg1096Cys) | 54 | M | −2 | Mild | Yes | Ataxia, epilepsy, peripheral neuropathy, cognitive impairment |
| 12 | Multiple mtDNA deletions (POLG; p.Ala467Thr/p.X1240Gln) | 52 | F | −3 | Moderate | No | Ataxia, epilepsy, peripheral neuropathy |
| 13 | Multiple mtDNA deletions (POLG; p.Ala467Thr/p.Ala467Thr) | 43 | M | −3 | Mild | Yes | Peripheral neuropathy, myalgia, cognitive impairment |
| 14 | Multiple mtDNA deletions (PEO1; p.Arg374Gln) | 36 | M | −3 | Moderate | No | Myopathy, fatigue |
| 15 | Multiple mtDNA deletions (PEO1; p.Arg334Gln) | 61 | M | −3 | Moderate | No | – |
| 16 | Multiple mtDNA deletions (PEO1; p.Leu381Pro) | 58 | F | −3 | Severe | No | Myalgia |
| 17 | Multiple mtDNA deletions (OPA1; p.Ile432Val) | 42 | M | −2 | Moderate | No | Myopathy, peripheral neuropathy, ataxia, cognitive impairment |
| 18 | Multiple mtDNA deletions (RRM2B; p.Ile224Ser) | 61 | F | −4 | Moderate | Yes | Myopathy |
| 19 | Multiple mtDNA deletions (Unknown nuclear mutation) | 60 | M | −2 | Severe | No | Myopathy, dysarthria |
| 20 | Multiple mtDNA deletions (Unknown nuclear mutation) | 59 | F | −3 | Severe | No | Cerebellar dysfunction |
EOM = extraocular muscle; F = female; M = male.
Clinical and Molecular Investigations
All patients were assessed by an experienced multi-disciplinary team of neurologists and ophthalmologists to define the clinical phenotype and disease severity ( Table 1 ). The limitation of eye movements was quantified from −1 to −4, with −1 indicating only mild limitation and −4 being the worst score, the eye being unable to move from the primary position of gaze [7]. Ptosis severity was graded according to the height of the palpebral aperture: (i) severe (<4 mm), (ii) moderate (4–6 mm), and (iii) mild (>6 mm) [8]. Additional histochemical and molecular investigations were carried out on skeletal muscle biopsies to confirm the clinical diagnosis of CPEO. A nuclear mutation was identified in nine of the eleven patients with CPEO found to harbour multiple mtDNA deletions: (i) POLG mutations (n = 4) [9], PEO1 mutations (n = 3) [10], OPA1 mutations (n = 1) [11], and RRM2B mutations (n = 1) [12]. For two patients, an underlying nuclear genetic defect has so far not been identified. Both these patients had typical clinical features of CPEO and mitochondrial histochemistry performed on skeletal muscle biopsies showed high levels of cytochrome c oxidase-deficient fibres in addition to prominent ragged red fibres.
Magnetic Resonance Studies
MRI and MRS data were acquired on a 3-Tesla Philips Achieva clinical MR system using an 8-channel head coil. Proton MRS analysis was performed by an experienced research physicist (FES) to derive brain metabolite concentrations in the parietal white matter and brainstem regions: (i) choline; (ii) creatine; (iii) total glutamate and glutamine (Glx); (iv) myo-inositol; and (v) N-acetyl-aspartate (NAA). Extraocular and brain compartment volumes were measured using standardised semi-automated segmentation protocols (Text S1), with a high degree of intra- and inter-observer reliability (Table S1).
Statistical Analysis
Statistical analysis was performed using GraphPad™ Prism v5 statistical software (San Diego, CA). Group comparisons were made using the unpaired t-test. Intra-observer and inter-observer variability for the measurement of extraocular muscle and brain volumes was assessed with Pearson correlation coefficient (r).
Results
Extraocular Muscle Morphology
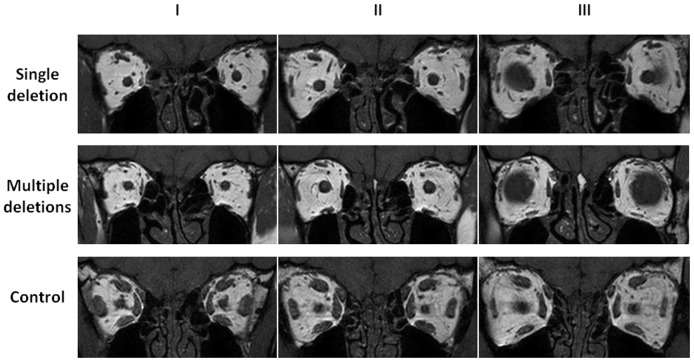
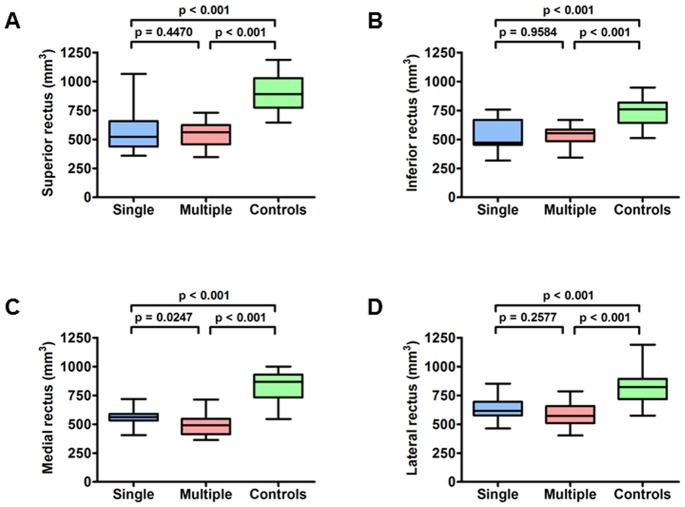
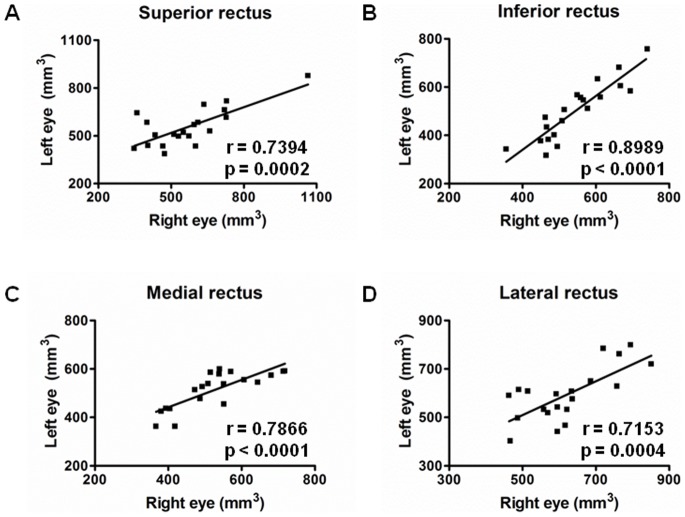
There was a significant reduction in extraocular muscle volumes in the CPEO group compared with normal controls for all four recti muscles ( Figure 1 ), ranging from 24.7% to 40.2% ( Table 2 and Figure 2 ). No significant difference in extraocular muscle volumes was found between the two eyes from the same patient ( Table 3 and Figure 3 ). No specific MRI signal abnormalities were identified along the course of the extraocular muscles in patients with CPEO harbouring either single or multiple mtDNA deletions.
Figure 1. Extraocular muscle morphology in patients with CPEO and controls.
Representative cross-sections of extraocular muscles have been provided at three different anatomical locations. All four recti muscles in patients harbouring single, large-scale deletions or multiple DNA deletions were atrophic compared with controls. Slice locations: I = 4 mm behind slice II towards the orbital apex; II = central slice; III = 4 mm in front of slice II towards the extraocular muscle insertions onto the globe.
Table 2. Extraocular muscle volumes in patients with CPEO and controls.
| Genetic group | Superior rectus | Inferior rectus | Medial rectus | Lateral rectus |
| Mean ± SD (mm3) (%)a | Mean ± SD (mm3) (%)a | Mean ± SD (mm3) (%)a | Mean ± SD (mm3) (%)a | |
| Single mtDNA deletion (n = 9) | 582.6±41.8 (35.4%) | 525.0±30.6 (28.2%) | 556.6±17.9 (32.3%) | 629.3±25.9 (24.7%) |
| P<0.0001 | P<0.0001 | P<0.0001 | P<0.0001 | |
| Multiple mtDNA deletions (n = 11) | 547.3±23.7 (39.4%) | 523.1±19.9 (28.5%) | 491.8±20.3 (40.2%) | 589.1±23.6 (29.5%) |
| P<0.0001 | P<0.0001 | P<0.0001 | P<0.0001 | |
| Controls (n = 10) | 902.4±35.9 | 731.5±26.9 | 822.6±30.1 | 835.3±34.5 |
Percentage reduction compared with controls. The respective P values indicate the level of significance for the comparisons with the control data set. SD: standard deviation.
Figure 2. Comparison of extraocular muscle volumes between patients with CPEO and controls.
Box plot of extraocular muscle volume data with the whiskers representing the minimum and maximum volumes. The ends of the boxes are the upper and lower quartiles, the vertical lengths of the boxes indicate the interquartile range, and the lines within the boxes represent the median volume for each group. CPEO cohort: single = single mtDNA deletion; multiple = multiple mtDNA deletions.
Table 3. Interocular comparison of extraocular muscle volumes in patients with CPEO.
| Anatomical side | Superior rectus | Inferior rectus | Medial rectus | Lateral rectus |
| Mean ± SD (mm3) | Mean ± SD (mm3) | Mean ± SD (mm3) | Mean ± SD (mm3) | |
| Left eye (n = 20) | 556.4±27.0 | 502.5±26.8 | 514.0±17.2 | 593.6±24.6 |
| Right eye (n = 20) | 569.9±37.3 | 545.4±21.6 | 527.9±23.9 | 620.7±25.2 |
| P value | 0.7707 | 0.2205 | 0.6374 | 0.4469 |
The P value for each rectus muscle indicates the level of significance for the comparison between the left and right eye. SD = standard deviation.
Figure 3. Interocular correlation of extraocular muscle volumes in patients with CPEO.
r = Pearson correlation coefficient.
Brain Metabolites and Compartment Volumes
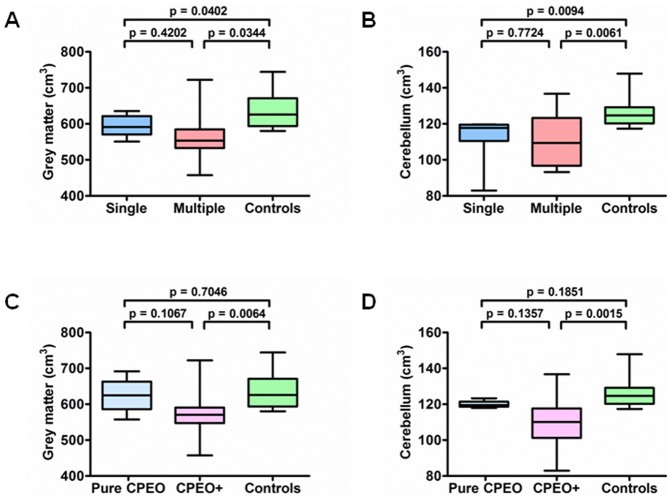
There was no significant difference in metabolite concentrations between the patient and control groups in both the parietal white matter and brainstem voxels ( Table 4 ). There was a statistically significant reduction in total grey matter and cerebellar volumes for both patients with single deletions and multiple mtDNA deletions ( Table 5 ). On subgroup analysis, the reduction in total grey matter and cerebellar volumes was apparent for patients with CPEO+, but not for those with pure CPEO phenotypes ( Figure 4 ).
Table 4. Metabolite concentrations in parietal white matter and brainstem regions.
| Voxel location | Subject group | Choline | Creatine | Glx | Myo-inositol | NAA |
| Mean ± SD (mM) | Mean ± SD (mM) | Mean ± SD (mM) | Mean ± SD (mM) | Mean ± SD (mM) | ||
| Parietal white matter | Single mtDNA deletion (n = 9) | 1.5±0.1 | 10.0±1.4 | 28.9±1.8 | 2.8±0.7 | 15.4±1.0 |
| P = 0.1970 | P = 0.1428 | P = 0.2636 | P = 0.4628 | P = 0.5933 | ||
| Multiple mtDNA deletions (n = 11) | 1.4±0.1 | 10.4±0.5 | 25.6±1.6 | 1.8±0.3 | 13.0±0.9 | |
| P = 0.7495 | P = 0.0825 | P = 0.0451 | P = 0.1703 | P = 0.0171 | ||
| Controls (n = 10) | 1.3±0.3 | 12.5±2.7 | 32.8±2.9 | 4.4±2.1 | 16.0±0.7 | |
| Brainstem | Single mtDNA deletion (n = 9) | 1.5±0.1 | 10.7±0.6 | 28.0±2.0 | 4.1±0.6 | 11.1±0.5 |
| P = 0.4266 | P = 0.7425 | P = 0.6837 | P = 0.2336 | P = 0.3711 | ||
| Multiple mtDNA deletions (n = 11) | 1.4±0.1 | 10.0±1.2 | 23.5±3.1 | 4.2±0.9 | 11.8±0.9 | |
| P = 0.3260 | P = 0.5836 | P = 0.4064 | P = 0.2865 | P = 0.8390 | ||
| Controls (n = 10) | 1.7±0.6 | 11.0±2.5 | 26.7±2.2 | 5.9±1.3 | 12.1±0.8 |
The respective P values indicate the level of significance for the comparisons with the control data set, with P<0.0167 being the threshold level for statistical significance after Bonferroni correction for multiple testing.
Table 5. Volumetric brain measurements in patients with CPEO harbouring single and multiple mtDNA deletions.
| Genetic group | Grey matter | White matter | Brainstem | Cerebellum |
| Mean ± SD (cm3) (%)a | Mean ± SD (cm3) (%)a | Mean ± SD (cm3) (%)a | Mean ± SD (cm3) (%)a | |
| Single mtDNA deletion (n = 9) | 594.2±9.6 (6.6%) | 437.9±14.2 (7.9%) | 28.2±0.8 (7.2%) | 112.6±3.9 (10.8%) |
| P = 0.0402 | P = 0.1168 | P = 0.0575 | P = 0.0094 | |
| Multiple mtDNA deletions (n = 11) | 572.3±22.7 (10.1%) | 462.8±20.7 (2.6%) | 28.1±1.1 (7.6%) | 111.0±4.0 (12.1%) |
| P = 0.0344 | P = 0.6516 | P = 0.1012 | P = 0.0061 | |
| Controls (n = 10) | 636.5±15.8 | 475.3±17.3 | 30.4±0.6 | 126.3±2.7 |
Percentage reduction compared with controls. The respective P values indicate the level of significance for the comparisons with the control data set. SD = standard deviation.
Figure 4. Comparison of brain compartment volumes between patients with CPEO and controls.
Discussion
This study has shown clear evidence of significant extraocular muscle atrophy involving all four recti muscles in CPEO. This striking observation was noted for both patients with single, large-scale mtDNA deletions and for those harbouring multiple mtDNA deletions secondary to an underlying nuclear genetic defect. In a previous report of nine patients with CPEO, Carlow and colleagues observed a significant reduction in extraocular muscle volumes for the inferior rectus, medial rectus and lateral rectus [13]. The superior rectus was not assessed in their study and the diagnosis of CPEO was made on clinical grounds, precluding any genetic subgroup analysis. In a subsequent study, Ortube and colleagues measured extraocular muscle volumes in five patients with a clinical diagnosis of CPEO [14]. In contrast to the findings of our study, a reduction in extraocular muscle volume was noted for the superior rectus muscle only, but not for the other recti muscles despite a severe degree of ophthalmoplegia. There were, however, a number of limitations to the study by Ortube and colleagues, including the relatively small number of patients that were recruited and the lack of a confirmatory molecular diagnosis. Furthermore, only a relatively small portion of the extraocular muscle belly was sampled, which could have underestimated the degree of atrophy in the recti muscles.
Our study is the first to demonstrate objectively that the extent of extraocular muscle atrophy in CPEO is highly symmetrical between the two eyes of the same patient, reflecting the ophthalmoplegia pattern observed clinically [1]. No specific MRI signal abnormalities were identified throughout the whole length of the extraocular muscles in the twenty patients with CPEO that were investigated. A number of other ocular motility disorders can result in bilateral progressive ophthalmoplegia and differentiating these from CPEO can sometimes be challenging, especially when access to specialist mitochondrial genetic services is not routinely available. Although future prospective studies are needed to clarify this further, based on their characteristic extraocular muscle differences, MRI evaluation of the orbit could prove a useful adjunct in the diagnostic evaluation of this group of patients.
A variable decrease in N-acetyl-aspartate (NAA) has previously been reported in the brain of patients with the Kearns-Sayre syndrome – a particularly severe clinical phenotype characterised by the development of CPEO and pigmentary retinopathy before the age of twenty years, often in association with progressive cardiac conduction block [15], [16]. There was no significant difference in metabolite concentrations between the CPEO and control groups in our study. These proton MRS findings are consistent with the later onset and less severe neurological course in the patients that were recruited, none of whom fulfilled the criteria for the Kearns-Sayre syndrome.
Patients with CPEO+ features had significantly reduced total grey matter and cerebellar volumes compared with controls, in keeping with the higher burden of neurological disease in this specific patient population. The prominent degree of atrophy seen in the cerebellum further highlights the particular vulnerability of this specific brain region to the deleterious consequences of mtDNA defects [17], [18]. Patients with CPEO did not have significantly reduced brainstem volumes compared with controls and no brainstem metabolite abnormalities were detected with proton MRS. These observations, taken in conjunction with the marked atrophy of the extraocular muscles, support a primary myopathic origin for the progressive ophthalmoplegia seen in CPEO. However, some caution is required with regards to the subgroup comparisons given the relatively small number of patients in the single and multiple mtDNA deletion groups, and the different nuclear genetic defects involved. Furthermore, although CPEO is characterised by a significant myopathy involving the extraocular muscles, the degree of atrophy observed could still result, at least partly, from degeneration of the oculomotor nuclei as has been observed in some patients [19], [20].
This comprehensive magnetic resonance study of patients with molecularly confirmed CPEO has revealed a number of important findings that are directly relevant to our understanding of the underlying pathophysiology in this mitochondrial ocular disorder. In addition to marked generalised extraocular muscle atrophy, there was clear evidence of significant CNS involvement in this disorder, which becomes clinically manifest in a subgroup of patients.
Supporting Information
Voxel placements and proton magnetic resonance spectra.
(PDF)
Boundary delineation of extraocular muscle cross-sections.
(PDF)
Measurement protocol for brainstem and cerebellar volumes.
(PDF)
Validation of extraocular muscle and brain volume measurements.
(DOC)
Supplementary methods.
(DOC)
Funding Statement
This work was supported by research grants from the Newcastle Joint Research Executive Scientific Committee (JRESC), the Medical Research Council (MRC, UK), and the Wellcome Trust. The funders had no role in study design, data collection and analysis, decision to publish, or preparation of the manuscript.
References
- 1. Richardson C, Smith T, Schaefer A, Turnbull D, Griffiths P (2005) Ocular motility findings in chronic progressive external ophthalmoplegia. Eye 19: 258–263. [DOI] [PubMed] [Google Scholar]
- 2. McFarland R, Taylor RW, Turnbull DM (2010) A neurological perspective on mitochondrial disease. Lancet Neurol 9: 829–840. [DOI] [PubMed] [Google Scholar]
- 3. Fraser JA, Biousse V, Newman NJ (2010) The Neuro-ophthalmology of Mitochondrial Disease. Surv Ophthalmol 55: 299–334. [DOI] [PMC free article] [PubMed] [Google Scholar]
- 4. Yu-Wai-Man C, Smith T, Chinnery PF, Turnbull DM, Griffiths PG (2006) Assessment of visual function in chronic progressive external ophthalmoplegia. Eye 20: 564–568. [DOI] [PubMed] [Google Scholar]
- 5. Greaves LC, Yu-Wai-Man P, Blakely EL, Krishnan KJ, Beadle NE, et al. (2010) Mitochondrial DNA defects and selective extraocular muscle involvement in CPEO. Invest Ophthalmol Vis Sci 51: 3340–3346. [DOI] [PMC free article] [PubMed] [Google Scholar]
- 6. Yu-Wai-Man P, Gorman GS, Taylor RW, Turnbull DM (2012) Diagnostic investigations of patients with chronic progressive external ophthalmoplegia. Br J Ophthalmol 96: 1536. [DOI] [PubMed] [Google Scholar]
- 7. Vivian AJ, Morris RJ (1993) Diagrammatic representation of strabismus. Eye 7: 565–571. [DOI] [PubMed] [Google Scholar]
- 8. Taherian K, Atkinson PL, Shekarchian M, Scally AJ (2007) Comparative study of the subjective and objective grading of ptosis surgery outcomes. Eye 21: 639–642. [DOI] [PubMed] [Google Scholar]
- 9. Horvath R, Hudson G, Ferrari G, Fütterer N, Ahola S, et al. (2006) Phenotypic spectrum associated with mutations of the mitochondrial polymerase gamma gene. Brain 129: 1674–1684. [DOI] [PubMed] [Google Scholar]
- 10. Fratter C, Gorman GS, Stewart JD, Buddles M, Smith C, et al. (2010) The clinical, histochemical, and molecular spectrum of PEO1 (Twinkle)-linked adPEO. Neurology 74: 1619–1626. [DOI] [PMC free article] [PubMed] [Google Scholar]
- 11. Yu-Wai-Man P, Griffiths PG, Gorman GS, Lourenco CM, Wright AF, et al. (2010) Multi-system neurological disease is common in patients with OPA1 mutations. Brain 133: 771–786. [DOI] [PMC free article] [PubMed] [Google Scholar]
- 12. Fratter C, Raman P, Alston CL, Blakely EL, Craig K, et al. (2011) RRM2B mutations are frequent in familial PEO with multiple mtDNA deletions. Neurology 76: 2032–2034. [DOI] [PMC free article] [PubMed] [Google Scholar]
- 13. Carlow TJ, Depper MH, Orrison WW (1998) MR of Extraocular Muscles in Chronic Progressive External Ophthalmoplegia. Am J Neuroradiol 19: 95–99. [PMC free article] [PubMed] [Google Scholar]
- 14. Ortube MC, Bhola R, Demer JL (2006) Orbital Magnetic Resonance Imaging of Extraocular Muscles in Chronic Progressive External Ophthalmoplegia: Specific Diagnostic Findings. J AAPOS 10: 414–418. [DOI] [PMC free article] [PubMed] [Google Scholar]
- 15. Matthews PM, Andermann F, Silver K, Carpati G, Arnold DL (1993) Proton MR spectroscopic characterization of differences in regional brain metabolic abnormalities in mitochondrial encephalomyopathies. Neurology 43: 2484–2490. [DOI] [PubMed] [Google Scholar]
- 16. Kapellar P, Fazekas F, Offenbacher H (1996) Magnetic resonance imaging and spectroscopy of progressive cerebral involvement in Kearns-Sayre syndrome. J Neurol Sci 135: 126–130. [DOI] [PubMed] [Google Scholar]
- 17. Wray SH, Provenzale JM, Johns DR, Thulborn KR (1995) MR of the Brain in Mitochondrial Myopathy. Am J Neuroradiol 16: 1167–1173. [PMC free article] [PubMed] [Google Scholar]
- 18. Lax NZ, Hepplewhite PD, Reeve AK, Nesbitt V, McFarland R, et al. (2012) Cerebellar ataxia in patients with mitochondrial DNA disease: a molecular clinicopathological study. J Neuropathol Exp Neurol 71: 148–161. [DOI] [PMC free article] [PubMed] [Google Scholar]
- 19. Daroff RB, Solitare GB, Pincus JH, Glaser GH (1966) Spongiform encephalopathy with chronic progressive external ophthalmoplegia. Central ophthalmoplegia mimicking ocular myopathy. Neurology. 16: 161–9. [DOI] [PubMed] [Google Scholar]
- 20. Palin EJ, Paetau A, Suomalainen A (2013) Mesencephalic complex I deficiency does not correlate with parkinsonism in mitochondrial DNA maintenance disorders. Brain. 136: 2379–92. [DOI] [PubMed] [Google Scholar]
Associated Data
This section collects any data citations, data availability statements, or supplementary materials included in this article.
Supplementary Materials
Voxel placements and proton magnetic resonance spectra.
(PDF)
Boundary delineation of extraocular muscle cross-sections.
(PDF)
Measurement protocol for brainstem and cerebellar volumes.
(PDF)
Validation of extraocular muscle and brain volume measurements.
(DOC)
Supplementary methods.
(DOC)


