Abstract
Leptin, a hormone mainly produced by fat cells, shows cell-specific effects to regulate feeding and metabolic activities. We propose that an important feature of metabolic dysregulation resulting in obesity is the loss of the circadian rhythm of biopotentials. This was tested in the pan-leptin receptor knockout (POKO) mice newly generated in our laboratory. In the POKO mice, leptin no longer induced pSTAT-3 signaling after intracerebroventricular injection. Three basic phenotypes were observed: the heterozygotes had similar weight and adiposity as the wild-type (WT) mice (>60% of the mice); the homozygotes were either fatter (∼30%), or rarely leaner (<5%) than the WT mice. By early adulthood, the POKO mice had higher average body weight and adiposity than their respective same-sex WT littermate controls, and this was consistent among different batches. The homozygote fat POKO showed significant reduction of midline estimating statistic of rhythm of circadian parameters, and shifts of ultradian rhythms. The blunted circadian rhythm of these extremely obese POKO mice was also seen in their physical inactivity, longer feeding bouts, and higher food intake. The extent of obesity correlated with the blunted circadian amplitude, accumulative metabolic and locomotor activities, and the severity of hyperphagia. This contrasts with the heterozygote POKO mice which showed little obesity and metabolic disturbance, and only subtle changes of the circadian rhythm of metabolic activity without alterations in feeding behavior. The results provide a novel aspect of leptin resistance, almost manifesting as an “all or none” phenomenon.
Keywords: leptin, metabolic activity, obesity, circadian rhythm, physical inactivity
leptin is a 16-kDa protein produced mainly by fat cells and released to the circulation. Among its diverse effects is regulation of feeding and metabolic activities. Blood leptin concentrations show a distinctive circadian rhythm, reaching a peak 2 h before light onset, similar to that of melatonin. Leptin level is entrained by meals (28, 30, 31) and regulated by gender and adiposity (20, 29). Leptin crosses the blood-brain barrier (BBB) by a saturable transport mechanism (2), and this transport has a circadian rhythm both at the BBB and the blood-spinal cord barrier (26). Leptin resistance is a phenomenon seen in obesity and inflammation, defined as a lack of expected physiological response or cellular signaling in the presence of hyperleptinemia, often associated with saturation of leptin transport across the BBB (1). However, it is not yet clear whether leptin resistance plays a causal role in metabolic changes.
Leptin binds to its specific receptor LepR to exert biological effects. Neuronal LepRb isoform signaling is essential to mediate its effect on feeding suppression, as shown by diabesity in neuronal LepRb knockout mice (7, 22) and by restoration of metabolic function in db/db mice after LepRb reconstitution (6, 9, 18). In contrast to a catabolic role of neuronal leptin signaling, astrocytic and endothelial LepRs play counterregulatory roles in feeding and metabolic phenotype (15, 23). Obesity is associated with inflammation and increased blood levels of adipokines. While obesity predisposes human and other primates to obstructive sleep apnea and impaired sleep quality, short sleep duration and fragmented sleep also contribute to obesity. It is known that disrupted circadian rhythms may precipitate obesity (3, 12, 32), but it is not clear how obesity disrupts the circadian rhythm of the biological system. We propose that an important feature of metabolic dysregulation resulting in obesity is the loss of the circadian rhythm of biopotentials. This was tested in the recently generated pan-LepR knockout (POKO) mice. The results suggest that obesity and leptin resistance can lead to circadian disruption compared with the reverse.
MATERIALS AND METHODS
Generating pan-leptin receptor knockout mice.
The LepR-floxed mice with loxP sites flanking exon 17 of LepR encoding the membrane juxtapositional cytoplasmic domain were generated in the lab of Dr. Streamson Chua, Jr., on a FVB background and maintained on a C57 background in the lab of Dr. Silvana Obici for more than six generations. They were further backcrossed in our laboratory with C57 mice (Jackson Laboratory, Bar Harbor, ME) until the 10th generation at the time of cross-breeding for this study. Tie2-cre recombinase transgenic mice were purchased from the Jackson Laboratory. These mice were housed and maintained at the PBRC Comparative Biology Core for more than 10 generations with food and water ad libitum in a 12:12-h light/dark regimen. The animal studies were approved by the Institutional Animal Care and Use Committee.
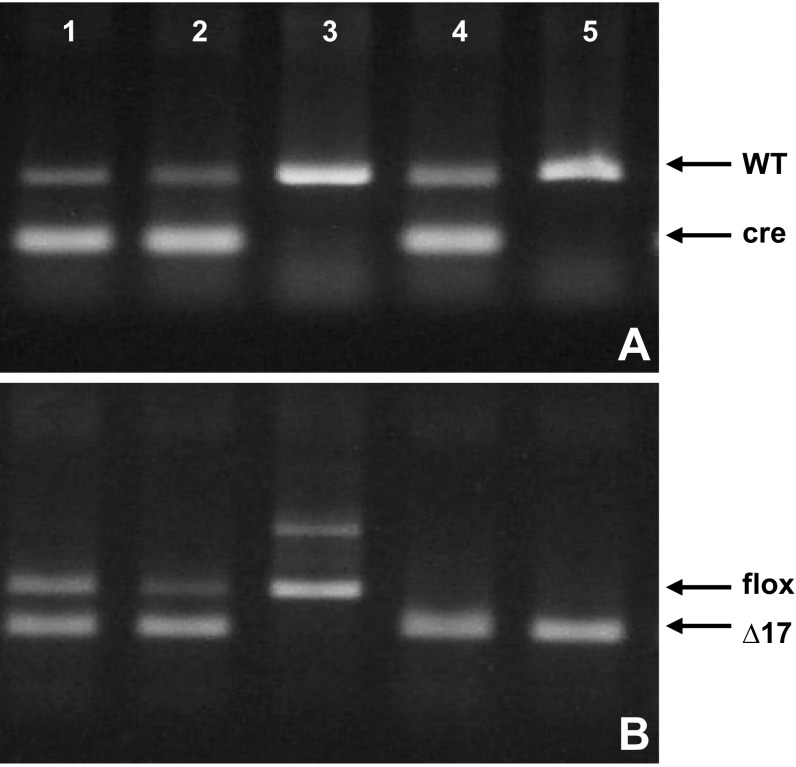
In an attempt to generate endothelial specific leptin receptor knockout (ELKO) mice, Tie2-cre recombinase transgenic (Tie2cre/wt) mice were first crossed with LepR floxed (LepRloxP/loxP) mice to generate intermediate F1 (Tie2cre/wtLepRloxP/wt) mice. The F1 mice were then backcrossed with LepR floxed mice to derive the desired ELKO (Tie2cre/wt LepRloxP/loxP) mice. The genotype of each mouse was determined by PCR with primers (Table 1) and genomic DNA extracted from the tail as described previously (15). However, when the female ELKO mice were again bred with male LepR floxed mice, there was embryonic deletion of the floxed exon 17 sequence of LepR (Δ17) resulting in pan-leptin receptor knockout (POKO) mice with general mutant membrane-bound LepR. Genotyping with tail genomic DNA confirmed the presence of exon 17 of LepR in these mice, despite an absence of the cre PCR product. These were POKO homozygotes, including [wt,Δ17], and [cre,Δ17] in the tail genotype. In other mice, coexisting cre and wt bands were present in cre recombinase genotyping, and Δ17 PCR product was present in LepR genotyping. There were heterozygote mice, including [cre,wt,Δ17], [cre,floxed/floxed,Δ17], and [cre,wt/floxed,Δ17]. The presence of the Δ17 PCR product in the absence of cre PCR product indicates a non-cell-specific deletion of LepR in all tissues (Fig. 1). This contrasts with the cell-specific mutation of LepR in the ELKO mice (15, 23).
Table 1.
PCR primers
| Forward Primers | Reverse Primers | Amplicon Size | |
|---|---|---|---|
| Tie2-cre* | 5′-CTAGGCCACAGAATTGAAAGATCT-3′ | 5′-GTAGGTGGAAATTCTAGCATCATCC-3′ | Wild type: 324 bp |
| 5′-GCGGTCTGGCAGTAAAAACTATC-3′ | 5′-GTGAAACAGCATTGCTGTCACTT-3′ | Transgene: 100 bp | |
| LepR-flox† | 5′-TGAGTTCCCTCATGATTCTGG-3′ | 5′-ACAGGCTTGAGAACATGAACAC-3′ | Wild type: 289 bp |
| 5′-CAGCCGACCAATGCTTATT | Transgene: 339 bp | ||
| Δ17: 208 bp |
Sequences supplied by the Jackson Laboratory.
Sequences from McMinn et al. (21).
Fig. 1.
PCR results showing the genotype of wild-type (WT), endothelial specific leptin receptor knockout (ELKO), and pan-leptin receptor knockout (POKO) mice. A: an amplicon at ∼100 bp was detected in mice with the Tie2-cre transgene (indicated as cre). In mice devoid of Tie2-cre transgene, there was only an internal control band (indicated as WT). B: result of PCR of genomic DNA with a band at 339 bp indicating a floxed LepR (indicated as flox). When the floxed exon 17 had been excised by Cre recombinase, the PCR results showed a smaller amplicon at 208 bp (indicated as Δ17). Lanes 1 and 2, ELKO; lane 3, WT; lanes 4 and 5, POKO.
Lack of leptin-induced pSTAT3 activation shown by Western blotting (WB).
After overnight fasting, 3-mo-old male POKO, ELKO, and their wild-type (WT) littermates were injected with mouse recombinant leptin (R&D Systems, Minneapolis, MN) dissolved in phosphate-buffered saline (PBS) or with vehicle between 1:00 pm and 2:00 pm either intraperitonealy (ip, 3 mg/kg) or through intracerebroventricular (icv) delivery (2.5 μg/μl per mouse) under anesthesia (urethane, 1 g/kg). At 45 min after leptin ip or 30 min after leptin icv, the mice were killed and the hypothalamus and cortex were dissected on ice followed by snap-freezing in liquid nitrogen. The frozen tissues were stored at −80°C until use.
Total protein was extracted from tissue by sonication in icy cold RIPA buffer containing protease inhibitor and phosphatase inhibitor cocktail (Thermo Scientific, Rockford, IL). The homogenate was centrifuged at 18,000 g at 4°C for 15 min. The supernatant was transferred to a new tube and the protein concentration was determined by Pierce BCA Protein Assay Kit (Thermo Scientific). Fifty micrograms of total protein from each sample was mixed with adequate amount of Laemmli sample buffer (Bio-Rad, Hercules, CA), boiled for 5 min, and then loaded to 8.5% SDS-PAGE for electrophoresis. Afterwards, the proteins on the SDS-PAGE were transferred to 0.45 μm nitrocellulose membrane (Bio-Rad) for WB. The nitrocellulose membrane was blocked in 5% BSA and was incubated with anti-pSTAT3 (Tyr 705) primary antibody (1:1,000, Cell Signaling Technology, Boston, MA) at 4°C overnight and then with horseradish peroxidase (HRP)-conjugated secondary antibody (1:5,000) at room temperature for 1 h. The signal of pSTAT3 was developed on an X-ray film after incubation with nitrocellulose membranes in Pierce ECL Western Blotting Substrate (Thermo Scientific). After anti-pSTAT3 antibody was stripped off with Restore Western Blot Stripping Buffer (Thermo Scientific), the same blot was used to determine total STAT3 level with anti-STAT3 antibody (1:2,000, Cell Signaling Technology) following the same procedure as for pSTAT3. The amount of expressed pSTAT3 and STAT3 was quantified by NIH ImageJ software. The expression level of pSTAT3 was normalized to the level of total STAT3 for statistical comparison (n = 2/group).
Metabolic chambers and cosinor analysis of metabolic activities.
The POKO and WT littermates of both sexes were weighed weekly and their body fat (%body wt) was measured monthly in a Bruker Minispec live mouse analyzer (Bruker Optics, The Woodslands, TX). At 19 wk of age, the mice were subjected to metabolic chamber studies as described previously (13, 23).
The metabolic profile of the mice was determined by Oxymax open-circuit calorimeter (Columbus Instruments, Columbus, OH). After acclimation of the mice to the Oxymax setup for 3 days, 7 variables [oxygen consumption (V̇o2), carbon dioxide production (V̇co2), respiratory exchange ratio (RER), heat dissipation (Heat), total activity at x-axis (XTOT), ambulation at x-axis (XAMB), and total activity at z-axis (ZTOT)] were sampled every 18 min for another 3 days from 13 WT (9 male, 4 female) and 10 POKO (5 male, 5 female) mice (n = 237 time points). Among the latter, 1 male (M344) and 1 female (F353) differed from the others by being excessively obese. Differences between males and females in each group were plotted as a function of time as were differences between WT and POKO mice of each sex. For each animal, the accumulated metabolic activities in each light and dark cycle in 3 days were calculated separately and averaged. The results of these accumulated metabolic parameters in light and dark cycle in each group were compared by Student's t-test.
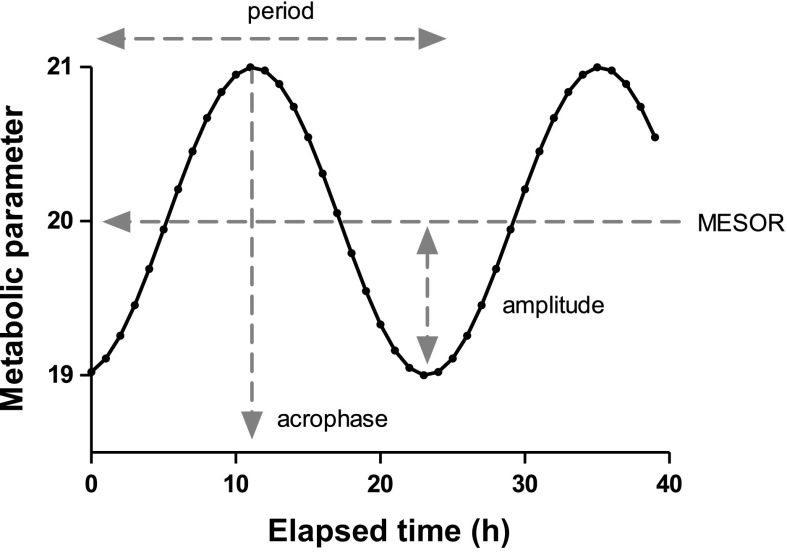
The circadian parameters in the metabolic profile were assessed by the cosinor analysis that models the circadian rhythms as a cosine function with the following attributes: amplitude (half of the extent that the cosine wave oscillates), midline estimating statistic of rhythm (MESOR, the mean value of the peak and nadir between which the predicted cosine wave oscillates), acrophase (the elapsed time from 12:00 am to reach the peak value of the cosine wave within a period), and period (the duration of one cycle), as described previously (4, 27). The predicted models for current metabolic data can be expressed as the following cosine function and illustrated as in Fig. 2:
where M is MESOR, A is amplitude, t is elapsed time, τ is period, and φ is acrophase.
Fig. 2.
Graphic illustration of circadian parameters analyzed by cosinor analysis.
The predicted cosine functions of individual records were acquired by least-squares analysis in the frequency range of one cycle in 3 days to 24 cycles per day for each variable. Phase-unweighted average spectra were obtained by averaging cosine function attributes at each trial period for each sex in each group (WT and POKO). Student's t-test compared amplitudes, MESOR, and acrophase of each variable between groups at a given trial period for sex and KO differences. The 90% prediction limits were also computed. Population-mean cosinor spectra were obtained for each group and variable in the frequency range of 1–24 cycles per day. Parameter tests were performed to assess sex and group differences for the first 5 harmonic terms with periods of 24, 12, 8, 6, and 4.8 h.
Measurement of food intake.
Groups of POKO and WT mice (n = 10/group, mixed sexes, excluding the two extremely obese mice that could not access the food chamber) were adapted to single housing for 3 days in BioDaq cages (Research Diets, New Brunswick, NJ), and food measurement was monitored for 10 days. The accumulated food intake in each hour in the dark cycle and in the light cycle was compared.
Statistical analyses.
Group means were expressed with their standard errors. Two-way analysis of variance (ANOVA) with repeated measures on one factor was used to analyze the results of body weight and fat composition measured over time. Two-way ANOVA followed by Bonferroni's posttest was used to analyze WB results. Cosinor analysis for circadian rhythm data and analysis of other metabolic activity results were described in the metabolic chamber section above. For other nonrhythmic data with cross-sectional measures, when more than two groups were compared, one-way ANOVA was performed, followed by Tukey's post hoc test. When two groups were compared, an unpaired t-test was performed. SPSS or GraphPad Prism 5 was used for statistical analysis.
RESULTS
Characterization of the specificity and efficiency of POKO.
The POKO mice were first identified from tail genotyping while breeding female ELKO mice with male LepR floxed mice. In Fig. 1, lanes 1 and 2 are from ELKO mice, lane 3 from a WT mouse, and lanes 4 and 5 from POKO mice. In the WT mouse, tail genomic DNA did not contain Tie2-cre transgene (lane 3, Fig. 1A). One of the two loxP sites close to the 5′-end of exon 17 of LepR was still detectable and no deletion of exon 17 occurred (lane 3, Fig. 1B). In the ELKO mice, the Tie2-cre transgene was present (lanes 1 and 2, Fig. 1A), but part of the exon 17 of LepR had already been excised and the gel image of the PCR product shows a Δ17 band. This probably resulted from endothelial cells in the tail. Concurrently, there remained loxP-flanked LepR at a higher molecular weight than the Δ17 band (lanes 1 and 2, Fig. 1B). In the homozygote POKO mice, by contrast, the Δ17 band was present (Fig. 1B) regardless of the existence of Tie2-cre (Fig. 1A, lanes 4 and 5).
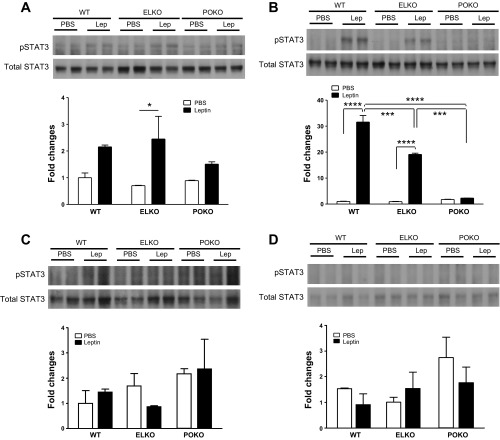
The percentage of functional membrane-bound LepR remaining in POKO brains was assessed by the ability of leptin to activate STAT3 signaling in the hypothalamus of the brain. When leptin was given ip at the dose of 3 mg/kg, the pSTAT3 level in the hypothalamus was increased in WT, ELKO, and POKO compared with vehicle-only groups (F1,6 = 16.20, P = 0.007). However, leptin-induced pSTAT3 level was not influenced by the different genetic background (F2,6 = 0.75, P = 0.514), suggesting the presence of secondary mediators (Fig. 3A). When 2.5 μg of leptin was delivered directly into the brain by icv injection to avoid potential peripheral interference, the level of leptin-induced pSTAT3 in hypothalamus was dependent on the genetic background (F2,6 = 104.33, P < 0.0001). WT and ELKO mice both showed a significant increase of pSTAT3 in the hypothalamus (P < 0.0001). However, the POKO mice failed to show an increase of pSTAT3 upon leptin stimulation. The level of induced pSTAT3 was highest in WT hypothalamus and lowest in POKO hypothalamus (Fig. 3B). Cerebral cortex did not respond to leptin stimulation as strongly as hypothalamus in all three groups when leptin was given either ip (F1,6 = 0.69, P = 0.437) or icv (F1,6 = 0.02, P = 0.900), consistent with a relatively low level of LepRb there (Fig. 3, C and D).
Fig. 3.
pSTAT3 level after leptin induction in hypothalamus and cortex. A: in hypothalamus, ip injection. B: in hypothalamus, icv injection. C: in cortex, ip injection. D: in cortex, icv injection. Leptin dose and induction time: ip: 3 mg/kg, 45 min; icv: 2.5 μg/mouse, 30 min. *P < 0.05, ***P < 0.001, ****P < 0.0001.
Body weight and adiposity in POKO mice.
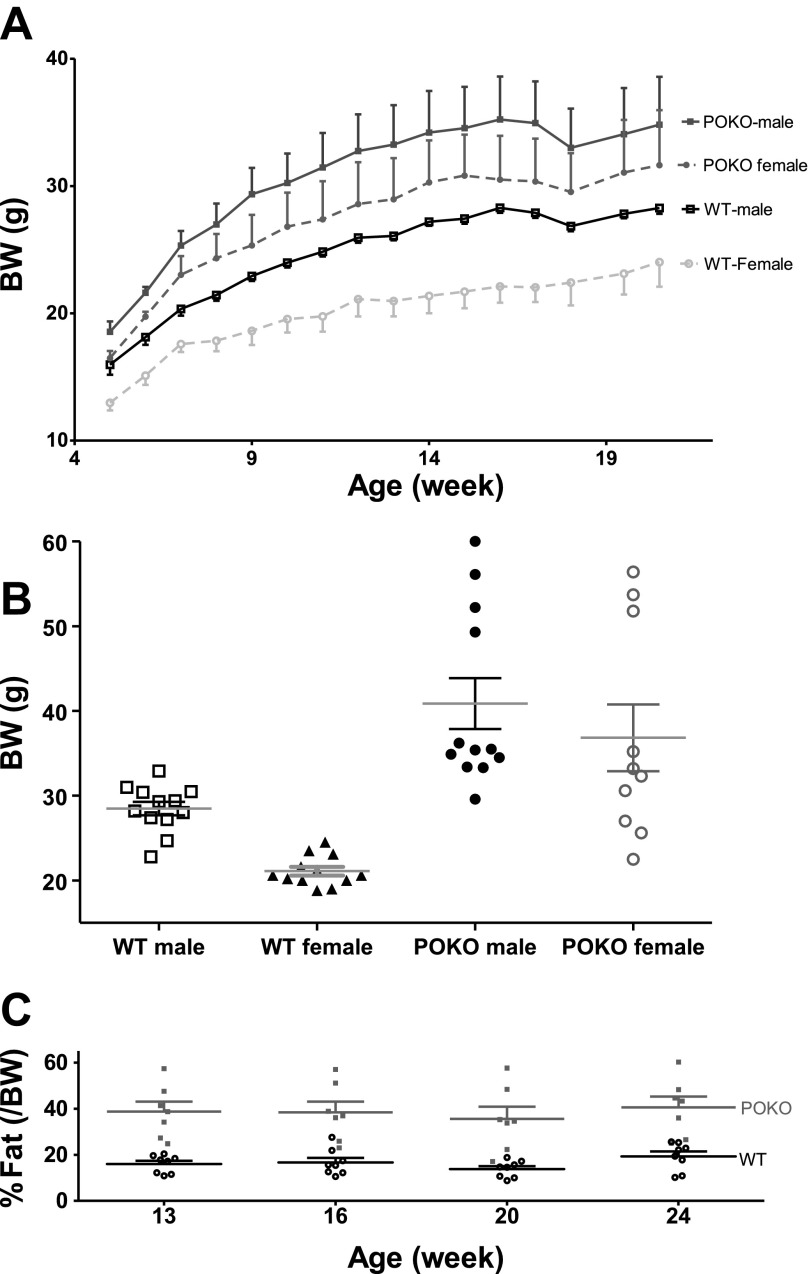
Four groups of mice were studied: WT male (n = 9), POKO male (n = 5), WT female (n = 4), and POKO female (n = 5). Body weight was measured weekly starting from age 5 wk (Fig. 4A). In general, body weight increased over time regardless of genotype and sex (F15,285 = 84.28, P < 0.0001), and different genotype and sex had different growth curves (F3,19 = 6.09, P = 0.004). In WT mice, male mice had higher body weight than female mice in general (F1,11 = 24.80, P = 0.0004), and the sex factor significantly affected the weight gain over time (F15,165 = 4.27, P < 0.0001), indicating that the male mice gained weight faster than the female mice. Such interaction of sex and time in weight gain was not seen in POKO mice (F15,120 = 0.23, P = 0.999), and neither sex of POKO differed from each other in body weight (F1,8 = 0.93, P = 0.363). Comparison of the body weight of WT and POKO of the same sex showed that the body weight of male POKO mice was generally heavier than that of male WT (F1,12 = 11.20, P = 0.006), and these male POKO gained weight slightly, but not significantly, faster over time than male WT (F15,180 = 1.68, P = 0.058). Similarly, although without statistical significance, the body weight of female POKO was also heavier than that of female WT overall (F1,7 = 5.05, P = 0.059). However, there was no interaction between genotype and time factor in female mice (F15,105 = 0.97, P = 0.49), which indicates that the two growth curves of female WT and POKO are parallel to each other. At the end of the study, it was apparent that the POKO group was heterogeneous; about one-third of POKO male and 30% of POKO female were significantly heavier than other mice in the same group (Fig. 4B). This trend was consistent among different batches of mice. Overall, the heterozygotes had similar weight and adiposity as the WT mice (>60% of the mice); the homozygotes were either fatter (∼30%), or rarely leaner (<5%) than the WT mice. Among the fat POKO, those with a genotype of [wt,Δ17] were heavier than [cre,Δ17].
Fig. 4.
Basic phenotype of the POKO mice, shown by increased weight over time (A), stratification within groups, differentiating obese mice and those with relatively normal weight at the end of the study (B), and higher percent fat at all time points (C).
The percent fat in the body was measured every 4 wk during the ages of 13–24 wk (Fig. 4C). Since there was no sex difference in fat composition at this age bracket in WT (F1,6 = 0.57, P = 0.479) or in POKO (F1,5 = 0.04, P = 0.848), the data from both sexes were combined for comparison between WT and POKO. Overall, POKO mice had higher fat composition than WT mice (F1,13 = 21.87, P = 0.0004). Compared with the baseline at week 13, only the WT group had a significant increase of percent fat over time, at week 24 (t = 2.87, P < 0.05).
Metabolic activities.
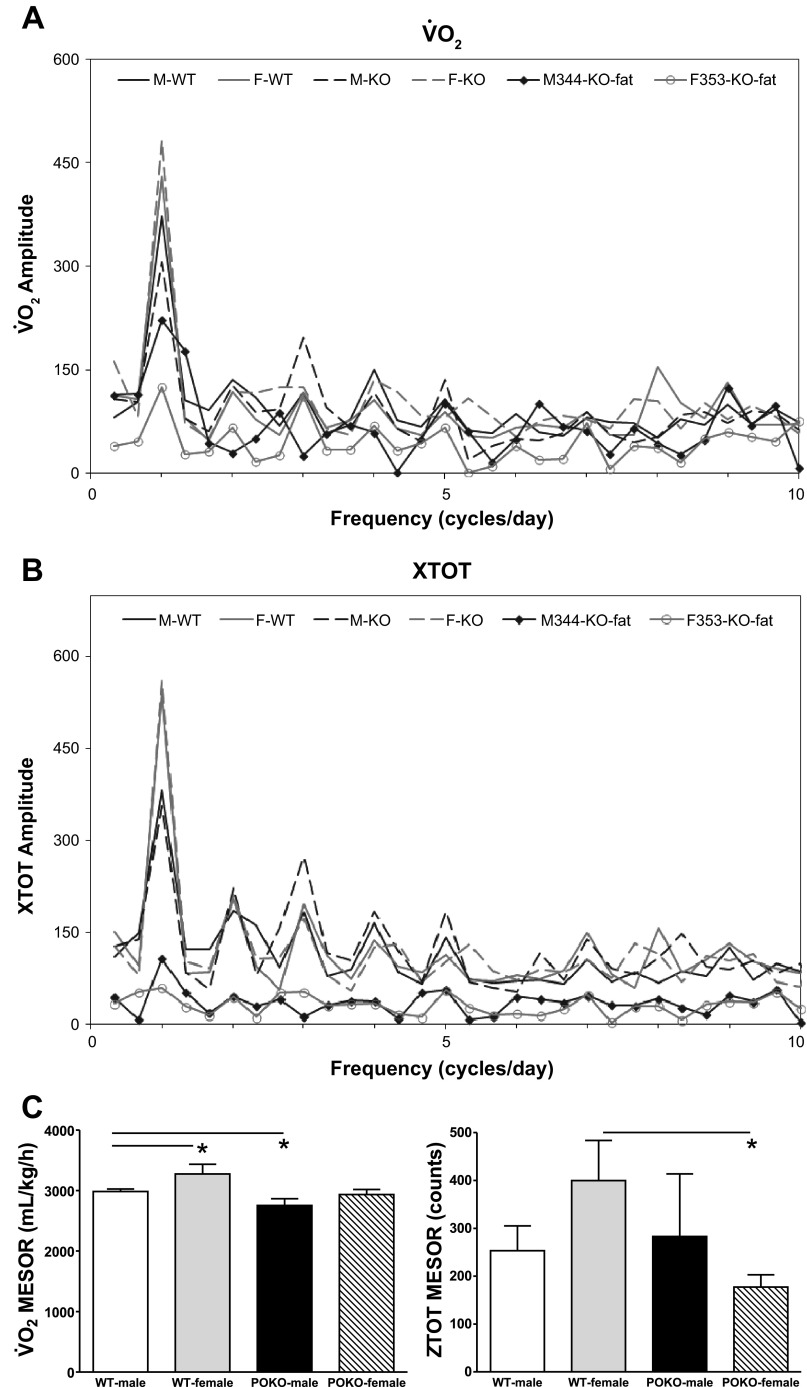
The metabolic parameters (V̇o2, V̇co2, RER, Heat, XTOT, XAMB, and ZTOT) all showed circadian variations. The lean POKO and WT mice did not differ greatly in MESOR, circadian amplitude, or acrophase of the metabolic variables, as shown in the 3-day average used for cosinor analysis. Only the MESOR of V̇o2 of male POKO mice and the MESOR of ZTOT of female POKO mice were lower than those of their WT counterparts. Nonetheless, compared with female WT mice, female POKO mice had later 8-h and 6-h acrophases of RER and an earlier 24-h acrophase of Feed. Compared with male WT mice, male POKO mice had earlier 12-h acrophases of V̇o2, V̇co2, RER, Heat, XTOT, XAMB, and ZTOT, earlier 8-h acrophases of RER, Heat, and Feed, and a larger 8-h amplitude of V̇o2, V̇co2, Heat, and XAMB.
More pronounced differences were observed for the fat POKO mice. Both male and female fat POKO mice had a lower MESOR of V̇o2, V̇co2, and XAMB and a higher MESOR of Heat. They also had a smaller 24-h amplitude of RER. In addition, the female fat POKO mouse had a lower 24-h amplitude of V̇o2, V̇co2, Heat, and XAMB. These differences were statistically significant as they exceeded the 90% prediction limits of the WT mice and/or their non-fat POKO counterparts.
The representative least-squares spectra of V̇o2 (Fig. 5A) and XTOT horizontal activity (Fig. 5B), and their respective MESOR (Fig. 5C), are shown.
Fig. 5.
Metabolic parameters analyzed by the cosinor method. A: the least-squares spectrum of oxygen consumption (V̇o2) of the fat POKO mice was lower than group average and lean mice, most pronounced for the 24-h amplitude, and lower in female fat POKO than male fat POKO. B: the least-squares spectrum of XTOT of the fat POKO mice was lower than the lean POKO or WT groups, shown in the 24 h, 12 h, 8 h, 6 h, and 4.8 h rhythms. C: when all POKO male and females were compared with their respective WT groups of the same sex, POKO male had a reduced MESOR of V̇o2 (top), whereas POKO female had a reduced MESOR of XTOT (bottom). *P < 0.05.
Food intake.
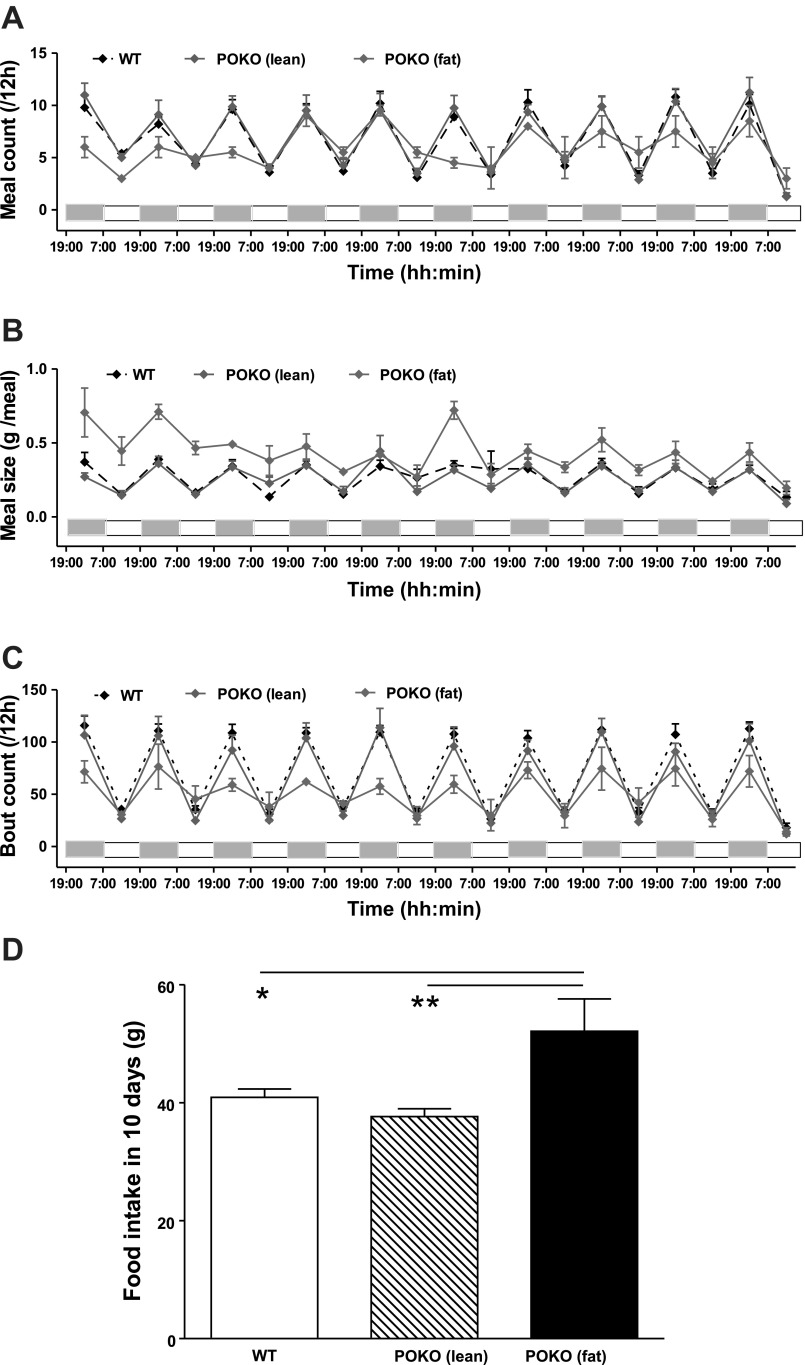
BioDaq data analysis detected differences of food intake in WT and POKO mice in regard to accumulated meal count (Fig. 6A), averaged meal size (Fig. 6B), and accumulated food intake (Fig. 6C) in every light/dark cycle. The sex difference in these parameters in either WT or POKO was not significant [accumulated food intake: FWT(1,152) = 1.09, P = 0.327; FPOKO(1,114) = 0.22, P = 0.659; averaged meal size: FWT(1,152) = 2.23, P = 0.174; FPOKO(1,114) = 1.30, P = 0.298; accumulated food intake: FWT(1,152) = 3.80, P = 0.087; FPOKO(1,114) = 1.56, P = 0.258]. Therefore, comparisons between WT and POKO were made on the data with mixed sexes. The total food intake in 10 days is shown in Fig. 6D. Although food intake was similar between WT and heterozygote POKO, the homozygote POKO mice showed longer feeding bouts and higher food intake, although statistical evaluation was limited by the small sample size.
Fig. 6.
Feeding measurement of the POKO and WT mice in 10 consecutive days of single housing in BioDaq, showing meal count (A), meal size (B), number of feeding bouts (C) over 12-h periods, as well as accumulative food intake over 10 days (D). *P < 0.05; **P < 0.01.
DISCUSSION
In this study we showed the loss of leptin signaling at its brain targets in POKO mice, the correlation of metabolic phenotype and hyperphagic feeding behavior with genotype, and a striking stratification of dampened circadian rhythm of the obese POKO mice compared with their heterozygous and WT littermates. A complete loss of leptin signaling in all cells led to the most pronounced obesity and altered circadian and ultradian rhythm of metabolic activities and feeding.
There are five isoforms of LepR in mice, showing differential expression in different cell types and regions. The effect of leptin on feeding regulation in normal animals is commonly thought to be mediated by LepRb in neurons, particularly in the arcuate nucleus in hypothalamus (10). In mice with adult-onset obesity, the expression of LepR shifts from a predominant neuronal distribution to a heightened astroglial expression in the hypothalamus. Obesity induces reactive astrogliosis and upregulation of astrocytic LepR (14, 24), suggesting that nonneuronal leptin signaling may play a functional role in metabolic activities.
To determine the role of cell-specific leptin signaling at the BBB level, we have generated ELKO as well as astrocytic specific LepR knockout mice with a cre-loxp breeding strategy (15) and showed their counterregulatory effects as opposed to neuronal leptin signaling in diet-induced obesity (16, 23). In these tissue-specific LepR knockout mice, the target cells (astrocytes or endothelial cells) express a mutant, membrane-bound LepR that does not have any signaling function because the cytoplasmic tail containing Box I, II, and III was completely removed as a result of excision of loxP-flanked exon 17 by cell-type specific expression of Cre recombinase (15, 21). Unexpectedly, the cre-loxP breeding scheme also generated POKO mice when the female ELKO mice were backcrossed with male LepR floxed mice on a C57 background. The expression of mutant, membrane-bound LepR in the new strain of POKO mice was not dependent on the presence of Cre recombinase, indicating a loss of tissue specificity of the LepR mutation (Fig. 1). This differs from most known mutant mice related to leptin and its receptors. For example, db/db mice have a mutant long isoform of LepRb but other receptor subtypes remain intact (5, 19), whereas ob/ob mice are leptin-deficient (8, 11). This is similar to a report of two out of three strains of LepR mutant mice without signaling domain that have not been used widely (17). The newly generated POKO mice, therefore, offer a useful tool to determine how obesity resulting from the absence of leptin signaling in all cells modulates the circadian rhythm of metabolic activities and feeding behavior.
To confirm the efficiency and completeness of LepR mutation in all cells, we followed genotyping results with leptin-induced pSTAT3 activation. Although LepRb is the only receptor isoform able to mediate STAT3 activation, the loss of pSTAT3 signaling in response to leptin icv in the POKO mice contrasts with the persistence of leptin signaling in WT and ELKO mice. Unlike ELKO mice that have similar weight and percent fat as their WT littermates (23), POKO mice had significantly higher average body weight and adiposity. Among the POKO mice, the homozygote [wt,Δ17] was the most obese, followed by the homozygote [cre,Δ17]. By contrast, all heterozygotes had similar weight and percent fat as the WT littermates. There appeared to be a threshold effect of the loss of leptin signaling.
Blood leptin concentration correlates with adiposity and is entrained by meal as well as circadian rhythm. It has a peak 2 h before light onset in humans and shows differences related to sex and developmental stage (20, 25, 26, 29). Disrupted circadian rhythm promotes obesity and insulin resistance (32). Here, we showed that obese POKO mice had attenuated circadian rhythms of metabolic parameters. It is yet to be determined whether obesity and/or hyperleptinemia played a causal role. Nonetheless, acute leptin treatment by intraperitoneal injection did not induce chronic modification of metabolic profile (data not shown). There were also lengthy bouts of eating with reduced bout counts both night and day, resulting in greater accumulative food intake. The greater difference of food intake between the fat POKO and the lean POKO and WT groups at the beginning of the BioDaq study (in contrast to that toward the end of the 10-day trial) also suggests that the fat POKO mice probably showed greater susceptibility to stress, such as caused by adaptation to new cages.
In summary, the obese POKO mice had blunted circadian rhythms of metabolic activities and showed hyperphagia across the circadian span. There was a threshold effect, in that homozygote POKO mice showed greater disturbance of weight and fat homeostasis and a dampened circadian rhythm. The results add a novel aspect of leptin resistance in obesity, and also present a clear example of obesity blunting the circadian rhythm of biopotentials, causing rather than resulting from the diminished rhythm.
GRANTS
Support was provided by National Institutes of Health Grants (DK-54880 and DK-92245 to A. J. Kastin, and NS-62291 to W. Pan).
DISCLOSURES
No conflicts of interest, financial or otherwise, are declared by the author(s).
AUTHOR CONTRIBUTIONS
Author contributions: H.H., A.J.K., and W.P. conception and design of research; H.H., Y.W., E.J., and W.P. performed experiments; H.H., Y.W., G.G.C.-G., A.J.K., E.J., and W.P. analyzed data; H.H., Y.W., G.G.C.-G., A.J.K., E.J., F.H., and W.P. interpreted results of experiments; H.H., Y.W., G.G.C.-G., E.J., and W.P. prepared figures; H.H., Y.W., G.G.C.-G., and W.P. drafted manuscript; H.H., G.G.C.-G., A.J.K., and W.P. edited and revised manuscript; H.H., Y.W., G.G.C.-G., A.J.K., E.J., F.H., and W.P. approved final version of manuscript.
ACKNOWLEDGMENTS
The LepR-floxed mice originated from Dr. Streamson Chua, Jr. (Albert Einstein Medical College) and were backcrossed by Dr. Silvana Obici (University of Vermont) to the C57 background. Metabolic phenotyping and feeding studies were performed with fee-for-service from the Metabolic Behavioral Core facility at PBRC.
REFERENCES
- 1.Banks WA, Clever CM, Farrell CL. Partial saturation and regional variation in the blood-to-brain transport of leptin in normal weight mice. Am J Physiol Endocrinol Metab 278: E1158–E1165, 2000 [DOI] [PubMed] [Google Scholar]
- 2.Banks WA, Kastin AJ, Huang W, Jaspan JB, Maness LM. Leptin enters the brain by a saturable system independent of insulin. Peptides 17: 305–311, 1996 [DOI] [PubMed] [Google Scholar]
- 3.Bass J, Takahashi JS. Circadian integration of metabolism and energetics. Science 330: 1349–1354, 2010 [DOI] [PMC free article] [PubMed] [Google Scholar]
- 4.Bingham C, Arbogast B, Guillaume GC, Lee JK, Halberg F. Inferential statistical methods for estimating and comparing cosinor parameters. Chronobiologia 9: 397–439, 1982 [PubMed] [Google Scholar]
- 5.Chen H, Charlat O, Tartaglia LA, Woolf EA, Weng X, Ellis SJ, Lakey ND, Culpepper J, Moore KJ, Breitbart RE, Duyk GM, Tepper RI, Morgenstern JP. Evidence that the diabetes gene encodes the leptin receptor: identification of a mutation in the leptin receptor gene in db/db mice. Cell 84: 491–495, 1996 [DOI] [PubMed] [Google Scholar]
- 6.Chua SC, Jr, Liu SM, Li Q, Sun A, DeNino WF, Heymsfield SB, Guo XE. Transgenic complementation of leptin receptor deficiency II Increased leptin receptor transgene dose effects on obesity/diabetes and fertility/lactation in lepr-db/db mice. Am J Physiol Endocrinol Metab 286: E384–E392, 2004 [DOI] [PubMed] [Google Scholar]
- 7.Cohen P, Zhao C, Cai X, Montez JM, Rohani SC, Feinstein P, Mombaerts P, Friedman JM. Selective deletion of leptin receptor in neurons leads to obesity. J Clin Invest 108: 1113–1121, 2001 [DOI] [PMC free article] [PubMed] [Google Scholar]
- 8.Coleman DL, Hummel KP. The influence of genetic background on the expression of the obese (Ob) gene in the mouse. Diabetologia 9: 287–293, 1973 [DOI] [PubMed] [Google Scholar]
- 9.de Luca C, Kowalski TJ, Zhang Y, Elmquist JK, Lee C, Kilimann MW, Ludwig T, Liu SM, Chua SC., Jr Complete rescue of obesity, diabetes, and infertility in db/db mice by neuron-specific LEPR-B transgenes. J Clin Invest 115: 3484–3493, 2005 [DOI] [PMC free article] [PubMed] [Google Scholar]
- 10.Elmquist JK, Bjorbaek C, Ahima RS, Flier JS, Saper CB. Distributions of leptin receptor mRNA isoforms in the rat brain. J Comp Neurol 395: 535–547, 1998 [PubMed] [Google Scholar]
- 11.Ewart-Toland A, Mounzih K, Qiu J, Chehab FF. Effect of the genetic background on the reproduction of leptin-deficient obese mice. Endocrinology 140: 732–738, 1999 [DOI] [PubMed] [Google Scholar]
- 12.Froy O. Metabolism and circadian rhythms—implications for obesity. Endocr Rev 31: 1–24, 2010 [DOI] [PubMed] [Google Scholar]
- 13.He Y, Wu X, Khan RS, Kastin AJ, Cornélissen GG, Hsuchou H, Robert B, Halberg F, Pan W. IL15 receptor deletion results in circadian changes of locomotor and metabolic activity. J Mol Neurosci 41: 315–321, 2010 [DOI] [PMC free article] [PubMed] [Google Scholar]
- 14.Hsuchou H, He Y, Kastin AJ, Tu H, Markadakis EN, Rogers RC, Fossier PB, Pan W. Obesity induces functional astrocytic leptin receptors in hypothalamus. Brain 132: 889–902, 2009 [DOI] [PMC free article] [PubMed] [Google Scholar]
- 15.Hsuchou H, Kastin AJ, Tu H, Markadakis EN, Stone KP, Wang Y, Heymsfield SB, Chua SC, Jr, Obici S, Magrisso IJ, Pan W. Effects of cell type-specific leptin receptor mutation on leptin transport across the BBB. Peptides 32: 1392–1399, 2011 [DOI] [PMC free article] [PubMed] [Google Scholar]
- 16.Jayaram B, Pan W, Wang Y, Hsuchou H, Mace A, Cornélissen GG, Mishra PK, Koza RA, Kastin AJ. Astrocytic leptin receptor knockout mice show partial rescue of leptin resistance in diet-induced obesity. J Appl Physiol 114: 734–741, 2013 [DOI] [PMC free article] [PubMed] [Google Scholar]
- 17.Kim JH, Taylor PN, Young D, Karst SY, Nishina PM, Naggert JK. New leptin receptor mutations in mice: Lepr(db-rtnd), Lepr(db-dmpg) and Lepr(db-rlpy). J Nutr 133: 1265–1271, 2003 [DOI] [PubMed] [Google Scholar]
- 18.Kowalski TJ, Liu SM, Leibel RL, Chua SC., Jr Transgenic complementation of leptin-receptor deficiency. I. Rescue of the obesity/diabetes phenotype of LEPR-null mice expressing a LEPR-B transgene. Diabetes 50: 425–435, 2001 [DOI] [PubMed] [Google Scholar]
- 19.Lee GH, Proenca R, Montez JM, Carroll KM, Darvishzadeh JG, Lee JI, Friedman JM. Abnormal splicing of the leptin receptor in diabetic mice. Nature 379: 632–635, 1996 [DOI] [PubMed] [Google Scholar]
- 20.Licinio J, Negrao AB, Mantzoros C, Kaklamani V, Wong ML, Bongiorno PB, Negro PP, Mulla A, Veldhuis JD, Cearnal L, Flier JS, Gold PW. Sex differences in circulating human leptin pulse amplitude: clinical implications. J Clin Endocrinol Metab 83: 4140–4147, 1998 [DOI] [PubMed] [Google Scholar]
- 21.McMinn JE, Liu SM, Dragatsis I, Dietrich P, Ludwig T, Eiden S, Chua SC., Jr An allelic series for the leptin receptor gene generated by CRE and FLP recombinase. Mamm Genome 15: 677–685, 2004 [DOI] [PubMed] [Google Scholar]
- 22.McMinn JE, Liu SM, Liu H, Dragatsis I, Dietrich P, Ludwig T, Boozer CN, Chua SC., Jr Neuronal deletion of Lepr elicits diabesity in mice without affecting cold tolerance or fertility. Am J Physiol Endocrinol Metab 289: E403–E411, 2005 [DOI] [PubMed] [Google Scholar]
- 23.Pan W, Hsuchou H, Cornelissen-Guillaume GG, Jayaram B, Wang Y, Tu H, Halberg F, Wu X, Chua SC, Jr, Kastin AJ. Endothelial leptin receptor mutation provides partial resistance to diet-induced obesity. J Appl Physiol 112: 1410–1418, 2012 [DOI] [PMC free article] [PubMed] [Google Scholar]
- 24.Pan W, Hsuchou H, He Y, Sakharkar A, Cain C, Yu C, Kastin AJ. Astrocyte leptin receptor (ObR) and leptin transport in adult-onset obese mice. Endocrinology 149: 2798–2806, 2008 [DOI] [PMC free article] [PubMed] [Google Scholar]
- 25.Pan W, Hsuchou H, Tu H, Kastin AJ. Developmental changes of leptin receptors in cerebral microvessels: unexpected relation to leptin transport. Endocrinology 149: 877–885, 2008 [DOI] [PMC free article] [PubMed] [Google Scholar]
- 26.Pan W, Kastin AJ. Diurnal variation of leptin entry from blood to brain involving partial saturation of the transport system. Life Sci 68: 2705–2714, 2001 [DOI] [PubMed] [Google Scholar]
- 27.Pan W, Wu X, Kastin AJ, Zhang Y, Hsuchou H, Halberg F, Chatu F, Khan RS, Robert B, Cornelissen-Guillaume GG. Potential protective role of IL15Rα during inflammation. J Mol Neurosci 43: 412–423, 2011 [DOI] [PMC free article] [PubMed] [Google Scholar]
- 28.Qin LQ, Li J, Wang Y, Wang J, Xu JY, Kaneko T. The effects of nocturnal life on endocrine circadian patterns in healthy adults. Life Sci 73: 2467–2475, 2003 [DOI] [PubMed] [Google Scholar]
- 29.Saad MF, Riad-Gabriel MG, Khan A, Sharma A, Michael R, Jinagouda SD, Boyadjian R, Steil GM. Diurnal and ultradian rhythmicity of plasma leptin: effects of gender and adiposity. J Clin Endocrinol Metab 83: 453–459, 1998 [DOI] [PubMed] [Google Scholar]
- 30.Schoeller DA, Cella LK, Sinha MK, Caro JF. Entrainment of the diurnal rhythm of plasma leptin to meal timing. J Clin Invest 100: 1882–1887, 1997 [DOI] [PMC free article] [PubMed] [Google Scholar]
- 31.Shea SA, Hilton MF, Orlova C, Ayers RT, Mantzoros CS. Independent circadian and sleep/wake regulation of adipokines and glucose in humans. J Clin Endocrinol Metab 90: 2537–2544, 2005 [DOI] [PMC free article] [PubMed] [Google Scholar]
- 32.Shi SQ, Ansari TS, McGuinness OP, Wasserman DH, Johnson CH. Circadian disruption leads to insulin resistance and obesity. Curr Biol 23: 372–381, 2013 [DOI] [PMC free article] [PubMed] [Google Scholar]


