

Abstract
Embryonic development involves dramatic changes in cell proliferation and differentiation that must be highly coordinated and tightly regulated. Cellular redox balance is critical for cell fate decisions, but it is susceptible to disruption by endogenous and exogenous sources of oxidative stress. The most abundant endogenous non-protein antioxidant defense molecule is the tri-peptide glutathione (γ-glutamyl-cysteinylglycine, GSH), but the ontogeny of GSH concentration and redox state during early life stages is poorly understood. Here, we describe the GSH redox dynamics during embryonic and early larval development (0–5 days post-fertilization) in the zebrafish (Danio rerio), a model vertebrate embryo. We measured reduced and oxidized glutathione (GSH, GSSG) using HPLC, and calculated the whole embryo total glutathione (GSHT) concentrations and redox potentials (Eh) over 0–120 hours of zebrafish development (including mature oocytes, fertilization, mid-blastula transition, gastrulation, somitogenesis, pharyngula, pre-hatch embryos, and hatched eleutheroembryos). GSHT concentration doubled between 12 hours post fertilization (hpf) and hatching. The GSH Eh increased, becoming more oxidizing during the first 12 h, and then oscillated around −190 mV through organogenesis, followed by a rapid change, associated with hatching, to a more negative (more reducing) Eh (−220 mV). After hatching, Eh stabilized and remained steady through 120 hpf. The dynamic changes in GSH redox status and concentration defined discrete windows of development: primary organogenesis, organ differentiation, and larval growth. We identified the set of zebrafish genes involved in the synthesis, utilization, and recycling of GSH, including several novel paralogs, and measured how expression of these genes changes during development. Ontogenic changes in the expression of GSH-related genes support the hypothesis that GSH redox state is tightly regulated early in development. This study provides a foundation for understanding the redox regulation of developmental signaling and investigating the effects of oxidative stress during embryogenesis.
Keywords: oxidative stress, embryonic development, redox, antioxidant, gene expression, glutathione, zebrafish
Introduction
Embryonic development involves precisely orchestrated events and processes including changes in cellular proliferation, differentiation, and left-right asymmetry that are dependent on redox signaling and intracellular redox potentials (Eh) [1–6]. Reactive oxygen species (ROS) such as hydrogen peroxide, superoxide anion and hydroxyl radicals are produced endogenously via respiration and oxygenating enzymes, such as NADH oxidases, fatty acyl-CoA oxidase, xanthine oxidase, cyclooxygenases and lipoxygenases, and cytochrome P450s [2, 5–8]. ROS play an important role in normal embryonic development, with functions in signal transduction, cell-fate decisions, and apoptosis [6, 9–12]. However, conditions such as diabetic embryopathy, pre-eclampsia, intra-uterine growth restriction, or obesity can lead to altered embryo-fetal ROS levels, disrupting ROS-dependent signaling or causing damage to cellular macromolecules [7, 13, 14]. In addition, embryonic exposure to many chemicals, including a variety of drugs and environmental contaminants, can generate ROS or reactive intermediates and cause perturbations in cellular redox status [15–18]. Oxidative stress, defined as a disruption of redox signaling and control [19], contributes to the mode of action of numerous teratogens, including thalidomide, phenytoin, valproic acid, methamphetamine, ethanol, polycyclic aromatic hydrocarbons, methyl mercury, lead, cadmium, and paraquat [20–27]. Embryonic oxidative stress also may have delayed effects including carcinogenesis, cardiovascular dysfunction, and insulin resistance [28–30]. Thus, exposure to chemicals or other stressors that modulate intracellular redox potentials and cause oxidant-induced disruption of signaling during embryonic development in vertebrates is a significant concern. A variety of inherent antioxidant defenses have evolved to protect against oxidative stress, but the nature and/or regulation of these defenses in the vertebrate embryo is not well understood. The most abundant buffer of intracellular redox status is glutathione (GSH), a tripeptide of glutamate, cysteine, and glycine. Glutathione synthesis involves two ATP-dependent enzymatic steps (Figure 1). In the first step, which is rate-limiting, glutamate and cysteine are combined in a gamma configuration, a reaction catalyzed by glutamate-cysteine ligase (Gcl). Gcl is composed of two subunits: a catalytic subunit, Gclc, and a modifier subunit, Gclm, that can lower the Km of the catalytic subunit for glutamate and increase the Ki for GSH, thus controlling the rate of synthesis [31, 32]. The expression of both gclc and gclm has been shown to respond to numerous factors including depleted GSH levels, ROS, reactive nitrogen species, cytokines, and various hormones [33–35]. The second step in GSH synthesis is performed by GSH synthase (Gss), which adds a glycine molecule to the fused γ-glutamate-cysteine (Figure 1). Knockout of Gss is embryonic lethal and Gss-null mice fail to undergo gastrulation, demonstrating that GSH is essential for embryonic development [36]. Lu [37, 38] provides a detailed review of GSH synthesis.
Figure 1. Diagram of the glutathione redox system.

Glutathione is a tripeptide of cysteine, glutamate, and glycine, which undergoes oxidation and forms a homodimer GSSG. GSSG can participate in post-translation modification of proteins by s-thiylation. GSSG can also be recycled back to reduced glutathione by GSH reductase in a reaction which utilizes NADPH. GSH can also be shuttled to the extracellular space and utilized, after which its cysteine component can be recycled by gamma glutamyl transferase (GGT). The synthesis of glutathione draws from cysteine pools synthesized from cystathionine, which is made from homocysteine. Glutathione thus draws from the same source of homocysteine that is necessary to maintain levels of s-adenosylmethionine needed for DNA methylation and epigenetic gene control, which is especially relevant during embryonic development.
The GSH system sits at the nexus of antioxidant defense systems, xenobiotic metabolism, and epigenetic DNA methylation (Figure 1). GSH serves as an antioxidant by scavenging ROS, which oxidize the cysteine moiety. Oxidation of GSH drives the formation of glutathione disulfide (GSSG), which can then be directly recycled to GSH through the enzyme glutathione disulfide reductase (GR), a reaction requiring NADPH. GSH in the extracellular space can be recycled through the activity of gamma-glutamyl transferase (GGT) and the import of cysteine (Cys) back into the cytoplasm to be reused in GSH synthesis (Figure 1). The ratio of GSH to GSSG is often used as an indicator of intracellular redox status; however, with direct measurements of GSH and GSSG concentrations, one can use the Nernst equation to calculate the redox potential Eh [19, 39–41]. It has been demonstrated previously that more negative Eh values (more highly reduced redox state) are associated with cell proliferation, while less negative Eh values (more highly oxidized redox state) are associated with differentiation and apoptosis [40–42]. GSH can also act as a co-factor for GSH-utilizing antioxidant enzymes, such as GSH peroxidase, glutaredoxin, and glutathione-S-transferases (Figure 1). In addition, GSH can modulate protein function, via S-thiolation or S-glutathionylation and the reversible formation of protein mixed disulfides (protein-SSG), as caused by shifts in intracellular redox status [43]. Another process with important implications for embryonic development is the interaction between GSH and epigenetic programming. The cysteine peptide in GSH is synthesized from the same pool of homocysteine that is used for the synthesis of S-adenosylmethionine (SAM), which serves as a cofactor for the methylation of DNA and histones [9]. Conditions that increase the synthesis of GSH—for example toxicant-induced GSH oxidation and/or depletion—can impair DNA methylation [44], suggesting that toxicants undergoing metabolism involving GSH could reduce the availability of homocysteine and thereby disrupt methylation.
Elucidating the many roles of GSH in ROS signaling, antioxidant defense, xenobiotic biotransformation, and epigenetics will require a better understanding of the ontogeny of GSH and its redox dynamics in the developing embryo. Surprisingly, little is known about GSH redox dynamics over the course of embryonic development in vertebrate systems. Progress has been hindered by the lack of a convenient model system and the difficulty in obtaining accurate measurements of reduced and oxidized glutathione.
The zebrafish embryo is a valuable vertebrate model system that is ideal for studying GSH redox dynamics during embryonic development. Zebrafish share many genetic, cellular, and physiological characteristics with mammals and are widely used as models in studies of vertebrate developmental biology and developmental toxicology [45–48]. Assays using zebrafish embryos are highly predictive of mammalian teratogenicity (reviewed in [49] and [50]). Zebrafish embryos increasingly are being used to understand molecular mechanisms underlying the response to oxidative stress [25, 51–55]. The goal of the present work is to use the zebrafish model to evaluate GSH and redox state dynamics in developing embryos, through detailed analysis of the reduced and oxidized forms of glutathione and the expression of genes for proteins involved in GSH synthesis, utilization, and recycling. The results reveal a dynamic and highly regulated trajectory of redox status during embryonic and early larval development.
Materials & methods
Fish husbandry
Zebrafish (Danio rerio) from the Tupfel/Long fin mutation wild-type strain (TL) were used in all experiments. Fish were maintained under standard light and temperature conditions: 14 hrs of light, 10 hrs dark, at 28.5°C, water quality testing performed and monitored daily. Fish were fed a diet of brine shrimp twice a day and once daily received a 50:50 mixture of spirulina (Ocean Star International, Snowville, UT) and flake food (Lansy NRD 4/6 flake food, INVIE Aquaculture, Salt Lake City, UT). All procedures were approved by the Woods Hole Oceanographic Institution Animal Care and Use Committee.
Embryo sampling
Embryos were collected from group matings of at least 30 females and 15 males per tank, and several tanks were used during each breeding event. Successfully fertilized eggs were maintained in 0.3x Danieau’s solution and monitored daily. At the indicated time points, triplicate groups of 30 carefully staged embryos were collected in 125 μl of 5% perchloric acid (PCA) containing the internal standard γ-glutamylglutamate solution, held at room temperature for 10 minutes to ensure tissue permeation, and then stored at −80°C. Staging by Kimmel et al. (1995) was strictly followed, but for graphical simplicity, we refer to all stages by hours post fertilization (hpf). Adult liver samples and mature oocytes were dissected from two females euthanized by cervical dislocation, and fixed in 325 μl of PCA solution.
For experiments involving dechorionation, this was done manually using forceps, immediately prior to fixation. For experiments involving yolk and body dissections, embryos were fixed and then dissected manually using fine tweezers and forceps.
Glutathione extraction and measurements
Intracellular GSH and GSSG were assayed by reverse phase HPLC with fluorescence detection using γ-glutamylglutamate as an internal standard as previously described [56, 57]. Samples were sonicated and centrifuged, and the supernatant containing free GSH and GSSG was derivatized to yield dansyl-derivatives. Cellular volumes were based on protein concentrations as determined elsewhere [58]. To calculate the GSH Eh, GSH and GSSG concentrations were used in the Nernst equation, where Eh = Eo + (RT/nF) ln ([GSSG]/[GSH]2), where R is the gas constant, T is temperature, n is the number of electrons transferred, F is the faraday constant, and Eo = − 264 mV at a pH of 7.4.
Gene expression- microarray
The Agilent (Agilent Technologies, Santa Clara, CA) 4×44k DNA gene expression microarray was used to probe developmental gene expression. The original Agilent gene set was missing many CYPs and other genes involved in chemical defense. Probes for these genes were custom designed using the Agilent eArray system and added to the array [59]. The individual microarrays had 21893 unique probes (excluding controls) printed in duplicate.
Microarrays were used to measure gene expression in four replicates of 100 embryos for each time point (3, 6, 12, 24, 36, and 48 hpf). Embryos were carefully staged as per Kimmel et al. [60]. Total RNA was extracted using the Aurum Fatty and Fibrous Tissue kit (Bio-Rad, Hercules, CA). RNA samples were checked for quality using a NanoDrop ND-1000 spectrophotometer and an Agilent 2100 BioAnalyzer. For each RNA sample, a single microarray was hybridized with 750 ng Cy3 labeled cDNA using Agilent’s standard conditions for single-color microarrays at the Whitehead Center for Microarray Technology. The Agilent Low-Input QuickAmp Labeling Kit was used for labeling, the samples were hybridized to a the custom Agilent 4×44K feature zebrafish microarray using the Agilent In situ Hybridization Kit Plus, and labeled cDNA was combined with the Agilent 10x Control Targets (to identify microarray corners). Post-hybridization, microarray slides were washed as per the Agilent In situ Hybridization Kit Plus. Arrays were scanned with an Agilent DNA Microarray Scanner.
Analysis of raw microarray results was performed using Agilent’s Feature Extraction software as previously described [59]. Probes exhibiting saturation or with signals below background were removed from consideration. As before [59], Bayesian Estimation of Temporal Regulation (BETR) [61] was used to analyze the developmental time series; normalized Cy3 values were log transformed, median-centered, and analyzed using BETR relative to 3 hpf. Microarray data can be found in the Gene Expression Omnibus (GEO) database (GEO accession number GSE24840) [59].
Statistical Analyses
Glutathione data were analyzed with Statview for Windows (version 5.0.1; SAS Institute, Cary, NC). When ANOVA yielded significance (p < 0.05), Fisher’s protected least-significant differences test was used as a post hoc test. Data are presented as mean ± SEM, and N defined as number of pools of embryos as specified in the legends. Statistical analysis of the microarray data is described in the previous section and in the original microarray paper [59].
Results
Glutathione concentration and redox potential during development
Reduced and oxidized glutathione were measured in whole embryos during the embryonic period (0–48 hpf, pre-hatch) and eleutheroembryo period (post-hatch; 48–120 hpf). From fertilization to 120 hpf, total GSH (GSHT: [GSH] +2 [GSSG]) increased overall by 2-fold (Figure 2; for statistical significance between ages, please see Supplemental file 1). During early embryonic development (fertilization through gastrulation), GSHT levels remained fairly constant at ~2 mM (2000 μM). GSHT increased slightly during segmentation and into the pharyngula period, encompassing primary organogenesis and the onset of circulation (18–24 hpf). During pharyngula, between 24 and 36 hpf, there was a doubling of the GSHT concentrations. From 36 hpf through 120 hpf, the levels were relatively constant at around 5 mM (5000 μM). This is much lower than levels measured in livers of adult female zebrafish (17 mM; see Supplemental file 2).
Figure 2.

Total glutathione concentrations in zebrafish embryos double over the course of embryonic development. N = three pools of 30 embryos fixed in PCA buffer and analyzed by HPLC for total glutathione concentrations. This experiment is representative of at least 3 independent experiments. Data are presented as mean ± SEM. Please see Supplemental File 1 for statistically significant differences between embryo ages.
Examining the concentrations of reduced and oxidized glutathione (GSH and GSSG, respectively), we found that the levels of reduced GSH decreased during the first 18 h after fertilization, and then during mid-segmentation this trend reversed and GSH increased over the remainder of the time course, with the exception of a transient decrease at 48 hpf (Figure 3A). After 72 hpf, GSH levels remained stable at ~4–5 mM (4000–5000 μM, Figure 3A). GSSG levels increased during the first 30 hours to a maximum concentration of 1.9 mM (1900 μM), and then decreased after hatching, remaining low thereafter (~175 μM) (Figure 3A). For comparison, adult female livers contained ~12 mM GSH and 2 mM GSSG (12,000 μM and 2000 μM respectively, see Supplemental file 2).
Figure 3.

Glutathione concentrations and redox potential over the course of embryonic development in zebrafish embryos. A. Profiles of reduced GSH and GSSG over development. B. Redox potential, calculated from the reduced and oxidized glutathione components. N = three pools of 30. Data are representative of at least 3 independent experiments and are presented as mean ± SEM. Please see Supplemental File 1 for statistically significant differences between embryo ages.
After measuring GSH and GSSG, we then calculated the redox potential of whole embryos at each time point. During the first 18 hours of development, the redox potential became increasingly oxidized, starting at −220 mV and reaching −180 mV at its highest (most oxidizing) (Figure 3B). In the second phase (18 to 48 hpf), encompassing organogenesis and organ differentiation, the redox potential fluctuated between −180 and −200 mV (Figure 3B). After hatching, the redox potential was quite steady at a reduced value of −225 mV. For comparison, the redox potential of adult female livers was −218 mV (Supplemental file 2).
Chorion contains oxidized glutathione
Because the chorion of zebrafish has been shown previously to contain high levels of thiols [62], we compared GSH, GSSG, and GSHT levels and Eh of pre-hatched embryos with and without chorions at 24 hpf. Embryos that were analyzed with intact chorions had redox potentials that were significantly more oxidized than those of dechorionated embryos of the same developmental stage (Table 1). There were no consistent significant differences in concentrations of GSH or GSHT between embryos with and without their chorions, but there was a significant difference in the levels of GSSG depending on the presence of the chorion (data from a representative experiment is shown in Table 1). Removal of the chorion reduced GSSG concentrations by 75% compared to embryos with an intact chorion. This indicates that the chorion contains significant levels of GSSG.
Table 1. Impact of chorion on glutathione parameters.
The chorion contains GSSG and contributes to Eh. Zebrafish embryos were measured at 24 hpf with the chorion intact (+) or with the chorion manually removed immediately prior to sampling (−). Significant differences are presented in bold (ANOVA, p < 0.05). The data is representative of three independent experiments.
| Chorion | GSH (μM) | GSSG (μM) | GSHT | Eh |
|---|---|---|---|---|
| + | 1406 ± 109 | 624 ± 53 | 2655 ± 200 | −179 ± 2 |
| − | 1236 ± 159 | 151 ± 6 | 1538 ± 170 | −194 ± 3 |
Glutathione in body tissue compared to yolk
To examine the contribution of the yolk to the whole-embryo measurements of GSH parameters (Figures 2 and 3), we dissected the yolk from the body tissue of embryos at 24, 48, and 72 hpf, and measured GSH and GSSG concentrations. These data are presented on a pmol per embryo basis to control for differing ratios of yolk to body tissue that change as the yolk is absorbed during development (see Supplemental file 3 for protein quantifications in whole embryos vs. yolk and body tissue at these stages). There were no significant differences in the amounts of GSH or GSSG, or in the redox potential Eh in the yolk compared to body tissue at any of the three time points (Figure 4).
Figure 4.

Measurements of GSH, GSSG, and Eh in dissected body tissue compared to yolk in embryos at different ages. Since the proportion of body and yolk changes with development, the data are presented on a pmol per embryo basis. GSH, GSSG, and Eh were found to be in equilibrium during somitogenesis (24 hpf), pre-hatch (48 hpf) and post-hatch (72 hpf). Data are representative of three independent experiments; mean and SEM, N = 3 pools of 20 embryos.
Changes in glutathione parameters are associated with hatching
Within a clutch of embryos, there is natural variation in the time of hatching, which generally occurs between 48 and 72 hpf. To examine the relationship between glutathione status (GSH, GSSG, GSHT, and Eh) and hatching, we compared “early hatchers,” defined as those that had hatched without prodding by 48 hpf, with those that had not yet hatched at this time. The chorions of unhatched embryos were removed following fixation, so that only the embryo and yolk sac from each group were collectively analyzed.
The results of these experiments revealed an interesting relationship between hatching and glutathione status. The concentrations of GSH and GSSG were significantly greater in the hatched embryos than in the unhatched embryos (Figure 5A). There was also a difference in GSHT concentrations, which were significantly greater in the hatched embryos than in those not yet hatched at 48 hpf (Figure 5B). As a consequence of the differences in GSH and GSSG, early hatchers had a more negative (more reduced) redox potential, whereas the time-matched but unhatched embryos had a more positive (more oxidized) redox potential (Figure 5C).
Figure 5.
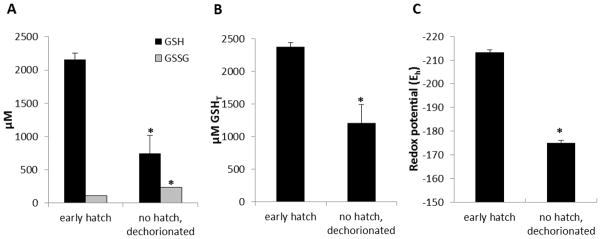
Hatching status influences glutathione and Eh. Embryos at 48 hpf that hatched early were compared to age-matched manually dechorionated embryos that had not hatched. There were significant differences between the two groups of embryos with respect to A) GSH and GSSG, B) concentration of GSHT, and C) Eh. Data are presented as the mean + SEM, and are representative of three independent experiments. N = 3 pools of 30 embryos. An asterisk (*) indicates a statistically significant difference (ANOVA, p < 0.01) between unhatched and hatched embryos.
Expression of glutathione-related genes
To begin to understand the mechanisms by which GSH concentrations and redox dynamics are regulated during embryonic development, we sought to identify the set of zebrafish orthologs of mammalian genes involved in glutathione synthesis, recycling, and utilization and then measured their expression during development.
We identified a complete set of vertebrate genes involved in glutathione metabolism, including duplicates (paralogs) of some of the glutathione synthesis and utilization genes (Figure 1, Tables 2, 3, 4). Single copy genes encoding the glutamate-cysteine ligase subunits (gclc and gclm), GSH synthetase (gss), and glutathione disulfide reductase (gsr) were found in the genome (Tables 2, 3). We found duplicate copies of the GSH catabolism/cysteine recycling genes cystathione-beta synthase (csba and csbb), cystathionase (ctha.1 and ctha.2, cthb), and multiple copies of gamma glutamyl transferase 1 genes (ggt1a, ggt1b, ggt1b.2, ggt1b.3, ggt1b.4, and ggt1b.5) (Tables 2 and 3). Two of the cystathionases, ctha.1 and ctha.2, are duplicated in tandem, on a different chromosome from the separately duplicated cystathionase b (cthb). We also found a set of ggt1b-like genes, ggt1b.2, ggt1b.3, ggt1b.4 and ggt1b.5, arranged in a cluster and located on a different chromosome from the original ggt1b duplicate (Table 3). Additionally, there were two ggt5 paralogs, ggt5a and ggt5b, each arranged in a head-to-head tandem duplication with members of another set of paralogs, ggt1a and ggt1b, respectively. We also found single copies of ggt6 and ggt7.
Table 2.
Glutathione synthesis genes in zebrafish
| Gene | Ensembl ID | ZFIN | GenBank ID | Location (Chr:start-end:ori) |
|---|---|---|---|---|
| gclc | ENSDARG00000013095 | ZDB-GENE-030131-5056 | NM_199277 | 13:2137586-2172613:1 |
| gclm | ENSDARG00000018953 | ZDB-GENE-030131-5906 | NM_199845 | 8:15786374-15794203:1 |
| gss | ENSDARG00000037706 | ZDB-GENE-041010-208 | NM_001006104 | 23:14855077-14881513:-1 |
| cbsa | ENSDARG00000053500 | ZDB-GENE-050417-367 | NM_001111232 | 1:27999259-28024172:1 |
| cbsb | ENSDARG00000010946 | ZDB-GENE-021030-3 | NM_001014345 | 9:9404591-9450364:-1 |
| ctha.1 | ENSDARG00000074301 | ZDB-GENE-030131-774 | NM_212604 | 6:37357906-37371189:-1 |
| ctha.2 | ENSDARG00000032206 | ZDB-GENE-040905-3 | NM_001005400 | 6:37338031-37351792:-1 |
| cthb | ENSDARG00000057328 | ZDB-GENE-990806-20 | NM_130939 | 7: 19193861-19196954:1 |
Table 3.
Glutathione recycling and catabolism genes in zebrafish
| Gene | Ensembl ID | ZFIN | GenBank ID | Location (Chr:start-end:ori) |
|---|---|---|---|---|
| gsr | ENSDARG00000019236 | ZDB-GENE-050522-116 | NM_001020554 | 14:40349421-40369597:-1 |
| ggt1a | ENSDARG00000023526 | ZDB-GENE-040426-1388 | NM_200415 | 8:41995278-42028629:-1 |
| ggt1b | ENSDARG00000018342 | ZDB-GENE-110408-13 | BX005006 | 10:42989540-43029256:-1 |
| ggt1b.2 | ENSDARG00000092350 | ZDB-GENE-090312-33 | 1:58892274-58902388:1 | |
| ggt1b.3 | ENSDARG00000087054 | ZDB-GENE-090312-37 | 1:58928868-58944269:1 | |
| ggt1b.4 | ENSDARG00000075055 | ZDB-GENE-090312-32 | 1:59018370-59033241:1 | |
| ggt1b.5 | ENSDARG00000087063 | 1:59145477-59154476:-1 | ||
| ggt5a | ENSDARG00000052045 | ZDB-GENE-080226-1 | NM_001123298 | 8:41951156-41981087:1 |
| ggt5b | ENSDARG00000078258 | CABZ01049847 | 10:42915034-42969590:1 | |
| ggt5 | ENSDARG00000091254 | CABZ01059291 | 1:59422998-59429026:-1 | |
| ggt6 | ENSDARG00000094268 | si:ch73-337l15.2 | 5: 45900786-45905360:-1 | |
| ggt7 | ENSDARG00000091528 | CABZ01092921 | 23:2689107-2709853:1 |
Table 4.
Glutathione utilization genes in zebrafish
| Gene | Ensembl ID | ZFIN | GenBank ID | Location (Chr:start-end:ori) |
|---|---|---|---|---|
| gpx1a | ENSDARG00000018146 | ZDB-GENE-030410-1 | NM_001007281 | 11:36889368-36997760:-1 |
| gpx1b | ENSDARG00000006207 | ZDB-GENE-040912-60 | NM_001004634 | 6:42269719-42272629:-1 |
| gpx2 | ENSDARG00000089149 | 17:49501769-49504913:-1 | ||
| gpx3 | ENSDARG00000043342 | ZDB-GENE-070222-3 | NM_001137555 | 14:51699364-51719884:-1 |
| gpx3/5 | ENSDARG00000003077 | BC078211 | 12:46629768-46638624:1 | |
| gpx4a | ENSDARG00000068478 | ZDB-GENE-030410-2 | NM_001007282 | 22:17813695-17835829:-1 |
| gpx4b | ENSDARG00000076836 | ZDB-GENE-030410-3 | NM_001030070 | 2:57368919-57382529:-1 |
| gpx7 | ENSDARG00000091511 | ZDB-GENE-050522-419 | NM_001020501 | 23:43050109-43062606:1 |
| gpx8 | ENSDARG00000013302 | zgc:56280 | NM_200222 | 8:42129185-42134630:-1 |
| gsta2.1 | ENSDARG00000039832 | ZDB-GENE-070822-30 | NM_001102648 | 13:701311-704057:1 |
| gsta2.2 | ENSDARG00000087431 | ZDB-GENE-071004-68 | NM_001109731 | 13:707116-712513:1 |
| gstal | ENSDARG00000090228 | ZDB-GENE-040426-2720 | NM_213394 | 13:715869-724232:1 |
| gstm1 | ENSDARG00000042533 | ZDB-GENE-030911-2 | NM_212676 | 8:26148103-26150871:1 |
| gstm2 | ENSDARG00000029473 | ZDB-GENE-080218-30 | NM_001110116 | 8:26152012-26154745:1 |
| gstm3 | ENSDARG00000088116 | ZDB-GENE-050309-24 | NM_001162851 | 8:26155115-26159957:1 |
| gstp1 | ENSDARG00000005039 | ZDB-GENE-020806-4 | NM_131734 | 4:29632402-29639074:1 |
| gstp2 | ENSDARG00000057338 | ZDB-GENE-050601-1 | NM_001020513 | 4:29620556-29628421:1 |
| gstt1a | ENSDARG00000042428 | ZDB-GENE-031001-13 | BC058294 | 8:31635153-31639308:-1 |
| gstt1b | ENSDARG00000017388 | ZDB-GENE-040426-1491 | NM_200584 | 21:13916165-13923602:1 |
| gstt2 | ENSDARG00000095464 | ZDB-GENE-040426-1617 | NM_200521 | 5:10954245-10963943 |
| gstr1 | ENSDARG00000042620 | ZDB-GENE-090507-1 | NM_001045060 | 19:749004-754780:1 |
| gstk1.1 | ENSDARG00000056510 | ZDB-GENE-040718-298 | NM_001002560 | 16:34323673-34328399:-1 |
| gstk1.2 | ENSDARG00000019585 | ZDB-GENE-100922-14 | 16:33262981-33270138:1 | |
| gstk1.3 | ENSDARG00000093119 | ZDB-GENE-100921-57 | CR854927 | 16:34296553-34305847:-1 |
| gstk1.4 | ENSDARG00000092052 | ZDB-GENE-060421-6530 | NM_001040300 | 16:34318235-34322751:-1 |
| gsto1 | ENSDARG00000022183 | ZDB-GENE-040718-365 | NM_001002621 | 13:25604322-25612941:1 |
| gsto2 | ENSDARG00000033285 | ZDB-GENE-041114-67 | NM_001007372 | 13:25620786-25626662:1 |
| gstz1 | ENSDARG00000027984 | ZDB-GENE-040718-184 | NM_00103027 | 17: 45272871-45280239:1 |
| mgst1.1 | ENSDARG00000032618 | ZDB-GENE-041010-30 | NM_001005957 | 4:11780219-11782891:-1 |
| mgst1.2 | ENSDARG00000022165 | ZDB-GENE-040704-59 | NM_001002215 | 4:11783489-11790037:-1 |
| mgst2 | ENSDARG00000071345 | ZDB-GENE-060616-94 | NM_001045302 | 14:49151752-49155148:1 |
| mgst3a | ENSDARG00000024143 | ZDB-GENE-040426-2767 | NM_213427 | 20: 49279846-49295820:1 |
| mgst3b | ENSDARG00000033364 | ZDB-GENE-061215-48 | NM_001080034 | 13: 46096369-46102191:1 |
| ptges | ENSDARG00000020136 | ZDB-GENE-050407-2 | NM_001014828 | 5: 34957660-34965891:1 |
Both the GSH synthesis and recycling gene sets exhibited complex patterns of gene expression during development (Figure 6). The GSH synthesis genes gclc and gclm exhibited early (pre-12 hpf) peaks in expression, while csb and cth had peaks in expression at 12 hpf. With the exception of glutathione synthetase (gss), all of the synthesis genes were expressed at very high levels (top 5% of all probes at 12 hpf; Figure 6A). In contrast, the GSH catabolism genes ggt1a, ggt1b, and gsr exhibited lower expression levels and few distinct features in the developmental profiles (Figure 6B). Genes involved in cysteine transport generally exhibited elevated expression levels between 12–48 hpf compared with earlier time points.
Figure 6.

Expression profiles of genes involved in glutathione synthesis, recycling, and utilization over the first 48 hpf of embryonic development. A) Genes involved in glutathione synthesis; B) Genes involved in recycling of glutathione, C) genes involved in the transport of cysteine. Data are the mean and SEM of three biological replicate pools of 100 embryos, measured by microarray.
A major class of GSH-usage genes is the glutathione S-transferases (GSTs), which are divided into two superfamilies, the soluble GSTs and the membrane-bound GSTs (MGSTs, part of the MAPEG superfamily). We found 19 GST genes in the zebrafish genome, divided between the xenobiotic-metabolizing GST alpha, pi, and mu classes (Table 4), and the GSTs primarily involved in endobiotic metabolism, GST kappa, sigma, theta, zeta, and omega. Several of the gst genes are arranged into clusters of tandem genes: gsta1, gsta2, and gsta3 are adjacent on Chr13; gstm1, gstm2, and gstm3 are adjacent on Chr8; gstp1 and gstp2 are adjacent on Chr4 [63]; gstk1, gstk2, gstk3, and gstk4 are adjacent on Chr16; and gsto1 and gsto2 are adjacent on Chr13. In contrast, the three GST theta-class genes (gstt1a, gstt1b, and gstt2) were found on different chromosomes. We found six MGST genes divided into the four classes of glutathione-dependent MGSTs: mgst1.1, mgst1.2, mgst2, mgst3a, mgst3b, and ptges (prostaglandin e synthase) [64].
GSTs displayed a wide variety of developmental expression patterns. gstp1 exhibited very high expression levels at 3 and 6 hpf, with a minimum at 12 hpf and rising slightly through 48 hpf (Figure 7A), a pattern echoed by gsto1 (Figure 7B). In contrast, gstt1a rose strongly from 12–48 hpf, while gsta1 peaked at 24 hpf (Figure 7A). As with other paralogs (see above), gstt1a/gstt1b and mgst3a/mgst3b displayed paralog-specific developmental patterns (Figure 7B, C).
Figure 7.

Expression of genes involved in the utilization of glutathione. A) Highly expressed glutathione-S-transferase genes; B) glutathione S-transferase genes; C) membrane-bound glutathione-S-transferase genes; D) glutathione peroxidase genes; E) glutathione peroxidase 4 genes.
The glutathione peroxidase (gpx) enzymes, which use reduced GSH to detoxify reactive oxygen species, represent another important part of the protective antioxidant mechanism. Both gpx1 and gpx4 were found as duplicates, gpx1a, gpx1b, gpx4a, and gpx4b, all on different chromosomes (Table 4). In contrast, gpx2, gpx3, gpx7, and gpx8 were present as single copies in the zebrafish genome. The duplicated gpx1a/b and gpx4a/b displayed paralog-specific patterns of temporal expression during development. Gpx1a rose to a maximum at 12 hpf and did not change thereafter, while gpx1b peaked at 6 hpf and declined steadily through 48 hpf (Figure 7D). Similarly, gpx4a peaked at 24 hpf and declined afterwards, and was among the highest expressing probes at that time (top 1%), while gpx4b peaked at 12 hpf and remained steady (Figure 7E). The other gpx paralogs for which microarray probes were available include gpx8 and gpx9, which both displayed distinct developmental patterns (Figure 7D).
Discussion
Glutathione is the most abundant antioxidant defense molecule, and is required for embryonic development [36]. However, much remains to be understood about role of GSH during embryonic development, including the importance of GSHT concentrations as well as the balance of the reduced and oxidized GSH that largely define its cellular redox state. Here, we describe the ontogeny of the GSH redox couple during the first 5 days of development in zebrafish, as well as the expression of the many genes involved in the synthesis, utilization, and recycling of GSH and GSSG. To our knowledge, this is the first detailed profile of the complete GSH system that has been undertaken in a vertebrate model encompassing a comprehensive period of embryonic development.
Glutathione concentration, redox status, and developmental events
Our data reveal several notable changes in GSH concentrations and redox status that occur during embryonic development. The first is the decrease in GSH and increase in GSSG from 0–18 hpf. Second is what appears to be the onset of GSH recycling during somitogenesis at about 18 hpf, as indicated by an increase in GSH and corresponding decrease in GSSG (Figure 3A), as well as an oscillation in the GSH redox potential as would be expected with GSH recycling (Figure 3B). Third is the substantial increase in total GSH during the pharyngula period, a doubling of concentration within a six-hour time frame (Figure 2). Fourth is the pattern of GSH Eh oscillation during the pharyngula period (24 hpf until just prior to hatching at 48 hpf), driven by dramatic changes in GSH and in GSSG. The biological significance of this oscillation requires further investigation, but it may serve to stimulate the subsequent increase in post-hatch GSH levels, which in turn may protect the embryo from an increase in aerobic metabolism [7]. It could also provide key redox signaling necessary for organogenesis, morphogenesis, and cellular differentiation that are occurring during this time [6, 65].
We also examined the distribution of GSH and GSSG between the yolk and body tissue and did not find any significant differences at any of three different time points (24, 48, and 72 hpf). In mammalian embryos, GSH is not readily transported from the yolk sac to the embryo; rather, it is broken down, and cysteine is transported from the yolk and GSH is resynthesized in the embryo tissue [66]. Thus, the mammalian embryo visceral yolk sac contains high levels of cysteine, the rate-limiting precursor to GSH synthesis [67]. While the transport of peptides to synthesize GSH from the yolk to body tissue has not been examined in the zebrafish, our finding that GSH and GSSG levels do not differ between these two compartments suggests that they are in equilibrium with regard to glutathione status.
Maintaining redox homeostasis is critical for embryonic development because of the redox-dependence of processes such as cell proliferation, differentiation, apoptosis, gene expression, and epigenetic modifications [2, 6, 65]. Numerous studies have demonstrated a strong relationship between concentrations of GSH, nuclear localization of GSH, cell cycle progression, and cellular proliferation [68–71]. Cellular differentiation has also been shown to be closely related to GSH redox status, with more oxidized Eh associated with differentiation, and more reduced Eh with proliferation [41, 58, 72]. The mechanisms by which GSH regulates cell cycle progression, proliferation, and differentiation are complex, but have been shown to be related to DNA synthesis [73], the expression and/or activity of redox-sensitive transcription factors such as Nrf2, NFkB, and AP1, and epigenetic modifications [6, 7, 70, 71, 74]. Thus, both the actual levels of GSHT and the redox status are of integral importance to cellular processes in development.
In the present study, we show that, in vivo, GSH concentrations and redox status vary dynamically during the course of embryonic development (Figures 2, 3). To better understand the relationship between GSHT concentration and redox status, and how it changes during development, we plotted GSHT versus Eh for all time points (Figure 8). This revealed distinct windows of unique GSH characteristics that correspond to major developmental events. Window A corresponds to unfertilized eggs and immediately post-fertilization embryos, which exhibit both relatively low concentrations of GSHT and reducing conditions (Eh ~230 mV). Window B is defined by relatively low concentrations of GSHT (2–3 mM) and an oxidizing redox potential (−170 to −200 mV), and encompasses the mid-blastula transition, gastrulation, somitogenesis, and early pharyngula. This window includes key events such as the initiation of the GSH recycling program, between 18–24 hpf during somitogenesis, and primary organogenesis. Window C is defined by relatively higher concentrations of GSHT (5–6 mM) and an oxidized redox potential (also in the range of −170 to −200 mV), and encompasses post-circulation embryos in the pharyngula stage through pre-hatch. This window is also a period of cellular differentiation, which would be promoted at a cellular level by an oxidized redox status [41, 58, 72]. Window D is defined by high glutathione concentrations and a reduced redox potential, and includes post-hatch eleutheroembryos. Zebrafish at this age are entering a period of dynamic growth that would require high levels of cellular proliferation, which would be promoted by the reduced Eh and high glutathione conditions [41]. The existence of these four distinct windows suggests that embryonic development involves a highly regulated trajectory of glutathione status involving changes in both the amount and oxidation state of this tripeptide.
Figure 8.
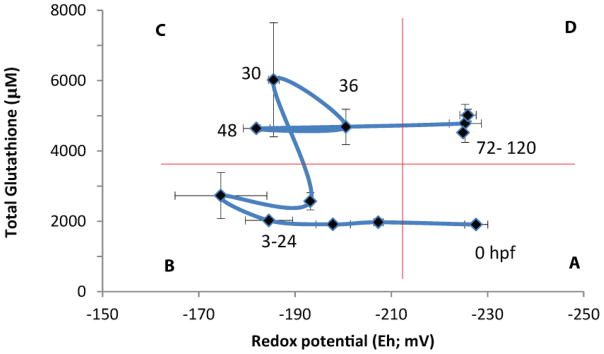
Concentrations of GSHT and Eh during the first 120 hours of zebrafish development. Four “windows” of dynamic glutathione conditions during embryonic development are observed. A) reduced Eh and low GSHT, observed in mature oocytes; B) oxidized Eh and low GSHT, observed in embryos from the mid-blastula transition through somitogenesis (3–24 hpf); C) oxidized Eh and high GSHT, observed in embryos undergoing organ differentiation (30–48 hpf), and D) reduced Eh and high GSHT, observed in post-hatch eleutheroembryos.
The four windows described in Fig. 8 are based on GSH measurements and redox calculation derived from whole-embryo homogenates. Future studies will be required to provide a sharper resolution of the tissue and cellular localization of GSH during these stages of development, provided by examination of different tissues and sub-cellular compartments such as mitochondria, which have also been shown to play important roles in cell cycle and redox signaling [75, 76]. Tissue-specific changes might be identified, for example, through use of transgenic zebrafish expressing a genetically encoded fluorescent protein redox sensor that is sensitive to the GSH redox potential range. It will also be important to examine other redox couples, such as those involving thioredoxin and cysteine [77], in developing embryos.
Glutathione concentrations and redox status in vertebrate development
A few previous studies in other vertebrates have compared GSH parameters over different portions of the developmental period and have also found dynamic changes similar to those reported here. Species examined in these reports include frogs [78, 79], crocodiles [80], rats [81], and mice [82]. Results of these studies are summarized in Supplemental file 4.
Collectively, the findings from these studies are similar to our results in showing an increase in GSHT over the course of development, and dynamic changes in GSH and GSSG at specific stages of development (Figures 2 and 3A). However, it is important to note that in most of these prior investigations GSH was determined using an indirect spectrophotometric method that does not permit accurate measurements of GSH and cannot distinguish between GSH and other small thiols such as cysteine. The methods used in our study (HPLC detection of GSH and GSSG) are highly specific, avoid interference from cysteine, and provide high sensitivity of detection compared with methods that use enzymatic GSH-recycling approaches [83]. These factors are particularly important for accurate calculations of molar concentrations and Eh. Through the use of rigorous analyses that allow direct measurements of GSH and GSSG concentrations, our study provides more robust measurements of GSHT and Eh, enabling a more accurate and comprehensive assessment of glutathione redox dynamics during embryonic development.
Recently, Skjaerven et al. [84] reported changes in GSHT and GSSG in embryos of another fish species, Atlantic cod (Gadus morhua), as measured using a commercially available spectrophotometric kit. They also found an increase in GSHT over the course of development, with levels doubling between fertilization and hatching, and noted a temperature-dependent increase in GSSG levels after gastrulation and prior to hatching. They note that the presumptive Eh conditions in the cod embryo follow a developmental pattern, with a reduced Eh during cleavage and blastula, and more oxidized conditions during late gastrulation and organogenesis. However, method limitations in the cod study, such as GSSG levels below the limit of detection by their assay, prevented the precise calculations of Eh at all stages.
Our study presents a comprehensive characterization of glutathione concentrations and redox dynamics over the course of vertebrate embryonic development, based on specific measurements of GSH and GSSG, and precise calculations of Eh. The dynamic changes in these parameters provide evidence of an important role for glutathione in the developmental process.
Hatching and glutathione redox status
Dynamic changes in GSH, GSSG, GSHT, and Eh were associated with hatching, which occurs in zebrafish between 48–72 hpf. To our knowledge, hatching status has not previously been linked with altered GSH levels or Eh in fish. While it is still unknown whether hatching triggers the changes in these parameters, or vice versa, there are several possible explanations for this difference in hatched and unhatched embryos. One possible explanation is that the strongly reduced Eh in newly hatched embryos may help to protect the embryo during this process. The hatching process in the zebrafish may parallel the increase in ROS experienced by mammalian embryos upon the completion of placental formation and angiogenesis, such as occurs during the transition from the first to second trimester [85].
A second explanation may be found in considering the hatching gland. Maturation of the hatching gland is closely associated with the Golgi apparatus, which contain granules encapsulating the hatching enzymes [86]. The Golgi apparatus organelle serves as a warehouse for handling damaged proteins, including those damaged by oxidative stress, and also plays a role in oxidative signaling [87]. Thus, it is conceivable that GSH parameters in the developing embryo may signal the Golgi apparatus to release the hatching enzyme.
A third potential explanation may be the hatching enzyme itself. The zebrafish hatching enzyme is a zinc metalloprotease [88, 89], and activation of some metalloproteases is redox dependent [90, 91]. Further studies will investigate the relationship between the GSH-related parameters and activation of the hatching enzymes.
Expression of glutathione-related genes
To better understand how glutathione dynamics may be regulated during development, we identified the full set of zebrafish genes that are homologs of the mammalian genes for glutathione synthesis, recycling, and utilization and we measured expression of their transcripts through the course of embryonic development (3–48 hpf, up to hatching). Ontogenic changes in the expression of GSH-related genes help to explain the GSH redox dynamics and support the hypothesis that GSH redox states are tightly regulated early in development.
We found extensive duplications of glutathione synthesis, recycling, and utilization genes in the zebrafish genome. These duplicated genes may have undergone subfunctionalization, either in expression patterns (spatial or temporal) or in function. Detailed comparisons of these patterns may provide insight into the developmental roles of homologous genes in other vertebrates, including humans.
Teleost fish have undergone a whole genome duplication event (WGD) relative to other vertebrates, and often have duplicate copies (paralogs) of the mammalian ortholog [92]. Genes may also be tandemly duplicated within a small region, a mechanism that may allow for increased gene dosage and for the evolution of different substrate specificities (either neofunctionalization or subfunction partitioning of duplicated genes [92]). Temporal separation of duplicated gene expression patterns is one form of subfunctionalization, and has been previously used to decipher the functions of mammalian homologs [92, 93]. The role of tandemly duplicated glutathione genes remains to be elucidated.
Glutathione synthesis, recycling, and utilization genes exhibit a wide variety of developmental expression patterns. It is important to note that these expression data were obtained from pools of embryos and therefore do not provide information on biological variability that may exist among embryos. The data presented here show that glutathione biosynthesis genes, including gclc, display very high early expression levels (Figure 6) while gsr, an important GSH recycling gene, decreases during organogenesis during the period that de novo GSH synthesis genes are at a maximum (Figure 6). To confirm whether gclc was maternally loaded, we expanded the range of stages examined to include unfertilized eggs and measured expression by QPCR. These data demonstrated that gclc was maternally loaded (Supplemental file 5). We also examined expression of gclc at additional later stages, extending analysis through 120 hpf in a batch of embryos independent of that used for the microarray experiment. Following the drop in expression levels after fertilization, we did not observe any significant changes in expression of gclc throughout the remainder of the 120 hpf developmental period (Supplemental file 5). We similarly extended our expression analysis of the gene with the highest expression during development, gstp1, a glutathione utilization gene that is also maternally loaded (Supplemental file 5) and also displays endogenous transcription increasing after 12 hpf (Figure 7A; Supplemental file 5). In contrast, another glutathione transferase, mgst3b, appears to peak during somitogenesis between 12 and 24 hpf (Figure 7C) and may play a role in this developmental process.
Following gstp1, the most highly expressed glutathione-related genes were those encoding gpx4, gpx4a and gpx4b. Expression of gpx4a rose sharply during segmentation, peaking at 24 hpf, while gpx4b had a different pattern that began relatively high and increased until segmentation, where it remained a highly expressed gene. In mouse models, Gpx4 has been shown to be required for successful embryonic development, with homozygous knockout embryos dying at day E8.5 [94, 95]. Expression of Gpx4 and its enzymatic activity was also shown to be correlated with regions lacking apoptosis in developing mouse limbs, underscoring its importance in anti-apoptotic and antioxidant functions during development [96]. Detailed reviews of Gpx4 are provided elsewhere [65, 94].
The regulation of glutathione-related gene expression is likely to be a complex, multifactorial process. For example, the regulation of the key genes involved in glutathione synthesis has been shown to involve the stress-responsive transcription factors Nrf2 [22, 54, 97], Nrf1 [98, 99], AP-1, and NFkB [38, 100, 101]. The comprehensive gene lists presented here will facilitate future studies to identify the role of key transcription factors in modulating GSH concentrations and Eh during embryonic development.
Conclusions
These studies identify dynamic changes in concentrations of GSH, GSSG, and GSHT, and in Eh, during embryonic development in a model vertebrate system. Variations in Eh and concentrations of GSH define discrete windows of development: unfertilized oocytes, embryos undergoing primary organogenesis, embryos undergoing organ differentiation, and growth of the larvae. Understanding the ontogeny of GSH redox potential in the embryo will help to identify periods of susceptibility to redox perturbations and critical windows of sensitivity to sources of oxidative stress or glutathione depletion [17, 102–104]. Moreover, ontogenic changes in the expression of GSH-related genes support the hypothesis that GSH redox states are tightly regulated early in development. Future studies will examine the effects of manipulating GSH synthesis or redox status on developmental processes.
In light of the high degree of interest in the role of redox state in embryonic development [6], our current lack of understanding of this complex process is surprising. Progress in this field may be facilitated by an in vivo model, such as the zebrafish, that provides unencumbered observation of vertebrate development combined with powerful tools to manipulate and display redox status. This study provides a foundation for understanding the redox regulation of developmental signaling during embryogenesis and the consequences of disrupting redox-sensitive signal transduction via oxidative stress.
Supplementary Material
Acknowledgments
The authors kindly acknowledge the excellent fish care provided by Ms. Gale Clark, microarray data analysis provided by Dr. Andrew MacArthur, and technical assistance provided by Ms. Diana Franks. We would also like to acknowledge assistance with GST identification by Dr. Juliano Zanette and Mr. Mauricio Sopezki. This research was supported by NIH grants F32ES017585 (to ART-L), R01ES016366 (to MEH), R01ES015912 (to JJS), a WHOI Postdoctoral Scholar award with funding from Walter A. and Hope Noyes Smith (to ART-L), and Emory+Egelston Children’s Research Grant (to JMH). We also thank the Center for Cystic Fibrosis Research of the Emory+Children’s Health Care of Atlanta. The sponsors had no involvement in performing or in the decision to publish this study. The U.S. Government is authorized to produce and distribute reprints for governmental purposes notwithstanding any copyright notation that may appear hereon.
List of abbreviations
- Eh
redox potential
- ROS
reactive oxygen species
- GSH
reduced glutathione
- Cys
cysteine Cys
- Gcl
glutamate cysteine ligase
- Gclc
glutamate cysteine ligase catalytic subunit
- Gclm
glutamate cysteine ligase modifier subunit
- Gss
glutathione synthetase
- GGT
gamma-glutamyl transferase
- GSSG
glutathione disulfide
- PCA
perchloric acid
- h
hours
- hpf
hours post fertilization
- dpf
days post fertilization
Footnotes
The authors declare that they have no competing interests.
Publisher's Disclaimer: This is a PDF file of an unedited manuscript that has been accepted for publication. As a service to our customers we are providing this early version of the manuscript. The manuscript will undergo copyediting, typesetting, and review of the resulting proof before it is published in its final citable form. Please note that during the production process errors may be discovered which could affect the content, and all legal disclaimers that apply to the journal pertain.
Contributor Information
Alicia R. Timme-Laragy, Email: aliciat@schoolph.umass.edu, atimmelaragy@whoi.edu.
Jared V. Goldstone, Email: jgoldstone@whoi.edu.
Barry R. Imhoff, Email: barry.imhoff@emory.edu.
John J. Stegeman, Email: jstegeman@whoi.edu.
Mark E. Hahn, Email: mhahn@whoi.edu.
Jason M. Hansen, Email: jhansen@emory.edu.
References
- 1.Hernandez-Garcia D, Wood CD, Castro-Obregon S, Covarrubias L. Reactive oxygen species: A radical role in development? Free radical biology & medicine. 2010;49:130–143. doi: 10.1016/j.freeradbiomed.2010.03.020. [DOI] [PubMed] [Google Scholar]
- 2.Covarrubias L, Hernandez-Garcia D, Schnabel D, Salas-Vidal E, Castro-Obregon S. Function of reactive oxygen species during animal development: passive or active? Developmental biology. 2008;320:1–11. doi: 10.1016/j.ydbio.2008.04.041. [DOI] [PubMed] [Google Scholar]
- 3.Coffman JA, Coluccio A, Planchart A, Robertson AJ. Oral-aboral axis specification in the sea urchin embryo III. Role of mitochondrial redox signaling via H2O2. Developmental biology. 2009;330:123–130. doi: 10.1016/j.ydbio.2009.03.017. [DOI] [PMC free article] [PubMed] [Google Scholar]
- 4.Coffman JA, Davidson EH. Oral-aboral axis specification in the sea urchin embryo. I. Axis entrainment by respiratory asymmetry. Developmental biology. 2001;230:18–28. doi: 10.1006/dbio.2000.9996. [DOI] [PubMed] [Google Scholar]
- 5.Coffman JA, Denegre JM. Mitochondria, redox signaling and axis specification in metazoan embryos. Developmental biology. 2007;308:266–280. doi: 10.1016/j.ydbio.2007.05.042. [DOI] [PubMed] [Google Scholar]
- 6.Ufer C, Wang CC, Borchert A, Heydeck D, Kuhn H. Redox control in mammalian embryo development. Antioxidants & redox signaling. 2010;13:833–875. doi: 10.1089/ars.2009.3044. [DOI] [PubMed] [Google Scholar]
- 7.Dennery PA. Oxidative stress in development: nature or nurture? Free radical biology & medicine. 2010;49:1147–1151. doi: 10.1016/j.freeradbiomed.2010.07.011. [DOI] [PubMed] [Google Scholar]
- 8.Droge W. Oxidative stress and aging. Advances in experimental medicine and biology. 2003;543:191–200. doi: 10.1007/978-1-4419-8997-0_14. [DOI] [PubMed] [Google Scholar]
- 9.Hitchler MJ, Domann FE. An epigenetic perspective on the free radical theory of development. Free radical biology & medicine. 2007;43:1023–1036. doi: 10.1016/j.freeradbiomed.2007.06.027. [DOI] [PMC free article] [PubMed] [Google Scholar]
- 10.Ranganna K, Mathew OP, Yatsu FM, Yousefipour Z, Hayes BE, Milton SG. Involvement of glutathione/glutathione S-transferase antioxidant system in butyrate-inhibited vascular smooth muscle cell proliferation. The FEBS journal. 2007;274:5962–5978. doi: 10.1111/j.1742-4658.2007.06119.x. [DOI] [PubMed] [Google Scholar]
- 11.Yan T, Deng S, Metzger A, Godtel-Armbrust U, Porter AC, Wojnowski L. Topoisomerase II{alpha}-dependent and -independent apoptotic effects of dexrazoxane and doxorubicin. Molecular cancer therapeutics. 2009;8:1075–1085. doi: 10.1158/1535-7163.MCT-09-0139. [DOI] [PubMed] [Google Scholar]
- 12.Anathy V, Roberson EC, Guala AS, Godburn KE, Budd RC, Janssen-Heininger YM. Redox-based regulation of apoptosis: S-glutathionylation as a regulatory mechanism to control cell death. Antioxidants & redox signaling. 2012;16:496–505. doi: 10.1089/ars.2011.4281. [DOI] [PMC free article] [PubMed] [Google Scholar]
- 13.Loeken MR. Advances in understanding the molecular causes of diabetes-induced birth defects. Journal of the Society for Gynecologic Investigation. 2006;13:2–10. doi: 10.1016/j.jsgi.2005.09.007. [DOI] [PubMed] [Google Scholar]
- 14.Ornoy A. Embryonic oxidative stress as a mechanism of teratogenesis with special emphasis on diabetic embryopathy. Reproductive toxicology. 2007;24:31–41. doi: 10.1016/j.reprotox.2007.04.004. [DOI] [PubMed] [Google Scholar]
- 15.Livingstone DR. Contaminant-stimulated Reactive Oxygen Species Production and Oxidative Damage in Aquatic Organisms. Marine Pollution Bulletin. 2001;42:656–666. doi: 10.1016/s0025-326x(01)00060-1. [DOI] [PubMed] [Google Scholar]
- 16.Valavanidis A, Vlahogianni T, Dassenakis M, Scoullos M. Molecular biomarkers of oxidative stress in aquatic organisms in relation to toxic environmental pollutants. Ecotoxicology and Environmental Safety. 2006;64:178–189. doi: 10.1016/j.ecoenv.2005.03.013. [DOI] [PubMed] [Google Scholar]
- 17.Hansen JM. Oxidative stress as a mechanism of teratogenesis. Birth defects research. Part C, Embryo today: reviews. 2006;78:293–307. doi: 10.1002/bdrc.20085. [DOI] [PubMed] [Google Scholar]
- 18.Bolton JL, Trush MA, Penning TM, Dryhurst G, Monks TJ. Role of quinones in toxicology. Chemical research in toxicology. 2000;13:135–160. doi: 10.1021/tx9902082. [DOI] [PubMed] [Google Scholar]
- 19.Jones DP. Redefining oxidative stress. Antioxidants & redox signaling. 2006;8:1865–1879. doi: 10.1089/ars.2006.8.1865. [DOI] [PubMed] [Google Scholar]
- 20.Reimers MJ, La Du JK, Periera CB, Giovanini J, Tanguay RL. Ethanol-dependent toxicity in zebrafish is partially attenuated by antioxidants. Neurotoxicology and teratology. 2006;28:497–508. doi: 10.1016/j.ntt.2006.05.007. [DOI] [PubMed] [Google Scholar]
- 21.Wells PG, Bhuller Y, Chen CS, Jeng W, Kasapinovic S, Kennedy JC, Kim PM, Laposa RR, McCallum GP, Nicol CJ, Parman T, Wiley MJ, Wong AW. Molecular and biochemical mechanisms in teratogenesis involving reactive oxygen species. Toxicology and applied pharmacology. 2005;207:354–366. doi: 10.1016/j.taap.2005.01.061. [DOI] [PubMed] [Google Scholar]
- 22.Timme-Laragy AR, Van Tiem LA, Linney EA, Di Giulio RT. Antioxidant responses and NRF2 in synergistic developmental toxicity of PAHs in zebrafish. Toxicological sciences: an official journal of the Society of Toxicology. 2009;109:217–227. doi: 10.1093/toxsci/kfp038. [DOI] [PMC free article] [PubMed] [Google Scholar]
- 23.Li Z, Dong T, Proschel C, Noble M. Chemically diverse toxicants converge on Fyn and c-Cbl to disrupt precursor cell function. PLoS biology. 2007;5:e35. doi: 10.1371/journal.pbio.0050035. [DOI] [PMC free article] [PubMed] [Google Scholar]
- 24.Knobloch J, Reimann K, Klotz LO, Ruther U. Thalidomide resistance is based on the capacity of the glutathione-dependent antioxidant defense. Molecular pharmaceutics. 2008;5:1138–1144. doi: 10.1021/mp8001232. [DOI] [PubMed] [Google Scholar]
- 25.Wang L, Gallagher EP. Role of Nrf2 antioxidant defense in mitigating cadmium- induced oxidative stress in the olfactory system of zebrafish. Toxicology and applied pharmacology. 2012 doi: 10.1016/j.taap.2012.11.010. [DOI] [PubMed] [Google Scholar]
- 26.Wells PG, McCallum GP, Chen CS, Henderson JT, Lee CJ, Perstin J, Preston TJ, Wiley MJ, Wong AW. Oxidative stress in developmental origins of disease: teratogenesis, neurodevelopmental deficits, and cancer. Toxicological sciences: an official journal of the Society of Toxicology. 2009;108:4–18. doi: 10.1093/toxsci/kfn263. [DOI] [PubMed] [Google Scholar]
- 27.Tung EW, Winn LM. Valproic acid increases formation of reactive oxygen species and induces apoptosis in postimplantation embryos: a role for oxidative stress in valproic acid-induced neural tube defects. Molecular pharmacology. 2011;80:979–987. doi: 10.1124/mol.111.072314. [DOI] [PubMed] [Google Scholar]
- 28.Badham HJ, Renaud SJ, Wan J, Winn LM. Benzene-initiated oxidative stress: Effects on embryonic signaling pathways. Chemico-biological interactions. 2010;184:218–221. doi: 10.1016/j.cbi.2009.11.005. [DOI] [PubMed] [Google Scholar]
- 29.Giussani DA, Camm EJ, Niu Y, Richter HG, Blanco CE, Gottschalk R, Blake EZ, Horder KA, Thakor AS, Hansell JA, Kane AD, Wooding FB, Cross CM, Herrera EA. Developmental programming of cardiovascular dysfunction by prenatal hypoxia and oxidative stress. PloS one. 2012;7:e31017. doi: 10.1371/journal.pone.0031017. [DOI] [PMC free article] [PubMed] [Google Scholar]
- 30.Camm EJ, Martin-Gronert MS, Wright NL, Hansell JA, Ozanne SE, Giussani DA. Prenatal hypoxia independent of undernutrition promotes molecular markers of insulin resistance in adult offspring. FASEB journal: official publication of the Federation of American Societies for Experimental Biology. 2011;25:420–427. doi: 10.1096/fj.10-158188. [DOI] [PubMed] [Google Scholar]
- 31.Huang CS, Anderson ME, Meister A. Amino acid sequence and function of the light subunit of rat kidney gamma-glutamylcysteine synthetase. The Journal of biological chemistry. 1993;268:20578–20583. [PubMed] [Google Scholar]
- 32.Huang CS, Chang LS, Anderson ME, Meister A. Catalytic and regulatory properties of the heavy subunit of rat kidney gamma-glutamylcysteine synthetase. The Journal of biological chemistry. 1993;268:19675–19680. [PubMed] [Google Scholar]
- 33.Dickinson DA, Levonen AL, Moellering DR, Arnold EK, Zhang H, Darley-Usmar VM, Forman HJ. Human glutamate cysteine ligase gene regulation through the electrophile response element. Free radical biology & medicine. 2004;37:1152–1159. doi: 10.1016/j.freeradbiomed.2004.06.011. [DOI] [PubMed] [Google Scholar]
- 34.Franklin CC, Backos DS, Mohar I, White CC, Forman HJ, Kavanagh TJ. Structure, function, and post-translational regulation of the catalytic and modifier subunits of glutamate cysteine ligase. Molecular aspects of medicine. 2009;30:86–98. doi: 10.1016/j.mam.2008.08.009. [DOI] [PMC free article] [PubMed] [Google Scholar]
- 35.Hansen JM, Lee E, Harris C. Spatial activities and induction of glutamate-cysteine ligase (GCL) in the postimplantation rat embryo and visceral yolk sac. Toxicological sciences: an official journal of the Society of Toxicology. 2004;81:371–378. doi: 10.1093/toxsci/kfh154. [DOI] [PubMed] [Google Scholar]
- 36.Winkler A, Njålsson R, Carlsson K, Elgadi A, Rozell Br, Abraham L, Ercal N, Shi Z-Z, Lieberman MW, Larsson A, Norgren S. Glutathione is essential for early embryogenesis - Analysis of a glutathione synthetase knockout mouse. Biochemical and Biophysical Research Communications. 2011;412:121–126. doi: 10.1016/j.bbrc.2011.07.056. [DOI] [PubMed] [Google Scholar]
- 37.Lu SC. Glutathione synthesis. Biochimica et biophysica acta. 2012 doi: 10.1016/j.bbagen.2012.09.008. [DOI] [PMC free article] [PubMed] [Google Scholar]
- 38.Lu SC. Regulation of glutathione synthesis. Molecular aspects of medicine. 2009;30:42–59. doi: 10.1016/j.mam.2008.05.005. [DOI] [PMC free article] [PubMed] [Google Scholar]
- 39.Hansen JM, Go YM, Jones DP. Nuclear and mitochondrial compartmentation of oxidative stress and redox signaling. Annual review of pharmacology and toxicology. 2006;46:215–234. doi: 10.1146/annurev.pharmtox.46.120604.141122. [DOI] [PubMed] [Google Scholar]
- 40.Schafer FQ, Buettner GR. Redox environment of the cell as viewed through the redox state of the glutathione disulfide/glutathione couple. Free radical biology & medicine. 2001;30:1191–1212. doi: 10.1016/s0891-5849(01)00480-4. [DOI] [PubMed] [Google Scholar]
- 41.Jones DP. Redox potential of GSH/GSSG couple: assay and biological significance. Methods in enzymology. 2002;348:93–112. doi: 10.1016/s0076-6879(02)48630-2. [DOI] [PubMed] [Google Scholar]
- 42.Smith J, Ladi E, Mayer-Proschel M, Noble M. Redox state is a central modulator of the balance between self-renewal and differentiation in a dividing glial precursor cell. Proc Natl Acad Sci U S A. 2000;97:10032–10037. doi: 10.1073/pnas.170209797. [DOI] [PMC free article] [PubMed] [Google Scholar]
- 43.Mieyal JJ, Gallogly MM, Qanungo S, Sabens EA, Shelton MD. Molecular mechanisms and clinical implications of reversible protein S-glutathionylation. Antioxidants & redox signaling. 2008;10:1941–1988. doi: 10.1089/ars.2008.2089. [DOI] [PMC free article] [PubMed] [Google Scholar]
- 44.Lertratanangkoon K, Wu CJ, Savaraj N, Thomas ML. Alterations of DNA methylation by glutathione depletion. Cancer Letters. 1997;120:149–156. doi: 10.1016/s0304-3835(97)00300-5. [DOI] [PubMed] [Google Scholar]
- 45.Stegeman JJ, Goldstone JV, Hahn ME. Perspectives on zebrafish as a model in environmental toxicology. In: Perry SF, Ekker M, Farrell AP, Brauner CJ, editors. Zebrafish (Fish Physiology) 2010. pp. 367–439. [Google Scholar]
- 46.Hill AJ, Teraoka H, Heideman W, Peterson RE. Zebrafish as a model vertebrate for investigating chemical toxicity. Toxicological sciences: an official journal of the Society of Toxicology. 2005;86:6–19. doi: 10.1093/toxsci/kfi110. [DOI] [PubMed] [Google Scholar]
- 47.Lawson ND, Wolfe SA. Forward and reverse genetic approaches for the analysis of vertebrate development in the zebrafish. Developmental cell. 2011;21:48–64. doi: 10.1016/j.devcel.2011.06.007. [DOI] [PubMed] [Google Scholar]
- 48.Timme-Laragy AR, Karchner SI, Hahn ME. Gene knockdown by morpholino-modified oligonucleotides in the zebrafish (Danio rerio) model: applications for developmental toxicology. Methods in molecular biology. 2012;889:51–71. doi: 10.1007/978-1-61779-867-2_5. [DOI] [PMC free article] [PubMed] [Google Scholar]
- 49.Sipes NS, Padilla S, Knudsen TB. Zebrafish: as an integrative model for twenty-first century toxicity testing. Birth defects research. Part C, Embryo today: reviews. 2011;93:256–267. doi: 10.1002/bdrc.20214. [DOI] [PubMed] [Google Scholar]
- 50.Brannen KC, Panzica-Kelly JM, Danberry TL, Augustine-Rauch KA. Development of a zebrafish embryo teratogenicity assay and quantitative prediction model. Birth defects research. 2010;89:66–77. doi: 10.1002/bdrb.20223. [DOI] [PubMed] [Google Scholar]
- 51.Kobayashi M, Itoh K, Suzuki T, Osanai H, Nishikawa K, Katoh Y, Takagi Y, Yamamoto M. Identification of the interactive interface and phylogenic conservation of the Nrf2-Keap1 system. Genes Cells. 2002;7:807–820. doi: 10.1046/j.1365-2443.2002.00561.x. [DOI] [PubMed] [Google Scholar]
- 52.Kobayashi M, Li L, Iwamoto N, Nakajima-Takagi Y, Kaneko H, Nakayama Y, Eguchi M, Wada Y, Kumagai Y, Yamamoto M. The antioxidant defense system Keap1-Nrf2 comprises a multiple sensing mechanism for responding to a wide range of chemical compounds. Molecular and cellular biology. 2009;29:493–502. doi: 10.1128/MCB.01080-08. [DOI] [PMC free article] [PubMed] [Google Scholar]
- 53.Mukaigasa K, Nguyen LT, Li L, Nakajima H, Yamamoto M, Kobayashi M. Genetic Evidence of an Evolutionarily Conserved Role for Nrf2 in the Protection against Oxidative Stress. Molecular and cellular biology. 2012;32:4455–4461. doi: 10.1128/MCB.00481-12. [DOI] [PMC free article] [PubMed] [Google Scholar]
- 54.Timme-Laragy AR, Karchner SI, Franks DG, Jenny MJ, Harbeitner RC, Goldstone JV, McArthur AG, Hahn ME. Nrf2b, novel zebrafish paralog of oxidant-responsive transcription factor NF-E2-related factor 2 (NRF2) The Journal of biological chemistry. 2012;287:4609–4627. doi: 10.1074/jbc.M111.260125. [DOI] [PMC free article] [PubMed] [Google Scholar]
- 55.Kusik BW, Carvan MJ, 3rd, Udvadia AJ. Detection of mercury in aquatic environments using EPRE reporter zebrafish. Marine biotechnology (New York, NY. 2008;10:750–757. doi: 10.1007/s10126-008-9113-x. [DOI] [PMC free article] [PubMed] [Google Scholar]
- 56.Jones DP, Carlson JL, Mody VC, Cai J, Lynn MJ, Sternberg P. Redox state of glutathione in human plasma. Free radical biology & medicine. 2000;28:625–635. doi: 10.1016/s0891-5849(99)00275-0. [DOI] [PubMed] [Google Scholar]
- 57.Jiang S, Moriarty SE, Grossniklaus H, Nelson KC, Jones DP, Sternberg P., Jr Increased oxidant-induced apoptosis in cultured nondividing human retinal pigment epithelial cells. Investigative ophthalmology & visual science. 2002;43:2546–2553. [PubMed] [Google Scholar]
- 58.Kirlin WG, Cai J, Thompson SA, Diaz D, Kavanagh TJ, Jones DP. Glutathione redox potential in response to differentiation and enzyme inducers. Free radical biology & medicine. 1999;27:1208–1218. doi: 10.1016/s0891-5849(99)00145-8. [DOI] [PubMed] [Google Scholar]
- 59.Goldstone JV, McArthur AG, Kubota A, Zanette J, Parente T, Jonsson ME, Nelson DR, Stegeman JJ. Identification and developmental expression of the full complement of Cytochrome P450 genes in Zebrafish. BMC genomics. 2010;11:643. doi: 10.1186/1471-2164-11-643. [DOI] [PMC free article] [PubMed] [Google Scholar]
- 60.Kimmel CB, Ballard WW, Kimmel SR, Ullmann B, Schilling TF. Stages of embryonic development of the zebrafish. Dev Dyn. 1995;203:253–310. doi: 10.1002/aja.1002030302. [DOI] [PubMed] [Google Scholar]
- 61.Aryee MJ, Gutierrez-Pabello JA, Kramnik I, Maiti T, Quackenbush J. An improved empirical bayes approach to estimating differential gene expression in microarray time-course data: BETR (Bayesian Estimation of Temporal Regulation) BMC Bioinformatics. 2009;10:409. doi: 10.1186/1471-2105-10-409. [DOI] [PMC free article] [PubMed] [Google Scholar]
- 62.Pullela PK, Chiku T, Carvan MJ, III, Sem DS. Fluorescence-based detection of thiols in vitro and in vivo using dithiol probes. Analytical Biochemistry. 2006;352:265–273. doi: 10.1016/j.ab.2006.01.047. [DOI] [PubMed] [Google Scholar]
- 63.Suzuki T, Takagi Y, Osanai H, Li L, Takeuchi M, Katoh Y, Kobayashi M, Yamamoto M. Pi class glutathione S-transferase genes are regulated by Nrf 2 through an evolutionarily conserved regulatory element in zebrafish. Biochem J. 2005;388:65–73. doi: 10.1042/BJ20041860. [DOI] [PMC free article] [PubMed] [Google Scholar]
- 64.Jorgensen A, Nielsen JE, Nielsen BF, Morthorst JE, Bjerregaard P, Leffers H. Expression of prostaglandin synthases (pgds and pges) during zebrafish gonadal differentiation. Comparative biochemistry and physiology. Part A, Molecular & integrative physiology. 2010;157:102–108. doi: 10.1016/j.cbpa.2010.03.014. [DOI] [PubMed] [Google Scholar]
- 65.Ufer C, Wang CC. The Roles of Glutathione Peroxidases during Embryo Development. Frontiers in molecular neuroscience. 2011;4:12. doi: 10.3389/fnmol.2011.00012. [DOI] [PMC free article] [PubMed] [Google Scholar]
- 66.Harris C. Glutathione biosynthesis in the postimplantation rat conceptus in vitro. Toxicology and applied pharmacology. 1993;120:247–256. doi: 10.1006/taap.1993.1109. [DOI] [PubMed] [Google Scholar]
- 67.Beck MJ, McLellan C, Lightle RL-F, Philbert MA, Harris C. Spatial Glutathione and Cysteine Distribution and Chemical Modulation in the Early Organogenesis-Stage Rat Conceptus in Utero. Toxicological Sciences. 2001;62:92–102. doi: 10.1093/toxsci/62.1.92. [DOI] [PubMed] [Google Scholar]
- 68.Messina JP, Lawrence DA. Cell cycle progression of glutathione-depleted human peripheral blood mononuclear cells is inhibited at S phase. Journal of immunology (Baltimore, Md: 1950) 1989;143:1974–1981. [PubMed] [Google Scholar]
- 69.Markovic J, Borras C, Ortega A, Sastre J, Vina J, Pallardo FV. Glutathione is recruited into the nucleus in early phases of cell proliferation. The Journal of biological chemistry. 2007;282:20416–20424. doi: 10.1074/jbc.M609582200. [DOI] [PubMed] [Google Scholar]
- 70.Pallardo FV, Markovic J, Garcia JL, Vina J. Role of nuclear glutathione as a key regulator of cell proliferation. Molecular aspects of medicine. 2009;30:77–85. doi: 10.1016/j.mam.2009.01.001. [DOI] [PubMed] [Google Scholar]
- 71.Garcia-Gimenez JL, Markovic J, Dasi F, Queval G, Schnaubelt D, Foyer CH, Pallardo FV. Nuclear glutathione. Biochimica et biophysica acta. 2013;1830:3304–3316. doi: 10.1016/j.bbagen.2012.10.005. [DOI] [PubMed] [Google Scholar]
- 72.Hansen JM, Carney EW, Harris C. Altered differentiation in rat and rabbit limb bud micromass cultures by glutathione modulating agents. Free radical biology & medicine. 2001;31:1582–1592. doi: 10.1016/s0891-5849(01)00751-1. [DOI] [PubMed] [Google Scholar]
- 73.Holmgren A. Regulation of ribonucleotide reductase. Current topics in cellular regulation. 1981;19:47–76. doi: 10.1016/b978-0-12-152819-5.50019-1. [DOI] [PubMed] [Google Scholar]
- 74.Diaz Vivancos P, Wolff T, Markovic J, Pallardo FV, Foyer CH. A nuclear glutathione cycle within the cell cycle. Biochem J. 2010;431:169–178. doi: 10.1042/BJ20100409. [DOI] [PubMed] [Google Scholar]
- 75.Burhans WC, Heintz NH. The cell cycle is a redox cycle: linking phase-specific targets to cell fate. Free radical biology & medicine. 2009;47:1282–1293. doi: 10.1016/j.freeradbiomed.2009.05.026. [DOI] [PubMed] [Google Scholar]
- 76.Imhoff BR, Hansen JM. Tert-butylhydroquinone induces mitochondrial oxidative stress causing Nrf2 activation. Cell biology and toxicology. 2010;26:541–551. doi: 10.1007/s10565-010-9162-6. [DOI] [PubMed] [Google Scholar]
- 77.Imhoff BR, Hansen JM. Differential redox potential profiles during adipogenesis and osteogenesis. Cellular & molecular biology letters. 2011;16:149–161. doi: 10.2478/s11658-010-0042-0. [DOI] [PMC free article] [PubMed] [Google Scholar]
- 78.Rizzo AM, Adorni L, Montorfano G, Rossi F, Berra B. Antioxidant metabolism of Xenopus laevis embryos during the first days of development. Comparative biochemistry and physiology. 2007;146:94–100. doi: 10.1016/j.cbpb.2006.09.009. [DOI] [PubMed] [Google Scholar]
- 79.Cavas L, Tarhan L. Glutathione redox system GSH-Px activity lipid peroxidation (LPO) levels in tadpoles of Rrridibunda B. viridis. Cell biochemistry and function. 2003;21:75–79. doi: 10.1002/cbf.998. [DOI] [PubMed] [Google Scholar]
- 80.Hermes-Lima M, Carreiro C, Moreira DC, Polcheira C, Machado DP, Campos EG. Glutathione status and antioxidant enzymes in a crocodilian species from the swamps of the Brazilian Pantanal. Comparative biochemistry and physiology. Part A, Molecular & integrative physiology. 2012;163:189–198. doi: 10.1016/j.cbpa.2012.06.006. [DOI] [PubMed] [Google Scholar]
- 81.Elbarbry F, Alcorn J. Ontogeny of glutathione and glutathione-related antioxidant enzymes in rat liver. Research in veterinary science. 2009;87:242–244. doi: 10.1016/j.rvsc.2009.03.004. [DOI] [PubMed] [Google Scholar]
- 82.Gardiner CS, Reed DJ. Status of glutathione during oxidant-induced oxidative stress in the preimplantation mouse embryo. Biology of reproduction. 1994;51:1307–1314. doi: 10.1095/biolreprod51.6.1307. [DOI] [PubMed] [Google Scholar]
- 83.Monostori P, Wittmann G, Karg E, Túri S. Determination of glutathione and glutathione disulfide in biological samples: An in-depth review. Journal of Chromatography B. 2009;877:3331–3346. doi: 10.1016/j.jchromb.2009.06.016. [DOI] [PubMed] [Google Scholar]
- 84.Skjaerven KH, Penglase S, Olsvik PA, Hamre K. Redox regulation in Atlantic cod (Gadus morhua) embryos developing under normal and heat-stressed conditions. Free radical biology & medicine. 2013;57:29–38. doi: 10.1016/j.freeradbiomed.2012.11.022. [DOI] [PubMed] [Google Scholar]
- 85.Burton GJ. Oxygen, the Janus gas; its effects on human placental development and function. Journal of anatomy. 2009;215:27–35. doi: 10.1111/j.1469-7580.2008.00978.x. [DOI] [PMC free article] [PubMed] [Google Scholar]
- 86.Willemse MTM, Denuce JM. Hatching glands in the teleosts, Brachydanio rerio, Danil Malabaricus, Moenkhausia oligolepis, and Barbus schuberti. Development, Growth and Differentiation. 1973;15:169–177. doi: 10.1111/j.1440-169X.1973.00169.x. [DOI] [PubMed] [Google Scholar]
- 87.Jiang Z, Hu Z, Zeng L, Lu W, Zhang H, Li T, Xiao H. The role of the Golgi apparatus in oxidative stress: is this organelle less significant than mitochondria? Free radical biology & medicine. 2011;50:907–917. doi: 10.1016/j.freeradbiomed.2011.01.011. [DOI] [PubMed] [Google Scholar]
- 88.Okada A, Sano K, Nagata K, Yasumasu S, Ohtsuka J, Yamamura A, Kubota K, Iuchi I, Tanokura M. Crystal structure of zebrafish hatching enzyme 1 from the zebrafish Danio rerio. 2010 doi: 10.1016/j.jmb.2010.08.023. [DOI] [PubMed] [Google Scholar]
- 89.Sano K, Inohaya K, Kawaguchi M, Yoshizaki N, Iuchi I, Yasumasu S. Purification and characterization of zebrafish hatching enzyme – an evolutionary aspect of the mechanism of egg envelope digestion. FEBS Journal. 2008;275:5934–5946. doi: 10.1111/j.1742-4658.2008.06722.x. [DOI] [PubMed] [Google Scholar]
- 90.Buhimschi IA, Kramer WB, Buhimschi CS, Thompson LP, Weiner CP. Reduction-oxidation (redox) state regulation of matrix metalloproteinase activity in human fetal membranes. American journal of obstetrics and gynecology. 2000;182:458–464. doi: 10.1016/s0002-9378(00)70239-0. [DOI] [PubMed] [Google Scholar]
- 91.Nelson KK, Melendez JA. Mitochondrial redox control of matrix metalloproteinases. Free Radical Biology and Medicine. 2004;37:768–784. doi: 10.1016/j.freeradbiomed.2004.06.008. [DOI] [PubMed] [Google Scholar]
- 92.Postlethwait J, Amores A, Cresko W, Singer A, Yan YL. Subfunction partitioning, the teleost radiation and the annotation of the human genome. Trends Genet. 2004;20:481–490. doi: 10.1016/j.tig.2004.08.001. [DOI] [PubMed] [Google Scholar]
- 93.Chiang EF, Pai CI, Wyatt M, Yan YL, Postlethwait J, Chung B. Two sox9 genes on duplicated zebrafish chromosomes: expression of similar transcription activators in distinct sites. Developmental biology. 2001;231:149–163. doi: 10.1006/dbio.2000.0129. [DOI] [PubMed] [Google Scholar]
- 94.Imai H, Nakagawa Y. Biological significance of phospholipid hydroperoxide glutathione peroxidase (PHGPx, GPx4) in mammalian cells. Free radical biology & medicine. 2003;34:145–169. doi: 10.1016/s0891-5849(02)01197-8. [DOI] [PubMed] [Google Scholar]
- 95.Yant LJ, Ran Q, Rao L, Van Remmen H, Shibatani T, Belter JG, Motta L, Richardson A, Prolla TA. The selenoprotein GPX4 is essential for mouse development and protects from radiation and oxidative damage insults. Free radical biology & medicine. 2003;34:496–502. doi: 10.1016/s0891-5849(02)01360-6. [DOI] [PubMed] [Google Scholar]
- 96.Schnabel D, Salas-Vidal E, Narvaez V, del Sanchez-Carbente MR, Hernandez-Garcia D, Cuervo R, Covarrubias L. Expression and regulation of antioxidant enzymes in the developing limb support a function of ROS in interdigital cell death. Developmental biology. 2006;291:291–299. doi: 10.1016/j.ydbio.2005.12.023. [DOI] [PubMed] [Google Scholar]
- 97.Nakajima H, Nakajima-Takagi Y, Tsujita T, Akiyama S, Wakasa T, Mukaigasa K, Kaneko H, Tamaru Y, Yamamoto M, Kobayashi M. Tissue-restricted expression of Nrf2 and its target genes in zebrafish with gene-specific variations in the induction profiles. PloS one. 2011;6:e26884. doi: 10.1371/journal.pone.0026884. [DOI] [PMC free article] [PubMed] [Google Scholar]
- 98.Chen L, Kwong M, Lu R, Ginzinger D, Lee C, Leung L, Chan JY. Nrf1 is critical for redox balance and survival of liver cells during development. Molecular and cellular biology. 2003;23:4673–4686. doi: 10.1128/MCB.23.13.4673-4686.2003. [DOI] [PMC free article] [PubMed] [Google Scholar]
- 99.Han W, Ming M, Zhao R, Pi J, Wu C, He YY. Nrf1 CNC-bZIP protein promotes cell survival and nucleotide excision repair through maintaining glutathione homeostasis. The Journal of biological chemistry. 2012;287:18788–18795. doi: 10.1074/jbc.M112.363614. [DOI] [PMC free article] [PubMed] [Google Scholar]
- 100.Peng Z, Geh E, Chen L, Meng Q, Fan Y, Sartor M, Shertzer HG, Liu ZG, Puga A, Xia Y. Inhibitor of kappaB kinase beta regulates redox homeostasis by controlling the constitutive levels of glutathione. Molecular pharmacology. 2010;77:784–792. doi: 10.1124/mol.109.061424. [DOI] [PMC free article] [PubMed] [Google Scholar]
- 101.Sierra-Rivera E, Meredith MJ, Summar ML, Smith MD, Voorhees GJ, Stoffel CM, Freeman ML. Genes regulating glutathione concentrations in X-ray-transformed rat embryo fibroblasts: changes in gamma-glutamylcysteine synthetase and gamma-glutamyltranspeptidase expression. Carcinogenesis. 1994;15:1301–1307. doi: 10.1093/carcin/15.7.1301. [DOI] [PubMed] [Google Scholar]
- 102.Shivananjappa MM, Muralidhara Differential oxidative stress induction and lethality of rat embryos after maternal exposure to t-butyl hydroperoxide during postimplantation period. Drug and chemical toxicology. 2012 doi: 10.3109/01480545.2012.710622. [DOI] [PubMed] [Google Scholar]
- 103.Luo ZC, Fraser WD, Julien P, Deal CL, Audibert F, Smith GN, Xiong X, Walker M. Tracing the origins of “fetal origins” of adult diseases: programming by oxidative stress? Medical hypotheses. 2006;66:38–44. doi: 10.1016/j.mehy.2005.08.020. [DOI] [PubMed] [Google Scholar]
- 104.Harbeitner RC, Hahn ME, Timme-Laragy AR. Differential sensitivity to pro-oxidant exposure in two populations of killifish (Fundulus heteroclitus) Ecotoxicology. 2013;22:387–401. doi: 10.1007/s10646-012-1033-x. [DOI] [PMC free article] [PubMed] [Google Scholar]
Associated Data
This section collects any data citations, data availability statements, or supplementary materials included in this article.