

This study determines genes that are regulated by Brd2 and finds that, in addition to expression control, Brd2 modulates the alternative splicing of several hundred genes. The in vivo interaction of Brd2 with chromatin is analyzed, and the contributions of individual Brd2 domains to the chromatin interaction are determined.
Abstract
Brd2 is a member of the bromodomain extra terminal (BET) protein family, which consists of four chromatin-interacting proteins that regulate gene expression. Each BET protein contains two N-terminal bromodomains, which recognize acetylated histones, and the C-terminal protein–protein interaction domain. Using a genome-wide screen, we identify 1450 genes whose transcription is regulated by Brd2. In addition, almost 290 genes change their alternative splicing pattern upon Brd2 depletion. Brd2 is specifically localized at promoters of target genes, and our data show that Brd2 interaction with chromatin cannot be explained solely by histone acetylation. Using coimmunoprecipitation and live-cell imaging, we show that the C-terminal part is crucial for Brd2 association with chromatin. Live-cell microscopy also allows us to map the average binding time of Brd2 to chromatin and quantify the contributions of individual Brd2 domains to the interaction with chromatin. Finally, we show that bromodomains and the C-terminal domain are equally important for transcription and splicing regulation, which correlates with the role of these domains in Brd2 binding to chromatin.
INTRODUCTION
Small molecules that influence the epigenetic status of cells have attracted attention as potential anticancer therapeutic agents, and many of these compounds are in preclinical and clinical trials (Dawson and Kouzarides, 2012). Among the most promising targets of epigenetic drugs are bromodomain extra terminal (BET) proteins (Belkina and Denis, 2012; Prinjha et al., 2012). The mammalian BET protein family includes ubiquitously expressed Brd2, Brd3, Brd4, and testis-specific BrdT. BET proteins contain two N-terminal bromodomains (BDs; BD1 and BD2) and the extra terminal (ET) protein interaction domain. Tandem BDs recognize acetylated lysines at histones, and this interaction likely recruits BET proteins to chromatin. A distinct feature of BET proteins is that their attachment to chromatin persists during mitosis, which might help to reactivate postmitotic transcription and suggests a role in epigenetic memory (Dey et al., 2003, 2009; Kanno et al., 2004; Zhao et al., 2011; Garcia-Gutierrez et al., 2012). BDs can selectively distinguish specific acetylated lysines; for example, BD2 of Brd2 interacts preferentially with H4K12ac or H4K5ac/K12ac, whereas BD1 of the same protein recognizes H4K5ac/K8ac (Huang et al., 2007; Umehara et al., 2010; Filippakopoulos and Knapp, 2012). In addition, Brd2 BDs have much higher affinity to H4K5ac/K8ac/K12ac/K16ac tetraacetylated peptides than to single acetylation marks (Filippakopoulos et al., 2012; LeRoy et al., 2012). In contrast to diverse BD targets, ET domains, which are highly conserved among individual BET proteins (>80% identity among Brd2, Brd3, and Brd4), interact with the same proteins, for example, NSD3 methyltransferase or JMJD6 lysyl hydroxylase (Webby et al., 2009; Rahman et al., 2011). BET proteins are found in multiple protein complexes; for example, Brd2 associates with RNA polymerase II and TATA box binding protein (TBP)–associated factors (TAFs), histone acetylases (CBP/p300), histone deacetylases, and chromatin assembly and remodeling factors (Denis et al., 2006).
The BET proteins are transcription regulators, and the role of Brd3 and Brd4 in transcription is quite well established. Brd3 specifically binds the GATA1 transcription factor and enhances expression of GATA1-dependent genes (Gamsjaeger et al., 2011; Lamonica et al., 2011). Brd4 stimulates transcription via recruitment of active P-TEFb and induces phosphorylation of the C-terminal domain of RNA polymerase II (Jang et al., 2005; Yang et al., 2005; Hargreaves et al., 2009; Devaiah et al., 2012). However, less is known about the transcription regulation by Brd2. Brd2 associates with E2F transcription factors and helps to recruit TBP to promoters (Denis et al., 2006; Peng et al., 2007). In vitro, Brd2 enhances the passage of RNA polymerase II through acetylated chromatin within the gene body (LeRoy et al., 2008). The importance of Brd2 is underscored by several experiments showing that Brd2 is an essential gene. Brd2−/− mice display defects in the development of the neural tube and abnormal brain structures and die during embryogenesis (Gyuris et al., 2009; Shang et al., 2009). Heterozygous Brd2+/− mice are viable but have a low number of inhibitory neurons in brain and develop spontaneous seizures (Velíšek et al., 2011). In addition, several studies link the BRD2 gene to epilepsy in humans (Pal et al., 2003; Cavalleri et al., 2007). Of interest, mice with lowered Brd2 expression are extremely obese but are protected from type 2 diabetes (Wang et al., 2010).
Why Brd2 depletion has such a pleiotropic effect or which genes it regulates is poorly understood. To gain further insight into Brd2 function in vivo, we monitored changes in gene expression using Brd2-specific knockdown and genome-wide analysis. We mapped Brd2 position at target genes by chromatin immunoprecipitation and characterized its chromatin-binding properties by immunoprecipitation and live-cell microscopy. Finally, we determined Brd2 domains important for chromatin binding and regulation of gene expression.
RESULTS
Brd2 depletion modifies expression of cell-signaling regulators
To identify genes that are regulated by Brd2, we depleted Brd2 from HeLa cells by small interfering RNA (siRNA). siRNA efficiency was tested in stable cell line expressing both endogenous Brd2 and Brd2–green fluorescent protein (GFP; Supplemental Figure S1A; this cell line was further used for chromatin immunoprecipitation experiments; see later discussion). Gene expression changes were monitored on a whole-genome level by Affymetrix exon arrays. Brd2 knockdown affected the transcription of 1453 genes (Figure 1A and Supplemental Table S1). In Brd2-depleted cells 482 genes increased expression and 971 genes decreased expression, indicating that whereas Brd2 is preferentially a positive transcription regulator, it can also efficiently, either directly or indirectly, inhibit transcription of certain genes. Based on Gene Ontology (GO) analysis, Brd2 influences expression of genes that function in regulation of signal transduction (one of the top GO terms, with p = 0.0033; see Figure 1C and Supplemental Table S3), more specifically, genes that are connected with regulation of protein kinase activity (including the mitogen-activated protein kinase cascade) or response to growth factor stimulus. A majority of 24 Gene Ontology terms enriched among Brd2 differentially expressed genes are connected with cell signaling, communication, and differentiation, regulation of cell adhesion, or macromolecule modifications.
FIGURE 1:

Brd2 depletion modifies gene expression and alternative splicing. Brd2 was depleted in HeLa cells by siRNA, and gene expression and alternative splicing changes were monitored by Affymetrix exon arrays. (A) A total of 1458 genes (∼9% of all ∼16,000 genes) altered gene expression upon Brd2 knockdown. Two-thirds of these genes decreased expression (971 genes; 6% of all genes), and one-third increased expression (482 genes; 3% of all genes) after Brd2 depletion. (B) We detected statistically significant changes (FDR = 0.005) in alternative splicing patterns of 289 genes in Brd2-depleted cells compared with cells treated with negative control siRNA. The majority of alternatively spliced genes (55%) also decreased expression after Brd2 knockdown. (C, D) GO analysis of genes whose expression (C) or alternative splicing (D) changed after Brd2 knockdown. (E) Alternative splicing of several genes identified as top hits by microarray was analyzed by RT-PCR. We verified exon inclusion in SENP1, CASP7, and IL17RC mRNA, intron retention in DUSP2, FMNL1, and SLCO4A1 mRNA, and exon skipping in ICMT mRNA after Brd2 knockdown. (F) Comparison of alternative splicing regulation between Brd2 and PTB. Alternative splicing of all three tested genes was regulated by PTB (Llorian et al., 2010). Brd2 and PTB regulate the same cassette exon in ADD1 but different segments in SORBS2 (alternative form regulated by PTB is marked by asterisk). SRPK2 alternative splicing is not affected by Brd2 knockdown. A graphic illustration of microarray data representing the same genomic loci as RT-PCR is shown next to the gels (nontreated cells, gray line; Brd2-depleted cells, black line).
Brd2 was reported to influence cell cycle, particularly the expression of cyclin A, E, and D1 (Denis et al., 2000; Sinha et al., 2005; LeRoy et al., 2008). We confirmed that depletion of Brd2 diminished cyclin D1 expression: cyclin D1 mRNA level decreased by 70%. The expression of the cell cycle regulator p21 also decreased by 60% after Brd2 depletion. p21 transcription is partially controlled by the E2F1 transcription factor, which recognizes E2F1-binding sites in the p21 promoter (Hiyama et al., 1998). Brd2 interacts with E2F1 and activates several E2F1-dependent genes (Denis et al., 2000, 2006; Peng et al., 2007). Thus Brd2 might affect p21 expression via its interaction with E2F1, and an elevated level of p21 could explain why Brd2 delays entry into S phase (Wang et al., 2010). In contrast to p21, p53 expression increased by ∼60% after Brd2 knockdown. In addition, Brd2 depletion down-regulated several proapoptotic proteins: the Fas receptor, caspase 1, caspase 7, caspase 9, and APAF-1 expression all decreased more than twofold in cells lacking Brd2. This result corroborated previous studies reporting an induction of apoptosis in cells overexpressing Brd2 (Zhou et al., 2006; Wang et al., 2010) and suggested a role for Brd2 in the control of apoptosis. Of interest, some of the genes with the most significant changes in expression are linked to cancer development. Tetraspanin 8 (TSPAN8), which was down-regulated more than ninefold in Brd2-depleted cells, is expressed in various carcinomas and promotes formation of metastases (Zöller, 2009; Berthier-Vergnes et al., 2011). The small GTPase Rab27B (down-regulated 4.5-fold) is associated with the presence of metastasis in breast cancer (Hendrix et al., 2010). Moreover, after Brd2 knockdown, transcription of Brd4 declined by almost 75%, whereas Brd3 expression increased by ∼40%, which suggests possible cross-regulation of BET proteins. In addition, the expression of histone genes was enhanced in cells lacking Brd2. Of interest, the BET protein inhibitor I-BET had a similar effect on histone gene transcription (Nicodeme et al., 2010). Brd2 knockdown also modulated expression of genes directly involved in transcription—for example, general transcription factor IIA (GTF2A1), the largest subunit of RNA polymerase I (POLR1A), the largest subunit of RNA polymerase II (POLR2A), TAF2, and cyclin-dependent kinase 9.
Brd2 regulates alternative splicing
Depletion of Brd2 also affected alternative splicing of almost 290 genes (Figure 1B and Supplemental Table S2). The genes that change alternative splicing after Brd2 depletion function mainly in regulation of signal transduction, cell communication, cell–substrate adhesion, or regulation of localization (Figure 1D and Supplemental Table S3). For example, we observed increased exon 7 and intron 8 inclusion in IL17RC mRNA after Brd2 knockdown (IL17RC is a transmembrane receptor with several mRNA splicing variants, which modulate its binding to proinflammatory cytokines; Kuestner et al., 2007) and intron retention in the mRNA of DUSP2 phosphatase, a gene connected with cancer chemoresistance (Lin et al., 2011). We verified an altered alternative splicing pattern of these and several other genes by reverse transcription (RT) PCR (Figure 1, E and F) and confirmed alternative splicing change detected by exon arrays for nine of 14 tested genes. To further test the role of Brd2 in splicing regulation, we analyzed alternative splicing of the same set of genes upon overexpression of Brd2-GFP (Supplemental Figure S1, C and D). Exogenous expression of Brd2-GFP doubled the level of Brd2 protein (Supplemental Figure S1C). In four tested genes (SENP1, ICMT, DUSP2, and SORBS2) we observed opposite alternative splicing compare to Brd2 knockdown (Figure 1, E and F). CASP7 had only one prominent splice variant in control cells (Figure 1E), and therefore we did not expect Brd2 overexpression to change the alternative splicing of this gene. Of interest, the majority of genes that changed alternative splicing patterns after Brd2 knockdown also showed decreased expression (159 of 289 genes). In contrast, only seven genes with modified alternative splicing increased expression. This indicates that Brd2 preferentially influences the alternative splicing of those genes whose transcription it stimulates.
Recently it was shown that the first BD of BrdT preferentially alters expression of RNA-splicing regulators (Berkovits et al., 2012). Thus the effect of Brd2 on alternative splicing could be indirect via modified levels of splicing factors. We checked the expression of 55 well-established alternative splicing regulators (Gabut et al., 2008) after Brd2 depletion in our microarray data. The expression of SR proteins (SRSF1, SRSF2, SRSF3, SRSF4, SRSF5, SRSF6, or SRSF7), main heterogeneous nuclear ribonucleoproteins, or neural polypyrimidine tract–binding proteins was not altered after Brd2 knockdown. We identified five alternative splicing regulators whose expression was changed after Brd2 depletion—PTB, MBNL1/2, RNPS1, and QKI—and compared their targets with 289 genes regulated by Brd2. We did not find any overlap between RNPS1 and Brd2 targets. There was only modest overlap of 30 genes between Brd2 targets and genes regulated by PTB, MBNL1/2, or QKI (Llorian et al., 2010; Hall et al., 2013; Han et al., 2013). However, the effect of QKI on alternative splicing was tested on different cell lines than HeLa cells. We tested three genes (ADD1, SORBS2, and SRPK2) whose alternative splicing was regulated by PTB (Llorian et al., 2010) and analyzed their alternative splicing after Brd2 knockdown (Figure 1F). The cassette exon of ADD1 is regulated by both PTB (Llorian et al., 2010) and Brd2, which was confirmed by RT-PCR. SORBS2 is also regulated by both proteins, but Brd2 influences a different alternative segment than PTB (Llorian et al., 2010). After Brd2 depletion, the Brd2-regulated alternative segment was included, whereas the PTB-regulated alternative segment showed minimal change. Finally, we checked alternative splicing of SRPK2, which is a PTB target, but did not observe any alternative splicing changes after Brd2 depletion. These data suggest that PTB expression change (decrease by 25%) after Brd2 knockdown has only a small effect on alternative splicing. In addition, based on Gene Ontology analysis, we did not find any GO terms associated with RNA binding or processing that were enriched among Brd2 differentially expressed genes. Together these results strongly indicate that Brd2 influences alternative splicing via a mechanism different from changing the expression of PTB or other splicing regulators.
If Brd2 affects alternative splicing directly, it should associate with alternatively spliced genes. Therefore we analyzed Brd2 distribution along alternatively spliced genes by chromatin immunoprecipitation (ChIP). For ChIP we used cells stably expressing Brd2-GFP from a bacterial artificial chromosome (BAC) that preserves the Brd2 endogenous promoter, regulatory elements, and exon/intron structures. Western blot showed comparable amounts of endogenous Brd2 and Brd2-GFP expressed from BAC (Supplemental Figure S1A). We found that Brd2 is enriched at all alternatively spliced genes tested (DUSP2, IL17RC, SLCO4A1, SENP1), similar to the control gene cyclin D1, which is regulated by and associated with Brd2 (LeRoy et al., 2008). In contrast, Brd2 did not accumulate at genes whose splicing was not affected by Brd2 depletion (KREMEN1, RFX2, SMEK2) or at the gene desert loci (region with no annotated gene and presumably no transcription; Figure 2). Brd2 was mainly localized at promoters and not downstream within alternatively spliced genes and the cyclin D1 gene.
FIGURE 2:
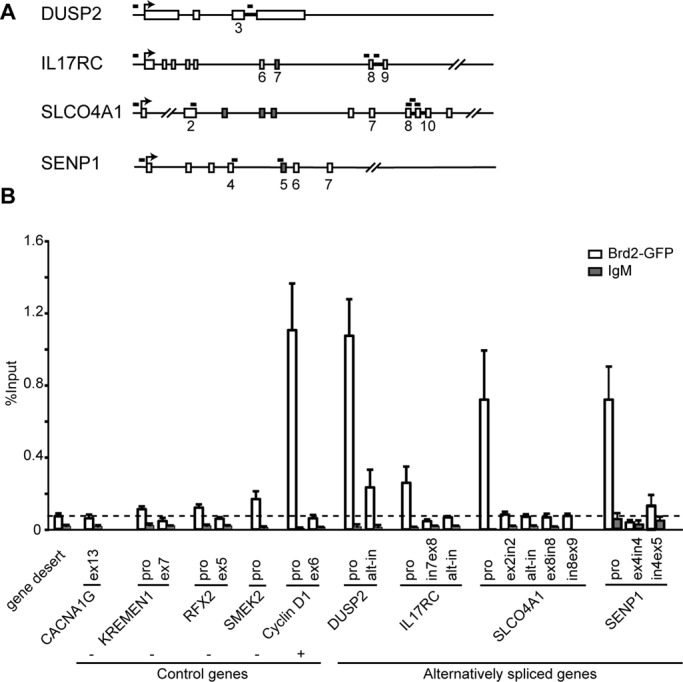
Brd2 is localized at the promoters of alternatively spliced genes. (A) The position of primers in DUSP2, IL17RC, and SLCO4A1 genes, which change the alternative splicing pattern after Brd2 knockdown. Bold line, position of alternative introns (intron retention); gray boxes, alternative exons in these genes. (B) ChIP performed in HeLa cells stably expressing GFP-tagged Brd2 from BAC (the expression of GFP-tagged Brd2 is comparable to the expression of endogenous Brd2; see Supplemental Figure S1A) and highly specific anti-GFP antibody used for ChIP previously (Vermeulen et al., 2010). Brd2 occupancy was high at the promoter of cyclin D1 (positive control gene regulated by Brd2) and at promoters of DUSP2, SENP1, and SLCO4A1 genes, whose alternative splicing pattern is Brd2 dependent. Brd2 was also at the promoter of IL17RC, which changed alternative splicing but showed only partially decreased expression after Brd2 knockdown. The level of Brd2 inside the gene body of cyclin D1, DUSP2, IL17RC, and SLCO4A1 was comparable to the gene desert region (dashed line), where no transcription occurs, and to CACNA1G, KREMEN1, RFX2, and SMEK2 genes, whose expression and alternative splicing are not affected by Brd2 depletion (negative control genes). IgM was used as a nonspecific control antibody. Average of at least three experiments with SEM. alt-in, alternative intron; ex, exon; in, intron; pro, promoter.
Brd2 is important for passage of RNA polymerase II through acetylated chromatin in vitro. It was also shown that transcription rate modulates alternative splicing (Schor et al., 2009; Hnilicova et al., 2011; Oesterreich et al., 2011), which could explain splicing changes induced by Brd2 knockdown. Therefore we tested whether the Brd2 protein affected RNA polymerase II transcription processivity in vivo at alternatively spliced genes. We depleted Brd2 by siRNA and measured RNA polymerase II processivity as a ratio of two pre-mRNA sequences located around alternatively spliced exons or introns (Hnilicova et al., 2011; Supplemental Figure S2). We observed no difference between cells with or without Brd2, suggesting that Brd2 did not control RNA polymerase II passage through chromatin of assayed genes, and alternative splicing changes observed after Brd2 depletion could not be directly connected with changes in transcription elongation rate. However, these data agree with the localization of Brd2 at the promoters and not downstream within alternatively spliced genes (Figure 2). To conclude, Brd2 at the promoter is able to influence alternative splicing without affecting RNA polymerase II processivity downstream in the gene around the alternatively spliced elements.
BDs and the C-terminal domain are important for Brd2–chromatin interaction
Next we sought to determine how Brd2 navigates to target genes. Brd2 primarily binds acetylated histones. Therefore we examined the acetylation state of genes whose alternative splicing is regulated by Brd2 and focused on H4 acetylation of lysines 5, 8, 12, and 16, chromatin marks that are recognized by Brd2. As a positive control, we measured histone H4 acetylation on the cyclin D1 gene. On alternatively spliced genes (DUSP2, IL17RC, SLCO4A1, SENP1) and cyclin D1 we observed increased levels of H4K5ac, H4K8ac, and H4K12ac compared with a gene desert region, indicating that Brd2 could interact with these genes via acetylated histones (Figure 3). However, we noticed similar levels of H4K5/K8/K12/K16 acetylation at control genes (SMEK2, KREMEN1, RFX2, CACNA1G), which are not bound by Brd2 and showed no change in alternative splicing or expression after Brd2 depletion. Thus Brd2 targeting cannot be explained solely by different levels of histone H4 acetylation.
FIGURE 3:

Genes that change alternative splicing after Brd2 depletion do not differ in the level of histone H4 acetylation. The level of histone H4 acetylated at lysines 5, 8, 12, and 16 was monitored by native chromatin immunoprecipitations and quantitative PCR at promoters and inside the genes. At DUSP2, IL17RC, SENP1, and SLCO4A1 we did not detect any increase of particular acetylated lysines in general or specifically around alternatively spliced elements (gray bars) compared with control genes CACNA1G, KREMEN1, RFX2, and SMEK2, whose expression/splicing is not affected by Brd2 depletion or gene desert (an intergenic region on chromosome 10 that is not transcribed). Cyclin D1 is a control gene whose transcription is positively regulated by Brd2. The negative control IgG signal tested at all gene loci was <0.5% of the input and is not shown. Average of at least three experiments with SEM. The dashed line indicates the signal at the gene desert. alt-in, alternative intron; ex, exon; in, intron; pro, promoter.
To get further insight into Brd2 association with chromatin, we prepared several GFP-tagged Brd2 constructs that contained a mutation of a conserved amino acid in BD1, BD2, or both (Figure 4A). These mutations were previously shown to inhibit in vivo and in vitro Brd2 association with acetylated histone H4 (Kanno et al., 2004; Ito et al., 2011). We verified that mutations in both BD1 and BD2 significantly reduced Brd2 binding to histones, and this effect was more pronounced when histone acetylation was elevated through inhibition of histone deacetylases by treatment with sodium butyrate (NaBu; Figure 4B). However, interaction of Brd2-mut1+2 with histones was not completely abolished, and Brd2-mut1+2 was still able to partially interact with acetylated histones (Figure 4B, middle). We also prepared Brd2 mutants that lacked the C-terminal part containing mB and ET domains (Figure 4A). The mB domain was recently shown to self-interact, and the ET domain binds various factors involved in gene expression (Rahman et al., 2011; Garcia-Gutierrez et al., 2012). The deletion of the whole C-terminal domain significantly reduced Brd2 interaction with chromatin (Figure 4B, right), indicating that in addition to bromodomains, the C-terminal domain also directs Brd2 association with chromatin.
FIGURE 4:
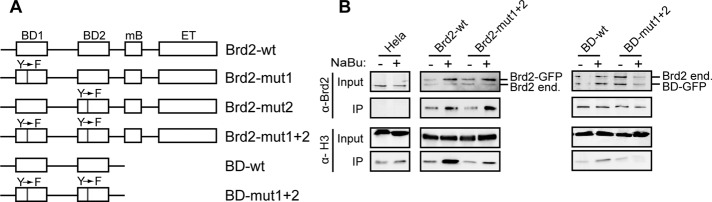
Brd2 BD domains and C-terminal domain are both important for interaction with chromatin. (A) Schematic representation of Brd2 constructs used in this study. All constructs were tagged with GFP at the N-terminus. (B) Interaction of Brd2 bromodomains with histones. Brd2-wt, Brd2-mut1+2, BD-wt, and BD-mut1+2 were tagged with GFP and transiently expressed in HeLa cells. Cells were treated with NaBu for 3 h, Brd2 constructs precipitated with anti-GFP antibodies, and coprecipitated histones detected by anti-H3 antibody. Brd2 does not directly interact with H3; thus coprecipitation of H3 reflects attachment of Brd2 to nucleosomes.
Dynamics of in vivo Brd2 interaction with chromatin
To further characterize the role of individual domains for Brd2 association with chromatin, we decided to use live-cell imaging. This allowed us to measure Brd2 interaction directly in living cells and provided good estimates of the contribution of individual protein domains toward the total chromatin-binding capacity of Brd2. First, we used raster image correlation spectroscopy (RICS), which enables measurement of protein diffusion together with binding when binding is slower than diffusion but not exceeding 20 ms, the maximal detection limit of RICS (Brown et al., 2008). To directly measure the interaction of Brd2 BDs with chromatin, we deleted the C-terminal part involved in the interactions with other chromatin-binding proteins (Figure 5). To determine the effective diffusion of the BD-containing protein, we first expressed the construct containing mutations in both BDs (BD-mut1+2). We monitored movement of BD-mut1+2 by RICS and calculated the spatial autocorrelation function (ACF),  , where I(x, y) and I(x + ξ, y + ψ) are fluorescence intensities in the given pixels of images acquired as a movie with the laser scanning microscope (Digman et al., 2005). The two-dimensional ACF extends along the horizontal and vertical axes. The horizontal cross section of the ACF, G(ξ, 0), reflects faster molecular dynamics, such as diffusion, and the vertical one, G(0, ψ), refers to slower molecular dynamics, and therefore its amplitude is elevated when binding occurs. In nontreated cells, BD-mut1+2 did not exhibit any binding, and its movement in the nucleus perfectly fitted the pure-diffusion model (Eq. 1, Supplemental Materials and Methods), with a diffusion coefficient of 3.17 μm2/s (Figure 5 and Table 1). We applied this fixed diffusion coefficient to fit the BD-wild type (wt) curves with a model accounting for both free diffusion and binding (Eq. 2, Supplemental Materials and Methods). The fit provides binding time and the fractions (diffusing and bound) that contribute to the overall ACF and provide a good estimate of the ratio between bound and diffusing proteins (Table 1). Note that binding time exceeding ∼20 ms cannot be resolved with RICS, yet the fraction holds as long as the binding time does not exceed several seconds. Our data suggest that 60% of BD-wt molecules were freely diffusing and only 40% were immobile with binding times >20 ms. See Eq. 3 in the Supplemental Materials and Methods for a more detailed description.
FIGURE 5:
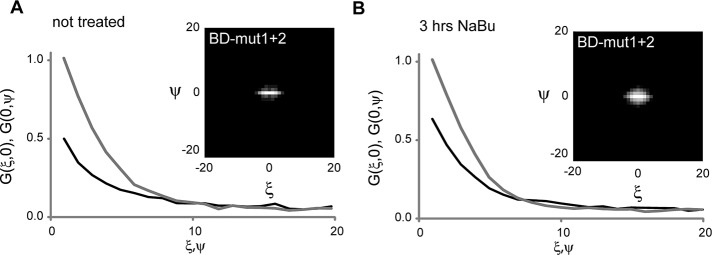
Dynamic behavior of Brd2 bromodomains monitored by RICS. RICS analysis of cells transfected with BD‑mut1+2 before (A) and after (B) 3 h of incubation with 5 mM NaBu. Representative vertical (black) and horizontal (gray) cross sections of the correlation curves are shown with corresponding two-dimensional correlation functions shown as insets. Note the increase of the vertical cross section after sodium butyrate treatment, which indicates stronger interaction with chromatin.
TABLE 1:
RICS analysis.
| Protein | NaBu | D (μm2/s) | Diffusing fraction | Binding time (ms) |
|---|---|---|---|---|
| BD-wt | – | 3.17 | 0.60 ± 0.17 | >20 |
| BD-wt | + | 3.17 | 0.16 ± 0.09 | >20 |
| BD-mut1+2 | – | 3.17 | 1.00 | n.a. |
| BD-mut1+2 | + | 3.17 | 0.68 ± 0.07 | >20 |
The RICS curves of BD-mut1+2 were fitted for pure diffusion and the diffusion coefficient, D, determined. The fraction of diffusing molecules and binding time were then determined for BD-wt and BD-mut1+2 after histone deacetylase inhibition by NaBu.
Next we treated cells with sodium butyrate, a potent inhibitor of human histone deacetylases (HDACs), to increase histone acetylation. First, we confirmed that sodium butyrate increased acetylation of those H4 lysines that are recognized by Brd2 (Supplemental Figure S3). Then we tested whether additional binding sites affected the movement of Brd2. Surprisingly, BD-mut1+2, which did not exhibit binding in nontreated cells, interacted with overacetylated chromatin, as shown by the increased vertical fraction (Figure 5B). Fitting of RICS curves revealed that ∼30% of the mutant was bound to chromatin with interaction times >20 ms. Wild-type BDs associated strongly with overacetylated histones, and 84% were bound to chromatin with interaction times >20 ms. These data show that mutations previously shown to abolish association of Brd2 with acetylated H4 (Kanno et al., 2004) do not completely prevent binding of BDs to acetylated chromatin but instead significantly reduced the BD binding potential. The conserved amino acids thus significantly increase affinity toward acetylated histones and/or stabilize the interaction of BD with acetylated lysine.
The RICS results indicated that BDs associated with chromatin for >20 ms. We previously showed that longer interactions could be detected by fluorescence recovery after photobleaching (FRAP; Huranova et al., 2010). Here we first measured FRAP for BDs containing constructs previously analyzed by RICS, BD-wt and BD-mut1+2 (Figure 6, A and B). The FRAP curves were fitted with a so-called “full model,” which considers both diffusion and binding of the modeled protein (Sprague et al., 2004). BD-wt was properly fitted with the full model with binding time of ∼0.9 s, which was calculated as an inverse value of the koff constant (Table 2). We were not able to properly fit the recovery curve of BD-mut1+2 protein with the full model or the pure diffusion model (unpublished data). We have no explanation for this behavior. Next we treated cells with sodium butyrate to inhibit HDACs and increase histone acetylation and measured FRAP of BD-wt and BD-mut1+2. Individual cells were differently affected by the sodium butyrate treatment, and FRAP curves measured after treatment were more diverse than in the nontreated control as indicated by higher SDs. The BD-wt protein was slowed approximately threefold upon HDAC inhibition, showing that BDs interact with acetylated chromatin (Figure 6A and Table 2). In contrast, BD-mut1+2 did not exhibit any changes in fluorescence recovery upon treatment, and, surprisingly, its recovery was slightly faster than in nontreated cells. The recovery curves of BD-mut1+2 were adequately fitted with the full model and showed a binding time of 250 ms, which is 12.5-fold shorter than for BD-wt (Table 2). However, such a short binding time is close to the limit of FRAP and should be cautiously interpreted. A reasonable explanation for the FRAP and RICS results is that the conserved residues mutated in BD1 and BD2 are important for stabilization of the interaction between BDs and acetylated lysines. RICS can detect even minimal changes in protein binding that occur on such a short time frame that FRAP cannot capture them because of its technical limitations. The two methods thus nicely complement each other and cover a large range of binding time that a single method could not accomplish.
FIGURE 6:

Mutations in both bromodomains abolish stable interaction of Brd2 with acetylated histones. Dynamics of different Brd2 constructs was measured by FRAP before (black line) or after (gray line) histone hyperacetylation. (A) Truncated protein containing both bromodomains interacted with chromatin, but the interaction was abolished by single point mutations in each of the bromodomains (B). (C) The full-length protein associated strongly with acetylated chromatin, and this interaction was inhibited by mutation of both bromodomains (D). (E, F) Mutation of either bromodomain reduced binding affinity of Brd2 to acetylated chromatin. Faster recovery of Brd2-mut1 (E) than Brd2-mut2 (F) after sodium butyrate treatment indicates that BD1 interacts more strongly with acetylated chromatin. FRAP curves represent mean ± SD of 10–15 measurements of cells transiently transfected with indicated construct. Black curves, nontreated cells; gray curves, cells measured after 3 h of 5 mM NaBu treatment. Representative wide-field fluorescence images of transfected cells are shown as insets. Scale bar, 5 μm.
TABLE 2:
FRAP fitting.
| Protein | NaBu | koff (s−1) | Binding time (s) |
|---|---|---|---|
| Brd2-wt | – | 0.62 ± 0.24 | 1.61 ± 0.62 |
| Brd2-wt | + | 0.07 ± 0.09 | 14.29 ± 16.50 |
| Brd2-mut1 | – | 1.22 ± 0.47 | 0.82 ± 0.32 |
| Brd2-mut1 | + | 0.71 ± 0.72 | 1.41 ± 1.43 |
| Brd2-mut2 | – | 1.42 ± 0.70 | 0.70 ± 0.35 |
| Brd2-mut2 | + | 0.15 ± 0.26 | 6.67 ± 11.53 |
| Brd2-mut1+2 | – | 0.77 ± 0.34 | 1.30 ± 0.58 |
| Brd2-mut1+2 | + | 0.64 ± 0.27 | 1.56 ± 0.68 |
| BD-wt | – | 1.07 ± 0.33 | 0.93 ± 0.29 |
| BD-wt | + | 0.32 ± 0.26 | 3.13 ± 2.63 |
| BD-mut1+2 | – | n.a. | n.a. |
| BD-mut1+2 | + | 3.94 ± 2.40 | 0.25 ± 0.15 |
FRAP curves were fitted with the full model and unbinding constant, koff, determined. Binding time was calculated as a reverse value of koff.. From 10 to 15 cells were measured for each construct. Average and SD are shown.
Next we analyzed in vivo dynamics of full-length Brd2 carrying wt BDs (Brd2-wt) or mutated BD1 (Brd2-mut1), BD2 (Brd2-mut2), or both BD domains (Brd2-mut1+2). The Brd2-wt showed slower recovery than the construct lacking the C-terminal part (BD-wt; compare Figure 6, A and C, black lines; Table 2). This result showed that interactions mediated via the C-terminal domains were the major determinant of Brd2 movement in the nucleus of nontreated cells. The full-length Brd2-wt protein significantly slowed upon cell treatment with sodium butyrate and was 4.5-fold slower than BD-wt. This finding demonstrated that the C-terminal part, either directly or indirectly, enhanced interaction of BDs with acetylated histones.
The interaction time of Brd2-wt and the protein with mutations in both BDs (Brd2-mut1+2) showed no significant difference in nontreated cells (Figure 6, C and D), supporting the model in which Brd2 mainly interacts with the nuclear environment via the C-terminal domain. Next we inhibited HDACs and measured FRAP of individual Brd2 constructs. The Brd2-mut1+2 mutant was not affected by histone acetylation level, again showing that mutations of critical amino acids in both BDs abolished the stable interaction of Brd2 with acetylated histones. Mutations in either BD1 or BD2 did not prevent interaction with acetylated histones, as shown by the reduced recovery rate of Brd2-mut1 and Brd2-mut2 after sodium butyrate treatment. Recovery of both mutants was faster than the wild-type protein, indicating that both domains were important for stable Brd2 association with acetylated chromatin. However, treatment with sodium butyrate revealed differences between BD1 and BD2. The binding time of the protein carrying a mutation in BD1 was almost five times shorter than recovery of the BD2 mutant, suggesting that BD1 interaction with acetylated histones is stronger than that of BD2.
In summary, the RICS and FRAP analysis showed that under normal conditions, movement of Brd2 is mainly restricted by interactions mediated via the C-terminal domain. In addition, the C-terminal part also supports association of BDs with acetylated histones. RICS analysis showed that only 40% of BDs are associated with chromatin under normal conditions, and inhibition of HDAC activity increases the bound fraction to 84%. FRAP measurements revealed that the binding time of Brd2 BDs with chromatin is ∼900 ms. Interaction time is prolonged threefold (∼3.1 s) after treatment with the HDAC inhibitor. HDAC inhibition significantly increases histone acetylation, including histone H4 lysines 5, 8, 12, and 16. It is likely that at least some of these acetylation sites will be found at the same histones, creating multiacetylated peptides. The prolonged interaction time after NaBu treatment as measured by FRAP is thus consistent with in vitro data that showed stronger interaction of Brd2 BDs with tetraacetylated peptides than with monoacetylated ones (Filippakopoulos et al., 2012; LeRoy et al., 2012). In addition, BD1 and BD2 interact independently with acetylated histones, and BD1 binding is ∼4.5 times stronger than for BD2. In addition, microscopic data support our previous observations from coimmunoprecipitations and show that the C-terminal domain is important for proper association of Brd2 with chromatin.
Both Brd2 BDs and C-terminal domain are important for transcription and splicing regulation
To test the role of individual Brd2 domains in transcription and alternative splicing regulation, we treated cells with siRNA designed against the sequence within the 3′ untranslated region (UTR) of Brd2 (Supplemental Figure S1B). Depleted endogenous Brd2 was replaced by ectopic expression of wild-type Brd2-GFP, the mutant with both bromodomains mutated, Brd2-mut1+2-GFP, or the mutant lacking the C-terminal domain, BD-GFP. None of the tested constructs contained the 3′UTR, and they were not targeted by the siRNA used in this experiment (see Brd2 mRNA levels in Figure 7C). First we tested whether the full-length protein and the mutants were able to rescue changes in expression induced by Brd2 depletion. We tested three genes (YWAH, SETD7, and HOMER) whose expression increased upon Brd2 knockdown as detected by exon arrays. In all cases, expression of Brd2-wt reduced expression of the genes with respect to cells transfected with GFP only (Figure 7A). In addition, we observed partial rescue in cells transfected with Brd2-mut1+2 or BD-wt, although the effect was smaller than in the case of the full-length protein.
FIGURE 7:
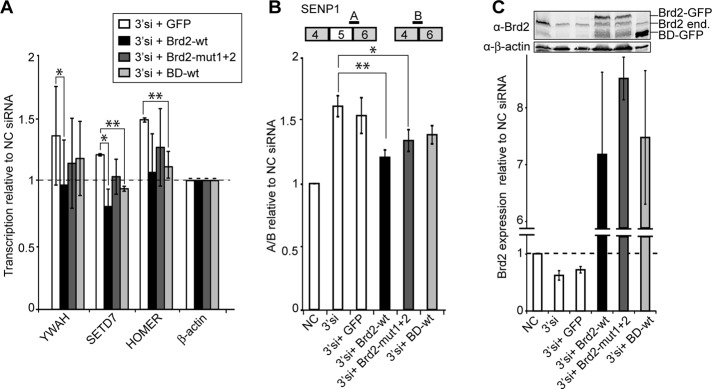
Brd2 BD domains and the C-terminal domain are important for transcription and splicing regulation. (A) Depletion of Brd2 resulted in up-regulation of YWAH, SETD7, and HOMER genes (normalized to β-actin, which did not change expression according to exon arrays). Expression of Brd2-wt rescued depletion of endogenous Brd2. Note also partial rescue in cells expressing the construct lacking the C-terminal domain (BD-wt) and the Brd2-mut1+2, which contained inactivating mutations in both BDs. (B) Treatment with siRNAs against 3′UTR (3′si) stimulated SENP1 alternative exon inclusion. The exon inclusion was reversed by expression of Brd2-wt-GFP (lacking the 3′UTR sequence) but not the empty GFP vector. Alternative exon was partially excluded also in cells expressing Brd2-mut1+2 or BD-wt. Averages of three experiments together with SEM. Significance was assayed by t test. *p ≤ 0.1, **p ≤ 0.05. (C) mRNA and protein levels of Brd2 after siRNA treatment and Brd2 construct transfections. NC, negative control siRNA; 3′si, siRNA against Brd2-3′UTR targeting specifically endogenous Brd2.
Next we tested whether mutant expression was able to revert the change in the splicing pattern of SENP1 caused by reduction of endogenous Brd2. Cells were again treated with siRNA directed against the coding sequence or 3′UTR and the splicing pattern analyzed by RT followed by quantitative PCR (Figure 7B). Expression of Brd2-wt reduced alternative exon inclusion to the level observed in control cells. Expression of either Brd2-mut1+2 or BD-wt partially reverted the splicing phenotype, but the rescue was weaker than in the case of the full-length protein. These data confirmed the specificity of Brd2 knockdown by siRNA (the changes could be rescued by Brd2-wt protein) for several genes identified by exon arrays. In addition, chromatin-binding affinity of individual Brd2 mutants correlated with their ability to rescue gene expression or splicing phenotypes caused by the depletion of endogenous Brd2.
DISCUSSION
Numerous in vitro and in vivo studies have mapped interaction partners of the Brd2 protein. The most significant partners that emerged from these analyses are acetylated histone H4, several transcription factors (e.g., E2F, TAFs, TBP), and chromatin-modifying and -remodeling complexes Brg1, HDACs, and HATs (Denis et al., 2000, 2006; Crowley et al., 2002). Recently the mB motif was shown to self-interact (Garcia-Gutierrez et al., 2012) and the C-terminal ET domain to associate with several proteins, including the main component of the nucleosome remodeling and deacetylase complex, CHD4; histone-lysine N-methyltransferase, NSD3; and hydroxylase and histone demethylase, JMJD6 (Rahman et al., 2011). Here we took an alternative approach and analyzed the dynamics of Brd2 interactions within the cell environment by live-cell imaging. Our live-cell imaging data reveal that the C-terminus containing ET and mB domains is the major factor determining Brd2 interactions in the cell nucleus. In addition, our FRAP data show that the C-terminus also enhances interaction of BDs with acetylated chromatin (Figure 6). The C-terminal domains can modulate interaction of BDs with acetylated histones either directly via intramolecular interactions or indirectly by association with other proteins that interact with chromatin and synergize with Brd2-BDs. In addition, we found no difference in acetylation status between promoters that were or were not occupied by Brd2 (Figures 2 and 3; e.g., compare histone acetylation and Brd2 localization at promoters of KREMEN1 and SLCO4A1). These data further support the model in which Brd2 is not targeted to chromatin solely via BD association with acetylated histones. However, when chromatin is artificially overacetylated, BDs binding to acetylated histones overcomes other interactions and becomes dominant. Together these data suggest that Brd2 is targeted to chromatin via cooperative action of BDs and the C-terminal domain.
Knockdown of Brd2 and unbiased genome-wide analysis of the transcriptome confirmed that Brd2 controls the expression of hundreds of genes, mainly those involved in control of cell signaling. However, the most surprising finding was the change in alternative splicing of numerous genes after Brd2 knockdown. Recent findings show a close connection between histone modification and pre-mRNA splicing (reviewed in Hnilicova and Stanek, 2011; Luco et al., 2011; Braunschweig et al., 2013; Gomez Acuna et al., 2013), but few chromatin-binding proteins, namely MRG15 and CHD1, were shown to influence splicing (Sims et al., 2007; Luco et al., 2010). These proteins recognize H3K36met3 and H3K4met3, modifications shown to couple transcription and splicing (de Almeida et al., 2011; Bieberstein et al., 2012). Histone acetylation is also tightly associated with expression, and we showed that histone H4 acetylation regulates alternative splicing of several hundred genes (Hnilicova et al., 2011). In yeast, histone acetyl transferase Gcn5 genetically interacts with U2 small nuclear ribonucleic protein splicing proteins and is involved in cotranscriptional assembly of the spliceosome (Gunderson and Johnson, 2009). However, a factor that would directly bridge histone acetylation and alternative splicing has not been identified.
Here we show that Brd2 modifies the outcome of alternative splicing. It was reported that another BET protein, Brd4, stimulates constitutive splicing of primary response genes likely via modulating RNA polymerase II C-terminus phosphorylation (Hargreaves et al., 2009). The molecular mechanism of Brd2-mediated splicing regulation is unknown, but we found Brd2 at the promoters of genes it controls. The peak accumulation of Brd2 at promoters was shown genome wide (LeRoy et al., 2012). This correlates with the fact that a half of splicing targets also reduce expression after Brd2 knockdown (Figure 1B). It is likely that when Brd2 (mainly a positive regulator of transcription) is bound to the promoter it stimulates transcription and regulates alternative splicing at the same time. Therefore Brd2 depletion simultaneously reduces expression and changes splicing. This implies that Brd2 influences formation of the initiation complex at the promoter, thereby affecting downstream events like alternative splicing.
The role of promoters in alternative splicing has been shown using minigene reporters, and some transcription activators act on alternative splicing only when tethered to the promoter (Cramer et al., 1997; Monsalve et al., 2000; Auboeuf et al., 2002; Nogues et al., 2002; Robson-Dixon and Garcia-Blanco, 2004; reviewed in Kornblihtt, 2005). In addition, promoter-associated transcription activators affect constitutive splicing and 3′-end processing (Rosonina et al., 2003). However, a molecular mechanism that couples promoters and splicing is unknown, although some indications suggest a role for RNA polymerase II elongation rate and the phosphorylation status of its C-terminal domain (Kadener et al., 2002; Rosonina et al., 2003). Brd2 was shown to facilitate RNA polymerase II passage through acetylated chromatin in vitro (LeRoy et al., 2008). However, our measurements of RNA polymerase II processivity in vivo did not reveal any significant changes upon Brd2 knockdown (Supplemental Figure S2). These data suggest that Brd2 acts via a mechanism different from control of the transcription rate of RNA polymerase II. Recently it was suggested that alternative exons contact promoters in the three-dimensional space of the cell nucleus (Mercer et al., 2013). Proteins bound to promoters are thus in a close contact with alternative elements and can directly regulate their splicing. An alternative link of Brd2 to pre-mRNA splicing is its interaction with the lysyl-hydroxylase JMJD6, which modifies alternative splicing of several minigene reporters. JMJD6 acts on splicing via hydroxylation of the general splicing factor U2AF65 (Webby et al., 2009). Thus Brd2 might recruit JMJD6 to specific genes, where it could modify U2AF65 and regulate splicing outcome.
There is a large amount of evidence that the chromatin status, transcription, and splicing are closely coupled, yet there are only a few factors that would molecularly explain these cross-talks. Here we identified Brd2 as a bridging protein that interacts with chromatin and affects both transcription and alternative splicing. Neurons are cells that are heavily regulated by alternative splicing; changes in alternative splicing of protein important for cell communication could explain the suggested link between Brd2 expression and epilepsy in humans or neuronal phenotypes in the Brd2+/− mouse.
MATERIALS AND METHODS
DNA
Brd2-wt was obtained by cloning human Brd2 cDNA into the pEGFP-C1 vector using EcoRI/KpnI restriction sites. Brd2 mutant constructs were then prepared by site-directed mutagenesis of Brd2-wt. Tyrosine 113 or 386 or both were replaced by phenylalanines in Brd2-mut1, Brd2-mut2, and Brd2-mut1+2, respectively. Bromodomains (corresponding to amino acids 1–472) were isolated by PCR from Brd2-wt and Brd2-mut1+2 and cloned to pEGFP-C1 using EcoRI/KpnI restriction sites, generating BD-wt and BD-mut1+2 constructs, respectively.
RICS measurements
HeLa cells were plated on glass-bottomed Petri dishes. After 20–24 h, cells were transfected with appropriate Brd2 construct using Lipofectamine LTX transfection reagent (Life Technologies, Carlsbad, CA) according to manufacturer's protocol. The cells were imaged 20–24 h after transfection and an additional 3 h if treated with 5 mM sodium butyrate.
RICS was performed as described previously (Norris et al., 2011). Briefly, confocal images for the RICS experiments were acquired on the Olympus FluoView 1000 microscope (Olympus, Tokyo, Japan) equipped with a water immersion objective (60×, 1.2 numerical aperture [NA]). For excitation, a 470-nm diode laser in continuous wave mode was used. The laser intensity measured at the back aperture of the objective was 15 μW. For every RICS experiment, 100 frames consisting of 256 × 256 pixels were collected. The scanner speed along the fast scanning axis was 10 μs/pixel; that along the slow scanning axis was 3.68 ms/line. The scanner step corresponding to 1 pixel was 50 nm. The correlation functions were calculated with use of script created in Matlab by means of fast Fourier transform as described in Hebert et al. (2005). Before the correlation, an average image was calculated from consecutive pairs of images, and the obtained images were pixel-by-pixel subtracted from the individual two images used for the calculation of the particular average image. For data evaluation, two mathematical models were used, a model considering free diffusing proteins in three dimensions (Norris et al., 2011) and a model considering binding (Digman and Gratton, 2009) (see the Supplemental Materials and Methods for detailed description of models used for RICS fitting). In cases in which the two ways of motion occurred simultaneously, a combination of the two models was applied.
FRAP
HeLa cells were prepared the same way as for RICS. FRAP experiments were performed on the DeltaVision microscope system (Applied Precision, Issaquah, WA) equipped with an oil immersion objective (60×, 1.4 NA) and an environmental chamber with controlled temperature (37°C) and CO2 level (5%). Photobleaching of a spot in the nucleoplasm was achieved with a 40-ms laser pulse at 488 nm (100% of the laser power). Fluorescence recovery in a circular spot with a 2-μm radius was monitored in a series of 65 images in a 512 × 512–pixel format until reaching a plateau of recovery or for 5 min. FRAP curves were double normalized to background and whole-cell fluorescence loss during acquisition. From 12 to 15 separate FRAP measurements were performed for each experiment. Normalized FRAP curves were fitted with full model equations according to Sprague et al. (2004) as described previously (Huranova et al., 2010). To reduce the number of fit parameters, we used the diffusion constant determined by RICS and fitted only the parameters describing the rates of binding (kon*) and dissociation (koff). Because kon* also depends on the concentration of binding sites, which could not be easily determined in live cells, only koff values were used to describe the interaction between Brd2 proteins and chromatin.
Cell culture and treatments
HeLa and HeLa cells stably expressing GFP-tagged Brd2 from BAC were cultured in high-glucose DMEM supplemented with 10% fetal calf serum, penicillin, and streptomycin (Invitrogen, Carlsbad, CA) and treated with 5 mM sodium butyrate (Sigma-Aldrich, St. Louis, MO) for 3 or 6 h. Tagging of BAC and preparation of a stable cell line expressing GFP-tagged Brd2 from BAC was performed as previously described (Poser et al., 2008).
Antibodies
Mouse monoclonal antibodies anti-GFP (used for Western blotting) and anti-H4K16ac were from Santa Cruz Biotechnology (Santa Cruz, CA). The polyclonal antibodies specific for acetyl-histone H4, H4K5ac, H4K8ac, H4K12ac, and H4ac were all purchased from Millipore (Billerica, MA). Rabbit anti–β-actin antibody was purchased from Abcam (Cambridge, UK). The anti-tubulin antibody was a gift from Pavel Draber (Institute of Molecular Genetics, Academy of Sciences of the Czech Republic), and the goat anti-GFP antibody used for ChIP was from David Drechsel (Max Planck Institute of Molecular Cell Biology and Genetics). The rabbit anti-Brd2 antibody and nonspecific mouse immunoglobulin G (IgG) and IgM were purchased from Sigma-Aldrich.
Transfections
Preannealed siRNA duplexes (Ambion, Austin, TX) were transfected with Oligofectamine (Invitrogen) according to the manufacturer's protocol, and cells were incubated for 48 h after transfection. In rescue experiments, cells were transfected with the plasmid 24 h after siRNA transfection and incubated for another 24 h. Plasmids were transiently transfected with Lipofectamine LTX & Plus Reagent (Invitrogen) according to the manufacturer's protocol.
RNA isolation, RT PCR, and quantitative PCR
Total RNA was purified with TRIzol (Invitrogen), reverse transcribed using SuperScript III (Invitrogen), and cDNA amplified by Taq polymerase (MBI Fermentas, St. Leon-Rot, Germany). Primers used for RT-PCR and quantitative PCR are listed in the Supplemental Materials and Methods. Quantitative real-time PCR was performed using the LightCycler 480 System (Roche Applied Science, Indianapolis, IN). RNA polymerase II processivity was calculated from relative Ct values of primer pairs A (upstream) and B (downstream) according to pre-mRNA ratiodistal/proximal = 2(CtA – CtB).
Exon arrays
HeLa cells were treated with Brd2-siRNA for 48 h, and total RNA was isolated with TRIzol. For each sample, 1 μg of total RNA was processed, amplified, and labeled according to the Affymetrix GeneChip Whole Transcript (WT) Sense Target Labeling Assay (P/N 701880 Rev. 5) and subsequently hybridized to GeneChip Human Exon 1.0 ST Array (Affymetrix, Santa Clara, CA) as described previously (Hnilicova et al., 2011). The data were analyzed with the Partek Genomics Suite 6.6 beta software (Partek Incorporated, St. Louis, MO) using the RMA (Robust Multi-Array) algorithm. Only probe sets that were present in the “core” meta-probe list (16,037 RefSeq genes and full-length GenBank mRNAs) were used to identify alternative splicing events with Alt-splice analysis of variance. The list of genes undergoing alternative splicing was generated by using alternative splicing p values corresponding to the 0.005 false discovery rate (FDR) criterion as a cutoff. To identify differentially expressed genes, a p of 0.05 FDR was used as a cutoff. The Web-based software tool GOrilla (http://cbl-gorilla.cs.technion.ac.il; Eden et al., 2009) was used to find Gene Ontology terms (Ashburner et al., 2000) for biological process and function enriched in alternatively spliced and differentially expressed genes over the genes from the microarray annotation file as a background. GO terms with FDR-corrected p < 0.05 were considered as significantly enriched and were refined and visualized by ReviGO (Supek et al., 2011). All data are Minimum Information About a Microarray Experiment (MIAME) compliant, and the raw data are deposited in a MIAME-compliant database available at the Gene Expression Omnibus (accession number, GSE39937; www.ncbi.nlm.nih.gov/geo/info/linking.html).
ChIP assays
HeLa cells (treated with Brd2-siRNA for 48 h) were washed with phosphate-buffered saline (PBS) and cross-linked with 1% formaldehyde/PBS for 15 min at room temperature, and the reaction was stopped by the addition of glycine (final concentration, 125 mM). Cells were scraped into RIPA buffer (150 mM NaCl, 1% NP-40, 0.5% deoxycholate, 0.1% SDS, 50 mM Tris-HCl, pH 8.0, 5 mM EDTA, 0.5 mM phenylmethylsulfonyl fluoride, complete protease inhibitor cocktail [Calbiochem, Darmstadt, Germany], 50 mM NaF, and 0.2 mM sodium orthovanadate) and sonicated to generate ∼500-nucleotide chromatin fragments. The same total amount of protein (1 mg) was used for immunoprecipitation. Immunoprecipitation with 12 μg of goat anti-GFP per reaction was performed at 4°C overnight. Subsequently, the beads were rinsed twice with RIPA, four times with 100 mM Tris-HCl, pH 8.5, 500 mM LiCl, 1% Nonidet P-40, and 1% deoxycholic acid, twice again with RIPA, and twice with TE buffer (10 mM Tris-HCl, pH 8.1, and 1 mM EDTA). Protein–DNA complexes were eluted with 1% SDS for 10 min at 65°C, de-cross-linked in the presence of 200 mM NaCl for 5 h at 65°C, and treated with 20 μg of proteinase K for 30 min at 45°C. DNA was recovered with the Qiagen PCR Purification Kit and amplified by quantitative real-time PCR on a LightCycler 480 System (Roche Applied Science). Data sets were normalized to ChIP input values.
Native ChIP assays
HeLa cells were scraped into PBS and resuspended in 0.3 M sucrose, 60 mM KCl, 15 mM NaCl, 5 mM MgCl2, 0.1 mM ethylene glycol tetraacetic acid (EGTA), 0,2% NP-40, 15 mM Tris-HCl, pH 7.7, 0.5 mM dithiothreitol (DTT), complete protease inhibitor cocktail (Calbiochem), and 5 mM NaBu. Nuclei were released by passage through a 22-gauge needle and loaded on a sucrose gradient (1.2 M sucrose, 60 mM KCl, 15 mM NaCl, 5 mM MgCl2, 0.1 mM EGTA, 15 mM Tris-HCl, pH 7.7, 0.5 mM DTT, protease inhibitors, and 5 mM NaBu) and centrifuged for 20 min at 2000 × g at 4°C. Pellets were resuspended in MNase digestion buffer (0.32 M sucrose, 1 mM CaCl2, 4 mM MgCl2, 15 mM Tris-HCl, pH 7.7, and protease inhibitors) and digestion performed for 6 min at 37°C (1 U MNase/30 μg chromatin). Reactions were stopped with EDTA (final concentration, 10 mM) and centrifuged. The supernatant was taken and the pellet resuspended in 0.2 mM EDTA, 1 mM Tris/HCl, pH 7.7, incubated for 1 h at 4°C, and centrifuged again, and both supernatants were mixed. Approximately100 μg chromatin was diluted in nChIP buffer (50 mM NaCl, 5 mM EDTA, 50 mM Tris/HCl, pH 7.7) and incubated overnight at 4°C with appropriate antibody (4 μg of anti-H4K16ac, 10 μg of nonspecific IgG, 6 μl of anti-H4K12ac, and 5 μl of anti-H4K5ac and anti-H4K8ac). The beads were washed once with nChIP buffer, then twice in the same buffer with increasing salt concentration (75, 125, 175 mM NaCl). Complexes were eluted with 1% SDS for 15 min at room temperature and treated with 20 μg of proteinase K for 30 min at 45°C, and DNA was recovered with the Qiagen PCR Purification Kit and quantified by quantitative PCR; the signal was compared with the input.
Immunoprecipitation
HeLa or HeLa-GFP Brd2 cells were grown on 10-cm Petri dishes, washed three times with ice-cold PBS, scraped and pelleted at 1000 × g for 5 min before being resuspended in NET-2 buffer (50 mM Tris/HCl, pH 7.5, 150 mM NaCl, 0.05% Nonidet P-40) supplemented with a complete protease inhibitor cocktail (Calbiochem), and pulse sonicated on ice. Lysates were centrifuged at 13,000 rpm, and the supernatant was incubated with protein G–Sepharose beads (GE Healthcare, Pittsburgh, PA) coated with goat anti-GFP antibodies (raised against bacterially expressed full-length enhanced GFP and obtained from David Drechsel) overnight at 4°C. Captured complexes were extracted by bead incubation in protein sample buffer for 5 min at 95°C, and proteins were detected by Western blotting.
Supplementary Material
Acknowledgments
We thank Tony Hyman from the Max Planck Institute for Molecular Cell Biology and Genetics and Pavel Draber from the Institute of Molecular Genetics, Academy of Sciences of the Czech Republic, for providing reagents. We also thank Kimberly Kotovic for help with editing the manuscript. This work was supported by the Academy of Sciences of the Czech Republic (RVO68378050 and KAN200520801 to D.S.), a Praemium Academie Award (to M.H.), and the Czech Science Foundation (P305/10/0424 to D.S. and P208/12/G016 to J.Hu. and M.H.). J.Hn. was supported by Grant P305/12/G034 from the Czech Science Foundation. I.P. was supported by the European Community's Seventh Framework Program (FP7/2007-2013) under Grant Agreement 241548 (MitoSys Project).
Abbreviations used:
- ACF
spatial autocorrelation function
- BAC
bacterial artificial chromosome
- BD
bromodomain
- BET
bromodomain extra terminal
- ChIP
chromatin immunoprecipitation
- ET
extra terminal
- FRAP
fluorescence recovery after photobleaching
- HDAC
histone deacetylase
- NaBu
sodium butyrate
- RICS
raster image correlation spectroscopy
Footnotes
This article was published online ahead of print in MBoC in Press (http://www.molbiolcell.org/cgi/doi/10.1091/mbc.E13-06-0303) on September 18, 2013.
*These authors contributed equally to this work and should be regarded as joint first authors.
REFERENCES
- Ashburner M, et al. Gene Ontology: tool for the unification of biology. Gene Ontol. 2000;25:25–29. doi: 10.1038/75556. [DOI] [PMC free article] [PubMed] [Google Scholar]
- Auboeuf D, Honig A, Berget SM, O'Malley BW. Coordinate regulation of transcription and splicing by steroid receptor coregulators. Science. 2002;298:416–419. doi: 10.1126/science.1073734. [DOI] [PubMed] [Google Scholar]
- Belkina AC, Denis GV. BET domain co-regulators in obesity, inflammation and cancer. Nat Rev. Cancer. 2012;12:465–477. doi: 10.1038/nrc3256. [DOI] [PMC free article] [PubMed] [Google Scholar]
- Berkovits BD, Wang L, Guarnieri P, Wolgemuth DJ. The testis-specific double bromodomain-containing protein BRDT forms a complex with multiple spliceosome components and is required for mRNA splicing and 3’-UTR truncation in round spermatids. Nucleic Acids Res 40, 7162–7175. 2012. [DOI] [PMC free article] [PubMed]
- Berthier-Vergnes O, Kharbili ME, de la Fouchardière A, Pointecouteau T, Verrando P, Wierinckx A, Lachuer J, Le Naour F, Lamartine J. Gene expression profiles of human melanoma cells with different invasive potential reveal TSPAN8 as a novel mediator of invasion. Br J Cancer. 2011;104:155–165. doi: 10.1038/sj.bjc.6605994. [DOI] [PMC free article] [PubMed] [Google Scholar]
- Bieberstein NI, Oesterreich FC, Straube K, Neugebauer KM. First exon length controls active chromatin signatures and transcription. Cell Rep. 2012;2:62–68. doi: 10.1016/j.celrep.2012.05.019. [DOI] [PubMed] [Google Scholar]
- Braunschweig U, Gueroussov S, Plocik AM, Graveley BR, Blencowe BJ. Dynamic integration of splicing within gene regulatory pathways. Cell. 2013;152:1252–1269. doi: 10.1016/j.cell.2013.02.034. [DOI] [PMC free article] [PubMed] [Google Scholar]
- Brown CM, Dalal RB, Hebert B, Digman MA, Horwitz AR, Gratton E. Raster image correlation spectroscopy (RICS) for measuring fast protein dynamics and concentrations with a commercial laser scanning confocal microscope. J Microsc. 2008;229:78–91. doi: 10.1111/j.1365-2818.2007.01871.x. [DOI] [PMC free article] [PubMed] [Google Scholar]
- Cavalleri GL, et al. A multicenter study of BRD2 as a risk factor for juvenile myoclonic epilepsy. Epilepsia. 2007;48:706–712. doi: 10.1111/j.1528-1167.2007.00977.x. [DOI] [PubMed] [Google Scholar]
- Cramer P, Pesce CG, Baralle FE, Kornblihtt AR. Functional association between promoter structure and transcript alternative splicing. Proc Natl Acad Sci USA. 1997;94:11456–11460. doi: 10.1073/pnas.94.21.11456. [DOI] [PMC free article] [PubMed] [Google Scholar]
- Crowley TE, Kaine EM, Yoshida M, Nandi A, Wolgemuth DJ. Reproductive cycle regulation of nuclear import, euchromatic localization, and association with components of Pol II mediator of a mammalian double-bromodomain protein. Mol Endocrinol. 2002;16:1727–1737. doi: 10.1210/me.2001-0353. [DOI] [PubMed] [Google Scholar]
- Dawson MA, Kouzarides T. Cancer epigenetics: from mechanism to therapy. Cell. 2012;150:12–27. doi: 10.1016/j.cell.2012.06.013. [DOI] [PubMed] [Google Scholar]
- de Almeida SF, et al. Splicing enhances recruitment of methyltransferase HYPB/Setd2 and methylation of histone H3 Lys36. Nat Struct Mol Biol. 2011;18:977–983. doi: 10.1038/nsmb.2123. [DOI] [PubMed] [Google Scholar]
- Denis GV, McComb ME, Faller DV, Sinha A, Romesser PB, Costello CE. Identification of transcription complexes that contain the double bromodomain protein Brd2 and chromatin remodeling machines. J Proteome Res. 2006;5:502–511. doi: 10.1021/pr050430u. [DOI] [PMC free article] [PubMed] [Google Scholar]
- Denis GV, Vaziri C, Guo N, Faller DV. RING3 kinase transactivates promoters of cell cycle regulatory genes through E2F. Cell Growth Differ. 2000;11:417–424. [PMC free article] [PubMed] [Google Scholar]
- Devaiah BN, Lewis BA, Cherman N, Hewitt MC, Albrecht BK, Robey PG, Ozato K, Sims RJ, Singer DS. BRD4 is an atypical kinase that phosphorylates serine2 of the RNA polymerase II carboxy-terminal domain. Proc Natl Acad Sci USA. 2012;109:6927–6932. doi: 10.1073/pnas.1120422109. [DOI] [PMC free article] [PubMed] [Google Scholar]
- Dey A, Chitsaz F, Abbasi A, Misteli T, Ozato K. The double bromodomain protein Brd4 binds to acetylated chromatin during interphase and mitosis. Proc Natl Acad Sci USA. 2003;100:8758–8763. doi: 10.1073/pnas.1433065100. [DOI] [PMC free article] [PubMed] [Google Scholar]
- Dey A, Nishiyama A, Karpova T, McNally J, Ozato K. Brd4 marks select genes on mitotic chromatin and directs postmitotic transcription. Mol Biol Cell. 2009;20:4899–4909. doi: 10.1091/mbc.E09-05-0380. [DOI] [PMC free article] [PubMed] [Google Scholar]
- Digman MA, Brown CM, Sengupta P, Wiseman PW, Horwitz AR, Gratton E. Measuring fast dynamics in solutions and cells with a laser scanning microscope. Biophys J. 2005;89:1317–1327. doi: 10.1529/biophysj.105.062836. [DOI] [PMC free article] [PubMed] [Google Scholar]
- Digman MA, Gratton E. Analysis of diffusion and binding in cells using the RICS approach. Microsc Res Tech. 2009;72:323–332. doi: 10.1002/jemt.20655. [DOI] [PMC free article] [PubMed] [Google Scholar]
- Eden E, Navon R, Steinfeld I, Lipson D, Yakhini Z. GOrilla: a tool for discovery and visualization of enriched GO terms in ranked gene lists. BMC Bioinformat. 2009;10:48. doi: 10.1186/1471-2105-10-48. [DOI] [PMC free article] [PubMed] [Google Scholar]
- Filippakopoulos P, et al. Histone recognition and large-scale structural analysis of the human bromodomain family. Cell. 2012;149:214–231. doi: 10.1016/j.cell.2012.02.013. [DOI] [PMC free article] [PubMed] [Google Scholar]
- Filippakopoulos P, Knapp S. The bromodomain interaction module. FEBS Lett. 2012;586:2692–2704. doi: 10.1016/j.febslet.2012.04.045. [DOI] [PubMed] [Google Scholar]
- Gabut M, Chaudhry S, Blencowe BJ. SnapShot: the splicing regulatory machinery. Cell. 2008;133:192.e1. doi: 10.1016/j.cell.2008.03.010. [DOI] [PubMed] [Google Scholar]
- Gamsjaeger R, Webb SR, Lamonica JM, Billin A, Blobel GA, Mackay JP. Structural basis and specificity of acetylated transcription factor GATA1 recognition by BET family bromodomain protein Brd3. Mol Cell Biol. 2011;31:2632–2640. doi: 10.1128/MCB.05413-11. [DOI] [PMC free article] [PubMed] [Google Scholar]
- Garcia-Gutierrez P, Mundi M, Garcia-Dominguez M. Association of bromodomain BET proteins to the chromatin requires dimerization through the conserved motif B. J Cell Sci 125, 3671–3680. 2012. [DOI] [PubMed]
- Gomez Acuna LI, Fiszbein A, Allo M, Schor IE, Kornblihtt AR. Connections between chromatin signatures and splicing. Wiley interdisciplinary reviews. RNA. 2013;4:77–91. doi: 10.1002/wrna.1142. [DOI] [PubMed] [Google Scholar]
- Gunderson FQ, Johnson TL. Acetylation by the transcriptional coactivator Gcn5 plays a novel role in co-transcriptional spliceosome assembly. PLoS Genet. 2009;5:e1000682. doi: 10.1371/journal.pgen.1000682. [DOI] [PMC free article] [PubMed] [Google Scholar]
- Gyuris A, Donovan DJ, Seymour KA, Lovasco LA, Smilowitz NR, Halperin AL, Klysik JE, Freiman RN. The chromatin-targeting protein Brd2 is required for neural tube closure and embryogenesis. Biochim Biophys Acta. 2009;1789:413–421. doi: 10.1016/j.bbagrm.2009.03.005. [DOI] [PMC free article] [PubMed] [Google Scholar]
- Hall MP, Nagel RJ, Fagg WS, Shiue L, Cline MS, Perriman RJ, Donohue JP, Ares M., Jr Quaking and PTB control overlapping splicing regulatory networks during muscle cell differentiation. RNA. 2013;19:627–638. doi: 10.1261/rna.038422.113. [DOI] [PMC free article] [PubMed] [Google Scholar]
- Han H, et al. MBNL proteins repress ES-cell-specific alternative splicing and reprogramming. Nature. 2013;498:241–245. doi: 10.1038/nature12270. [DOI] [PMC free article] [PubMed] [Google Scholar]
- Hargreaves DC, Horng T, Medzhitov R. Control of inducible gene expression by signal-dependent transcriptional elongation. Cell. 2009;138:129–145. doi: 10.1016/j.cell.2009.05.047. [DOI] [PMC free article] [PubMed] [Google Scholar]
- Hebert B, Costantino S, Wiseman PW. Spatiotemporal image correlation spectroscopy (STICS) theory, verification, and application to protein velocity mapping in living CHO cells. Biophys J. 2005;88:3601–3614. doi: 10.1529/biophysj.104.054874. [DOI] [PMC free article] [PubMed] [Google Scholar]
- Hendrix A, et al. Effect of the secretory small GTPase Rab27B on breast cancer growth, invasion, and metastasis. J Natl Cancer Inst. 2010;102:866–880. doi: 10.1093/jnci/djq153. [DOI] [PMC free article] [PubMed] [Google Scholar]
- Hiyama H, Iavarone A, Reeves SA. Regulation of the cdk inhibitor p21 gene during cell cycle progression is under the control of the transcription factor E2F. Oncogene. 1998;16:1513–1523. doi: 10.1038/sj.onc.1201667. [DOI] [PubMed] [Google Scholar]
- Hnilicova J, Hozeifi S, Duskova E, Icha J, Tomankova T, Stanek D. Histone deacetylase activity modulates alternative splicing. PLoS One. 2011;6:e16727. doi: 10.1371/journal.pone.0016727. [DOI] [PMC free article] [PubMed] [Google Scholar]
- Hnilicova J, Stanek D. Where splicing joins chromatin. Nucleus. 2011;2:182–188. doi: 10.4161/nucl.2.3.15876. [DOI] [PMC free article] [PubMed] [Google Scholar]
- Huang H, Zhang J, Shen W, Wang X, Wu J, Shi Y. Solution structure of the second bromodomain of Brd2 and its specific interaction with acetylated histone tails. BMC Struct Biol. 2007;7:57. doi: 10.1186/1472-6807-7-57. [DOI] [PMC free article] [PubMed] [Google Scholar]
- Huranova M, Ivani I, Benda A, Poser I, Brody Y, Hof M, Shav-Tal Y, Neugebauer KM, Stanek D. The differential interaction of snRNPs with pre-mRNA reveals splicing kinetics in living cells. J Cell Biol. 2010;191:75–86. doi: 10.1083/jcb.201004030. [DOI] [PMC free article] [PubMed] [Google Scholar]
- Ito T, et al. Real-time imaging of histone H4K12-specific acetylation determines the modes of action of histone deacetylase and bromodomain inhibitors. Chem Biol. 2011;18:495–507. doi: 10.1016/j.chembiol.2011.02.009. [DOI] [PubMed] [Google Scholar]
- Jang MK, Mochizuki K, Zhou M, Jeong HS, Brady JN, Ozato K. The bromodomain protein Brd4 is a positive regulatory component of P-TEFb and stimulates RNA polymerase II-dependent transcription. Mol Cell. 2005;19:523–534. doi: 10.1016/j.molcel.2005.06.027. [DOI] [PubMed] [Google Scholar]
- Kadener S, Fededa JP, Rosbash M, Kornblihtt AR. Regulation of alternative splicing by a transcriptional enhancer through RNA pol II elongation. Proc Natl Acad Sci USA. 2002;99:8185–8190. doi: 10.1073/pnas.122246099. [DOI] [PMC free article] [PubMed] [Google Scholar]
- Kanno T, Kanno Y, Siegel RM, Jang MK, Lenardo MJ, Ozato K. Selective recognition of acetylated histones by bromodomain proteins visualized in living cells. Mol Cell. 2004;13:33–43. doi: 10.1016/s1097-2765(03)00482-9. [DOI] [PubMed] [Google Scholar]
- Kornblihtt AR. Promoter usage and alternative splicing. Curr Opin Cell Biol. 2005;17:262–268. doi: 10.1016/j.ceb.2005.04.014. [DOI] [PubMed] [Google Scholar]
- Kuestner RE, et al. Identification of the IL-17 receptor related molecule IL-17RC as the receptor for IL-17F. J Immunol. 2007;179:5462–5473. doi: 10.4049/jimmunol.179.8.5462. [DOI] [PMC free article] [PubMed] [Google Scholar]
- Lamonica JM, et al. Bromodomain protein Brd3 associates with acetylated GATA1 to promote its chromatin occupancy at erythroid target genes. Proc Natl Acad Sci USA. 2011;108:E159–E168. doi: 10.1073/pnas.1102140108. [DOI] [PMC free article] [PubMed] [Google Scholar]
- LeRoy G, Chepelev I, Dimaggio PA, Blanco MA, Zee BM, Zhao K, Garcia BA. Proteo-genomic characterization and mapping of nucleosomes decoded by Brd and HP1 proteins. Genome Biol. 2012;13:R68. doi: 10.1186/gb-2012-13-8-r68. [DOI] [PMC free article] [PubMed] [Google Scholar]
- LeRoy G, Rickards B, Flint SJ. The double bromodomain proteins Brd2 and Brd3 couple histone acetylation to transcription. Mol Cell. 2008;30:51–60. doi: 10.1016/j.molcel.2008.01.018. [DOI] [PMC free article] [PubMed] [Google Scholar]
- Lin SC, Chien CW, Lee JC, Yeh YC, Hsu KF, Lai YY, Tsai SJ. Suppression of dual-specificity phosphatase-2 by hypoxia increases chemoresistance and malignancy in human cancer cells. J Clin Invest. 2011;121:1905–1916. doi: 10.1172/JCI44362. [DOI] [PMC free article] [PubMed] [Google Scholar]
- Llorian M, et al. Position-dependent alternative splicing activity revealed by global profiling of alternative splicing events regulated by PTB. Nat Struct Mol Biol. 2010;17:1114–1123. doi: 10.1038/nsmb.1881. [DOI] [PMC free article] [PubMed] [Google Scholar]
- Luco RF, Allo M, Schor IE, Kornblihtt AR, Misteli T. Epigenetics in alternative pre-mRNA splicing. Cell. 2011;144:16–26. doi: 10.1016/j.cell.2010.11.056. [DOI] [PMC free article] [PubMed] [Google Scholar]
- Luco RF, Pan Q, Tominaga K, Blencowe BJ, Pereira-Smith OM, Misteli T. Regulation of alternative splicing by histone modifications. Science. 2010;327:996–1000. doi: 10.1126/science.1184208. [DOI] [PMC free article] [PubMed] [Google Scholar]
- Mercer TR, et al. DNase I-hypersensitive exons colocalize with promoters and distal regulatory elements. Nat Genet. 2013;45:852–859. doi: 10.1038/ng.2677. [DOI] [PMC free article] [PubMed] [Google Scholar]
- Monsalve M, Wu Z, Adelmant G, Puigserver P, Fan M, Spiegelman BM. Direct coupling of transcription and mRNA processing through the thermogenic coactivator PGC-1. Mol Cell. 2000;6:307–316. doi: 10.1016/s1097-2765(00)00031-9. [DOI] [PubMed] [Google Scholar]
- Nicodeme E, et al. Suppression of inflammation by a synthetic histone mimic. Nature. 2010;468:1119–1123. doi: 10.1038/nature09589. [DOI] [PMC free article] [PubMed] [Google Scholar]
- Nogues G, Kadener S, Cramer P, Bentley D, Kornblihtt AR. Transcriptional activators differ in their abilities to control alternative splicing. J Biol Chem. 2002;277:43110–43114. doi: 10.1074/jbc.M208418200. [DOI] [PubMed] [Google Scholar]
- Norris SC, Humpolickova J, Amler E, Huranova M, Buzgo M, Machan R, Lukas D, Hof M. Raster image correlation spectroscopy as a novel tool to study interactions of macromolecules with nanofiber scaffolds. Acta Biomater. 2011;7:4195–4203. doi: 10.1016/j.actbio.2011.07.012. [DOI] [PubMed] [Google Scholar]
- Oesterreich FC, Bieberstein N, Neugebauer KM. Pause locally, splice globally. Trends Cell Biol. 2011;21:328–335. doi: 10.1016/j.tcb.2011.03.002. [DOI] [PubMed] [Google Scholar]
- Pal DK, Evgrafov OV, Tabares P, Zhang F, Durner M, Greenberg DA. BRD2 (RING3) is a probable major susceptibility gene for common juvenile myoclonic epilepsy. Am J Hum Genet. 2003;73:261–270. doi: 10.1086/377006. [DOI] [PMC free article] [PubMed] [Google Scholar]
- Peng J, Dong W, Chen L, Zou T, Qi Y, Liu Y. Brd2 is a TBP-associated protein and recruits TBP into E2F-1 transcriptional complex in response to serum stimulation. Mol Cell Biochem. 2007;294:45–54. doi: 10.1007/s11010-006-9223-6. [DOI] [PubMed] [Google Scholar]
- Poser I, et al. BAC TransgeneOmics: a high-throughput method for exploration of protein function in mammals. Nat Methods. 2008;5:409–415. doi: 10.1038/nmeth.1199. [DOI] [PMC free article] [PubMed] [Google Scholar]
- Prinjha RK, Witherington J, Lee K. Place your BETs: the therapeutic potential of bromodomains. Trends Pharmacol Sci. 2012;33:146–153. doi: 10.1016/j.tips.2011.12.002. [DOI] [PubMed] [Google Scholar]
- Rahman S, Sowa ME, Ottinger M, Smith JA, Shi Y, Harper JW, Howley PM. The Brd4 extraterminal domain confers transcription activation independent of pTEFb by recruiting multiple proteins, including NSD3. Mol Cell Biol. 2011;31:2641–2652. doi: 10.1128/MCB.01341-10. [DOI] [PMC free article] [PubMed] [Google Scholar]
- Robson-Dixon ND, Garcia-Blanco MA. MAZ elements alter transcription elongation and silencing of the fibroblast growth factor receptor 2 exon IIIb. J Biol Chem. 2004;279:29075–29084. doi: 10.1074/jbc.M312747200. [DOI] [PubMed] [Google Scholar]
- Rosonina E, Bakowski MA, McCracken S, Blencowe BJ. Transcriptional activators control splicing and 3’-end cleavage levels. J Biol Chem. 2003;278:43034–43040. doi: 10.1074/jbc.M307289200. [DOI] [PubMed] [Google Scholar]
- Schor IE, Rascovan N, Pelisch F, Allo M, Kornblihtt AR. Neuronal cell depolarization induces intragenic chromatin modifications affecting NCAM alternative splicing. Proc Natl Acad Sci USA. 2009;106:4325–4330. doi: 10.1073/pnas.0810666106. [DOI] [PMC free article] [PubMed] [Google Scholar]
- Shang E, Wang X, Wen D, Greenberg DA, Wolgemuth DJ. Double bromodomain-containing gene Brd2 is essential for embryonic development in mouse. Dev Dyn. 2009;238:908–917. doi: 10.1002/dvdy.21911. [DOI] [PMC free article] [PubMed] [Google Scholar]
- Sims RJ, 3rd, Millhouse S, Chen CF, Lewis BA, Erdjument-Bromage H, Tempst P, Manley JL, Reinberg D. Recognition of trimethylated histone H3 lysine 4 facilitates the recruitment of transcription postinitiation factors and pre-mRNA splicing. Mol Cell. 2007;28:665–676. doi: 10.1016/j.molcel.2007.11.010. [DOI] [PMC free article] [PubMed] [Google Scholar]
- Sinha A, Faller DV, Denis GV. Bromodomain analysis of Brd2-dependent transcriptional activation of cyclin A. Biochem J. 2005;387:257–269. doi: 10.1042/BJ20041793. [DOI] [PMC free article] [PubMed] [Google Scholar]
- Sprague BL, Pego RL, Stavreva DA, McNally JG. Analysis of binding reactions by fluorescence recovery after photobleaching. Biophys J. 2004;86:3473–3495. doi: 10.1529/biophysj.103.026765. [DOI] [PMC free article] [PubMed] [Google Scholar]
- Supek F, Bosnjak M, Skunca N, Smuc T. REVIGO summarizes and visualizes long lists of gene ontology terms. PLoS One. 2011;6:e21800. doi: 10.1371/journal.pone.0021800. [DOI] [PMC free article] [PubMed] [Google Scholar]
- Umehara T, Nakamura Y, Wakamori M, Ozato K, Yokoyama S, Padmanabhan B. Structural implications for K5/K12-di-acetylated histone H4 recognition by the second bromodomain of BRD2. FEBS Lett. 2010;584:3901–3908. doi: 10.1016/j.febslet.2010.08.013. [DOI] [PMC free article] [PubMed] [Google Scholar]
- Velíšek L, Shang E, Velíšková J, Chachua T, Macchiarulo S, Maglakelidze G, Wolgemuth DJ, Greenberg DA. GABAergic neuron deficit as an idiopathic generalized epilepsy mechanism: the role of BRD2 haploinsufficiency in juvenile myoclonic epilepsy. PLoS One. 2011;6:e23656. doi: 10.1371/journal.pone.0023656. [DOI] [PMC free article] [PubMed] [Google Scholar]
- Vermeulen M, et al. Quantitative interaction proteomics and genome-wide profiling of epigenetic histone marks and their readers. Cell. 2010;142:967–980. doi: 10.1016/j.cell.2010.08.020. [DOI] [PubMed] [Google Scholar]
- Wang F, Liu H, Blanton WP, Belkina A, Lebrasseur NK, Denis GV. Brd2 disruption in mice causes severe obesity without type 2 diabetes. Biochem J. 2010;425:71–83. doi: 10.1042/BJ20090928. [DOI] [PMC free article] [PubMed] [Google Scholar]
- Webby CJ, et al. Jmjd6 catalyses lysyl-hydroxylation of U2AF65, a protein associated with RNA splicing. Science. 2009;325:90–93. doi: 10.1126/science.1175865. [DOI] [PubMed] [Google Scholar]
- Yang Z, Yik JH, Chen R, He N, Jang MK, Ozato K, Zhou Q. Recruitment of P-TEFb for stimulation of transcriptional elongation by the bromodomain protein Brd4. Mol Cell. 2005;19:535–545. doi: 10.1016/j.molcel.2005.06.029. [DOI] [PubMed] [Google Scholar]
- Zhao R, Nakamura T, Fu Y, Lazar Z, Spector DL. Gene bookmarking accelerates the kinetics of post-mitotic transcriptional re-activation. Nat Cell Biol. 2011;13:1295–1304. doi: 10.1038/ncb2341. [DOI] [PMC free article] [PubMed] [Google Scholar]
- Zhou M, et al. BRD2 is one of BRD7-interacting proteins and its over-expression could initiate apoptosis. Mol Cell Biochem. 2006;292:205–212. doi: 10.1007/s11010-006-9233-4. [DOI] [PubMed] [Google Scholar]
- Zöller M. Tetraspanins: push and pull in suppressing and promoting metastasis. Nat Rev Canc. 2009;9:40–55. doi: 10.1038/nrc2543. [DOI] [PubMed] [Google Scholar]
Associated Data
This section collects any data citations, data availability statements, or supplementary materials included in this article.