Abstract
One strategy for reaching the downhill folding regime, primarily exploited for the λ6–85 protein fragment, consists of cumulatively introducing mutations that speed up folding. This is an experimentally demanding process where chemical intuition usually serves as a guide for the choice of amino acid residues to mutate. Such an approach can be aided by computational methods that screen for protein engineering hot spots. Here we present one such method that involves sampling the energy landscape of the pseudo-wild-type protein and investigating the effect of point mutations on this landscape. Using a novel metric for the cooperativity, we identify those residues leading to the least cooperative folding. The folding dynamics of the selected mutants are then directly characterized and the differences in the kinetics are analyzed within a Markov-state model framework. Although the method is general, here we present results for a coarse-grained topology-based simulation model of λ-repressor, whose barrier is reduced from an initial value of ∼4kBT at the midpoint to ∼1kBT, thereby reaching the downhill folding regime.
Introduction
Energy landscape theory predicts different scenarios for protein folding.1 In the case of two-state folding, the equilibrium distribution is dominated by only two species (the folded and unfolded states) separated by large free-energy barriers.2 Single-molecule experiments are only now starting to shed some light on the transition paths between these states.3 However, in bulk the low population of any species intermediate between the native and unfolded forms in the case of two-state folding results in all of the information about the mechanism being effectively hidden. Conversely, in the downhill folding scenario, where free-energy barriers are comparable to the thermal energy (kBT), a myriad of possible structures between the denatured and native states can be populated as the reaction progresses.4 Hence studies on downhill folding can reveal the details of the conformational motions of the polypeptide chain en route to the native state.5
One of the experimental approaches used to reach the downhill regime, first applied to the 80-residue amino-terminal λ-repressor (fragment λ6–85) and later to the Pin WW domain, consists of engineering the protein by introducing rate-enhancing mutations.6−13 In the seminal fluorescence temperature-jump experiments by Yang and Gruebele on λ-repressor, this resulted in the emergence of a faster kinetic phase.6 This new phase was interpreted as the downhill relaxation from a vanishing barrier top, related to the so-called folding “speed limit”.14 A large range of other mutants have been studied that exhibit differences in both the stability and the rates and amplitudes of this molecular phase. Mutations have been introduced on the basis of needing a fluorescence probe for folding,15 altering helix propensity in the helices,13,16 removing specific interactions,17 or reducing backbone flexibility.7 Still, the experimentally intensive work of designing and expressing protein mutants is to some extent based on chemical intuition. Computational screening methods can be of great help in designing mutations in a systematic way.
Here we present one such approach that we apply to a simple simulation model for λ-repressor. Contrary to most existing methods, the focus here is in engineering the folding cooperativity and dynamics instead of modulating protein stability.18−24 The outline of the method is as follows. For a given reference system we run dynamics simulations that sample both the folded and unfolded states. Assuming that the distribution of states on a reaction coordinate is approximately bimodal at the midpoint (at least, initially), we use the proximity of the two peaks, relative to their broadness, as an indication of cooperativity. We then estimate the effects on this metric arising from mutation of each individual amino acid residue. This description is in the spirit of the “cooperative response” defined by Freire and coworkers.25 Finally, the results are confirmed by running simulations on a selected mutant and independently assessing the changes in the dynamics using a Markov state model (MSM), which does not rely on the reaction coordinate used in the engineering step.26 For computational tractability, we use as our reference a coarse-grained, topology-based simulation model of λ-repressor. Using our approach, we engineer the folding from being barrier-limited under midpoint conditions to downhill. This allows us to identify a new hot spot that, in the context of the simple model, will maximally disrupt the cooperativity of folding. The approach that we present is general and can be used to modulate barriers in either direction.
Methods
Approach to Protein Engineering
In Figure 1a, we present the general workflow for our method. An experimental PDB structure file with the coordinates of the protein atoms is the only input and is used to generate a coarse-grained, structure-based (Go̅) model for the protein.27 The energy landscape of this reference model is sampled via molecular dynamics (or Monte Carlo) simulation, and the resulting trajectories projected onto a suitable reaction coordinate x. Although, for our simulation model, we use the fraction of native contacts (Q) as a progress variable, for more complicated models the reaction coordinate can be variationally optimized.28,29 Using the distribution of values of x for both the native (N) and unfolded (U) states at the midpoint temperature (Tm), we define a cooperativity metric
| 1 |
where ⟨x⟩N and VarN(x) are, respectively, the mean and variance of x computed over the native state and similarly for the unfolded state. Intuitively it is easy to see that upon a decrease in the free-energy barriers the mean values of x for N and U will get closer to each other and their distributions will become broader (Figure 1b). Hence, the lower the barrier the lower the value of χ. In our method, we predict the changes in this metric upon point mutations, which are systematically introduced for every amino acid residue independently. On the basis of these results, interesting mutants are selected, in this case those with low values of χ. The folding dynamics of these mutants are sampled by running new simulations, and the effect of the mutations on the dynamics is assessed by using an MSM. The advantage of the MSM is that it does not rely on the projection on an order parameter,26 and hence it allows an independent assessment of the effect of the mutation on the dynamics. The procedure can be run iteratively to introduce cumulative mutational effects.
Figure 1.
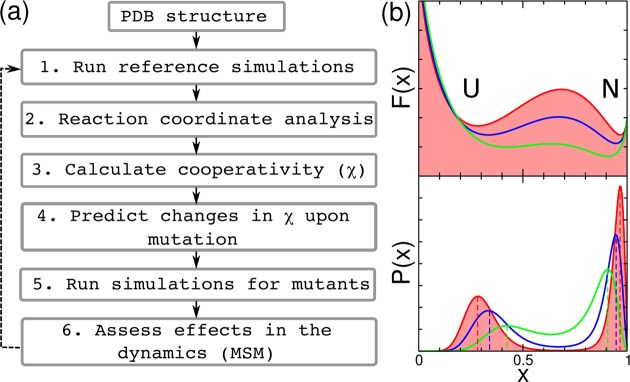
(a) Flowchart with the steps involved in the protein engineering method. (b) Theoretical free energy surfaces (top) and probability distributions (bottom) as a function of an order parameter x under midpoint conditions. We show illustrative examples corresponding to the shift from bimodal (two-state, red) to downhill (green) folding. U and N are the unfolded and native states respectively, and the dashed lines mark the mean values ⟨x⟩U/N of the order parameter for the unfolded and native states.
Coarse-Grained Go̅ Model Simulations
We use a protein model coarse-grained to a single bead per amino acid residue located at the Cα atom.27 We construct the model using the experimental X-ray structure of the λ-repressor mutant λYA (3kz3,12 see Figure 2a). The potential-energy function is a sum of harmonic terms for bonds and angles, a statistical potential for the pseudodihedrals, and terms for nonbonded interactions.27 Favorable nonbonded interactions are limited to residue pairs that are in contact in the reference structure (shown in the contact map of Figure 2b). For one such pair of residues (i,j) the interaction energy is defined as
 |
2 |
where rij is the distance between Cα atoms in the instantaneous conformation, σij is the same distance in the reference structure, and εij is the residue-pair specific interaction energy,27 taken from the Miyazawa–Jernigan matrix of contact energies.30
Figure 2.
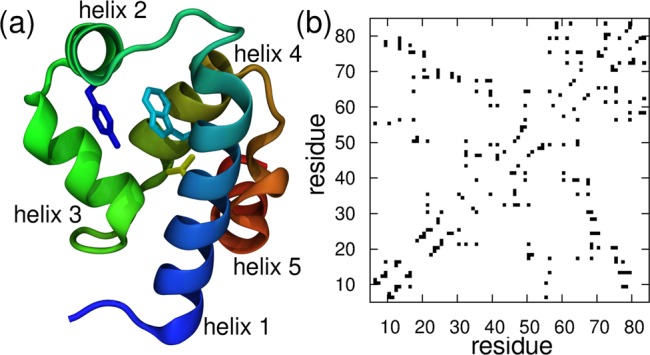
(a) Cartoon representation of the experimental structure of the YA mutant of the λ6–85 protein fragment (3kz3). We show the heavy atoms of the experimental fluorescent probe W22 (cyan), Y33 (blue), and the L18 residue (yellow). (b) Contact map for the λYA mutant including all native interaction pairs, as defined in the structure-based model.
We run simulations of the Go̅ model using a modified version of the Gromacs simulation package (version 4.0.531). To propagate the dynamics based on the Langevin equation, we use a leapfrog stochastic integrator with a time step of 10 fs. The external friction coefficient was set to 0.1 ps–1. Bond constraints were imposed using LINCS.32 For each protein model, simulations were run at multiple temperatures. The simulation data were projected onto suitable order parameters, mainly the root-mean-square deviation (RMSD) and the fraction of native contacts (Q). The data from simulations at different temperatures were then combined using the weighted histogram analysis method (WHAM).33 Error bars were calculated from block averaging.
Computational Protein Engineering
To determine the contribution that different residues make to the folding cooperativity, for each mutated residue we reduce the strength of its native interactions (those defined in the contact map, Figure 2b) by a given amount (see the Results and Discussion). For each of the mutants we calculate the values of ⟨Q⟩N and ⟨Q⟩U that appear in eq 1 by reweighting
| 3 |
where the average is computed over all of the saved configurations from the reference simulations that are in state S ∈ {U,N}. In eq 3, ΔE is the difference in the energy between the reference simulation and the mutant, Emut = Eref + ΔE. The values of the variance VarS(Q) are calculated analogously because VarS(Q) = ⟨Q2⟩s – ⟨Q⟩s2. To restrict these averages to U or N, we set a dividing line between these states to Q = 0.55, which approximately corresponds to the maximum in the free-energy barrier for the Go̅ models (see the Results and Discussion). The reweighting approach used here is exact for exhaustive sampling. We check the accuracy of this calculation by estimating ⟨Q⟩ and Var(Q) from the first and second moments of the probability distribution P(Q) obtained from WHAM (see Supporting Information (SI), Figure S1).
Markov-State Model
To assess the effects of the dynamics in an independent way, we use an MSM methodology.34,35 We assume that the dynamics of the system can be described as a discrete-time Markov process using the transition matrix T(Δt). The elements Tji of this matrix are the probabilities that being in microstate i the system will be found in microstate j after a lag time Δt. The dynamics of the system can then be expressed using the discrete-time analog of the continuous-time master equation26
| 4 |
where the column-vector p(kΔt) contains the populations of each microstate at time kΔt. We calculate the elements of T using the maximum-likelihood estimator36
| 5 |
where N(Δt) = (N)ji is the transition count matrix that we obtain directly from the discretized simulation trajectories (see later). We compute equilibrium populations from the right eigenvector of the stationary mode of the transition matrix (ψ0R) and relaxation times τi from its eigenvalues λi as τi = −Δt/ln λi. Errors in these quantities are obtained using a bootstrap method.37
Discretization, Data Clustering, and Assignment of Transitions
Here we define the microstate space using information from the native contacts alone by first discretizing the conformations into strings and then clustering the strings into microstates. The native contact map discretization is adequate for a Go̅ model, as stable non-native interactions cannot be formed; however, the process can be generalized to other systems by considering the full contact matrix, including non-native interactions. A recent study has found contact-map-based Markov models to be more robust than RMSD-based ones.38
Discretization
In the same spirit as previous Ising-like models for protein folding,39,40 we discretize the simulation data assuming that each of the contacts has two possibilities: either being formed (1) or not (0). Hence, for a protein with N native contacts, there are a total of 2N possible strings of zeros and ones, each corresponding to a contact map. In principle, this discretization would rapidly become intractable for even a small number of contacts. However, for λ-repressor (with a total of 115 contacts in the contact map, see Figure 2b), we find that in practice very few states are populated due to the limited length of the simulation runs. (Out of more than 4 × 1034 possibilities, ∼34 788 different strings were visited in the 40 000 frames saved during a 4 μs simulation time of λYA at the midpoint.)
Clustering into Microstates
The discretized trajectory is then clustered using a K-medoids algorithm.41 Instead of randomly initializing the cluster centers, we take advantage of the dynamics trajectory, where contiguous snapshots will usually belong in the same energy basin. We sequentially assign the time series of strings to an existing cluster when the Hamming distance42 between the instantaneous string conformation and the cluster center is shorter than a certain cutoff. If the Hamming distances to the centers of several existing clusters are below the cutoff, the lowest is chosen. After all the conformations have been assigned sequentially and the initial clustering has been generated, we optimize it by reading the strings from the trajectory in a randomized order and checking the assignment of each individual string to the clusters. The cluster centers are updated in the event that a string is added, which is more central within the cluster than the existing cluster center. The procedure is repeated until no strings are reassigned in a randomized parsing of the trajectory. We find that this procedure is very efficient in generating structurally meaningful clusters as the initial assignment already produces a very good first guess.
The final number of clusters depends on the value of the Hamming distance cutoff, with lower values resulting in a higher number of clusters. A low cutoff is, in principle, desirable to produce finely resolved clusters. However, we find that the fraction of the simulation data accounted for by the frequently visited clusters, here defined as those visited for an aggregate simulation time of at least 10 ns, is reduced with decreasing cutoffs. We therefore choose a Hamming distance cutoff as a compromise between resolving multiple clusters in both the unfolded and native states and maximizing the number of trajectory frames included in the frequently visited clusters.
Assignment
Transitions between microstates for the construction of the master equation model are calculated directly. A transition between microstate i and j is assigned every time that the simulation jumps from one frequently visited cluster to another after a certain lag time Δt. When the trajectory reaches an infrequently visited cluster j, we consider that it remains in the initial microstate i. This procedure produces less accurate kinetics than transition-based assignment,43 but in this case it allows us to capture the qualitative differences between the different models.
Results and Discussion
Folding of the λYA Model Is Barrier-Limited at the Midpoint
We start by analyzing the simulations of the coarse-grained topology-based model of the λ-repressor. We use the experimental structure of the λYA mutant (see Methods) that differs from the wild type (WT) by only four internal amino acid residues (92.5% sequence identity) and that is also very similar structurally (RMSD = 0.7 Å). We choose this structure as λYA has been proposed to fold downhill under native conditions and to have a small (>3 kBT) barrier at its Tm. Also, it was crystallized as a shorter sequence than the WT and in the absence of DNA, which makes it a closer match to the experimental construct.12,44
From the projection of our Go̅ model simulation trajectories on the fraction of native contacts (Q), we find primarily two interconverting states under midpoint conditions (Figure 3a). The potentials of mean force for the λYA mutant (Figure 3c) indicate that the protein folds downhill under native conditions and is barrier-limited at the simulation midpoint (Tm ≃ 310 K), consistent with the experimental results.10 On the basis of the projection on Q, the barrier is 2.3 kcal/mol at the midpoint (i.e., ΔGU† = 3.7kBT), in agreement with results by Gruebele and coworkers.12 We also observe a sparsely populated intermediate state on the folded side of the dominant barrier (Q ≃ 0.7), with helix 5 slightly detached from the protein core. This substate has been described before in coarse-grained45 and implicit solvent simulations.16 Additional support for its presence comes from explicit solvent simulations, where many contacts that involve helix 5 form late in transition paths,46 the low helical propensity predicted by AGADIR,47,7 and the high B factors.12 We note that we have also found this state to appear when the WT structure is used to construct the Go̅ model, making this a robust prediction.
Figure 3.
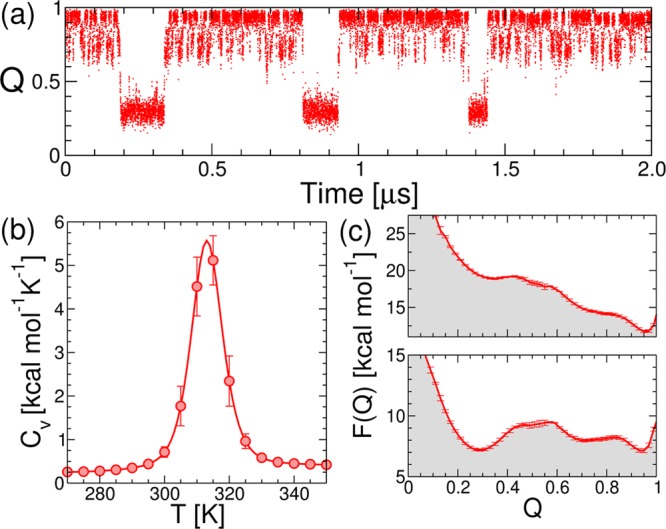
(a) Time series for the projection of the simulation trajectory for λYA on the fraction of native contacts (Q) at 310 K. (b) Heat capacity thermogram calculated from WHAM. (c) Potentials of mean force at native (top) and midpoint (bottom) conditions.
Identification of Hot Spots for Protein Engineering
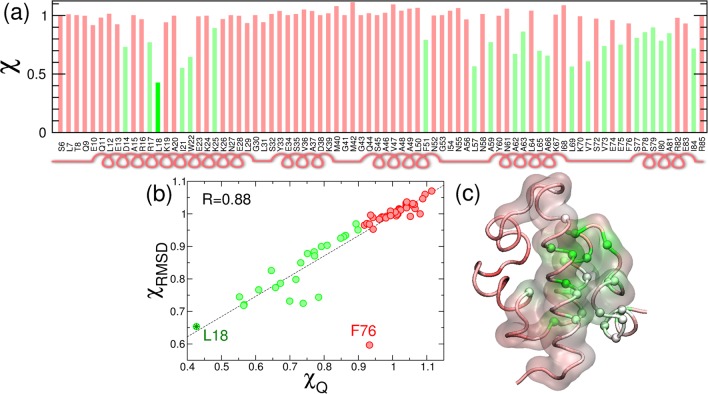
In the context of the simple Go̅ model a natural way of simulating mutations is just scaling the contact energies εij in eq 2. For this scaling, we choose a value of 0.5 (i.e., scaling by half the contact strength of every contact made by the mutated amino acid residue) to calculate the cooperativity metric χ. This type of conservative mutation, corresponding to a small decrease in the strength of the interactions formed by the selected residue, is likely to destabilize the folded state;48 the effect is similar to the small perturbations used in experimental ϕ-value analysis49 rather than the disruptive effects that might arise from introducing a more bulky or charged group. In Figure 4, we show the resulting values of χ of each of the “single-point mutants” normalized by the value for λYA, which are generally very close to that for the reference simulation, suggesting very small changes in the cooperativity. The robustness to mutations is in agreement with a number of studies that suggest that cooperativity and free-energy barriers are carefully selected features of protein-energy landscapes.50,51 However, there are a number of cooperativity hot spots that, according to this calculation, can reduce the folding cooperativity (shown in green in Figure 4a).
Figure 4.
(a) Normalized value of the cooperativity metric χ from the native contacts Q upon a single-point mutation for every amino acid residue in the λYA sequence. Values under a threshold of 0.9 are shown in green. Secondary structure is shown schematically under the sequence. (b) Correlation between χ calculated from Q and χ calculated from the RMSD from native.(c) Cartoon of the structure of λ-repressor with color code indicating the value of χ. The color scale goes from high (red) to low (green) χ. Spheres are shown for the residues with >10% decrease in χ. The transparent surface envelops the residues identified by Gruebele and coworkers to be the folding core of the protein (see text).
To calculate the cooperativity metric χ, we are relying on the adequacy of Q as a reaction coordinate, but the results could be different for alternative progress parameters for the folding reaction.29 In Figure 4b, we compare the estimates of the cooperativity metric from the fraction of native contacts (χQ) and the RMSD (χRMSD). We find that the agreement between the two estimates is extremely good, with a Pearson correlation coefficient of R = 0.88, that increases to 0.97 if we remove the outlier F76. The high χQ and low χRMSD for this mutation point to a deviation from the expected behavior of the mutational approach (i.e., the model probability distributions from Figure 1b). For F76, the mutation results in a population shift from the native to the intermediate, which differently affects the estimates of ⟨Q⟩ and Var(Q) from different reaction coordinates (see SI, Figure S2). It is therefore advisable to examine the distributions that are used to calculate χ, as this will allow one to spot possible deviations from the expected behavior. Although alternative descriptions of χ, for example, based on the cooperativity parameter Ωc52 or the calorimetric criterion,53 may be able to overcome this limitation, we do not pursue them here.
We also analyze the distribution of χ values in the 3-D structure of the λ-repressor (Figure 4c). A number of hot spots cluster around a central core formed by helices 1 and 4 and the turns between helices 3–4 and 4–5. This indicates that the network of contacts formed by these residues is the most sensitive part of the protein for folding cooperativity. The cluster of hot spots that we identify is in remarkable agreement with the region that Gruebele and coworkers have expressed in the construct λblue1, consisting of the two-helix bundle formed by helices 1 and 4 connected by linkers. They found that λblue1 folds with similar Tm and rates as the λ6–85 fragment, indicating that this region comprises the minimal folding core of the protein.54 Looking at the predicted values of our cooperativity metric, we find that out of the 23 residues with more than a 10% decrease in χ, 18 are within the cooperative core proposed by Gruebele and coworkers (Figure 4c). Although our results also agree with some of the experimental mutations (e.g., Asp14), in other cases our simple method for changing the energetics fails to predict changes in the barriers derived from analysis of T-jump experiments, indicating that a more detailed energy function will be needed for quantitatively reproducing changes in Tm values and free-energy barriers. Our method, however, is a powerful tool for making approximate predictions that can direct mutational analysis from experimentalists.
We focus on the Leu18 single-point mutant, which according to our calculation would produce the greatest decrease in χ. (See Figure 4a,b.) To test this prediction, we run simulations of the Go̅ model where we scale the εij of the L18 contacts by 0.5 (L18×0.5) and where we remove the contact altogether (L18×0), leaving only an excluded volume term. In the projection on Q we see that transitions between the folded and unfolded states are much faster for the L18×0.5 mutant and become entirely diffusive for L18×0. (See Figure 5a.) From the WHAM analysis of the simulations, we confirm the results of our prediction: upon mutation, the heat-capacity curves become considerably broader, a characteristic signature of the reduction of the cooperativity55 (Figure 5b). Also, potentials of mean force on Q reveal a decrease in the midpoint free-energy barrier from 3.7 kBT (λYA) to 1.4 kBT (L18×0), making the full mutant an apparent downhill folder, at least according to this projection (Figure 5c). The differences in the free-energy barriers are due to small changes in both the enthalpic and entropic contributions to the free energy (see SI, Figure S3).
Figure 5.
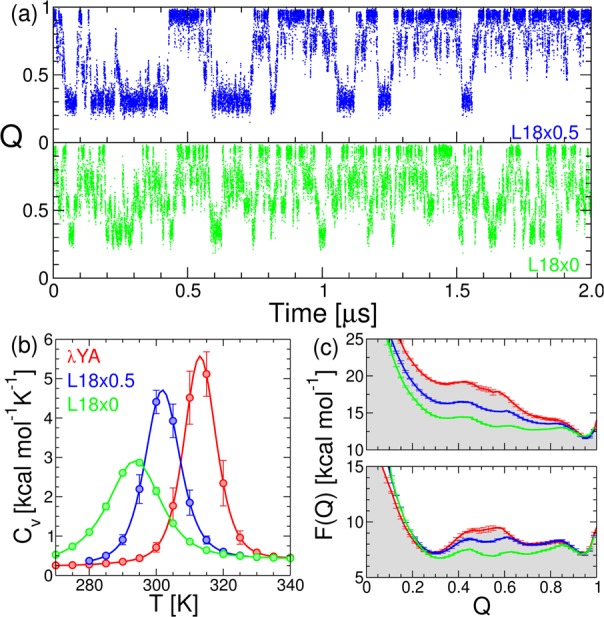
Time series for the projection of the simulation trajectory for the λYA mutants L18×0.5 (blue) and L18×0 (green) on the fraction of native contacts (Q) at their midpoint temperatures. (b) Heat capacity thermograms calculated from WHAM for the mutants. (c) Potentials of mean force under native (top) and midpoint (bottom) conditions. We show the results for the WT (red) for reference.
Dynamics of the Model Mutants from a Markov State Model
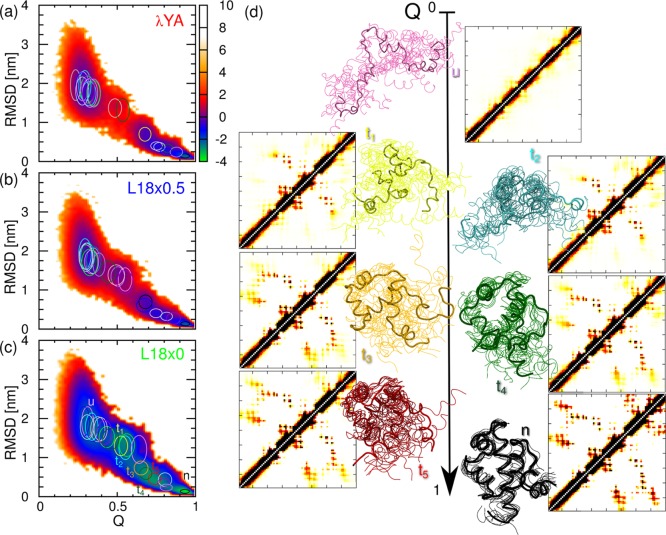
The reduction of the free-energy barriers we observe could be due to the choice of a suboptimal progress coordinate for folding. To assess the effect on the dynamics independently of the projection on Q, we construct a transition network from the discretized simulation trajectory (see the Methods). The K-medoids algorithm results in 21 to 23 clusters, accounting for 89–93% of the total simulation time. In Figure 6. we show the clusters represented by the mean and standard deviation of the values of Q and RMSD of the corresponding conformations. When overlaid on the potential of mean force, the clusters appear reasonably well-separated, particularly for the intermediate to high values of Q. It is important to note that while for λYA there is a gap between clusters on the folded and unfolded sides of the barrier (Q ≃ 0.55), for the L18×0 mutant such a gap does not exist as a result of the non-negligible population in the barrier region. (See Figure 6c.) In Figure 6d, we show snapshots corresponding to the seven most populated clusters for the L18×0 mutant, including folded (n) and unfolded (u) clusters and multiple clusters in the transition region (t). Some of the clusters look quite structurally diverse. However, this is natural because we have used the native contact-map for the clustering. The average contact maps clearly indicate the structure formation events that are taking place en route to folding.
Figure 6.
Potentials of mean force (in kcal/mol) for Q and the RMSD to native for the different models for λ-repressor: λYA (a), L18×0.5 (b), and L18×0 (c). In each case, we overlay ellipsoids centered at the average RMSD and Q values for the cluster with principal axes of one standard deviation. (d) Snapshots and average contact maps for the seven most populated clusters for the L18×0 model, with the same color code and names as those in panel c.
We construct the MSM for the three different models with a lag time Δt = 1 ns, for which eigenvalues are approximately converged, as required for Markovian dynamics (not shown). We analyze the relaxation times, τi, that we calculate from the eigenvalues of the transition matrix, T. (See Figure 7a.) The slowest mode is about one order of magnitude slower for the λYA than it is for the L18×0 mutant, with the L18×0.5 mutant being somewhere in between. According to the sign structure of the right eigenvectors ψ1R, this mode in fact corresponds to exchange between high Q and low Q microstates (i.e., folding, see Figure 7b). Hence the speedup in τ1 is consistent with the reduction in the free-energy barrier in the projection on Q. Also, for the two mutants we find a reduction of the gap between the first and second slowest modes, a characteristic feature of downhill folding.56 Interestingly, the next few modes appear at very similar values of the relaxation time for all three models, although they correspond to substantially different processes. For example, in the case of the λYA, the second mode ψ2 corresponds to the exchange of the native cluster with the helix-detached intermediate, while for the mutants a more diverse set of configurations is involved, including clusters that in the two-state case would be at the top of the barrier (Q ≃ 0.55, see Figure 7b).
Figure 7.
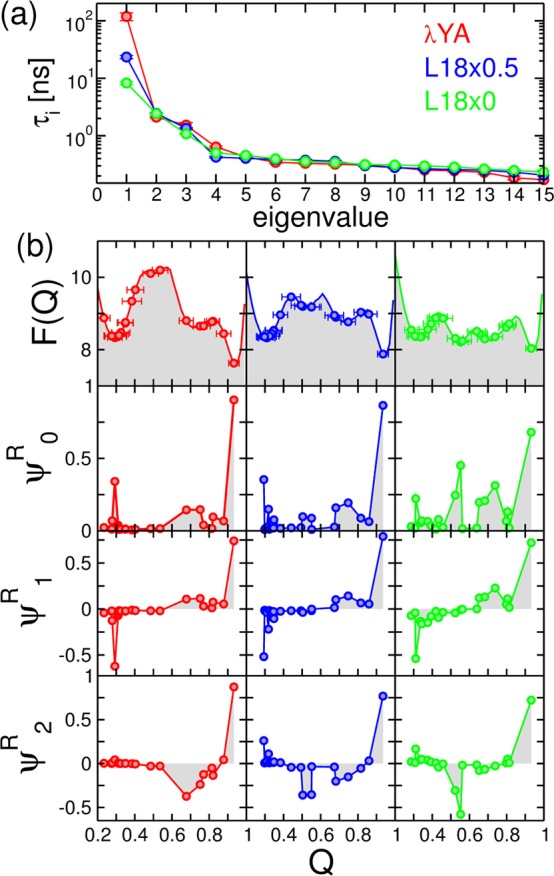
(a) Spectrum of relaxation times for the MSM of the λ-repressor model and the L18 mutants. (b) Top row shows potentials of mean force (in kcal/mol) with overlaid circles indicating the mean values of Q for the different microstates of the MSM. Error bars indicate one standard deviation. The next three rows show the values of the slowest right eigenvectors ψiR projected on Q. Shaded areas are shown to illustrate the sign structure of the eigenvectors.
To gain further insight into how the dynamical signatures in our model mutants may result in different signals in kinetic experiments, we calculate relaxations using the derived transition matrices. We use eq 4 to propagate the dynamics from a theoretical initial distribution that we set to be the fully folded microstate (i.e., p(0) is a vector of zeros but for the fully folded state N). To calculate a proxy for the signal of the most usually studied experimental probe, the fluorescence of Trp22, we use the fraction of native contacts of this residue (QW22, Figure 8a). The relaxation is faster as we go from λYA (Figure 8b) to the engineered models (Figure 8c,d). However, the two-state approximation also starts to become worse as we approach the downhill mutant, which requires three exponentials to fit the data. The fastest phase in the downhill mutant appears on a time scale similar to the fast eigenmodes of the MSM. This kinetic analysis hence validates the results from the projection approach, confirming the decrease in free-energy barriers, speed-up in rates, and emergence of “strange kinetics”.
Figure 8.
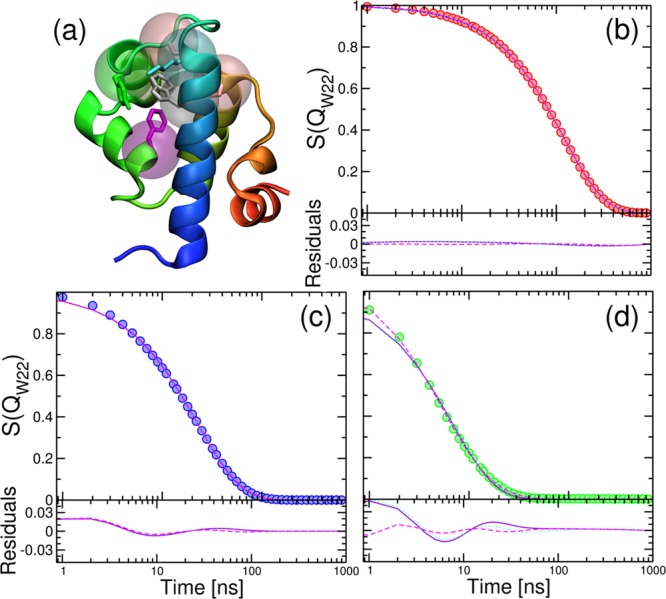
(a) Cartoon representation of λYA. Residues that form contacts with the W22 side chain are shown in atomic detail for heavy atoms and as transparent spheres centered in the Cα. (b) Decay of the normalized fraction of native W22 contacts, QW22, for λYA (circles), with lines corresponding to single (violet), double (cyan), and triple (magenta) exponential fitting expressions. Residuals are shown in the bottom panel. (c) Same for L18×0.5. (d) Same for L18×0.
Conclusions
We present a new approach to computational protein engineering that can be very useful as a tool to guide the search for relevant mutants to be studied experimentally. In particular, we engineer the transition from two-state to downhill folding by tuning the cooperativity of a protein model that folds in a two-state fashion at the midpoint and reaches downhill folding upon single-point modifications in the simplified energy function. The method is novel in that it focuses on modulating the probability distribution for a given order parameter and therefore accounts for the ensemble nature of protein folding. In this respect, our approach is similar to SMArtEPS, an Ising-model-based method recently developed to predict changes in stability in protein mutants.24 In this case, we assume that Q is a good order parameter for folding and modulate the probability distribution for this parameter. This is a reasonable assumption in the context of a Go̅ model. In more complicated scenarios, a step involving the optimization of the reaction coordinate28,29 can be incorporated as part of step 2 in the algorithm (Figure 1a). Also, we approximate the probability distribution on Q as being bimodal (see eq 1). This may break down when the two-state approximation does not hold, particularly if we use more detailed (i.e., atomistic) protein models. However, we note that for a large subset of single-domain proteins studied with microsecond atomistic MD simulations, the distributions along a coordinate are still largely two-state,46 and many small domains have been shown to fold in a two-state fashion experimentally.57,58 While most methods focus on recovering the correct Tm, here emphasis is placed on dynamic aspects. We validate the results of the engineering by comparing the MSM of the original protein model with that of the mutants. In the context of a more detailed model it will be possible to make direct comparison with the exact kinetic signatures observed for different mutants.
The work that we present here is based on a simple topology-based model that considers only the interactions present in the native conformation of the protein. Non-native interactions could modify the emerging picture, although these have been found to have only relatively small effects on protein folding cooperativity.59 Our results do, however, stand by themselves, as there are a number of experimental references that we are able to reproduce. First, the general features of folding of λYA such as two-state folding near the midpoint12 are captured by the simple Go̅ model. In addition, we are able to locate a cooperative folding core that overlaps with that identified by Gruebele and coworkers.54 One possible concern is whether the proposed mutants will be stable. Although it is not possible to answer that question in advance, we speculate that they will, as our estimate of the melting temperature for L18×0 (Tm ≃ 290 K) involves a decrease to 92% of the Tm of the original model (315 K), while the experimental Tm of λYA is 344 K.
Our approach is particularly promising in the context of a more detailed description of the effects of mutations in the model for the interactions. For example, we show one possibility here, in which we replace the εij of the residue pairs that change upon mutation with the corresponding values from the Miyazawa–Jernigan interaction matrix30 and substitute the knowledge-based torsion terms according to the mutation. Using this method for the computational protein engineering, the agreement with the experimental Tm for a database of 17 different mutants8,10,12,13 is very good (see Figure 9a), although this does not guarantee that the barrier heights will be reproduced. Interestingly the changes in the εij terms obtained by swapping the Miyazawa–Jernigan contact energies required to produce the mutations from our reference sequence (Figure 9b) support the scaling factors (particularly the 0.5 scaling) used in this study. Taken together, these results suggest the future directions for refining the current approach with a more accurate description of the energetics. This will be possible by carefully calibrating the results of the model against extensive data sets of mutation effects in the thermodynamics60 and kinetics61 of protein folding.
Figure 9.
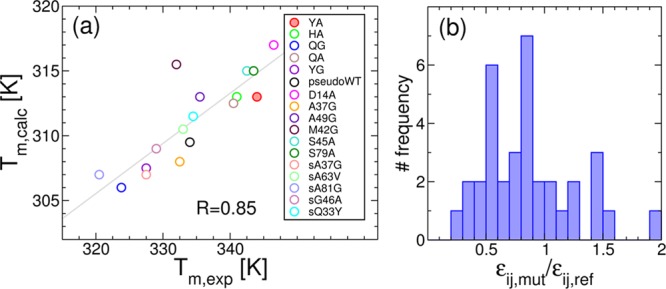
(a) Correlation between experimentally determined Tm values and those calculated by substituting the εij involving the mutated residue in the simulations. The correlation line is shown in gray. (b) Histogram of the relative changes in εij from λYA.
Acknowledgments
J.W.C. acknowledges support from Trinity Hall Cambridge. C.M.B. acknowledges the Federation of European Biochemical Societies (FEBS) for a Return to Europe Fellowship. R.B.B. is supported by the Intramural Research Program of the National Institute of Diabetes and Digestive and Kidney Diseases of the National Institutes of Health. D.D.S. acknowledges support from a FEBS Long Term Postdoctoral Fellowship and from the Engineering and Physical Sciences Research Council [Grant number EP/J016764/1].
Supporting Information Available
Additional calculations of the cooperativity metric and analysis of the potentials of mean force. This material is available free of charge via the Internet at http://pubs.acs.org.
The authors declare no competing financial interest.
Funding Statement
National Institutes of Health, United States
Supplementary Material
References
- Bryngelson J. D.; Onuchic J. N.; Socci N. D.; Wolynes P. G. Funnels, Pathways, and the Energy Landscape of Protein Folding: a Synthesis. Proteins 1995, 21, 167–195. [DOI] [PubMed] [Google Scholar]
- Jackson S. E.; Fersht A. R. Folding of Chymotrypsin Inhibitor 2. 1. Evidence for a Two-State Transition. Biochemistry 1991, 30, 10428–10435. [DOI] [PubMed] [Google Scholar]
- Chung H. S.; McHale K.; Louis J. M.; Eaton W. A. Single-Molecule Fluorescence Experiments Determine Protein Folding Transition Path Times. Science 2012, 335, 981–984. [DOI] [PMC free article] [PubMed] [Google Scholar]
- Eaton W. A. Searching for “Downhill Scenarios” in Protein Folding. Proc. Natl. Acad. Sci. U. S. A. 1999, 96, 5897–5899. [DOI] [PMC free article] [PubMed] [Google Scholar]
- Muñoz V. Conformational Dynamics and Ensembles in Protein Folding. Annu. Rev. Biophys. Biomol. Struct. 2007, 36, 395–412. [DOI] [PubMed] [Google Scholar]
- Yang W. Y.; Gruebele M. Folding at the Speed Limit. Nature 2003, 423, 193–197. [DOI] [PubMed] [Google Scholar]
- Yang W. Y.; Gruebele M. Folding λ-Repressor at Its Speed Limit. Biophys. J. 2004, 87, 596–608. [DOI] [PMC free article] [PubMed] [Google Scholar]
- Yang W. Y.; Gruebele M. Rate-Temperature Relationships in λ-Repressor Fragment λ6–85 Folding. Biochemistry 2004, 43, 13018–13025. [DOI] [PubMed] [Google Scholar]
- Liu F.; Gruebele M. Tuning λ6–85 Towards Downhill Folding at its Melting Temperature. J. Mol. Biol. 2007, 370, 574–584. [DOI] [PubMed] [Google Scholar]
- Ma H.; Gruebele M. Kinetics are Probe-Dependent During Downhill Folding of an Engineered λ6–85 protein. Proc. Natl. Acad. Sci. U. S. A. 2005, 102, 2283–2287. [DOI] [PMC free article] [PubMed] [Google Scholar]
- Liu F.; Du D.; Fuller A. A.; Davoren J. E.; Wipf P.; Kelly J. W.; Gruebele M. An Experimental Survey of the Transition between Two-State and Downhill Protein Folding Scenarios. Proc. Natl. Acad. Sci. U. S. A. 2008, 105, 2369–2374. [DOI] [PMC free article] [PubMed] [Google Scholar]
- Liu F.; Gao Y. G.; Gruebele M. A Survey of λ Repressor Fragments from Two-State to Downhill Folding. J. Mol. Biol. 2010, 397, 789–798. [DOI] [PMC free article] [PubMed] [Google Scholar]
- Prigozhin M. B.; Liu Y.; Wirth A. J.; Kapoor S.; Winter R.; Schulten K.; Gruebele M. Misplaced Helix Slows Down Ultrafast Pressure-Jump Protein Folding. Proc. Natl. Acad. Sci. U. S. A. 2013, 110, 8087–8092. [DOI] [PMC free article] [PubMed] [Google Scholar]
- Kubelka J.; Hofrichter J.; Eaton W. A. The Protein Folding ‘Speed Limit’. Curr. Opin. Struct. Biol. 2004, 14, 76–88. [DOI] [PubMed] [Google Scholar]
- Ghaemmaghami S.; Word J. M.; Burton R. E.; Richardson J. S.; Oas T. G. Folding Kinetics of a Fluorescent Variant of Monomeric λ Repressor. Biochemistry 1998, 37, 9179–9185. [DOI] [PubMed] [Google Scholar]
- Larios E.; Pitera J. W.; Swope W. C.; Gruebele M. Correlation of Early Orientational Ordering of Engineered λ6–85 Structure with Kinetics and Thermodynamics. Chem. Phys. 2006, 323, 45–53. [Google Scholar]
- Myers J. K.; Oas T. G. Contribution of a Buried Hydrogen Bond to λ Repressor Folding Kinetics. Biochemistry 1999, 38, 6761–6768. [DOI] [PubMed] [Google Scholar]
- Sanchez-Ruiz J. M.; Makhatadze G. I. To Charge or not to Charge?. Trends Biotechnol. 2001, 19, 132–135. [DOI] [PubMed] [Google Scholar]
- Guerois R.; Nielsen J. E.; Serrano L. Predicting Changes in the Stability of Proteins and Protein Complexes: A Study of More Than 1000 Mutations. J. Mol. Biol. 2002, 320, 369–387. [DOI] [PubMed] [Google Scholar]
- Bordner A. J.; Abagyan R. A. Large-Scale Prediction of Protein Geometry and Stability Changes for Arbitrary Single Point Mutations. Proteins 2004, 57, 400–413. [DOI] [PubMed] [Google Scholar]
- Parthiban V.; Gromiha M. M.; Schomburg D. CUPSAT: Prediction of Protein Stability upon Point Mutations. Nucleic Acids Res. 2006, 34, W239–W242. [DOI] [PMC free article] [PubMed] [Google Scholar]
- Yin S.; Ding F.; Dokholyan N. V. Eris: an Automated Estimator of Protein Stability. Nat. Methods 2007, 4, 466–467. [DOI] [PubMed] [Google Scholar]
- Dehouck Y.; Grosfils A.; Folch B.; Gilis D.; Bogaerts P.; Rooman M. Fast and Accurate Predictions of Protein Stability Changes upon Mutations using Statistical Potentials and Neural Networks: PoPMuSiC-2.0. Bioinformatics 2009, 25, 2537–2543. [DOI] [PubMed] [Google Scholar]
- Naganathan A. N. A Rapid, Ensemble and Free Energy Based Method for Engineering Protein Stabilities. J. Phys. Chem. B 2013, 117, 4956–4964. [DOI] [PubMed] [Google Scholar]
- Hilser V. J.; Dowdy D.; Oas T. G.; Freire E. The Structural Distribution of Cooperative Interactions in Proteins: Analysis of the Native State Ensemble. Proc. Natl. Acad. Sci. U. S. A. 1998, 95, 9903–9908. [DOI] [PMC free article] [PubMed] [Google Scholar]
- Noé F.; Fischer S. Transition Networks for Modeling the Kinetics of Conformational Change in Macromolecules. Curr. Opin. Struct. Biol. 2008, 18, 154–162. [DOI] [PubMed] [Google Scholar]
- Karanicolas J.; Brooks C. L. III. The Origins of Asymmetry in the Folding Transition States of Protein L and Protein G. Protein Sci. 2002, 11, 2351–2361. [DOI] [PMC free article] [PubMed] [Google Scholar]
- Hummer G. From Transition Paths to Transition States and Rate Coefficients. J. Chem. Phys. 2004, 120, 516–523. [DOI] [PubMed] [Google Scholar]
- Best R. B.; Hummer G. Reaction Coordinates and Rates from Transition Paths. Proc. Natl. Acad. Sci. U. S. A. 2005, 102, 6732–6737. [DOI] [PMC free article] [PubMed] [Google Scholar]
- Miyazawa S.; Jernigan R. L. Residue - Residue Potentials with a Favorable Contact Pair Term and an Unfavorable High Packing Density Term, for Simulation and Threading. J. Mol. Biol. 1996, 256, 623–644. [DOI] [PubMed] [Google Scholar]
- Hess B.; Kutzner C.; van der Spoel D.; Lindahl E. GROMACS 4: Algorithms for Highly Efficient, Load-Balanced, and Scalable Molecular Simulation. J. Chem. Theory Comput. 2008, 4, 435–447. [DOI] [PubMed] [Google Scholar]
- Hess B.; Bekker H.; Berendsen H. J. C.; Fraaije J. G. E. M. LINCS: A Linear Constraint Solver for Molecular Simulations. J. Comput. Chem. 1997, 18, 1463–1472. [Google Scholar]
- Kumar S.; Rosenberg J. M.; Bouzida D.; Swendsen R. H.; Kollman P. A. The Weighted Histogram Analysis Method for Free-Energy Calculations on Biomolecules. I. The Method. J. Comput. Chem. 1992, 13, 1011–1021. [Google Scholar]
- Noé F.; Horenko I.; Schutte C.; Smith J. C. Hierarchical Analysis of Conformational Dynamics in Biomolecules: Transition Networks of Metastable States. J. Chem. Phys. 2007, 126, 155102. [DOI] [PubMed] [Google Scholar]
- Chodera J. D.; Singhal N.; Pande V. S.; Dill K. A.; Swope W. C. Automatic Discovery of Metastable States for the Construction of Markov Models of Macromolecular Conformational Dynamics. J. Chem. Phys. 2007, 126, 155101. [DOI] [PubMed] [Google Scholar]
- Prinz J.-H.; Wu H.; Sarich M.; Keller B.; Senne M.; Held M.; Chodera J. D.; Schütte C.; Noé F. Markov Models of Molecular Kinetics: Generation and Validation. J. Chem. Phys. 2011, 134, 174105. [DOI] [PubMed] [Google Scholar]
- Efron B. Bootstrap Methods: Another Look at the Jackknife. Ann. Stat. 1979, 7, 1–26. [Google Scholar]
- Kellogg E. H.; Lange O. F.; Baker D. Evaluation and Optimization of Discrete State Models of Protein Folding. J. Phys. Chem. B 2012, 116, 11405–11413. [DOI] [PubMed] [Google Scholar]
- Muñoz V.; Henry E. R.; Hofrichter J.; Eaton W. A. A Statistical Mechanical Model for β-Hairpin Kinetics. Proc. Natl. Acad. Sci. U. S. A. 1998, 95, 5872–5879. [DOI] [PMC free article] [PubMed] [Google Scholar]
- Muñoz V.; Eaton W. A. A Simple Model for Calculating the Kinetics of Protein Folding from Three-Dimensional Structures. Proc. Natl. Acad. Sci. U. S. A. 1999, 96, 11311–11316. [DOI] [PMC free article] [PubMed] [Google Scholar]
- Rousseeuw L.; Kaufman L.. Statistical Data Analysis Based on the L1-Norm and Related Methods; North-Holland: Amsterdam, 1987; pp 405–416. [Google Scholar]
- Hamming R. W. Error Detecting and Error Correcting Codes. Bell Syst. Tech. J. 1950, 29, 147–160. [Google Scholar]
- Buchete N.-V.; Hummer G. Coarse Master Equations for Peptide Folding Dynamics. J. Phys. Chem. B 2008, 112, 6057–6069. [DOI] [PubMed] [Google Scholar]
- Beamer L. J.; Pabo C. O. Refined 1.8 Å Crystal Structure of the λ Repressor-Operator Complex. J. Mol. Biol. 1992, 227, 177–196. [DOI] [PubMed] [Google Scholar]
- Allen L. R.; Krivov S. V.; Paci E. Analysis of the Free-Energy Surface of Proteins from Reversible Folding Simulations. PLoS Comput. Biol. 2009, 5, e1000428. [DOI] [PMC free article] [PubMed] [Google Scholar]
- Lindorff-Larsen K.; Piana S.; Dror R. O.; Shaw D. E. How Fast-Folding Proteins Fold. Science 2011, 334, 517–520. [DOI] [PubMed] [Google Scholar]
- Muñoz V.; Serrano L. Elucidating the Folding Problem of Helical Peptides Using Empirical Parameters. Nat. Struct. Mol. Biol. 1994, 1, 399–409. [DOI] [PubMed] [Google Scholar]
- Best R. B.How Well Does a Funneled Energy Landscape Capture the Folding Mechanism of Spectrin Domains? J. Phys. Chem. B, 10.1021/jp403305a. [DOI] [PMC free article] [PubMed] [Google Scholar]
- Matouschek A.; Kellis J. T.; Serrano L.; Fersht A. R. Mapping the Transition State and Pathway of Protein Folding by Protein Engineering. Nature 1989, 340, 122–126. [DOI] [PubMed] [Google Scholar]
- Scalley-Kim M.; Baker D. Characterization of the Folding Energy Landscapes of Computer Generated Proteins Suggests High Folding Free Energy Barriers and Cooperativity may be Consequences of Natural Selection. J. Mol. Biol. 2004, 338, 573–583. [DOI] [PubMed] [Google Scholar]
- De Sancho D.; Doshi U.; Munñoz V. Protein Folding Rates and Stability: How Much Is There Beyond Size?. J. Am. Chem. Soc. 2009, 131, 2074–2075. [DOI] [PubMed] [Google Scholar]
- Li M. S.; Klimov D. K.; Thirumalai D. Finite Size Effects on Thermal Denaturation of Globular Proteins. Phys. Rev. Lett. 2004, 93, 268107. [DOI] [PubMed] [Google Scholar]
- Knott M.; Chan H. S. Criteria for Downhill Protein Folding: Calorimetry, Chevron Plot, Kinetic Relaxation, and Single-Molecule Radius of Gyration in Chain Models with Subdued Degrees of Cooperativity. Proteins 2006, 65, 373–391. [DOI] [PubMed] [Google Scholar]
- Prigozhin M. B.; Sarkar K.; Law D.; Swope W. C.; Gruebele M.; Pitera J. Reducing Lambda Repressor to the Core. J. Phys. Chem. B. 2011, 115, 2090–2096. [DOI] [PubMed] [Google Scholar]
- Naganathan A. N.; Perez-Jimenez R.; Sánchez-Ruiz J. M.; Muñoz V. Robustness of downhill folding Guidelines for the Analysis of Equilibrium Folding Experiments on Small Proteins. Biochemistry 2005, 44, 7435–7449. [DOI] [PubMed] [Google Scholar]
- Lane T. J.; Pande V. S. Eigenvalues of the Homogeneous Finite Linear One Step Master Equation: Applications to Downhill Folding. J. Chem. Phys. 2012, 137, 215106. [DOI] [PubMed] [Google Scholar]
- Jackson S. E. How Do Small Single-Domain Proteins Fold?. Folding Des. 1998, 3, R81–R91. [DOI] [PubMed] [Google Scholar]
- De Sancho D.; Muñoz V. Integrated Prediction of Protein Folding and Unfolding Rates from Only Size and Structural Class. Phys. Chem. Chem. Phys. 2011, 13, 17030–17043. [DOI] [PubMed] [Google Scholar]
- Clementi C.; Plotkin S. S. The Effects of Nonnative Interactions on Protein Folding Rates: Theory and Simulation. Protein Sci. 2004, 13, 1750–1766. [DOI] [PMC free article] [PubMed] [Google Scholar]
- Gromiha M. M.; An J.; Kono H.; Oobatake M.; Uedaira H.; Sarai A. ProTherm: Thermodynamic Database for Proteins and Mutants. Nucleic Acids Res. 1999, 27, 286–288. [DOI] [PMC free article] [PubMed] [Google Scholar]
- Naganathan A. N.; Muñoz V. Insights into Protein Folding Mechanisms from Large Scale Analysis of Mutational Effects. Proc. Natl. Acad. Sci. U. S. A. 2010, 107, 8611–8616. [DOI] [PMC free article] [PubMed] [Google Scholar]
Associated Data
This section collects any data citations, data availability statements, or supplementary materials included in this article.


