

Abstract
In plants, aquaporins play a crucial role in regulating root water transport in response to environmental and physiological cues. Controls achieved at the post-translational level are thought to be of critical importance for regulating aquaporin function. To investigate the general molecular mechanisms involved, we performed, using the model species Arabidopsis, a comprehensive proteomic analysis of root aquaporins in a large set of physiological contexts. We identified nine physiological treatments that modulate root hydraulics in time frames of minutes (NO and H2O2 treatments), hours (mannitol and NaCl treatments, exposure to darkness and reversal with sucrose, phosphate supply to phosphate-starved roots), or days (phosphate or nitrogen starvation). All treatments induced inhibition of root water transport except for sucrose supply to dark-grown plants and phosphate resupply to phosphate-starved plants, which had opposing effects. Using a robust label-free quantitative proteomic methodology, we identified 12 of 13 plasma membrane intrinsic protein (PIP) aquaporin isoforms, 4 of the 10 tonoplast intrinsic protein isoforms, and a diversity of post-translational modifications including phosphorylation, methylation, deamidation, and acetylation. A total of 55 aquaporin peptides displayed significant changes after treatments and enabled the identification of specific and as yet unknown patterns of response to stimuli. The data show that the regulation of PIP and tonoplast intrinsic protein abundance was involved in response to a few treatments (i.e. NaCl, NO, and nitrate starvation), whereas changes in the phosphorylation status of PIP aquaporins were positively correlated to changes in root hydraulic conductivity in the whole set of treatments. The identification of in vivo deamidated forms of aquaporins and their stimulus-induced changes in abundance may reflect a new mechanism of aquaporin regulation. The overall work provides deep insights into the in vivo post-translational events triggered by environmental constraints and their possible role in regulating plant water status.
The absorption of soil water by roots is crucial in order for plants to maintain their water status. Studies in various plant species have shown that the root water permeability (root hydraulic conductivity Lpr) is constantly adjusted depending on the developmental stage of the plant, its nutritional or hormonal status, or multiple environmental stimuli (1). Despite their importance in plant growth and adaptation, these multiple responses have not been investigated in a single plant species yet. Aquaporins form a large class of channel proteins that facilitate the diffusion of water and small neutral solutes across cell membranes and, among many other functions, contribute to root water uptake (2, 3). Aquaporins are 25- to 30-kDa proteins with six membrane-spanning domains and five connecting loops (A–E), with N- and C-terminal tails exposed to the cytosol (4, 5). Plant aquaporins show a high multiplicity of isoforms. Thirty-five homologs belonging to four homology subclasses have been identified in Arabidopsis. The plasma membrane intrinsic proteins (PIPs)1 (with 13 isoforms further subdivided into the PIP1 and PIP2 subgroups) and the tonoplast intrinsic proteins (TIPs) with 10 homologs are the most abundant aquaporins in the plasma membrane and the tonoplast, respectively (6, 7). Two other families include nine homologs of the nodulin-26-like proteins and three homologs of small basic intrinsic proteins (6–8). Several lines of functional analysis, including the use of aquaporin chemical blockers or phenotypic analysis of transgenic plants with antisense inhibition or insertional mutagenesis of PIP genes, have demonstrated that PIP aquaporins mediate a significant part of root water uptake (9–12). However, the mechanisms that underlie PIP regulation in roots under abiotic constraints appear composite and remain partially understood. In addition to the long-term transcriptional control of aquaporin functions, multiple post-translational mechanisms that affect aquaporin activity, targeting to their destination compartment, or stability seem to be involved in the response of plant roots to environmental and hormonal stimuli.
Post-translational modifications (PTMs) are central for regulating protein structure and function and thereby modulating protein catalytic activity, subcellular localization, stability, and interaction with other partners. Protein phosphorylation is one of most important and best characterized PTMs. Virtually all cellular processes are regulated in one or multiple ways by reversible phosphorylation. PIPs are no exception and show a conserved phosphorylation site in their first cytosolic loop (loop B) and multiple phosphorylations in adjacent sites of their C-terminal tail (13–15), as listed in the PhosPhAt database. Aquaporin phosphorylation seems to be a significant target in plants under stress: following exposure of Arabidopsis roots to salt (NaCl) or hydrogen peroxide (H2O2), AtPIP2;1 phosphorylation is decreased and increased, respectively (15). Abscisic acid treatment of Arabidopsis seedlings also decreases the phosphorylation of several AtPIPs (16). A transient increase in phosphorylation of AtPIP2;6 was observed upon sucrose resupply to starved Arabidopsis plantlets (17), whereas nitrogen resupply to starved plants results in a transient dephosphorylation of AtPIP2;6 and AtPIP2;7 aquaporins (18). The phosphorylation of PIPs is thought to act on both gating and subcellular localization (5, 15). In particular, the atomic structure of spinach SoPIP2;1 indicates that the phosphorylation of Ser115 in loop B directly contributes to opening of the pore (5). In addition, phosphorylation of C-terminal Ser274, a residue homologous to Ser280 of AtPIP2;1, acts on an adjacent SoPIP2;1 monomer to prevent its transition to a closed-pore conformation (5). Finally, phosphorylation of Ser283 was shown to be necessary for targeting of newly synthesized AtPIP2;1 to the plasma membrane and interfered with its internalization in response to salt stress (15). Plant aquaporins are subjected to many other PTMs. Methylation has been described in AtPIP2;1, but its functional significance is as yet unknown (1, 19, 20). Drought-induced PIP ubiquitination in the endoplasmic reticulum was shown to prevent its trafficking to the plasma membrane and triggered its degradation (21).
Qualitative and quantitative information about PTMs and their dynamic changes is now critically needed in order to address the general principles and complexity of aquaporin regulation during plant responses to stresses. To this end, we investigated in Arabidopsis a set of representative environmental stimuli, including water, osmotic, ionic, oxidative stress, and nutritional constraints. The effects of these stimuli on Lpr were characterized. The results provided a well-defined time frame for investigating the dynamics of aquaporin PTMs using dedicated quantitative approaches. The overall study points to multiple regulatory processes that can be shared between treatments. In particular, coordinated phosphorylation events and a putative role for deamidation were uncovered.
EXPERIMENTAL PROCEDURES
Plant Culture
Arabidopsis thaliana plants, ecotype Columbia-0 (Col-0), were grown in hydroponic conditions as described previously (22). Briefly, sterile seeds were sown on an MS/2 medium (23) complemented with 1% sucrose, 0.05% MES, and 7 g l−1 agar. Seeds were kept at 4 °C for 48 h and cultivated in vitro for 10 days (16 h of light, 20 °C). Seedlings were then transferred to hydroponic culture solution (1.25 mm KNO3, 1.50 mm Ca(NO3)2, 0.75 mm MgSO4, 0.50 mm KH2PO4, 50 μm H3BO3, 12 μm MnSO4, 0.70 μm CuSO4, 1 μm ZnSO4, 0.24 μm Na2MoO4, 50 μm Fe-EDTA, 100 μm Na2SiO3) and grown under long-day conditions (16 h of light (250 μmol photons/m2/s) at 22 °C and 8 h of dark at 21 °C) for 11 days. Culture solution was replaced weekly.
Plant Treatments
Short treatments (up to 6 h) were applied by exposing 21-day-old plants to modified hydroponic solutions. The effect of salt was studied by complementing the hydroponic solution with 100 mm NaCl over 45 min or 2 h. For mannitol treatment, plants were grown in a hydroponic solution containing 200 mm mannitol over 45 min to 6 h. Plants were treated with 500 μm H2O2 over 8 or 20 min. Nitric oxide (NO) treatment was applied by using diethylamine NONOate (DEA-NO), an NO donor, as previously described (24). Briefly, DEA-NO was dissolved in 0.01 m NaOH as a stock solution (500 mm). The solution was diluted in a phosphate buffer, pH 7.2, to initiate NO release. A concentration of 50 μm to 500 μm DEA-NO was applied in a hydroponic solution without Fe-EDTA to avoid metal–NO complexes. NO specificity was tested by using 0.1 mm carboxy-2-phenyl-4,4,5,5,-tetramethylimidazoline-1-oxyl 3-oxide (cPTIO) as a specific NO scavenger (25). For sucrose treatment, plants were kept in darkness for 24 to 48 h and then supplied with 30 mm sucrose or mannitol for 2 or 4 h. Nitrate starvation was applied by transferring 15-day-old plants to a modified hydroponic medium containing 0.1 mm NO3 in total for 6 days, where KNO3 and Ca(NO3)2 were replaced by K2SO4 and CaCl2, respectively (0.03 mm KNO3, 0.035 mm Ca(NO3)2, 0.61 mm K2SO4, 1.465 mm CaCl2). Phosphate starvation was applied by transferring 15-day-old plants to a PO43−-free hydroponic solution for 6 days. Nitrate or phosphate resupply was performed by transferring plants to standard media for 2 to 24 h.
Water Transport Measurements
Measurements were performed essentially as described elsewhere (22). Briefly, the root system of freshly detopped 21-day-old Arabidopsis plants was inserted into a pressure chamber filled with the culture solution. The hypocotyl was carefully threaded through the soft plastic washer of the metal lid and connected to a flow meter using a low-viscosity dental paste (PRESIDENT microSystem, Coltene, Altstätten, Switzerland). Pressure was then slowly applied to the chamber using nitrogen gas. Ten minutes of pre-pressurization were required in order to achieve a stabilized sap flow (Jv), which was then determined over 20-min periods for imposed hydrostatic pressures between 0.16 and 0.72 MPa. Root and shoot dry weight (DW) was measured after 48 h of drying. The hydraulic conductivity (Lpr, ml g−1 h−1 MPa−1) of each individual root system was calculated from the slope of a plot of Jv versus driving pressure, divided by the root DW.
Microsomal Protein Purification
The whole procedure was performed at 4 °C. Roots of 21-day-old plants were grinded with a roll mill (conception by C. Fauvel, INRA Avignon, France) in 4 ml/g fresh weight of grinding buffer (500 mm sucrose, 10% glycerol, 20 mm EDTA, 20 mm EGTA, 50 mm NaF, 5 mm β-glycerophosphate, 1 mm phenantroline, 0.6% polyvinylpyrrolidone (PVP), 10 mm ascorbic acid, 50 mm Tris, pH 8, with 1 m MES, 1 μm leupeptin, 5 mm DTT, 1 mm stabilized vanadate, 1 mm PMSF) and centrifuged at 800g for 2 min. The supernatant was then centrifuged at 9000g for 12 min, and the resulting supernatant was centrifuged at 50,000g for 12 min. The resulting pellet was suspended in a minimal volume of conservation buffer (10 mm borate, 300 mm sucrose, 9 mm KCl, 5 mm EDTA, 5 mm EGTA, 50 mm NaF, 4.2 μm leupeptine, 1 mm PMSF, 5 mm DTT, 10 mm Tris, pH 8.3) and stored at −80 °C. The protein concentration was estimated using a modified Bradford procedure (26). Microsomes were stripped by incubation in 4 m urea, pH 11, and 20 mm NaOH according to a previously described procedure (27). Proteins were then solubilized in 2× Laemmli buffer (2% SDS, 10% glycerol, 100 mm DTT, 0.001% bromphenol blue, 50 mm Tris, pH 6.8) for 3 h under shaking. After centrifugation (16,000g for 2 min), the supernatant containing solubilized proteins was stored at −20 °C.
ELISA Assay
ELISA assays were performed according to Ref. 22 to obtain a relative quantification of aquaporins in microsomal extracts. An antibody recognizing four out of five PIP1s (PIP1;1, PIP1;2, PIP1;3, and PIP1;4) and another antibody recognizing three out of eight PIP2s (PIP2;1, PIP2;2, and PIP2;3) were used at a 1:2000 dilution (27).
Protein Digestion and Phosphopeptide Enrichment
In-solution reductions/alkylations were performed simultaneously with detergent removal via the filter-aided sample preparation protocol (28). These steps were followed by two types of double digestions. One of these subsequently used Lys-C (Roche Applied Science) for 4 h at 37 °C and trypsin (Sequencing Grade Modified, Promega, Madison, WI) overnight at 37 °C. The other used chymotrypsin (Sequencing Grade Modified, Promega) for 5 h at 25 °C and then AspN (Sequencing Grade Modified, Promega) overnight at 25 °C. Peptides were eluted via step elutions with 50 mm ammonium bicarbonate followed by 50% acetonitrile and then 0.5 m NaCl. Peptides were desalted on C18 columns (Sep-Pak® Vac tC18 cartridge, 3 cc, Waters, Guyancourt, France) before strong cation exchange separation. Dried peptides were resuspended in 10 mm ammonium formate with 30% acetonitrile at pH 2.7 and loaded on a Famos-Ultimate HPLC (Dionex, Courtaboeuf, France) at 200 μl min−1 on a column (PL-SCX 1000A, 5 μm, 50 × 2.1 mm, Varian, Agilent, Massy, France). A salt gradient (10 mm ammonium formate, 800 mm NH4Cl, 30% acetonitrile, pH 2.7) allowed us to obtain nine fractions. In the case of chymotrypsin/AspN digestion, two peptide fractions were obtained and quantified. In the case of Lys-C/trypsin digestion, nine fractions were obtained and treated as follows: 10% of the volume of fractions 4 (F4) to 9 (F9) were kept out to direct LC-MS/MS analyses. Fractions F2, F3, and F4 and fractions F5, F6, and F7 were pooled before the phosphopeptide enrichment step. The F1 fraction was set aside. After solvent evaporation, peptides were resuspended in a loading buffer (25% lactic acid, 60% acetonitrile, 0.75% trifluoroacetic acid (TFA)) for titanium dioxide (TiO2) enrichment according to Refs. 29 and 30. Briefly, a C8 plug was packed on-tip with metal oxide bulk beads and equilibrated with 1% TFA and 80% acetonitrile including 25% lactic acid as selectivity chelating enhancers (buffer A). Two successive columns were built with 1 to 2 mm and 4 to 5 mm of TiO2 beads, respectively. After loading, washes were performed with buffer A and buffer B (1% TFA in 80% acetonitrile) and peptides were eluted twice with NH4OH at 0.5% and then 5%. Eluates were pooled and dried.
Identification of Peptides and Modified Peptides
Digested peptides were concentrated with a pre-column (Dionex, C18 PepMap100, 300 μm × 5 mm, 5 μm, 100 A) and separated with a reversed-phase capillary column (Dionex, C18 PepMap100, 75 μm × 250 mm, 3 μm, 100 A) over a 140-min gradient. Peptide fragmentation was carried out with a Q-TOF-MS/MS system equipped with a nano-electrospray ionization source (Maxis, Bruker Daltonics, Bremen, Germany) and performed in the positive ion mode. The corresponding data were interrogated with Mascot 2.2.07 (Matrix Science) via ProteinScape software (Bruker Daltonics) against the Arabidopsis proteome (Tair10, 31,960 entries). Parameters of interrogation accepted one putative missed cleavage and 15-ppm and 0.05-Da mass ranges for the parent peptide and the MS/MS fragment, respectively. The selected enzymes were trypsin or chymotrypsin/AspN. Because proteins were reduced and alkylated, carbamidomethylation was taken as a fixed modification. Variable modifications were N-terminal acetylation; deamidation of asparagines and glutamines; methionine oxidation; phosphorylation of serines, threonines, and tyrosines; and methylation of aspartic and glutamic acids and of serines. Using the above criteria for protein identification, the rate of false peptide sequence assignment (false discovery rate) as determined by the “decoy database” function implemented in Mascot version 2.2.07 was 1%. All modified aquaporin peptides were checked manually via comparison of experimentally identified masses with the theoretically accepted masses for the fragments. Modified peptides were accepted if the PTM score was >20 and/or site-determining b or y ions were present.
Label-free Peptide Quantification and Statistical Analysis
Microsomal samples prepared from three independent plant cultures were all analyzed with two technical replicates corresponding to independent injections in the mass spectrometer. Data corresponding to peak intensity were computed using the ProfileAnalysis software (Bruker Daltonics). Fractionated peptides obtained after digestion with Lys-C/trypsin or chymotrypsin/AspN were quantified with a label-free approach using a direct comparison of the peak intensity of each peptide ion in multiple LC-MS. Bruker software (DataAnalysis, ProfileAnalysis) provided a workflow including peak detection, peak matching/alignment, normalization, detection of differential peptides, and statistical analyses of data. In particular, the technical variability was reduced via the “quantile” method (Bruker Daltonics), the goal of which is to homogenize the distribution of compound intensities for each LC-MS run in a common data set containing all acquired LC-MS runs. ProfileAnalysis (Bruker Daltonics) was used to discriminate peptides with quantitative variations, which were further identified via collision-induced dissociation. Three independent biological experiments and two technical repeats by experiment were used to calculate quantitative ratios and corresponding p values. An aquaporin peptide was considered for data interpretation if a quantitative ratio could be calculated in at least half of the studied treatments (i.e. seven) with a p value below 0.1 for at least three of the treatments. When a peptide met these criteria, its quantitative variations were considered in all treatments. For proper comparison of all treatments, quantitative data of each selected peptide were centered and reduced. Hierarchical clustering was performed using Multi-Experiment-Viewer 4.0. Euclidian was used as a distance matrix.
RESULTS
Modulation of Lpr by Multiple Abiotic Treatments
In a previous study, we showed that exposure of Arabidopsis roots to 100 mm NaCl induces a rapid (half-time: 45 min) and marked (−70%) decrease in Lpr (22). In the present study, plants were treated for up to 6 h with an equivalent hyperosmotic solution containing 200 mm mannitol (Fig. 1A). This treatment induced a decrease in Lpr by up to 63%, with a half-time of 60 min. The application of H2O2 to excised Arabidopsis root systems was previously shown to induce a time- and dose-dependent decrease in pressure-induced sap flow (Jv), an indicator of Lpr in these conditions (31). In particular, 0.5 mm H2O2 induced a 40% inhibition of Jv after 15 min (31). Here, we probed the effects on Jv of NO, another oxidative treatment, using DEA-NO as a NO donor molecule. The application of varying concentrations of DEA-NO (50 to 500 μm) induced a dose-dependent and progressive inhibition of Jv over time (Fig. 1B, supplemental Fig. S1A). Upon prolonged treatment with 100 μm DEA-NO, Jv spontaneously reversed from its maximum (60%) inhibition until it eventually recovered to its initial level (supplemental Fig. S1B). Pre-treatment of the root system with an NO scavenger (100 μm cPTIO) (24, 25) fully counteracted the inhibitory effects of 100 μm DEA-NO (supplemental Fig. S1C), indicating that NO specifically inhibits Arabidopsis Lpr.
Fig. 1.
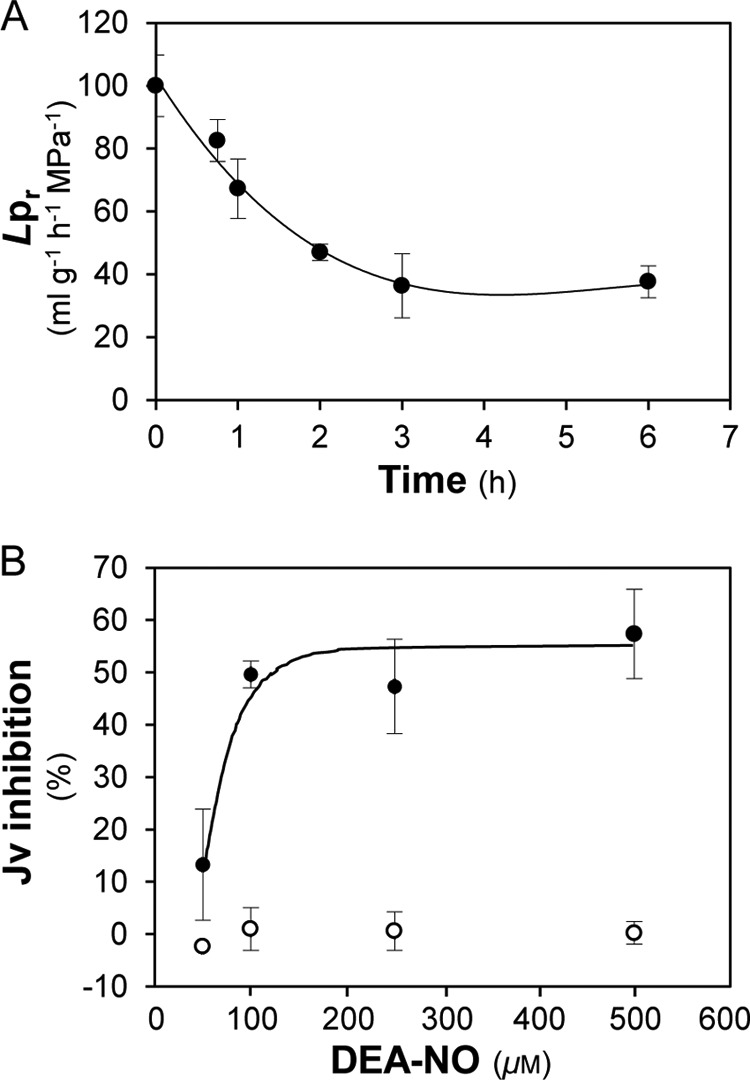
Effects of hyperosmotic (A) and oxidative (B) treatment on root water transport. A, Col-0 plants were transferred at time 0 in a nutrient solution complemented with 200 mm mannitol. The figure represents the kinetic changes of Lpr expressed as a percentage (±S.E.) of the initial Lpr (191.4 ± 18.9 ml g−1 h−1 MPa−1) and measured from n = 3 to 4 plants per culture with three independent cultures. B, Jv was determined after exposure for 10 min to increasing concentrations of DEA-NO (solid circles) or to the same solution deprived of DEA-NO (open circles). Data represent the average values from n = 3 to 4 plants per culture with three independent cultures.
The effect of plant nutritional status on Lpr was also investigated. After plants had been maintained for 1 day in darkness to deplete plant carbon, Lpr was inhibited by 30% (Fig. 2A). The plants were then supplied with 30 mm sucrose or 30 mm mannitol (used here as an osmotic control). Whereas an additional 20% Lpr inhibition was observed after a 4-h treatment with 30 mm mannitol, Lpr was increased by 40%, with respect to control plants in darkness conditions, after 4 h of sucrose treatment (Fig. 2A). Moreover, plants cultivated in the light showed inhibition of Lpr by 34% and 25% in response to treatments with 30 mm sucrose for 2 h and 4 h, respectively (Fig. 2B). This inhibition was similar to that obtained by treating plants with 30 mm mannitol over 4 h (Fig. 2B). These results suggest that sucrose can act as an osmoticum or as a metabolite to inhibit or enhance Lpr, depending on whether it is supplied to plants cultivated in light or darkness conditions, respectively.
Fig. 2.

Lpr response to light and carbon (A, B), phosphate (C), or nitrate (D) availability. A, Lpr was measured in plants grown in the light (light), exposed to a 24-h period of darkness (control), or exposed to a 24-h period of darkness followed by a treatment with 30 mm sucrose (S2h and S4h) or 30 mm mannitol (M2h and M4h) for 2 h (S2h and M2h) or 4 h (S4h and M4h). Data represent the average value (±S.E.) from n = 3 to 20 plants from three independent cultures. B, Lpr was measured in plants grown in light without any addition of sucrose or mannitol (control) or after the addition of 30 mm sucrose for 2 h (S2h) or 4 h (S4h) or 30 mm mannitol for 4 h (M4h). Data represent the average value (±S.E.) of n = 3 to 20 plants from three independent cultures. Different letters indicate statistically significant differences at p < 0.05. C, Lpr was measured in plants grown in control conditions (control), after 6 days of phosphate starvation (Pstarv), or after phosphate starvation followed by 1 h, 2 h, and 24 h of 0.5 mm phosphate resupply (Presup). Data represent the average value (±S.E.) from n = 3 to 13 plants from three independent cultures. D, Lpr was measured in plants subjected to 4, 5, or 6 days of nitrate starvation (gray bars) and in plants of the same age but grown in replete conditions (black bars). Data represent the average value (±S.E.) of n ≥ 4 plants from at least two independent cultures.
Phosphate and nitrate availability can dramatically alter plant growth and development (32). In our experimental conditions, different morphological alterations were observed according to the type of nutrient deficiency: a 6-day-long phosphate starvation induced a relative decrease in shoot DW with respect to replete plants, whereas a 6-day-long nitrate starvation induced a relative increase in root DW (supplemental Fig. S2). After 6 days of phosphate starvation, Lpr was decreased by 77% (Fig. 2C). This reduced value was increased by 50% and 100% after 2 h and 24 h of phosphate resupply, respectively (Fig. 2C). Following nitrate starvation, Lpr remained unchanged for 4 days (Fig. 2D) and was reduced by about 50% after 5 or 6 days (Fig. 2D). The resupply of plants with 4.25 mm nitrate for up to 24 h did not reverse Lpr inhibition (data not shown). These different morphological and physiological responses suggest that distinct molecular mechanisms are involved in plant responses to nitrate and phosphate starvation.
The overall results show that Arabidopsis root water permeability is responsive to osmotic (NaCl, mannitol), oxidative (H2O2, NO), and nutritional (sucrose, phosphate, and nitrate) stimuli. As aquaporins contribute to >60% of Lpr in this species (33), this root system appears to be a suitable model for addressing the modes of aquaporin regulation in roots under various abiotic constraints. For this purpose, proteomic analyses were performed on roots exposed to the above-described treatments for durations that induced half or full Lpr inhibition. In brief, membrane proteins were prepared from roots of plants treated with 100 mm NaCl for 45 min (NaClt1/2) and 2 h (NaCltmax), 200 mm mannitol for 1 h (mant1/2) and 4 h (mantmax), 500 μm H2O2 for 8 min (H2O2t1/2) and 18 min (H2O2tmax), and 125 μm DEA-NO (NOt1/2) for 8 min and 18 min (NOtmax). We also investigated (i) plants grown in darkness (dark) for 1 day and treated with 30 mm sucrose (darksuc) or 30 mm mannitol (darkman) for 4 h and (ii) plants starved in nitrate (Nstarv) or phosphate (Pstarv) for 6 days with, in the latter case, an optional phosphate resupply (Presup) for 2 h.
Identification of Aquaporin Peptides and Their Modified Forms
Efficient identification of aquaporins and their PTMs requires optimal peptide sequence coverage. For this, we developed two types of double digestions of microsomal proteins, employing LysC followed by trypsin and chymotrypsin followed by AspN, respectively. Additionally, the released peptides and phosphopeptides were separated according to their charge on a strong cation exchange column, and phosphopeptides were further enriched with TiO2 microcolumns. Using the two types of double digestions, we were able to identify 1291 proteins from a decoy database set to a false discovery rate of 1% with a 95% confidence level (supplemental Table S1). 1251 proteins were identified with LysC/trypsin digestion and 162 proteins with chymotrypsin/AspN digestion, with 40 of the 162 proteins being specific for the latter digestion. In addition, 32% and 16% of proteins showed at least one phosphorylation and one deamidation event, respectively (supplemental Table S1). This global analysis revealed the presence of 12 PIP isoforms out of a total of 13 (supplemental Table S1). The only lacking PIP isoform (PIP2;6) was detected and shown to play a role in leaves (34). In addition, we detected 4 out of the 10 TIP isoforms (TIP1;1, TIP1;2, TIP2;2, TIP2;3), with 2 of them (TIP1;1 and TIP1;2) specifically identified through chymotrypsin/AspN digestion. Consistent with a lack of detection in roots, TIP3;1 and TIP3;2 are known to be specifically expressed in seeds, and TIP1;3 and TIP5;1 in pollen (35, 36). MS analyses also showed that numerous PIP isoforms were modified by acetylation, phosphorylation, methylation, or deamidation (Table I, supplemental Fig. S3). Among the 14 phosphorylation sites identified in this study, 4 were located in the N-terminal tail of PIP1;1/PIP1;2 (Ser24, Ser27), PIP2;2 (Thr22), and PIP2;4 (Ser10) and were novel according to the PhosphAt database. The mass variation induced by deamidation is 0.98 Da. Thus, the monoisotopic ion was carefully examined to avoid any mistake in the selection of the parent (supplemental Fig. S4). Deamidation of Asn and Gln residues (Table I) was detected at 12 sites in the second extracellular loop (loop C) and in the N- and C-terminal tails of several PIPs (Table I, supplemental Fig. S3). We previously showed that Lys (Lys4) and Glu (Glu6) residues can be methylated in the N-terminal tail of PIP2;1 (20). Although these modifications were not observed in this study's samples, methylation of a Glu residue was observed at another position in the N-terminal tail of PIP2;2 (Table I, supplemental Fig. S3). Combinatorial deamidation and phosphorylation was also observed in some peptides. This revealed a particularly complex modification profile in the N-terminal tail of PIP1;1–1;2 and in the C-terminal tail of PIP2;1–2;3 and PIP2;7 (Table I, supplemental Fig. S3). Although not exhaustive, these analyses establish that PIP aquaporins are highly modified proteins and point to a multiplicity of post-translational regulation mechanisms acting on a same protein (Fig. 3).
Table I. Modified aquaporin peptides.
| Name | Aquaporin | Peptide sequence | PTM | PTM positiona |
|---|---|---|---|---|
| PIP11–14 Acet | PIP1;1–1;2–1;3–1;4 | acetMEGKEEDVR14 | Acet | M1 |
| PIP11 12 (15–29) 1P | PIP1;1–1;2 | 15FPERQPIGTpSAQpSDK29 | 1P | S24, S27 |
| PIP11 12 (15–29) 1P 1Dea | PIP1;1–1;2 | 15FPERdQPIGTpSAQpSDK29 | 1P, 1Dea | 1P: S24, S27; 1Dea: Q19 |
| PIP11 12 (19–29) 1P | PIP1;1–1;2 | 19QPIGTSAQpSDK29 | 1P | S27 |
| PIP21 (4–16) 1Dea | PIP2;1 | 4DVEAVPGEGFdQTR16 | 1Dea | Q14 |
| PIP22 (4–14) 1Dea | PIP2;2 | 4DVEGPEGFdQTR14 | 1Dea | Q12 |
| PIP24 (4–16) 1Dea | PIP2;4 | 4DLDVdNESGPPAAR16 | 1Dea | N8 |
| PIP24 (4–19) 1P | PIP2;4 | 4DLDVNEpSGPPAARDYK19 | 1P | S10 |
| PIP21 (17–33) 1Dea | PIP2;1 | 17DYdQDPPPAPFIDGAELK33 | 1Dea | Q19 |
| PIP22 (15–32) 1P | PIP2;2 | 15DYEDPPPpTPFFDADELTK32 | 1P | T22 |
| PIP22 (15–32) 1Met | PIP2;2 | 15DYmEDPPPTPFFDADELTK32 | 1Met | E17 |
| PIP12 (loop C) 1Dea | PIP1;2 | 157QYQALGGGAdNTIAHGYTK174 | 1Dea | N166 |
| PIP15 (loop C) 1Dea | PIP1;5 | 153GFdQPGLYQTdNGGGAdNVVAHGYTK175 | 1Dea | Q155, N162, N167 |
| PIP24 (loop C) 1Dea | PIP2;4 | 154YGGGAdNELADGYNK167 | 1Dea | N159 |
| PIP27 (loop C) 1Dea | PIP2;7 | 142TPYNTLGGGAdNTVADGYSK160 | 1Dea | N152 |
| PIP21 (272–282) 1P | PIP2;1–2;2–2;3 | 272ASGSKSLGpSFR282 | 1P | S280 |
| PIP21 (277–282) 1P | PIP2;1–2;2–2;3 | 277SLGpSFR282 | 1P | S280 |
| PIP21 (277–287) 1P | PIP2;1–2;2–2;3 | 277SLGpSFRpSAANV287 | 1P | S280, S283 |
| PIP21 (277–287) 1P 1Dea | PIP2;1–2;2–2;3 | 277SLGpSFRpSAAdNV287 | 1P and 1Dea | 1P: S280, S283; 1Dea: N286 |
| PIP21 (277–287) 2P | PIP2;1–2;2–2;3 | 277SLGpSFRpSAANV287 | 2P | S280 + S283 |
| PIP21 (277–287) 2P 1Dea | PIP2;1–2;2–2;3 | 277SLGpSFRpSAAdNV287 | 2P and 1Dea | 2P: S280 + S283; 1Dea: N286 |
| PIP24 (276–287) 1P | PIP2;4 | 277ALGpSFGpSFGpSFR288 | 1P | S280, S283, S286 |
| PIP25 (276–286) 1P | PIP2;5 | 276ALGpSFRSQPHV286 | 1P | S279 |
| PIP27 (270–280) 1P | PIP2;7 | 270ALGpSFRSNATN280 | 1P | S273 |
| PIP27 (270–280) 2P | PIP2;7 | 270ALGpSFRpSNATN280 | 2P | S273 + S276, S276 + T279 |
| PIP27 (270–280) 1P 1Dea | PIP2;7 | 270ALGpSFRSdNATN280 | 1P and 1Dea | 1P: S273; 1Dea: N277 |
| PIP27 (270–280) 2P 1Dea | PIP2;7 | 270ALGpSFRpSdNATN280 | 2P and 1Dea | 2P: S273 + S276; 1Dea: N277 |
| PIP28 (268–278) 1P | PIP2;8 | 268ALApSFRSNPTN278 | 1P | S271 |
This table lists all aquaporin peptides harboring PTMs. The first column indicates the name of the peptide, as referred to in Fig. 4. The second and third columns contain the name of the aquaporin and the peptide sequence, respectively. The last two columns indicate the type and number of PTMs and the position of the modified residue(s). The fragmentations of peptides are detailed in supplemental Fig. S3. Acet, acetylation; Dea, deamidation; Met, methylation; P, phosphorylation; PIP1;1–1;2–1;3–1;4, PIP1;1 and/or PIP1;2 and/or PIP1;3 and/or PIP1;4; PIP1;1–1;2, PIP1;1 and/or PIP1;2; PIP2;1–2;2–2;3, PIP2;1 and/or PIP2;2 and/or PIP2;3.
a A comma indicates the coexistence of different phosphorylation or deamidation sites within a peptide (supplemental Fig. S3).
Fig. 3.
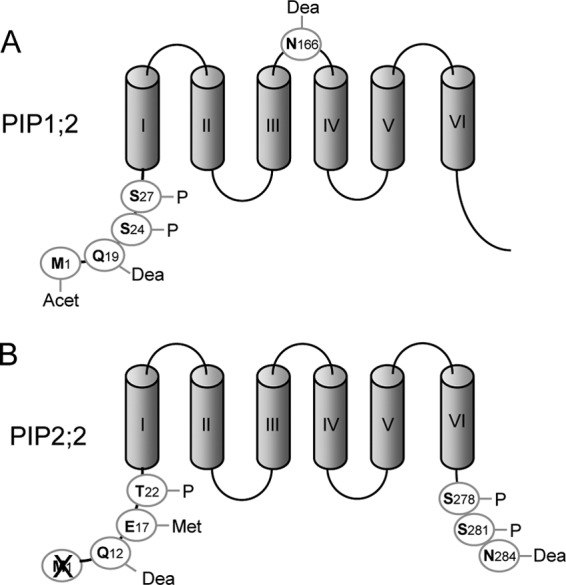
Schematic representation of post-translational modifications identified in PIP1;2 (A) and PIP2;2 (B). Acet, acetylation; Dea, deamidation; P, phosphorylation; Met, methylation. The cross indicates the cleavage of the initiating methionine. The corresponding modified peptides are described in Table I.
Classification of Aquaporin Peptides and Their Modified Forms
A label-free MS approach was developed for comparative quantification of aquaporin peptides between treatments. Hierarchical clustering was then used to classify both unmodified and modified PIP peptides according to treatments (Fig. 4). We considered 55 aquaporin peptides, the quantitative behavior of which was significant in at least 3 treatments (i.e. with p < 0.1) and quantified in at least 7 treatments out of 14 so as to avoid misinterpretation due to missing data (Fig. 4, supplemental Table S3). For mutual comparison of all treatments, quantitative ratios of peptide abundance referring to specific control conditions were normalized to the general control condition. This overall analysis indicated that all treatments clustered with complementary kinetic points of the same or related stimuli (Fig. 4), with the exception of the mantmax treatment, which was surprisingly related to the H2O2 treatments. The good biological consistency of this clustering attests to the quality of the overall proteomic data. The data yielded, however, a very intricate classification of the 55 peptides. A cluster of phosphorylated peptides including the phosphorylation of the N-terminal tail of PIP1 and of the C-terminal tail of PIP2;1–2;3 and PIP2;7 could be distinguished (Fig. 4). The phosphorylation of these peptides increased in darkness, H2O2t1/2, H2O2tmax, and mantmax treatments and decreased in all other treatments except the Nstarv treatment, which showed contrasted phosphorylation behavior (Fig. 4). These data extend previous work showing the role of PIP2;1 phosphorylation during salt and H2O2 responses (15). A general relationship was tentatively established between Lpr and aquaporin phosphorylation (Fig. 5). For each treatment, the mean relative abundance of all phosphorylated PIP peptides was reported to the normalized Lpr value (Fig. 5A). A significant correlation could be established (p = 0.007; Fig. 5A), suggesting that aquaporin phosphorylation positively contributes to Lpr variations.
Fig. 4.
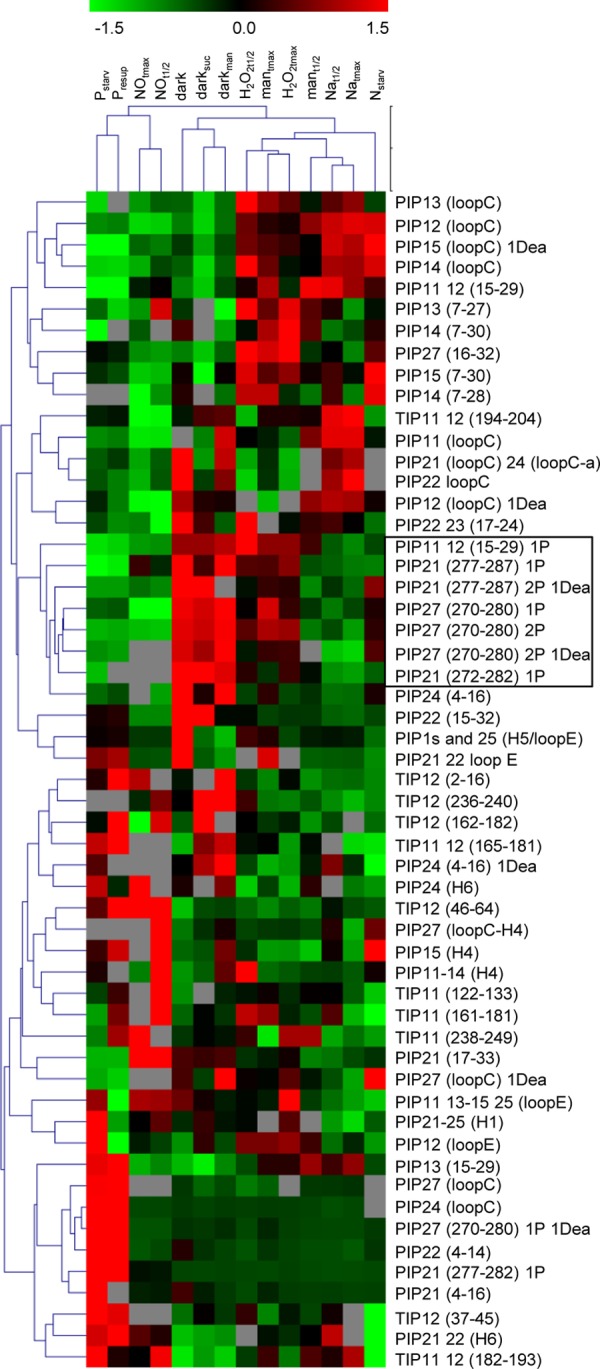
Heat map representation of aquaporin peptide abundance according to treatment. Aquaporin peptides that were unmodified or carrying phosphorylation (P) or deamidation (Dea), alone or in combination, were quantified via label-free MS and clustered using a Euclidian correlation distance metric. Green and red colors indicate down- and up-regulation, respectively (see scale). Gray indicates missing data. Corresponding peptide sequences are described in Table I and supplemental Table S2. Quantitative ratios and corresponding p values before centering and reduction of ratio values are indicated in supplemental Table S3. A cluster of phosphorylated peptides is framed.
Fig. 5.

Relationship between Lpr and abundance of native and modified aquaporins. The mean relative abundance of phosphorylated PIP peptides (A) and of proteotypic peptides for PIP1s (B), PIP2s (C), and TIPs (D) was related to Lpr in NaCltmax, mantmax, H2O2tmax, NOtmax, dark, darksuc, darkman, Nstarv, Pstarv, and Presup conditions. All Lpr values were normalized with respect to Lpr in corresponding control conditions. A, phosphorylated PIP peptides are PIP11 12 (15–29) 1P, PIP21 (277–282) 1P, PIP21 (277–287) 1P, PIP21 (272–282) 1P, PIP21 (277–287) 2P1Dea, PIP27 (270–280) 1P, PIP27 (270–280) 1P 1Dea, PIP27 (270–280) 2P, and PIP27 (270–280) 2P 1Dea (see nomenclature in Table I). B, PIP1 proteotypic peptides are PIP12 (loop E), PIP13 (7–27), PIP14 (7–30), and PIP15 (7–30). C, PIP2 proteotypic peptides are PIP21 (17–33), PIP22 (15–32), PIP24 (H6) PIP27 (16–32), and PIP27 (loop C-H4). D, TIP proteotypic peptides are TIP11 (122–133), TIP11 (161–181), TIP11 (238–249), TIP12 (1–15), TIP12 (37–45), TIP12 (45–63), TIP12 (161–181), and TIP12 (235–239). Regression coefficients (R2) and p values are indicated.
Aquaporin Abundance According to Treatment
Because variations of Lpr could also be due to primary changes in aquaporin abundance, we then focused our analysis on PIP and TIP expression levels in plants exposed to the osmotic, oxidative, or nutritional constraints described above. For this, we considered the abundance of proteotypic aquaporin peptides that can be considered as indicators of the abundance of the entire protein, provided that they are not modifiable. Five PIP1, five PIP2, and eight TIPs could be selected according to these criteria (supplemental Fig. S5). Because not all PIP aquaporins could be quantified through this approach, we also made use of an additional quantification method (i.e. ELISA) using anti-PIP1 antibody that recognized PIP1;1 to -1;4 isoforms and anti-PIP2 antibody that recognized PIP2;1 to -2;3 isoforms (27). Supplemental Fig. S5A indicates that the PIP1 peptides showed decreased abundance after NOtmax treatment, and that this decrease was not as complete after NOt1/2. This result was confirmed using an ELISA assay with anti-PIP1 antibodies (supplemental Fig. S5C). All PIP1 peptides also showed decreased abundance in response to a Natmax treatment (supplemental Fig. S5A), as already shown by ELISA measurements (22). We also noticed a global decrease of PIP2 peptides in these conditions (supplemental Fig. S5B). Regarding nutritional constraints, the decrease in PIP2;1, PIP2;2, PIP2;4, PIP1;2, and PIP1;3 abundance in response to Nstarv and Presup treatments was confirmed by ELISA assays (supplemental Fig. S5C). Interestingly, the abundance of TIP1;1 and TIP1;2 showed marked variation in response to several treatments. The abundance of all detected TIP1;1 and TIP1;2 decreased in response to Natmax, dark, and Nstarv treatments (supplemental Fig. S5D). In contrast, all TIP1;1 and TIP1;2 peptides showed increased abundance upon Presup (supplemental Fig. S5D). In a global analysis across all treatments, we considered normalized Lpr values and the mean relative abundance of peptides proteotypic for PIP1 (Fig. 5B), PIP2 (Fig. 5C), or TIPs (Fig. 5D). These analyses did not reveal any significant correlation between Lpr and PIP1 or TIP abundance (Figs. 5B, 5D). In contrast, a significant correlation could be detected between PIP2 abundance and Lpr, but with a low regression coefficient value (R2 = 0.20) (Fig. 5C). In summary, this study indicates that changes in Lpr are not commonly determined by changes in PIP1 or TIP abundance. They may depend, albeit to a low extent, on changes in PIP2 abundance. Such changes may contribute to more significant Lpr variations in a restricted number of treatments such as NaCltmax, NOtmax, and Nstarv (supplemental Table S4).
Deamidation of PIP Aquaporins
Interestingly, the deamidation status of peptides of several PIPs showed quantitative variations according to treatment, independent of the behavior of the nonmodified peptide counterpart (Fig. 4). This was particularly the case for the deamidated form of loop C of PIP2;7 under dark conditions and of the N-terminal tail of PIP2;4 upon mannitol, H2O2, and Nstarv treatments (Fig. 4, Figs. 6A and 6B). Deamidation was also related to phosphorylation in the C-terminal tail of several PIP2 aquaporins (Table I), where it showed specific quantitative variations according to treatments (Fig. 4, Figs. 6C and 6D). Under NaCl stress, the deamidated form of a diphosphorylated PIP2;1 peptide (PIP2;1 (277–287) 2P 1Dea) showed kinetic behavior that mirrored that of the corresponding nondeamidated form (PIP2;1 (277–287) 2P) (Fig. 4, Fig. 6C). In addition, the deamidated form of monophosphorylated PIP2;7 (PIP2;7 (270–280) 1P 1Dea) increased relative to the nondeamidated form, in several conditions (i.e. mantmax, dark, Nstarv, Pstarv) (Fig. 4, Fig. 6D).
Fig. 6.

Variation profiles according to treatments of deamidated and corresponding nondeamidated PIP peptides. The figure shows the relative changes in abundance of specific peptides, either deamidated (black bars) or not (white bars), in response to the indicated treatments. A, PIP27 (loop C) and PIP27 (loop C) 1Dea. B, PIP24 (4–16) and PIP2;4 (4–16) 1Dea. C, PIP21 (277–287) 2P and PIP21 (277–287) 2P 1Dea. D, PIP27 (277–280) 1P and PIP27 (277–280) 1P 1Dea. Peptide nomenclature is according to Table I and supplemental Table S1. p values < 0.1 are indicated.
DISCUSSION
The central aim of this work was to search for general molecular mechanisms involved in the regulation of root aquaporin function. For this, we characterized a large set of physiological contexts known to possibly modulate Lpr. These contexts were then used to develop a comprehensive proteomic analysis of root aquaporins.
Arabidopsis Root Is Highly and Specifically Responsive to Different Abiotic Treatments
One early achievement of this work was the identification of nine physiological contexts that modulate root hydraulics in the same plant species, in time frames of minutes (NO and H2O2 treatments), hours (mannitol and NaCl treatments, exposure to darkness and reversal with sucrose, phosphate supply to phosphate-starved roots), or days (phosphate or nitrogen starvation). All treatments induced inhibition of root water transport except for sucrose or phosphate resupply to dark-grown or phosphate-starved plants, respectively. Abscisic acid is another well-known Lpr regulator in several plant species (1). However, this hormone had no effect on Arabidopsis root water transport in our experimental conditions (data not shown). The inhibition of Lpr in response to hyperosmotic treatment or reactive oxygen species has already been reported in many species, including Arabidopis (22, 31), but the present work provides the first evidence of effects of active nitrogen species on root water transport. A role for NO, an important molecule in plant stress signaling, in aquaporin regulation during rice seed germination has been proposed (37). A thorough examination of root hydraulic responses to major plant nutrients or metabolites (phosphate, nitrate, and sugars) revealed highly specific responses. In the case of nutrient deprivation, this could reflect distinct morphological responses. For instance, phosphate starvation did not modify root mass (supplemental Fig. S2A) but decreased shoot mass by 55% (supplemental Fig. S2B), whereas nitrate starvation enhanced root DW by 100% (supplemental Fig. S2D) without inducing any change in shoot DW (supplemental Fig. S2E). The accompanying adjustments of root hydraulics may be somewhat related to these differential shoot-to-root alterations. For instance, the decreased Lpr of nitrate-starved plants can be interpreted as maintenance of the whole root hydraulic capacity (conductance) while the root absorption surface is increased to match the unchanged water demand for shoot growth and transpiration. In contrast, the decreased Lpr of phosphate-starved plants may represent a direct adjustment to a reduced water demand of growth-inhibited shoots.
Although most abiotic stresses result in the inhibition of root water transport, nutrient supply to nutrient-starved plants was also investigated as a possible context for studying rapid stimulus-induced up-regulation of Lpr. In contrast to phosphate resupply, which had such effects, no change in Lpr was observed after a 1-day resupply of nitrate to nitrate-starved plants. Here, we typically face a species-specific response, as a similar nitrate treatment stimulates Lpr in birdsfoot (38–40), tomato, cucumber (41), maize (40), or sunflower (38).
Carbon metabolites were investigated as still another type of physiological stimulus. Interestingly, Lpr was increased by 40% after sucrose resupply to plants cultivated in prolonged darkness. By contrast, a similar treatment in plants cultivated in the light inhibited Lpr by ∼30% after 4 h (Fig. 2B). This inhibition was similar to that obtained by treating plants with 30 mm mannitol. Thus, sucrose exerts an inhibitory or a stimulatory effect when it is supplied to plants cultivated in light or darkness conditions, respectively.
Relationships between Aquaporin Abundance and Root Water Permeability
Aquaporin abundance is thought to be a critical determinant of Lpr. In support of this, we recently showed that a double pip2;1 × pip2;2 knock-out mutant shows a 40% decrease in Lpr in control culture conditions (42). In addition, we recently quantified PIP aquaporins from roots using a multiple-reaction monitoring approach and showed that PIP1;1, PIP1;2, PIP2;1, PIP2;2, PIP2;4, and PIP2;7 aquaporins are the major aquaporin isoforms expressed in roots, in amounts from 70 to 280 pmol/mg of membrane proteins (43). Thus, the regulation of their abundance, as native or modified forms, should highly contribute to the observed changes in Lpr. Based on the physiological studies of the present work, we developed a thorough proteomic approach with peptide fractionation to quantify the abundance of specific PIP and TIP isoforms. In these respects, quantitative proteomics revealed that several treatments resulting in Lpr inhibition induced a prominent decrease in the abundance of some PIP1 and PIP2 isoforms (supplemental Fig. S5). In particular, the decreased abundance of PIP1 in NOtmax appears as a pretty unique context in which a rapid degradation (<20 min) of PIP isoforms can be observed. A weak overall dependence of Lpr on PIP2 abundance was also detected (Fig. 5C). We note, however, that an inhibition of Lpr was not systematically associated with a decreased abundance of PIP, and vice versa (Fig. 5). Thus, PIP abundance is not the only determinant of Lpr. TIPs represent other interesting aquaporin candidates for the regulation of root water transport. Parallel changes in Lpr and TIP abundance were punctually observed upon Natmax, Nstarv, and dark conditions that inhibited Lpr and upon Presup, which stimulated Lpr (supplemental Fig. S5D). TIPs may contribute to transcellular water transport or, alternatively, cytoplasm osmoregulation in concert with PIPs. Although genetic evidence supporting a role of TIPs in root water transport is lacking, a few studies have suggested a role for TIPs in salt stress responses. For instance, the overexpression of a soybean TIP2 isoform in transgenic Arabidopsis resulted in an increased plant sensitivity to salt stress (44). By contrast, Arabidopsis plants overexpressing a ginger TIP1 isoform became able to germinate and grow at high NaCl concentrations (150 mm) (45). However, the present study indicated that TIP abundance is not a major determinant of Lpr (Fig. 5D).
In summary, our study indicates that the modulation of Lpr cannot be accounted for exclusively by modulations in PIP or TIP abundance. In view of the sensitivity of our MS analysis, it is very unlikely that an aquaporin isoform that would play a major role in root water transport was missed in our study. These results prompted us to investigate PTMs as another mode of aquaporin regulation in roots under abiotic and nutritional constraints.
Coordinated Post-translational Events to Regulate Aquaporin Function
In line with previous studies (13–17), the present work highlights the diversity of aquaporin phosphorylated forms. It also points to combinations of various PTMs within a single aquaporin, including phosphorylation, methylation, deamidation, and acetylation (Fig. 3). The hierarchical clustering of PIP peptides shown in Fig. 4 indicated that modified peptides showed variations profiles that were somewhat more coordinated than those of their unmodified counterparts. A previous study using an absolute quantification MS methodology showed that 2- or 4-h treatments with 100 mm NaCl induced an increased abundance of the (PIP21 (277–287) 2P) peptide form, whereas a 15-min treatment with 2 mm H2O2 induced a decrease of the (PIP21 (277–287) 1P) form (15). The present label-free quantification data are in full agreement with this previous study (15), which validates the label-free strategy used here.
The present work further revealed coordinated changes in phosphorylation in the N-terminal tail of PIP1;1–1;2 and in the C-terminal tail of five PIP2 aquaporins (PIP2;1–PIP2;4 and PIP2;7) and showed that, in contrast to aquaporin cellular abundance, the extent of aquaporin phosphorylation is a predominant parameter for controlling Lpr (Fig. 5A). Sequence alignment showed that two phosphorylation sites were conserved among the five PIP2 aquaporins (supplemental Fig. S6A). The first site, corresponding to Ser280 in AtPIP2;1, is homologous to Ser274 of SoPIP2;1, the phosphorylation of which enhances the opening of the aquaporin pore (5, 13). Phosphorylation of the second site, Ser283 in AtPIP2;1, was shown to promote targeting of this aquaporin to the plasma membrane and to interfere with its intracellular sorting after stress-induced internalization (15). Therefore, we propose that a decrease in Lpr associated with decreased PIP2 phosphorylation involves both gating and regulated trafficking of PIPs. Conversely, the increased phosphorylation of the same two sites may contribute to the Lpr increase induced by sucrose resupply to plants cultivated in prolonged darkness. We note, however, that Ser280 and Ser283 phosphorylation and Lpr showed opposite variations under some other treatments (mantmax, H2O2 treatments, dark, darkman, Nstarv, P starvation). This suggests the involvement of other post-translational regulatory mechanisms.
Deamidation appeared as another prominent PTM in Arabidopsis root aquaporins. This modification was also identified in 16% of microsomal proteins (i.e. 206 out of 1291 proteins; supplemental Table S1). Given that 8 out of 12 PIPs were found to be deamidated, this modification seems to more frequently affect PIP aquaporins than other membrane proteins. Deamidation possibly interferes with protein stability, protein activation, and protein–protein interactions (46–51). In mammalian AQP0, several sites of N-terminal truncation have been identified as sites of Asn deamidation (52, 53). This age-related PTM, together with other PTMs, including phosphorylation, is supposed to serve as a molecular clock (54) to regulate AQP0 function. Nonenzymatic deamidation of Asn (N) and Gln (Q) residues may also occur spontaneously during sample preparation (55). In this case, Asn deamidation tends to preferentially occur at NG, NS, and ND sequences, whereas Gln deamidation occurs at QV, QL, QG, and, to a lesser extent, QA and QE sequences (56). Among the deamidated Asn residues identified in this study, only one corresponded to an NG sequence (Table I). In addition, the abundance of the identified deamidated peptides showed quantitative variation according to the treatment (Figs. 4 and 6), reinforcing the notion that the deamidated residues observed in PIPs reflect genuine PTMs occurring in planta.
Interestingly, we observed that deamidation was closely associated with phosphorylation in C-terminal PIP2 peptides. This observation may provide a clue to explain how an apparent increase in PIP2 C-terminal phosphorylation could be associated with a decrease in Lpr (Fig. 4). A typical case is PIP2;7, for which the abundance of the monophosphorylated form ((PIP27 (270–280) 1P) and that of the same form with an additional deamidation ((PIP27 (270–280) 1P1Dea) showed opposite behaviors. It remains unknown whether or how neighboring deamidation and phosphorylation could interfere to alter protein function (57). Deamidation was also identified at a conserved Asn residue in loop C of several PIPs (Table I, supplemental Fig. S6B). In the case of AtPIP2;7, molecular modeling according to the previously described SoPIP2;1 structure (5) indicated that the deamidated Asn152 residue is located at the entrance of the pore, close (<5 Å) to Arg224 (supplemental Fig. S7). The latter residue contributes to one of the main pore constrictions (aromatic residue/Arg) involved in substrate specificity. Deamidation—that is, the replacement of an amide with a carboxyl group—introduces a negative charge at physiological pH and may thereby interfere with aquaporin action.
CONCLUSION
In the present study, we used a large panel of abiotic and nutritional stimuli to search for aquaporin peptides that show quantitative variations consistent with the regulation of root water transport. We describe a high diversity of PIP response profiles concerning both aquaporin abundance and PTMs. Thus, PIP and TIP aquaporins undergo a combination of several regulatory mechanisms, including (i) the regulation of protein abundance, mainly involved in NaCl, NO, and N starvation treatments; (ii) the modulation of the phosphorylation state of the N-terminal tail of PIP1;1–1;2 and the C-terminal tail of PIP2;1–2;3 and PIP2;7, which appears to be a predominant factor controlling Lpr; and (iii) the deamidation of Asn and Gln residues. The possible effects of deamidation on aquaporin function, which clearly deserve further experimental work, may provide new perspectives in membrane protein research.
Supplementary Material
Acknowledgments
We thank Dr. Lionel Verdoucq for help in AtPIP2;7 structural modeling and Cécile Fizames for help in analyzing MS data.
Footnotes
* This research work was supported by a grant from the Agence Nationale de la Recherche (PhosphoStim, ANR-08-GENM-013).
 This article contains supplemental material.
1 The abbreviations used are:
- DEA-NO
- diethylamine NONOate
- DW
- dry weight
- Jv
- sap flow
- Lpr
- root hydraulic conductivity
- mantmax
- treatment with 200 mm mannitol for 4 h
- NOtmax
- treatment with 125 μm diethylamine NONOate for 18 min
- Nstarv
- starved in nitrate for 6 days
- PIP
- plasma membrane intrinsic protein
- Presup
- phosphate resupply to plants starved in phosphate for 6 days
- PTM
- post-translational modification
- TIP
- tonoplast intrinsic protein.
REFERENCES
- 1. Maurel C. (2008) Plant aquaporins: novel functions and regulation properties. FEBS Lett. 581, 2227–2236 [DOI] [PubMed] [Google Scholar]
- 2. Kaldenhoff R., Ribas-Carbo M., Flexas J., Lovisolo C., Heckwolf M., Uehlein N. (2008) Aquaporins and plant water balance. Plant Cell Environ. 31, 658–666 [DOI] [PubMed] [Google Scholar]
- 3. Maurel C., Verdoucq L., Luu D.-T., Santoni V. (2008) Plant aquaporins: membrane channels with multiple integrated functions. Annu. Rev. Plant Biol. 59, 595–624 [DOI] [PubMed] [Google Scholar]
- 4. Fujiyoshi Y., Mitsuoka K., de Groot B. L., Philippsen A., Grubmuller H., Agre P., Engel A. (2002) Structure and function of water channels. Curr. Opin. Struct. Biol. 12, 509–515 [DOI] [PubMed] [Google Scholar]
- 5. Tornroth-Horsefield S., Wang Y., Hedfalk K., Johanson U., Karlsson M., Tajkhorshid E., Neutze R., Kjellbom P. (2006) Structural mechanism of plant aquaporin gating. Nature 439, 688–694 [DOI] [PubMed] [Google Scholar]
- 6. Johanson U., Karlsson M., Johansson I., Gustavsson S., Sjövall S., Fraysse L., Weig A. R., Kjellbom P. (2001) The complete set of genes encoding major intrinsic proteins in Arabidopsis provides a framework for a new nomenclature for major intrinsic proteins in plants. Plant Physiol. 126, 1–12 [DOI] [PMC free article] [PubMed] [Google Scholar]
- 7. Quigley F., Rosenberg J. M., Shachar-Hill Y., Bohnert H. J. (2002) From genome to function: the Arabidopsis aquaporins. Genome Biol. 3, 1–17 [DOI] [PMC free article] [PubMed] [Google Scholar]
- 8. Ishikawa F., Suga S., Uemura T., Sato M. H., Maeshima M. (2005) Novel type aquaporins SIPs are mainly localized to the ER membrane and show cell-specific expression in Arabidopsis thaliana. FEBS Lett. 579, 5814–5820 [DOI] [PubMed] [Google Scholar]
- 9. Javot H., Lauvergeat V., Santoni V., Martin F., Güclü J., Vinh J., Heyes J., Franck K. I., Schäffner A. R., Bouchez D., Maurel C. (2003) Role for a single aquaporin isoform in root water uptake. Plant Cell 15, 509–522 [DOI] [PMC free article] [PubMed] [Google Scholar]
- 10. Javot H., Maurel C. (2002) The role of aquaporins in root water uptake. Ann. Bot. 90, 301–313 [DOI] [PMC free article] [PubMed] [Google Scholar]
- 11. Martre P., Morillon R., Barrieu F., North G. B., Nobel P. S., Chrispeels M. J. (2002) Plasma membrane aquaporins play a significant role during recovery from water deficit. Plant Physiol. 130, 2101–2110 [DOI] [PMC free article] [PubMed] [Google Scholar]
- 12. Siefritz F., Tyree M. T., Lovisolo C., Schubert A., Kaldenhoff R. (2002) PIP1 plasma membrane aquaporins in tobacco: from cellular effects to functions in plants. Plant Cell 14, 869–876 [DOI] [PMC free article] [PubMed] [Google Scholar]
- 13. Johansson I., Karlsson M., Shukla V. K., Chrispeels M. J., Larsson C., Kjellbom P. (1998) Water transport activity of the plasma membrane aquaporin PM28A is regulated by phosphorylation. Plant Cell 10, 451–459 [DOI] [PMC free article] [PubMed] [Google Scholar]
- 14. Johansson I., Larsson C., Ek B., Kjellbom P. (1996) The major integral proteins of spinach leaf plasma membranes are putative aquaporins and are phosphorylated in response to Ca2+ and apoplastic water potential. Plant Cell 8, 1181–1191 [DOI] [PMC free article] [PubMed] [Google Scholar]
- 15. Prak S., Hem S., Boudet J., Viennois J., Sommerer N., Rossignol R., Maurel C., Santoni V. (2008) Multiple phosphorylations in the C-terminal tail of plant plasma membrane aquaporins. Role in sub-cellular trafficking of AtPIP2;1 in response to salt stress. Mol. Cell. Proteomics 7, 1019–1030 [DOI] [PubMed] [Google Scholar]
- 16. Kline K. G., Barrett-Wilt G. A., Sussman M. R. (2010) In planta changes in protein phosphorylation induced by the plant hormone abscisic acid. Proc. Natl. Acad. Sci. U.S.A. 107:15986–15991 [DOI] [PMC free article] [PubMed] [Google Scholar]
- 17. Niittylä T., Fuglsang A. T., Palmgren M. G., Frommer W. B., Schulze W. X. (2007) Temporal analysis of sucrose-induced phosphorylation changes in plasma membrane proteins of Arabidopsis. Mol. Cell. Proteomics 6, 1711–1726 [DOI] [PubMed] [Google Scholar]
- 18. Engelsberger W. R., Schulze W. X. (2012) Nitrate and ammonium lead to distinct global dynamic phosphorylation patterns when resupplied to nitrogen-starved Arabidopsis seedlings. Plant J. 69, 978–995 [DOI] [PMC free article] [PubMed] [Google Scholar]
- 19. Sahr T., Adam T., Fizames C., Maurel C., Santoni V. (2010) O-carboxyl- and N-methyltransferases active on plant aquaporins. Plant Cell Physiol. 51, 2092–2104 [DOI] [PubMed] [Google Scholar]
- 20. Santoni V., Verdoucq L., Sommerer N., Vinh J., Pflieger D., Maurel C. (2006) Methylation of aquaporins in plant plasma membrane. Biochem. J. 400, 189–197 [DOI] [PMC free article] [PubMed] [Google Scholar]
- 21. Lee H. K., Cho S. K., Son O., Xu Z., Hwang I., Kim W. T. (2009) Drought stress-induced Rma1H1, a RING membrane-anchor E3 ubiquitin ligase homolog, regulates aquaporin levels via ubiquitination in transgenic arabidopsis plants. Plant Cell 21, 622–641 [DOI] [PMC free article] [PubMed] [Google Scholar]
- 22. Boursiac Y., Chen S., Luu D.-T., Sorieul M., van den Dries N., Maurel C. (2005) Early effects of salinity on water transport in Arabidopsis roots. Molecular and cellular features of aquaporin expression. Plant Physiol. 139, 790–805 [DOI] [PMC free article] [PubMed] [Google Scholar]
- 23. Murashige T., Skoog F. (1962) A revised medium for rapid growth and bioassays with tobacco tissue cultures. Physiol. Plant. 15, 473–497 [Google Scholar]
- 24. Besson-Bard A., Griveau S., Bedioui F., Wendehenne D. (2008) Real-time electrochemical detection of extracellular nitric oxide in tobacco cells exposed to cryptogein, an elicitor of defence responses. J. Exp. Bot. 59, 3407–3414 [DOI] [PMC free article] [PubMed] [Google Scholar]
- 25. Goldstein S., Russo A., Samuni A. (2003) Reactions of PTIO and carboxy-PTIO with (NO)-N-center dot, (NO2)-N-center dot, and O-2(center dot). J. Biol. Chem. 278, 50949–50955 [DOI] [PubMed] [Google Scholar]
- 26. Stoscheck C. M. (1990) Quantitation of proteins. Methods Enzymol. 182, 50–68 [DOI] [PubMed] [Google Scholar]
- 27. Santoni V., Vinh J., Pflieger D., Sommerer N., Maurel C. (2003) A proteomic study reveals novel insights into the diversity of aquaporin forms expressed in the plasma membrane of plant roots. Biochem. J. 373, 289–296 [DOI] [PMC free article] [PubMed] [Google Scholar]
- 28. Wiœniewski J. R., Zougman A., Nagaraj N., Mann M. (2009) Universal sample preparation method for proteome analysis. Nat. Methods 6, 359–362 [DOI] [PubMed] [Google Scholar]
- 29. Kyono Y., Sugiyama N., Imami K., Tomita M., Ishihama Y. (2008) Successive and selective release of phosphorylated peptides captured by hydroxy acid-modified metal oxide chromatography. J. Proteome Res. 7, 4585–4593 [DOI] [PubMed] [Google Scholar]
- 30. Li Q. R., Ning Z. B., Tang J. S., Nie S., Zeng R. (2009) Effect of peptide-to-TiO2 beads ratio on phosphopeptide enrichment selectivity. J. Proteome Res. 8, 5375–5381 [DOI] [PubMed] [Google Scholar]
- 31. Boursiac Y., Prak S., Boudet J., Postaire O., Luu D.-T., Tournaire-Roux C., Santoni V., Maurel C. (2008) The response of Arabidopsis root water transport to a challenging environment implicates reactive oxygen species- and phosphorylation-dependent internalization of aquaporins. Plant Signal. Behav. 3, 1096–1098 [DOI] [PMC free article] [PubMed] [Google Scholar]
- 32. Lopez-Bucio J., Cruz-Ramirez A., Herrera-Estrella L. (2003) The role of nutrient availability in regulating root architecture. Curr. Opin. Plant Biol. 6, 280–287 [DOI] [PubMed] [Google Scholar]
- 33. Sutka M., Li G. W., Boudet J., Boursiac Y., Doumas P., Maurel C. (2011) Natural variation of root hydraulics in Arabidopsis grown in normal and salt-stressed conditions. Plant Physiol. 155, 1264–1276 [DOI] [PMC free article] [PubMed] [Google Scholar]
- 34. Prado K., Boursiac Y., Tournaire-Roux C., Monneuse J. M., Postaire O., Da Ines O., Schäffner A. R., Hem S., Santoni V., Maurel C. (2013) Regulation of Arabidopsis leaf hydraulics involves light-dependent phosphorylation of aquaporins in veins. Plant Cell 25, 1029–1039 [DOI] [PMC free article] [PubMed] [Google Scholar]
- 35. Höfte H., Hubbard L., Reizer J., Ludevid D., Herman E. M., Chrispeels M. J. (1992) Vegetative and seed-specific forms of tonoplast intrinsic protein in the vacuolar membrane of Arabidopsis thaliana. Plant Physiol. 99, 561–570 [DOI] [PMC free article] [PubMed] [Google Scholar]
- 36. Soto G., Alleva K., Mazzella M. A., Amodeo G., Muschietti J. P. (2008) AtTIP1;3 and AtTIP5;1, the only highly expressed Arabidopsis pollen-specific aquaporins, transport water and urea. FEBS Lett. 582, 4077–4082 [DOI] [PubMed] [Google Scholar]
- 37. Liu H. Y., Yu X., Cui D. Y., Sun M. H., Sun W. N., Tang Z. C., Kwak S. S., Su W. A. (2007) The role of water channel proteins and nitric oxide signaling in rice seed germination. Cell Res. 17, 638–349 [DOI] [PubMed] [Google Scholar]
- 38. Clarkson D. T., Carvajal M., Henzler T., Waterhouse R. N., Smyth A. J., Cooke D. T., Steudle E. (2000) Root hydraulic conductance: diurnal aquaporin expression and the effects of nutrient stress. J. Exp. Bot. 51, 61–70 [PubMed] [Google Scholar]
- 39. Gorska A., Ye Q., Holbrook N. M., Zwieniecki M. A. (2008) Nitrate control of root hydraulic properties in plants: translating local information to whole plant response. Plant Physiol. 148, 1159–1167 [DOI] [PMC free article] [PubMed] [Google Scholar]
- 40. Prosser I. M., Massonneau A., Smyth A. J., Waterhouse R. N., Forde B. G., Clarkson D. T. (2006) Nitrate assimilation in the forage legume Lotus japonieus L. Planta 223, 821–834 [DOI] [PubMed] [Google Scholar]
- 41. Gloser V., Zwieniecki M. A., Orians C. M., Holbrook N. M. (2007) Dynamic changes in root hydraulic properties in response to nitrate availability. J. Exp. Bot. 10, 2409–2415 [DOI] [PubMed] [Google Scholar]
- 42. Peret B., Li G. W., Zhao J., Band L. R., Voss U., Postaire O., Luu D. T., Da Ines O., Casimiro I., Lucas M., Wells D. M., Lazzerini L., Nacry P., King J. R., Jensen O. E., Schaffner A. R., Maurel C., Bennett M. J. (2012) Auxin regulates aquaporin function to facilitate lateral root emergence. Nat. Cell Biol. 14, 991–998 [DOI] [PubMed] [Google Scholar]
- 43. Monneuse J. M., Sugano M., Becue T., Santoni V., Hem S., Rossignol M. (2011) Towards the profiling of the Arabidopsis thaliana plasma membrane transportome by targeted proteomics. Proteomics 11, 1789–1797 [DOI] [PubMed] [Google Scholar]
- 44. Wang X., Li Y., Ji W., Bai X., Cai H., Zhu D., Sun X. L., Chen L. J., Zhu Y. M. (2011) A novel glycine soja tonoplast intrinsic protein gene responds to abiotic stress and depresses salt and dehydration tolerance in transgenic Arabidopsis thaliana. J. Plant Physiol. 168, 1241–1248 [DOI] [PubMed] [Google Scholar]
- 45. Peng Y., Lin W., Cai W., Arora R. (2007) Overexpression of a Panax ginseng tonoplast aquaporin alters salt tolerance, drought tolerance and cold acclimation ability in transgenic Arabidopsis plants. Planta 226:729–740 [DOI] [PubMed] [Google Scholar]
- 46. Flatau G., Lemichez E., Gauthier M., Chardin P., Paris S., Fiorentini C., Boquet P. (1997) Toxin-induced activation of the G protein p21 Rho by deamidation of glutamine. Nature 387, 729–733 [DOI] [PubMed] [Google Scholar]
- 47. Geiger T., Clarke S. (1987) Deamidation, isomerization, and racemization at asparaginyl and aspartyl residues in peptides—succimide-linked reactions that contribute to protein-degradation. J. Biol. Chem. 262, 785–794 [PubMed] [Google Scholar]
- 48. Lerm M., Selzer J., Hoffmeyer A., Rapp U. R., Aktories K., Schmidt G. (1999) Deamidation of Cdc42 and Rac by Escherichia coli cytotoxic necrotizing factor 1: activation of cJun N-terminal kinase in HeLa cells. Infect. Immun. 67, 496–503 [DOI] [PMC free article] [PubMed] [Google Scholar]
- 49. Schmidt G., Sehr P., Wilm M., Selzer J., Mann M., Aktories K. (1997) Gln 63 of Rho is deamidated by Escherichia coli cytotoxic necrotizing factor-1. Nature 387, 725–729 [DOI] [PubMed] [Google Scholar]
- 50. Visvikis O., Maddugoda M. P., Lemichez E. (2010) Direct modifications of Rho proteins: deconstructing GTPase regulation. Biol. Cell 102, 377–389 [DOI] [PubMed] [Google Scholar]
- 51. Curnis F., Longhi R., Crippa L., Cattaneo A., Dondossola E., Bachi A., Corti A. (2006) Spontaneous formation of L-isoaspartate and gain of function in fibronectin. J. Biol. Chem. 281, 36466–36476 [DOI] [PubMed] [Google Scholar]
- 52. Ball L. E., Garland D. L., Crouch R. K., Schey K. L. (2004) Post-translational modifications of aquaporin-0 (AQP0) in the normal human lens: spatial and temporal occurrence. Biochemistry 43, 9856–9865 [DOI] [PubMed] [Google Scholar]
- 53. Schey K. L., Little M., Fowler J. G., Crouch R. K. (2000) Characterization of human lens major intrinsic protein structure. Invest. Ophthalmol. Vis. Sci. 41, 175–182 [PubMed] [Google Scholar]
- 54. Robinson N. E., Robinson A. B. (2001) Deamidation of human proteins. Proc. Natl. Acad. Sci. U.S.A. 98, 12409–12413 [DOI] [PMC free article] [PubMed] [Google Scholar]
- 55. Li X. J., Cournoyer J. J., Lin C., O'Cormora P. B. (2008) Use of O-18 labels to monitor deamidation during protein and peptide sample processing. J. Am. Soc. Mass Spectrom. 19, 855–864 [DOI] [PMC free article] [PubMed] [Google Scholar]
- 56. Hao P. L., Ren Y., Alpert A. J., Sze S. K. (2011) Detection, evaluation and minimization of nonenzymatic deamidation in proteomic sample preparation. Mol. Cell. Proteomics 10 M0111.009381. [DOI] [PMC free article] [PubMed] [Google Scholar]
- 57. Tholey A., Pipkorn R., Bossemeyer D., Kinzel V., Reed J. (2001) Influence of myristoylation, phosphorylation, and deamidation on the structural behavior of the N-terminus of the catalytic subunit of CAMP-dependent protein kinase. Biochemistry 40, 225–231 [DOI] [PubMed] [Google Scholar]
Associated Data
This section collects any data citations, data availability statements, or supplementary materials included in this article.