

Abstract
In protein environments, proton transfer reactions occur along polar or charged residues and isolated water molecules. These species consist of H-bond networks that serve as proton transfer pathways; therefore, thorough understanding of H-bond energetics is essential when investigating proton transfer reactions in protein environments. When the pKa values (or proton affinity) of the H-bond donor and acceptor moieties are equal, significantly short, symmetric H-bonds can be formed between the two, and proton transfer reactions can occur in an efficient manner. However, such short, symmetric H-bonds are not necessarily stable when they are situated near the protein bulk surface, because the condition of matching pKa values is opposite to that required for the formation of strong salt bridges, which play a key role in protein–protein interactions. To satisfy the pKa matching condition and allow for proton transfer reactions, proteins often adjust the pKa via electron transfer reactions or H-bond pattern changes. In particular, when a symmetric H-bond is formed near the protein bulk surface as a result of one of these phenomena, its instability often results in breakage, leading to large changes in protein conformation.
Keywords: proton transfer reactions, low-barrier hydrogen bond, protein crystal structure
1. Introduction
Proton transfer reactions play key roles in energy conversion processes in biological systems, including photosynthesis and respiration. In the O2-evolving complex, photosystem II (PSII), removal of subproduct protons from the catalytic site within the protein (2H2O → O2 + 4H+ + 4e−) is essential for the water-splitting reaction to proceed (see [1] for the most recently reported crystal structure). Proton pump proteins, bacteriorhodopsin for example, are linked to ATP synthase, as a proton gradient is the driving force for ATP synthesis [2–4]. In contrast to the bulk solvent, where proton carriers, for example water molecules, are readily available, in protein environments, the presence of such molecules is strictly limited. In order to overcome this, proteins use a proton transfer pathway comprised ionizable residues, polar residues and water molecules. These polar groups form an H-bond network. Thus, it is essential to understand H-bond energetics before we focus on specific proton transfer pathways in protein environments.
2. Classification of H-bonds and their characteristics
A typical H-bond consists of donor and acceptor moieties, with their characters differentiated by their pKa values (table 1). As widely observed in ionizable groups, a proton is more likely to populate the moiety with the higher pKa value out of the two, with this serving as the H-bond donor, and that with the lower pKa serving as the H-bond acceptor.
Table 1.
Comparison between symmetric H-bonds and asymmetric H-bonds.
| single-well H-bond, LBHB | standard H-bond | |
|---|---|---|
| potential shape | symmetric | asymmetric |
| pKa difference | close to zero | present |
| donor–acceptor length | short | long |
| coupling | large | small |
| proton transfer | most efficienta | unfavourable |
| salt-bridge character | low | high |
| stability (in protein) | less stableb | stable |
| in particular when ‘pKa matching’ is satisfied transiently near the protein bulk surface → often leading to conformational changesc |
2.1. H-bond length and NMR chemical shift
It has been suggested that a strong H-bond results in a more downfield 1H nuclear magnetic resonance (NMR) chemical shift. According to the classification of H-bonds by Jeffrey [12] or Frey [13], single-well H-bonds (or symmetrical H-bonds [14]) are typically very short, with O–O distances of 2.4–2.5 Å, and display 1H NMR chemical shifts (δH) of 20–22 ppm [13] (figure 1). Low-barrier H-bonds (LBHBs) are longer at 2.5–2.6 Å, with δH values of 17–19 ppm [13], whereas weak H-bonds are even longer, with δH values of 10–12 ppm [13].
Figure 1.
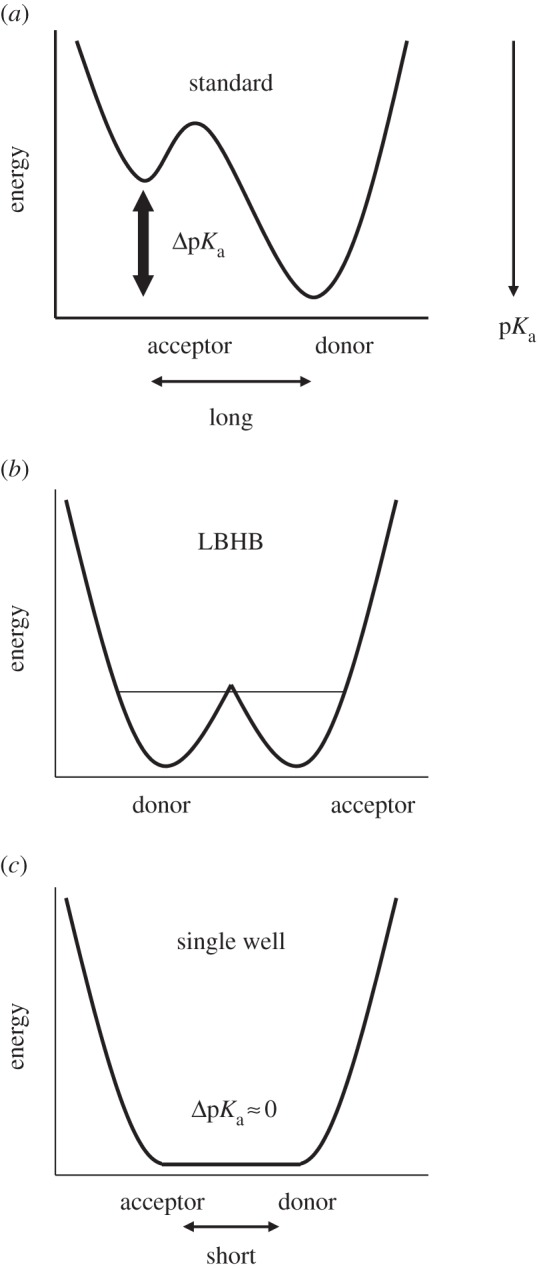
Overview of typical potential energy profiles: (a) standard H-bonds (asymmetric double-well), typically with an Odonor–Oacceptor distance greater than 2.6 Å; (b) LBHB, typically with an Odonor–Oacceptor distance of 2.5–2.6 Å and (c) single-well (ionic) H-bonds, typically with an Odonor–Oacceptor distance of less than 2.5 Å [8]. The corresponding O–N distances are generally greater than O–O distances.
2.2. pKa values
According to Perrin & Nielson [8] or Schutz & Warshel [15], the definition of an LBHB is vague. Schutz & Warshel [15] concluded that LBHBs cannot be defined solely by their length or strength and that only energy-based evaluations can be used to determine the type of H-bond that is present. In particular, the pKa values of the donor and acceptor moieties are important in determining the energy barrier required for moving an H atom between them [15]. In the original reports by Frey et al. [16] and Cleland & Kreevoy [17], it was stated that an LBHB may form when the pKa difference between donor and acceptor moieties is nearly zero (matching pKa).
Interestingly, it is noteworthy that the matching pKa condition is the situation where proton transfer reactions between the two moieties are most efficient [5–7] (table 1). Under this condition, coupling of the proton donor/acceptor moieties is the greatest, leading to the formation of a short H-bond and a decrease in the energy barrier for the proton transfer.
On the other hand, it is widely recognized that a salt bridge is a strong H-bond and plays a key role in electrostatic interactions at the protein surface. In many cases, salt bridges are formed between acidic and basic residues, with low and high pKa values, respectively. Thus, the matching pKa condition required for LBHB formation is exactly opposite to that required for salt-bridge formation (table 1). This implies that LBHBs, which have less salt-bridge-like character (i.e. large and small (nearly zero) pKa difference for salt-bridge and LBHB, respectively), are not necessarily strong, even if the donor–acceptor distance is short, because concentrated charge, which is more pronounced in salt bridges owing to the large pKa difference for the H-bond donor and acceptor moieties, is solvated more strongly than a distributed charge, which is more pronounced in LBHBs [9,18]. In particular, when the matching pKa condition is only transiently satisfied in the protein environment, for example, in intermediate states that are formed by oxidation/reduction or photoisomerization, LBHBs are unstable, where protein preorganized dipoles (e.g. backbone dipoles) are present [9].
2.3. What determines pKa values in proteins?
2.3.1. Solvation
‘pKa’ corresponds to proton affinity of the donor/acceptor moieties in H-bonds. In some cases, one might consider that to refer to H-bonds, a proton affinity description rather than a pKa would be more apt for H-bonds that are not exposed to the solvent. On the other hand, it should also be noted that the solvation energy term is also included in pKa. pKa can be defined for any titratable site in proteins, regardless of whether it is practically difficult to measure in experiments (in particular, if it is allowed to define a proton affinity of the same sites). For a single molecule in the bulk solvent, the pKa value is predominantly determined by the molecular structure and the solvation energy. Thus, the pKa value can be calculated quantumchemically, by using the atomic coordinates of the molecule and considering the solvation energy [19,20], as is the same for the redox potential for a redox-active site [21]. In a protein environment, although one also has to consider (i) the availability of the solvation and (ii) electrostatic interactions with other groups in addition to its own pKa value [22], it is also possible to calculate the pKa value at any titratable site as far as the reasonable atomic coordinates are available.
In general, in the inner hydrophobic core of a protein, the absence of the availability of solvation (rather than repulsive interactions) is the major contributor towards destabilizing the charged groups [23]. In a hydrophobic environment with less chance of solvation for a charged species, the less charged state is energetically more favourable, i.e. protonated state for acidic residue and deprotonated state for basic residues. Thus, the absence of the solvation energy leads to an increase and a decrease in pKa for acidic and basic groups, respectively (e.g. [22–27]). For example, a catalytic lysine (Lys115) in the active site of the acetoacetate decarboxylase (AADase) has long been known to be deprotonated. Using a reporter group that can approach the catalytic site in the protein, the pKa value of Lys115 (pKa(Lys115)) was formerly measured to be 5.96 [28]. More recently, using atomic coordinates of the X-ray crystal structures [26] with consideration of protonation states of all of the titratable sites in the protein, pKa(Lys115) values were calculated to be 5.73 for the Clostridium acetobutylicum AADase (CaAAD) and 5.96 for the Chromobacterium violaceum AADase [27], significantly low with respect to pKa(Lys) = 10.4 in water [29]. In general, protein atomic charges can shift the pKa in the inner core of the protein more significantly than in the bulk water. In CaAAD, the protein atomic charges (including H-bond interaction and long-distance electrostatic interaction) contributed to the increase in pKa(Lys115) of 3.6 [27]. However, the loss of solvation energy more significantly contributed to the decrease in pKa(Lys115) of 8.3 [27]. As a consequence, pKa(Lys115) is considerably low, approximately 6 in AADase [26–28]. The same reason also holds true for the decrease in pKa(NH3/NH4+) (i.e. leading to formation of NH3) at the binding sites along the inner pore of the ammonia transport protein AmtB [24,25].
2.3.2. Protein charges (electrostatic interactions including H-bonds)
pKa is also affected by electrostatic interaction including H-bonds that originate from the atomic charges of a protein. As donation of a single H-bond typically shifts the redox potential by approximately 60–120 mV, so does the pKa by approximately 1–2 unit in a protein environment. Functionally important redox/titratable active sites are often H-bonded in the protein environment. Donation of an H-bond to a titratable site leads to stabilization of the deprotonated (reduced) state, resulting in the decrease in the pKa (increase in the redox potential). Flavodoxin from Clostridium beijerinckii has a flavin mononucleotide (FMN) as a redox-active group. FMN has also the N5 atom as a protonatable site. pKa(N5) has been measured to be greater than 13.9 [30] or greater than 13 [31] in the native flavodoxin. On the other hand, the experimentally measured value of pKa(N5) is significantly lowered to 11.3 in the G57T mutant flavodoxin [30]. To understand the difference in pKa(N5), by solving the linear Poisson–Boltzmann equation with consideration of the protonation states of all titratable sites in the entire flavodoxin, pKa(N5) has been calculated to be 13.9 for the native flavodoxin and 11.7 for the G57T mutant flavodoxin [32]. The difference in pKa(N5) has been identified to be the difference in the backbone conformation near the flavin-binding site for the native and G57T mutant proteins [32]. The N5 atom has the backbone carbonyl O atom as an H-bond acceptor in the native crystal structure, whereas the backbone carbonyl O atom is flipped away from the N5 atom in the G57 mutant crystal structure [30]. The incapability of forming an H-bond between N5 and the backbone O atom leads to destabilization of the protonated FMN form, which lowers pKa(N5) in the G57 mutant by approximately 2 pKa units [32]. Thus, H-bond patterns determine the pKa value of the active site in proteins.
pKa or redox potential is also affected by electrostatic interactions other than H-bonds. In mammals, xanthine oxidoreductase can exist as xanthine dehydrogenase (XDH) and xanthine oxidase (XO). The two enzymes possess common redox-active cofactors, which form an electron transfer pathway terminated by a flavin cofactor. In spite of identical protein primary structures, the redox potential difference between XDH and XO for the flavin is approximately 170 mV, a striking difference [33,34]. The new crystal structures for XDH and XO confirmed the side chain orientation in detail [35]. In particular, the two crystal structures revealed the difference in the protein environment of the FAD-binding site and the H-bond network for XDH and XO. The majority of the redox potential difference between XDH and XO originates from a conformational change in the highly charged loop at positions 423–433 near the flavin-binding site, causing the differences in stability of the semiquinone state. The difference in the redox between XDH and XO is 150 mV when calculated over the region of residues 422–433. The influence of the protein volume (that prevents access to the flavin from water) on the redox potential is equal in XDH and XO [35].
In summary, pKa values (and redox potential values) in a protein environment can be sufficiently described by the protein geometry as long as the reliable atomic coordinates are available. The calculated value may tend to deviate from the experimentally measured value, in case the geometry of the crystal structure does not represent the functionally relevant conformation. When a number of different conformations are energetically possible, as typically indicated by large disorders of the atomic coordinates (i.e. large B-factor), each conformation has each pKa value, resulting in large deviation of the pKa values. Of course, this is often not the case for enzymatic active sites, where the function is realized by specific H-bond patterns and a specific pKa (or redox potential) value has been experimentally identified (e.g. proteins discussed above).
2.4. Proposed roles of low-barrier H-bonds
The catalytic power of enzymes is owing to the stabilization of the transition state relative to bulk water [18]. Thus, H-bonds in the catalytic site play an important role in the stabilization of the transition state. The LBHB was originally proposed to possess covalent bond-like character, significantly stabilizing the transition state, and facilitating enzymatic reactions [16,17]. In such a bond, the atomic charges of the H-bond donor and acceptor moieties will be more delocalized than those in a conventional H-bond. An advantage that the catalytic site of the protein possesses in contrast to the bulk water is the availability of preorganized dipoles, for example polar or charged side chains, in addition to the protein backbone itself, which can electrostatically stabilize the transition state. If the H-bond is an LBHB (i.e. has low polarity), it will lose the electrostatic advantage owing to its more delocalized atomic charge [15,18].
2.5. δH for compounds
δH is large for Odonor–H···Oacceptor H-bonds, where the H atom migrates more towards the acceptor moiety. In general, migration of the H atom is more pronounced as the Odonor–Oacceptor distance is reduced [36]. Thus, δH is a useful parameter for evaluating the strength of H-bonds.
In order to evaluate the accuracy of the quantumchemically calculated δH, we calculated δH for maleate and compounds 1–4 (figure 2), which are all thought to contain an LBHB [37]. The calculated δH values were found to be close to the experimentally measured values, with discrepancies of only approximately 1 ppm or less (table 2) [38]. Hence, the calculated δH values should be considered at this accuracy level. There is a tendency that the discrepancy between the measured values and the calculated values is small for short H-bonds [38]. This predominantly originates from the relevance of the quantumchemically optimized geometries of the molecules used for the δH calculations. In H-bonds with long donor–acceptor distances, the two moieties are less strongly coupled, allowing more deviations in the H-bond geometries from those that were quantumchemically optimized.
Figure 2.
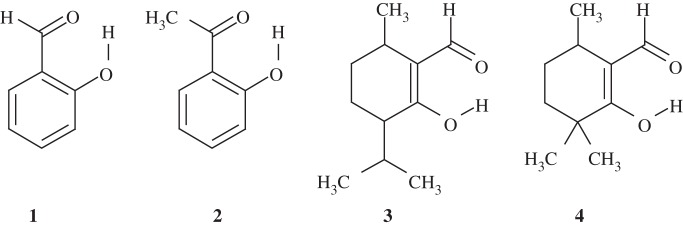
Compounds listed in table 2.
Table 2.
| entry | exp. δH | calc. δH |
|---|---|---|
| maleate | 21.5 | 21.8 |
| 1 | 11.0 | 12.1 |
| 2 | 12.2 | 13.1 |
| 3 | 14.9 | 15.7 |
| 4 | 15.6 | 15.9 |
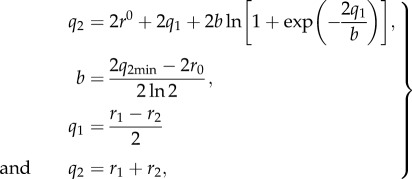
The calculated OHO-bond geometries and the NMR chemical shifts were evaluated using the correlation proposed by Limbach et al. [36]. The geometric correlation of the Oacceptor···H–Odonor bond between the acceptor···hydrogen (Oacceptor···H) distance r1 and the donor–hydrogen (Odonor–H) distance r2 was obtained by
 |
2.1 |
where q2min represents a minimum value corresponding to the minimum Oacceptor···Odonor distance in the case of a linear H-bond, and r0 is the equilibrium distance in the fictive free diatomic unit OH [36].
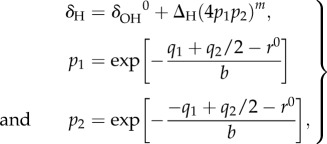
The correlation between the OHO-bond geometry and the 1H NMR chemical shift was obtained from
 |
2.2 |
where δΟH0 and ΔH represent the limiting chemical shifts of the separate fictive OH groups and the excess chemical shift of the quasi-symmetric complex, respectively, and m is an empirical parameter. q2 is taken from equation (2.1).
Interestingly, the obtained H-bond geometries of all compounds fitted exactly with the proposed correlation curve (equation (2.1)) [36] (figure 3), demonstrating that the methodology from [36] is able to reasonably reproduce the quantumchemically optimized Oacceptor···H and Odonor–H distances once the Oacceptor–Odonor distance is specified.
Figure 3.
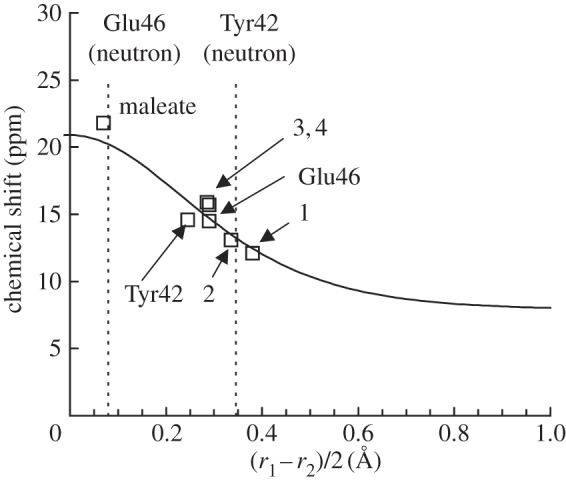
Calculated δH (vertical axis) in ppm and the (Oacceptor···H)/(Odonor–H) difference (horizontal axis) in ångström. r1 = (Oacceptor···H); r2 = (Odonor–H); correlation curve (solid curve, equations (2.1) and (2.2) [36]); calculated geometry (open squares) [38]. Vertical dotted lines indicate the (r1 – r1)/2 values of OGlu46–OpCA and OTyr42–OpCA in the neutron diffraction geometry [39]. Note that only equations (2.1) and (2.2) were used to depict the correlation curve (independent of the calculated geometries).
3. Is a low-barrier H-bond stable or unstable? Short H-bonds in photoactive yellow protein
Photoactive yellow protein (PYP) serves as a bacterial photoreceptor, in particular, as a sensor for negative phototaxis to blue light [40]. The photoactive chromophore of PYP is p-coumaric acid (pCA), which is covalently attached to Cys69 [41]. In the PYP ground state, the pCA chromophore exists as a phenolate anion [42–44], and analysis of its crystal structure has revealed that it is H-bonded with protonated Tyr42 and protonated Glu46 (figure 4). Tyr42 is further H-bonded with Thr50. Structural analysis has also suggested that Glu46 is protonated and pCA is ionized in the PYP ground state, pG [46,47].
Figure 4.
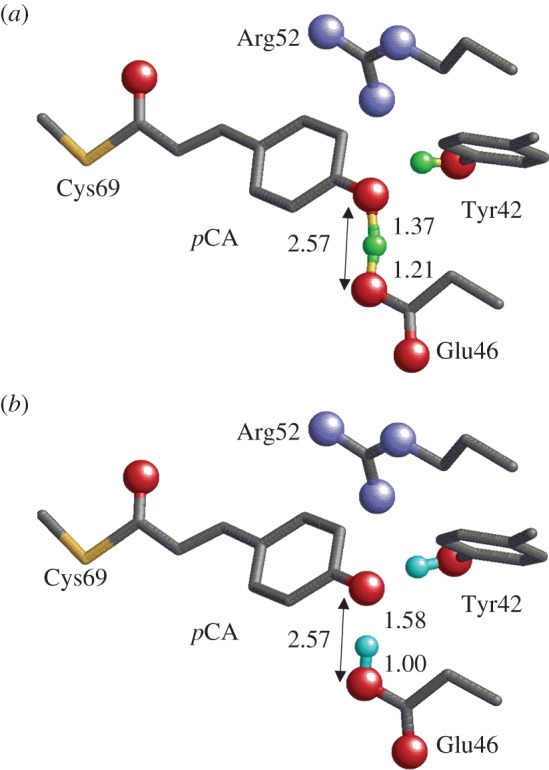
Geometry of the photoactive site in PYP. Only the H atom position of the H-bonds between Tyr42 and pCA, and between Glu46 and pCA are shown (green or cyan spheres). O and N atoms of the side chains are depicted as red and blue balls, respectively. (a) Neutron diffraction analysis [39] (PDB; 2ZOI). (b) QM/MM optimized structure [45] based on the X-ray crystal structure (PDB; 2ZOH). (Online version in colour.)
Recently, neutron diffraction analysis has been used to assign the H (or deuterium) atom positions of PYP [39]. It was found that in the case of the Glu46–pCA pair, an H atom was situated 1.21 Å from Glu46 and 1.37 Å from pCA, almost at the midpoint of the OGlu46–OpCA bond (2.57 Å) (figure 4). From this unusual H atom position, the H-bond between Glu46 and pCA was interpreted as an LBHB [17] in [39].
As mentioned earlier, an LBHB forms when the pKa difference between donor and acceptor moieties is nearly zero. If this is the case, the identification of an LBHB with a single minimum potential can be valid only if the minimum is at the centre of the OGlu46–OpCA bond (i.e. the pKa values of the two moieties are nearly equal) as suggested by Schutz & Warshel [15]. The H atom position in the OGlu46–OpCA bond in the neutron diffraction study appears to satisfy the criterion for an LBHB, which should correspond to similar pKa values for Glu46 and pCA. However, if this was the case, then it would contradict the Glu46 being protonated and the pCA being deprotonated in the PYP ground state, as suggested in a number of previous experimental studies [42–44,48]. In NMR studies, a δH of 15.2 ppm was assigned to protonated Glu46 [49]. This is smaller than that for single-well H-bonds (20–22 ppm [13]) or even for LBHB (17–19 ppm [13]). The actual H atom position that corresponds to a δH of 15.2 ppm in OGlu46–OpCA was not clarified.
3.1. δH for photoactive yellow protein
Using the QM/MM optimized geometry, we calculated the δH value for the OGlu46–OpCA bond and found it to be 14.5 ppm (PDB, 2ZOH [39]) or 14.6 ppm (PDB, 1OTB [50]) [38]; these values differ by 0.6–0.7 ppm from the experimental values of 15.2 ppm [49]. This discrepancy may also reflect the distribution of H-bond lengths, even in these high-resolution (approx. 1 Å) crystal structures of PYP (reviewed in [50]).
We analysed the dependence of δH on the H atom position. The origin of the downfield character for the chemical shift is considered to be owing to attenuation of the electronic shielding around the proton owing to the two electronegative donor and acceptor atoms [51]. The maximum δH value of approximately 20 ppm was observed near the centre of OGlu46–OpCA [38]. The δH of approximately 15 ppm that was obtained from solution 1H NMR studies of PYP [49] could not be obtained near to the centre of OGlu46–OpCA, but only at the Glu46 or pCA moieties [38].
On the other hand, the H atom positions calculated from the neutron diffraction study [39] yielded a δH value of 19.7 ppm for OGlu46–OpCA (figure 3) [38]. This value satisfies the criterion of LBHBs proposed by Frey (δH of 17–19 ppm [13]). The fact that an H atom position near the midpoint of OGlu46–OpCA resulted in a δH of 19.7 ppm for a typical LBHB [13] is also a clear validation of the criterion proposed by Schutz & Warshel [15], i.e. the minimum of the potential energy curve for an LBHB is at the centre of the OGlu46–OpCA bond. However, the δH of 19.7 ppm is clearly larger than the value of 15.2 ppm obtained from the NMR studies [49]. Hence, the H atom positions obtained in the neutron diffraction study [39] resulted in an overestimation of the chemical shift for OGlu46–OpCA, and an underestimation of that for OTyr42–OpCA.
Notably, Steiner [52] and Limbach et al. [36] also proposed the correlation between δH and the H-bond geometry; δH could be reproduced from (r1 – r2)/2 (or alternatively r1 + r2), using equations (2.1) and (2.2). The calculated δH values were in agreement with those estimated from the proposed correlation curve [36], demonstrating that δH can be reproduced if a reasonable H-bond geometry is provided (figure 3). From the δH correlation curve, the r1 of 1.37 Å, and r2 of 1.21 Å reported for OGlu46–OpCA in the neutron diffraction study [39] yielded a δH of 20.2 ppm (figure 3) [38]. It should be noted that none of the H-bond geometries investigated (even maleate) possessed an H atom at the centre of the O–O bond (figure 3), as previously reported by Perrin et al. [53,54].
4. Formation of a short H-bond photoinduced by trans–cis isomerization, leading to proton transfer: the photoactive chromophore in photoactive yellow protein
Upon exposure to blue light, PYP undergoes the following photocycle: pG (ground state) → P*–(trans–cis isomerization) → I0 → I0‡ → pR–(proton transfer and large conformational change) → pB → pG [55–57]. The pR to pB transition has been suggested to involve protonation of pCA (i.e. proton transfer) and a large structural change in the protein [55,56]. Although time-resolved Laue diffraction studies proposed structural models of the intermediates [58], the relevance of the suggested pB structure (PDB: 1TS0) as an intermediate of the photocycle is a matter for debate. From the Laue diffraction studies, the pB intermediate has an H-bond between Arg52 and pCA [58]; whereas, solution structures of the pB state indicate a high degree of disorder in residues 42–56 [59] (discussed in [60]).
On the other hand, the time-resolved Laue diffraction studies identified the pRCW intermediate [58], with a structure proposed to correspond to the pR species [55–57] observed in the spectroscopic studies. The pR state decays to the pB state as a result of proton transfer from Glu46 to pCA, with a rate coefficient of 250 μs [55,56], which is consistent with that of the 333 μs found for the pRCW decay [58]. To the best of our knowledge, the solution structure of the pR state has not been reported to date.
Interestingly, the OGlu46–OpCA bond is unusually short at 2.47 Å in the pRCW structure (1.60 Å resolution) [58], which may argue against the presence of an LBHB in the ground state that is proposed in [39]. In general, an H-bond donor–acceptor distance can be at its shortest when the pKa difference between donor and acceptor moieties is nearly zero, owing to maximized coupling between them. This is why LBHB and single-well H-bonds are shorter than standard (asymmetric double-well) H-bonds (figure 1) [8,9,15,54]. If the presence of the shorter OGlu46–OpCA bond in the pRCW state relative to the ground state is plausible, this would suggest that the matching pKa condition between the H-bond donor and acceptor moieties is not satisfied in the ground state, or is at least less likely than in the pRCW state.
The QM/MM calculations reproduced the unusually short H-bond distance (2.49 Å) on the basis of the pRCW structure, only with the assumption that Tyr42 does not donate an H-bond to pCA (figure 5) [10]. The standard OGlu46–OpCA H-bond geometry (i.e. Tyr42 donates an H-bond to pCA) yielded a bond length of 2.60 Å, even in QM/MM calculations of the pRCW structure. These results confirm that in the pRCW crystal structure, Tyr42 is flipped away from pCA, rather than donating an H-bond to it.
Figure 5.

Changes in the H-bond pattern photoinduced by trans–cis isomerization of pCA, and associated changes in the potential energy profile of the Glu46–pCA H-bond in PYP. (Online version in colour.)
The existence of the unusually short H-bond appears to be plausible not only in the pRCW structure [58], but also in the pR species [55–57] observed in the spectroscopic studies. FTIR analysis has suggested that the H-bond between Glu46 and pCA becomes stronger in the pR relative to the pG, as suggested by the downshift in the C=O stretching frequency of protonated Glu46 [43]. As the shortening of an H-bond donor–acceptor distance leads to migration of the H atom towards the acceptor moiety (e.g. [38,61]), the observed downshift in the C=O stretching frequency of Glu46 is consistent with the presence of the unusually short OGlu46–OpCA bond in the pRCW structure. The H-bond pattern of Tyr42 and pCA in the OGlu46–OpCA length is also evident in studies of the Y42F mutant. The Y42F crystal structure was found to have a shorter OGlu46–OpCA bond (2.51 Å [62]) compared with that of the native PYP (2.59 Å [50]), and the C=O stretching frequency of protonated Glu46 in the Y42F mutant was downshifted relative to the wild-type PYP, as seen in the FTIR studies [63].
4.1. How does the short H-bond appear in FTIR studies?
Interestingly, the potential energy curve of the OGlu46–OpCA bond (2.49 Å) in the pRCW crystal structure resembles that of a typical single-well H-bond; the barrierless potential for the proton transfer is an indication of the pRCW intermediate being ready for the proton transfer (figure 5). As observed in FTIR studies, the C=O stretching frequency for protonated Glu46 is downshifted to 1732 cm−1 in pR relative to 1740 cm−1 in pG, suggesting that the H atom in the OGlu46–OpCA bond remains in the Glu46 moiety (i.e. can interact with Glu46), but simultaneously migrated towards the pCA moiety [43], as in the case for a single-well H-bond. Indeed, in FTIR studies, the existence of a single-well H-bond has already been proposed [43]; a stronger H-bond in pR relative to pG lowers the energy barrier for proton transfer from Glu46 to pCA (see fig. 4 in [43]). Note that the OGlu46–OpCA H-bond is absent in the pB state [43], and in the solution structures of the pB state [59]. This indicates that the unusually short H-bond is not stable in the protein environment, in particular if the matching pKa condition for the H-bond donor and acceptor moieties is satisfied only transiently near the protein surface. (For comparison, see also the case of an unusually short H-bond between D1-Tyr161 and D1-His190 in PSII [1,64]; here the matching pKa condition is satisfied easily in the protein inner core, without tuning the original pKa values of the donor and acceptor moieties. Discussed later, see ‘Presence of an unusually short, but stable H-bond in redox-active D1-Tyr161 (TyrZ) in photosystem II’.)
4.2. Is the short H-bond in the pRCW state unusually strong?
If the short OGlu46–OpCA H-bond was extremely strong, the pRCW intermediate would be highly stable and the subsequent pB state would not form on such a timescale. It should also be noted that the lifetime of hundreds of microseconds for the pRCW state is owing to the large structural change rather than proton transfer from Glu46 to pCA. In addition, in a single-well H-bond, movement of a proton between the donor and acceptor moieties is not directly associated with breakage of the H-bond. Breakage of the short OGlu46–OpCA H-bond can occur as a result of the large structural change, which is driven by the photon energy stored in the system [65]. Hence, the pR intermediate can lower the energy required to proceed to the pB state by eliminating the unusually short OGlu46–OpCA H-bond of less than 2.5 Å. In terms of the local H-bond network of pCA, formation of the unusually short H-bond is energetically allowed (or favoured) at the stage of the pR intermediate; however, this is not energetically the lowest state of the entire protein, which explains why the pB state is formed.
5. Formation of a short H-bond induced by electron transfer, leading to proton transfer: electron acceptor quinone in photosystem II
The core of the PSII reaction centre is composed of D1/D2, a heterodimer of protein subunits that contains the cofactors that are involved in photochemical charge separation, quinone reduction and water oxidation (figure 6). These reactions are driven by the absorption of light with a wavelength of approximately 680 nm by the P680 pigment. P680 is composed of four chlorophyll a (Chla) molecules, PD1/PD2, ChlD1/ChlD2, and two pheophytin a molecules (PheoD1/PheoD2). Excitation of P680 initially leads to the formation of a range of charge-separated states, with the ChlD1·+ PheoD1·− state dominating. After a short time, the secondary radical pair, [PD1/PD2]·+ PheoD1·−, is formed in nearly all of the centres. This state is stabilized by electron transfer to the first quinone, QA, and by electron donation from a Tyr residue, D1-Tyr161 (TyrZ), to PD1·+. TyrZ·, then oxidizes the Mn4CaO5 cluster, which catalyses the subsequent water-splitting reaction. QA/QA·− acts as a 1-electron redox couple, accepting electrons from PheoD1·−, and donating to the second quinone, QB, without undergoing protonation itself. By contrast, QB reduction involves two consecutive 1-electron reduction reactions, with a series of associated proton uptake reactions (reviewed in [66–71]).
Figure 6.
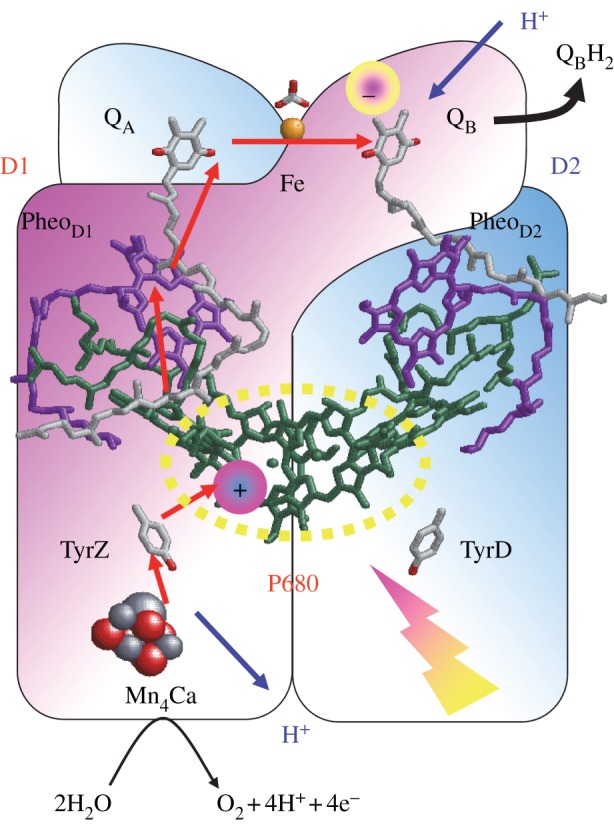
Photoinduced electron transfer (red arrows) and associated proton transfer (blue arrows) reactions in the D1 (red) and D2 (blue) heterodimer protein subunits of PSII. (Online version in colour.)
QB is located near the non-haem Fe2+ and the ligand to the Fe2+, D1-His215, donates an H-bond to the QB carbonyl O atom that is nearer to the Fe complex (OQB(proximal)) (figure 7). The QB carbonyl O atom distal to the Fe complex (OQB(distal)) accepts an H-bond from D1-Ser264, which itself accepts an H-bond from D1-His252 (figure 7), which is located on the protein surface in contact with the aqueous medium [1,70–73]. It is known that QB·− formation is linked to proton uptake [74,75], and comparisons with the structure of the bacterial reaction centre led to the first suggestion that the D1-His252 was the residue undergoing protonation in response to QB·− formation [76]. In theoretical studies, it has been proposed that proton uptake by D1-His252 causes reorientation of the hydroxyl group of D1-Ser264 towards the distal QB carbonyl group, and stabilizes QB·−, facilitating the initial electron transfer from QA to QB [73].
Figure 7.

H-bond partner side chains of QA and QB in PSII. The backbone amide group of D2-Phe261, which forms an H-bond with QA, is omitted for clarity. (Online version in colour.)
5.1. First protonation step: conversion of QB− to QBH via D1-His215 and D1-Ser264
In order to elucidate how the conversion of QB·− to QBH· occurs, we analysed the potential energy profiles of the two H-bonds of QB·−, OQB(distal)···H–OD1-Ser264 and OQB(proximal)···H–NδD1-His215. In general, Ser is unlikely to deprotonate; however, in the QB·− state, the potential energy profile indicates that transfer of a proton from D1-Ser264 to OQB(distal) occurs very easily in an energetically downhill process (figure 8) [11]. This reaction is accompanied by a concerted proton transfer from protonated D1-His252 to D1-Ser264, resulting in the formation of QB(distal)H·, deprotonated (neutral) D1-His252, and reoriented D1-Ser264 (figure 8). The QM/MM-optimized geometry indicates that the two H-bonds of D1-Ser264, OQB(distal)···H–OD1-Ser264 (2.48 Å) and OD1-Ser264–H···NδD1-His252 (2.51 Å), are unusually short, especially in the QB·− state [11]. These two short H-bonds were only present before the initial proton transfer occurred but they lengthened (to 2.73 and 2.67 Å, respectively [11]) immediately after proton transfer had occurred. Therefore, the presence of an unusually short H-bond indicates that proton transfer between the donor and acceptor moieties is about to occur.
Figure 8.

Potential energy profiles of the H-bond donor–acceptor pairs in PSII: (right) H-bond between D1-Ser264 and the distal QB carbonyl (purple (in the neutral QA state) and blue (in the reduced QA state) curves); (left) H-bond between D1-His215 and the proximal QB carbonyl (red curves). Arrows indicate the directions of proton transfer. (Online version in colour.)
By contrast, the potential energy profile of the OQB(proximal)···H–NδD1-His215 resembles that of a standard asymmetric double-well H-bond [8], suggesting that the proton transfer from D1-His215 to OQB(proximal) is an energetically uphill process (figure 8). This is primarily because proton release from the singly protonated (neutral) His (pKa approx. 14 for imidazole [77]) is unfavourable, unlike the doubly protonated (positively charged) His, for which the pKa is approximately 7. While the pKa for neutral His is expected to be lowered to some extent by the positive charge and environment around Fe (see below), it is still likely to be relatively high, and thus unfavourable on this step.
5.2. Second proton transfer and an unusually short H-bond distance between QBH− and D1-His215
As OQB(distal) is protonated upon QBH· formation, the second protonation, i.e. the conversion of QBH·− to QBH2, must occur at OQB(proximal), which is H-bonded by Nδ of D1-His215 (figure 7). The QM/MM-optimized H-bond distance between OQB(proximal) of QBH− and Nδ of D1-His215 was found to be unusually short (2.47 Å) in the QBH− state [11]. Intriguingly, this distance is identical to that in the 1.9 Å structural model of the PSII monomer unit A of the PSII complexes [1]. The corresponding OQB(proximal)–NδD1-His215 distances were found to be 2.77 Å in the QB state and 2.68 Å in the QB·− state [11], both being significantly longer than that in the QBH− state. In addition, the corresponding QA-side distance (OQA(proximal)–NδD2-His214) was 2.78 Å in the 1.9 Å structure [1] and approximately 2.8–2.9 Å in the purple bacterial reaction centre [78]. Given that the QB geometry was less well defined than QA geometry in the 1.9 Å structure [1], the significance of the short OQB(proximal)–NδD1-His215 distance (2.47 Å) should be treated with caution. Furthermore, the QBH− state is expected to be a short-lived intermediate and not a state that would be present in PSII under normal circumstances.
In a typical H-bond with an O–O distance longer than approximately 2.6 Å, the H atom is located near to the donor moiety owing to the larger pKa value of the donor relative to the acceptor (with an asymmetric double-well potential H-bond [8], figure 1). On the other hand, according to the classification of H-bonds by Jeffrey [12] or Frey [13], short H-bonds with O–O distances of 2.4–2.5 Å can be classified as single-well (ionic) H-bonds [8] (figure 1). Because O–N distances are generally greater than O–O distances, the OQB(proximal)–NδD1-His215 of 2.47 Å is an unusually short H-bond and may possess a single-well potential. Remarkably, the calculated potential energy profile for the OQB(proximal)–NδD1-His215 in the QBH− state was found to resemble that of a barrierless single-well (ionic) H-bond, suggesting that the second proton transfer could occur isoenergetically at OQB(proximal) (figure 8). The significantly elongated H–N bond of D1-His215 (1.15 Å) in the QBH− state implies that further migration of an H atom towards the acceptor OQB(proximal) moiety (i.e. proton transfer) can easily occur. Indeed, the single-well potential obtained for OQB(proximal)–NδD1-His215 is symmetric (figure 8), implying that the pKa difference [15] between D1-His215 deprotonation and QBH− protonation is close to zero.
The pKa for the QH− to QH2 protonation for plastoquinone is expected to be similar to that measured for ubiquinone in aqueous solution, i.e. 10.7, which is significantly higher than the pKa of 4.9 found for the protonation of the semiquinone, Q·− to QH· [79,80]. The pKa for deprotonation of a neutral His is expected to be similar to that for imidazole, i.e. approximately 14 [77]. In PSII, however, the ligation of D1-His215 to the positively charged Fe2+ should lower the pKa of neutral D1-His215. The pKa of the neutral His ligand to Fe2+ in the Rieske [2Fe–2S] cluster has been measured to be approximately 12.5 rather than approximately 14 [81,82]. The ligand environment of Fe2+ in PSII is more positively charged than that in the Rieske cluster; thus, the pKa of neutral D1-His215 deprotonation is expected to be lower than approximately 12.5. In agreement with this, FTIR studies have indicated that deprotonation of D1-His215 occurs in response to pH changes [83]. Overall, the literature suggests that the pKa value of D1-His215 is likely to be close to that for the QBH− to QBH2 protonation, in accordance with the single-well potential obtained here (figure 8).
6. Presence of an unusually short but stable H-bond in redox-active D1-Tyr161 (TyrZ) in photosystem II
The 1.9 Å structure confirmed that the OH group of TyrZ is situated an H-bond distance from the Nε of D1-His190. Most strikingly, the donor–acceptor distance of this H-bond (OTyrZ–Nɛ,His distance) is very short at 2.46 Å [1] (figures 6 and 9). The assignment of the atoms of TyrZ and D1-His190 appears to be quite reliable because the B-factors of TyrZ (22.4 for hydroxyl O), D1-His190 (22.4 for Nɛ and 23.3 for Nδ) and water molecules in the surrounding area (25.5 for W7 [72]) were relatively small for membrane proteins. In comparison with the corresponding distances of 2.78 Å in the previous 3.0 Å structure [84]; 2.67 Å in the previous 2.9 Å structure [85]; and 2.82 Å [86], 2.83 Å [87] and 2.88 Å [88] in the geometry-optimized Tyr-His model complexes, the OTyrZ–Nɛ,His distance of 2.46 Å in the 1.9 Å structure [1] is unusually short. It would therefore be interesting to elucidate how this short H-bond distance is energetically possible and what makes the distance so small.
Figure 9.

H-bond network around (a) TyrZ and (b) TyrD in PSII. Red and green spheres indicate water O and Cl atoms, respectively. (Online version in colour.)
Intriguingly, QM/MM geometry optimization of the neutral [TyrZ-O···H···Nε-His-NδH···O=Asn] state resulted in a OTyrZ–Nε,His length of 2.47 Å [64], which was in agreement with the corresponding distance of 2.46 Å found in the 1.9 Å structure [1]. By altering the OTyrZ–Nɛ,His distance and analysing the potential energy profile, it was confirmed that the OTyrZ–Nɛ,His distance of 2.47 Å exactly corresponded to the energy minimum of the H-bond, with this increasing both above and below the OTyrZ–Nɛ,His of 2.47 Å (figure 10).
Figure 10.

Energy profiles along proton transfer coordinate the H-bond between D1-Tyr161 (TyrZ) and D1-His190 in PSII. ΔE describes the difference in energy relative to the energy minimum. The red arrow indicates the energy difference from the energy minimum, although not always shown. (Online version in colour.)
The potential energy profile of the unusually short H-bond between TyrZ and D1-His190 resembles that of a single-well H-bond (figure 10). The presence of a symmetric H-bond between TyrZ and D1-His190 indicates that the pKa values for the two moieties are similar [64]. These features are in contrast to those observed for the short OGlu46–OpCA bond in PYP (figure 11). As suggested by Schutz & Warshel [15], the identification of an LBHB with a single minimum potential can be valid only if the minimum is at the centre of the OGlu46–OpCA bond (i.e. the pKa values of the two moieties are nearly equal). In PYP, even if the donor–acceptor distance is forced to shorten, the shape of the potential curve does not become symmetric and the energy minimum becomes even higher (figure 11) [45]. These comparisons indicate that the short H-bond in PYP is less likely to be an LBHB with respect to the short H-bond in PSII.
Figure 11.

Dependence of the potential energy profiles at OGlu46–OpCA = 2.32, 2.57 and 2.77 Å in PYP. The red arrow indicates the energy difference from the energy minimum obtained at OGlu46–OpCA of 2.57 Å. Compare the significantly different energetic properties of the OGlu46–OpCA bond from those of the OTyrZ–ND1-His190 bond in PSII, i.e. figure 10. In contrast to the symmetric shape of the potential energy curves irrespective of the donor–acceptor distances in PSII (figure 10), the shape of the potential energy curve never becomes symmetric in PYP, even if the distance is forced to be short. (Online version in colour.)
These observations raise the question of how the pKa values of TyrZ and D1-His190 are equalized, making the formation of the unusually short H-bond energetically possible. In the PSII protein environment, two water molecules, W4 (OTyrZ–OW4 = 2.87 Å) and W7 (OTyrZ–OW7 = 2.62 Å), are at H-bond distances from the hydroxyl O atom of TyrZ [72]. W4 is one of the two Ca-ligated water molecules of the O2-evolving complex, and W7 is H-bonded to W6 and another Ca-ligated water W3. Both W3 and W6 are connected with W5. Thus, the four water molecules W3, W5, W6 and W7 form a diamond-shaped water cluster, where W7 is situated at the interface between the water cluster and TyrZ (figure 9). Upon removal of all water molecules from PSII, the OTyrZ–Nɛ,His distance significantly increases to 2.71 Å [64], and remarkably, the highly anharmonic single-well potential curve (figure 12) obtained for the neutral [TyrZ-O···H···Nɛ-His-NδH···O=Asn] state (OTyrZ–Nɛ,His = 2.47 Å) is dramatically altered to an asymmetric double-well potential curve (figure 12). These results indicate that the presence of the water cluster contributes to matching of the two pKa values in the PSII protein environment, thus facilitating the formation of the unusually short, symmetric H-bond.
Figure 12.

Alteration of a significantly short, single-well H-bond (OTyrZ–ND1-His190 = 2.47 Å) to a standard, asymmetric double-well H-bond (2.71 Å) upon removal of water molecules near the water-splitting catalytic site, Mn4CaO5 in PSII. (Online version in colour.)
7. Proton transfer via an H-bond network: mechanism of TyrD (D2-Tyr160) oxidation in photosystem II
In PSII, there are two redox-active Tyr residues [89–91], D1-Tyr161 (TyrZ) and D2-Tyr160 (TyrD), that can provide electrons to [PD1/PD2]·+. TyrZ, which has D1-His190 as an H-bond partner, is the kinetically competent Tyr that mediates proton-coupled electron transfer from Mn4CaO5 to [PD1/PD2]·+ (P680·+). TyrD is not kinetically competent and plays no obligatory role in enzyme function; indeed, when TyrD is replaced by Phe, enzyme function appeared to be unaffected [90,91]. Nevertheless, TyrD is likely to play specific roles that are beneficial for PSII function (reviewed in [92]).
The neutral radical, TyrD-O·, is formed upon oxidation of TyrD-OH by [PD1/PD2]·+ [92–95], with this occurring in the tens of millisecond timescale [96] (see also [97]), which is slow enough that it does not compete with the rapid electron donation from TyrZ (which occurs on the tens to hundreds of nanosecond timescale). In the functional enzyme, TyrD oxidation occurs when the reversible intermediates of the water-splitting cycle, the so-called S2 or S3 states, equilibrate with TyrZ-O·, and thence [PD1/PD2]·+ allowing the slow electron donation from the TyrD, forming the stable radical, TyrD-O·.
Once formed, TyrD-O· is highly stable for many hours under physiological conditions, giving rise to the term ‘Signal II slow/dark’ describing the EPR signal from TyrD-O· [92–94]. By contrast, TyrZ-O· is reduced by Mn4CaO5 on the tens of microsecond to millisecond timescale [93,94]. It has been suggested that the proton released from TyrD-OH upon oxidation remains near to TyrD-O· (e.g. [92]), with the crystallographic models showing a hydrophobic environment that appears to be consistent with this suggestion [1,84,98]. Until fairly recently, it was generally assumed that both TyrZ and TyrD underwent oxidation with the simultaneous transfer of the phenolic proton to the bases, D1-His190 and D2-His189, respectively, as originally suggested by Debus et al. [90]. However, subsequent FTIR studies have suggested that a proton carrier other than D2-His189 [99] could play a role in the redox properties of TyrD and that water could accept the proton from TyrD [100]. Exchangeable protons near TyrD-O· have also been detected by ENDOR and ESEEM studies (e.g. [101,102]). The TyrD-O· EPR signal was lost and/or significantly modified, and PSII photochemistry perturbed, when D2-Arg180 was mutated and this led Manna et al. [103] to propose that D2-Arg180 could accept or stabilize a proton from TyrD.
A recently resolved crystal structure has demonstrated the presence of a cluster of water molecules near TyrZ, but no corresponding cluster near TyrD [1], just a single water molecule. Curiously, this molecule is seen to occupy two different positions, proximal (H2Oprox) and distal to the TyrD (H2Odist), separated by 1.8 Å, with B-factors of 20.1 and 19.3, respectively (figure 9). The proximal position is at H-bonding distance with the phenolic O atom of TyrD (OTyrD–OH2Oprox = 2.73 Å), whereas the distal position is beyond it (OTyrD–OH2Odist = 4.30 Å) and is instead at H-bonding distance with the guanidinium N atom of D2-Arg180 (OH2Odist–ND2-Arg180 = 3.01 Å).
The H-bond geometry of the water in the distal position (H2Odist) was obtained from QM/MM calculations, with TyrD taken as a deprotonated, neutral radical (TyrD-O·) [104]. In the presence of TyrD-O·, the water molecule would not remain in the H-bonding, proximal position (H2Oprox), instead it would move to the distal position, even if it initially donated an H-bond to the phenolic O atom of TyrD-O·. Thus, H2Odist and H2Oprox correspond to deprotonated TyrD-O· radical and protonated TyrD-OH states, respectively [104] (figure 13).
Figure 13.

H-bond patterns and concomitant water molecule positions (blue) for TyrD-OH (left) and TyrD-O· (right) species in PSII. (Online version in colour.)
Another point of interest is where the proton from TyrD-OH goes when it is deprotonated to TyrD-O·. Examination of the crystal structure [1] shows that an H-bond network is present beyond D2-Arg180, extending out to D2-His61 near the lumenal bulk surface via a series of water molecules [104] (figure 14). Indeed, previous electrostatic calculations have indicated that the protonated states of D2-Arg180 and D2-His61 were likely to be linked [105]. Here, QM/MM calculations based on a more recent crystal structure [1] show that the proton released from TyrD is transferred via the mobile water and D2-Arg180, all the way to D2-His61, through a concerted single-step proton transfer process [104] (figure 14). The proton does not return to the TyrD/D2-His189 moiety but goes through D2-Arg180 in an energetically favourable process irrespective of the presence of positively charged D2-Arg180. This demonstrates that there is no energy barrier for the proton transfer at D2-Arg180. As soon as the proton approaches the –NH2 group of D2-Arg180, the NH-bond stretches towards the next water molecule, W480. Synchronizing the bond stretch, an OH-bond of W480 stretches towards W373. Similar bond stretching occurs at W373 and W783, and the proton is finally stabilized at D2-His61. Although the H-bond network terminates at W354 in the 1.9 Å crystal structure [1], the proton relay may continue further, releasing the proton into bulk water via W354. Overall, the calculations show that the proton is transferred to D2-His61 along a proton transfer pathway that involves several OH and NH-bond stretches towards acceptor moieties, without explicitly forming H3O+ [104].
Figure 14.

Single-step proton transfer from TyrD to the bulk solvent and the associated H-bond patterns of the proton transfer pathway in PSII: (a) before and (b) after proton transfer. (Online version in colour.)
7.1. Energetics of the proton transfer pathway proceeding from TyrD
A concerted single-step proton transfer occurring over approximately 13 Å between TyrD and D2-His61 (figure 14) requires both a well-arranged H-bond network with appropriate distances between all donor–acceptor pairs (figures 5 and 6), and a sufficient driving force. For a proton moving along the pathway, the energy profile indicates that the reaction is sufficiently downhill from the TyrD-associated water to D2-His61, even when the D2-Arg180 moiety is included [104]. The driving force for the proton transfer towards the bulk surface appears to disfavour protons returning to TyrD-O·, thus stabilizing the radical.
As far as we are aware, involvement of D2-His61 in the proton transfer pathway from TyrD has not been reported. The electrostatic link between D2-Arg180 and D2-His61, suggested from electrostatic calculations, is likely to be functionally relevant [105]. Remarkably, the H-bond donor–acceptor distances for W783 near D1-His61 are very short in the 1.9 Å crystal structure [1], namely OW783–OW354 = 2.51 Å and OW783–ND2-His61 = 2.58 Å (figure 14). In the QM/MM calculations, these distances were found to be 2.55 and 2.53 Å in the presence of protonated D2-His61 (i.e. after proton transfer), distances that are close to the original geometry of the crystal structure, whereas longer values were obtained (2.69 and 2.71 Å) in the presence of deprotonated D2-His61 (i.e. before proton transfer) [104]. Because a standard (asymmetric double-well) H-bond possesses O–O distances of approximately 2.8 Å [36,106], the very short H-bond distances between W783 and His61 may be an indication of a proton being present on D2-His61, or possibly shared with W783, which would thus be functioning as part of the proton transfer pathway from TyrD.
8. Concluding remarks
For a proton to be transferred, alternation of the pKa values of the two moieties is expected to occur, otherwise, it would remain localized on the donor moiety. In order for this condition to be achieved, proteins either change the H-bond pattern, or change (equalize) the pKa values of the proton donor and acceptor moieties (table 3). Changes in the H-bond pattern can be induced by photons, as in the example of the trans–cis photoisomerization of the double bond moiety in PYP [10], ultimately leading to equalized pKa values of the donor and acceptor moieties and efficient proton transfer. Equalizing the pKa values can also be achieved directly by oxidizing or reducing one of the H-bond moieties, as a result of an electron transfer.
Table 3.
Summary of the properties of short H-bonds in the crystal structures.
| H-bond | Tyr-OH···N-His | His-NH···−O-QB-OH | Glu-COOH···−O-pCAa |
|---|---|---|---|
| geometry | |||
| protein | PSII | PSII | PYP |
| state | n.d. | QBH−/QBH2 | pRCW |
| donor | D1-Tyr161-OH | D2-His214-NH | Glu46-OH |
| acceptor | D1-His190-N | −O-QB-OH | −O-pCA |
| distance (X-ray) (Å) | 2.46b | 2.47b | 2.47c |
| distance (QM/MM) (Å) | 2.47 | 2.47 | 2.49 |
| short H-bond formation | |||
| trigger | n.d. | electron | photon |
| mechanism | n.d. | QBH− formation → increase in pKa(Oprox) |
photoinduced trans–cis isomerization of pCA → removal of an H-bond from Tyr42 |
| pKa (bulk solvent) | approximately 9···approximately 7 | approximately 14···approximately 5d | approximately 4···approximately 9 |
| stability (protein) | stable | transient | transient |
| associated conformational change | (no significant conformational change) | proton transfer → QB release from the PSII protein |
proton transfer → pB state formation |
| location | inner core | near the bulk surface | near the bulk surface |
By equalizing the pKa values, the H-bond donor and acceptor moieties can maximize proton transfer coupling, thus shortening the H-bond donor–acceptor distance. However, if the pKa matching condition is satisfied only transiently (e.g. the pRCW state in PYP or the QBH− state in PSII), in particular near the protein bulk surface, the H-bond is unstable, leading to breakage and concomitant protein conformational changes (table 3).
It is also notable that the matching pKa condition required for single-well H-bond formation is opposite to that required for salt-bridge formation, which plays a key role in protein–protein interactions. From these points of view, it is clear that symmetric, short H-bonds are not necessarily strong, in particular, when the matching pKa condition is satisfied by strongly shifting the pKa values of the donor and acceptor moieties in protein environments, owing to its anti-salt-bridge character.
Acknowledgement
We thank A. William Rutherford, Jian-Ren Shen, Hideki Kandori and Toyokazu Ishida for useful discussion.
Funding statement
This research was supported by the JST PRESTO programme (K.S.), Grant-in-Aid for Scientific Research from the Ministry of Education, Culture, Sports, Science and Technology (MEXT) of Japan (22740276 to K.S. and 25107517 to H.I.) and Takeda Science Foundation (H.I.).
References
- 1.Umena Y, Kawakami K, Shen J-R, Kamiya N. 2011. Crystal structure of oxygen-evolving photosystem II at a resolution of 1.9 Å. Nature 473, 55–60. ( 10.1038/nature09913) [DOI] [PubMed] [Google Scholar]
- 2.Lanyi JK. 1998. Understanding structure and function in the light-driven proton pump bacteriorhodopsin. J. Struct. Biol. 124, 164–178. ( 10.1006/jsbi.1998.4044) [DOI] [PubMed] [Google Scholar]
- 3.Balashov SP. 2000. Protonation reactions and their coupling in bacteriorhodopsin. Biochim. Biophys. Acta 1460, 75–94. ( 10.1016/S0005-2728(00)00131-6) [DOI] [PubMed] [Google Scholar]
- 4.Kandori H. 2000. Role of internal water molecules in bacteriorhodopsin. Biochim. Biophys. Acta 1460, 177–191. ( 10.1016/S0005-2728(00)00138-9) [DOI] [PubMed] [Google Scholar]
- 5.Eigen M. 1964. Proton transfer, acid–base catalysis, and enzymatic hydrolysis. I. Elementary processes. Angew. Chem. Int. Ed. Engl. 3, 1–19. ( 10.1002/anie.196400011) [DOI] [Google Scholar]
- 6.Gerlt JA, Gassman PG. 1992. Understanding enzyme-catalyzed proton abstraction from carbon acids: details of stepwise mechanisms for .beta.-elimination reactions. J. Am. Chem. Soc. 114, 5928–5934. ( 10.1021/ja00041a004) [DOI] [Google Scholar]
- 7.Guillen Schlippe YV, Hedstrom L. 2005. A twisted base? The role of arginine in enzyme-catalyzed proton abstractions. Arch. Biochem. Biophys. 433, 266–278. ( 10.1016/j.abb.2004.09.018) [DOI] [PubMed] [Google Scholar]
- 8.Perrin CL, Nielson JB. 1997. ‘Strong’ hydrogen bonds in chemistry and biology. Annu. Rev. Phys. Chem. 48, 511–544. ( 10.1146/annurev.physchem.48.1.511) [DOI] [PubMed] [Google Scholar]
- 9.Warshel A, Papazyan A, Kollman PA. 1995. On low-barrier hydrogen bonds and enzyme catalysis. Science 269, 102–106. ( 10.1126/science.7661987) [DOI] [PubMed] [Google Scholar]
- 10.Saito K, Ishikita H. 2013. Formation of an unusually short hydrogen bond in photoactive yellow protein. Biochim. Biophys. Acta 1827, 387–394. ( 10.1016/j.bbabio.2012.11.009) [DOI] [PubMed] [Google Scholar]
- 11.Saito K, Rutherford AW, Ishikita H. 2013. Mechanism of proton-coupled quinone reduction in Photosystem II. Proc. Natl Acad. Sci. USA 110, 954–959. ( 10.1073/pnas.1212957110) [DOI] [PMC free article] [PubMed] [Google Scholar]
- 12.Jeffrey GA. 1997. An introduction to hydrogen bonding. Oxford, UK: Oxford University Press. [Google Scholar]
- 13.Frey PA. 2006. Isotope effects in the characterization of low barrier hydrogen bond. In Isotope effects in chemistry and biology (eds Kohen A, Limbach H-H.), pp. 975–993. Boca Raton, FL: CRC press. [Google Scholar]
- 14.Frey PA. 2001. Strong hydrogen bonding in molecules and enzymatic complexes. Magn. Reson. Chem. 39, S190–S198. ( 10.1002/mrc.953) [DOI] [Google Scholar]
- 15.Schutz CN, Warshel A. 2004. The low barrier hydrogen bond (LBHB) proposal revisited: the case of the Asp…His pair in serine proteases. Proteins 55, 711–723. ( 10.1002/prot.20096) [DOI] [PubMed] [Google Scholar]
- 16.Frey PA, Whitt SA, Tobin JB. 1994. A low-barrier hydrogen bond in the catalytic triad of serine proteases. Science 264, 1927–1930. ( 10.1126/science.7661899) [DOI] [PubMed] [Google Scholar]
- 17.Cleland WW, Kreevoy MM. 1994. Low-barrier hydrogen bonds and enzymic catalysis. Science 264, 1887–1890. ( 10.1126/science.8009219) [DOI] [PubMed] [Google Scholar]
- 18.Warshel A, Papazyan A. 1996. Energy considerations show that low-barrier hydrogen bonds do not offer a catalytic advantage over ordinary hydrogen bonds. Proc. Natl Acad. Sci. USA 93, 13 665–13 670. ( 10.1073/pnas.93.24.13665) [DOI] [PMC free article] [PubMed] [Google Scholar]
- 19.Schmidt am Busch M, Knapp E-W. 2004. Accurate pKa determination for a heterogeneous group of organic molecules. Chem. Phys. Chem. 5, 1513–1522. ( 10.1002/cphc.200400171) [DOI] [PubMed] [Google Scholar]
- 20.Schrödinger LLC. 2008. Jaguar, version 7.5. New York, NY: Schrödinger, LLC. See http://www.schrodinger.com/productpage/14/7.
- 21.Schmidt am Busch M, Knapp E-W. 2005. One-electron reduction potential for oxygen- and sulfur-centered organic radicals in protic and aprotic solvents. J. Am. Chem. Soc. 127, 15 730–15 737. ( 10.1021/ja0526923) [DOI] [PubMed] [Google Scholar]
- 22.Rabenstein B, Ullmann GM, Knapp E-W. 1998. Calculation of protonation patterns in proteins with structural relaxation and molecular ensembles—application to the photosynthetic reaction center. Eur. Biophys. J. 27, 626–637. ( 10.1007/s002490050174) [DOI] [Google Scholar]
- 23.Kato M, Pisliakov AV, Warshel A. 2006. Barrier for proton transport in aquaporins as a challenge for electrostatic models: the role of protein relaxation in mutational calculations. Proteins 64, 829–844. ( 10.1002/prot.21012) [DOI] [PubMed] [Google Scholar]
- 24.Khademi S, O'Connell JI, Remis J, Robles-Colmenares Y, Miercke LJ, Stroud RM. 2004. Mechanism of ammonia transport by Amt/MEP/Rh: structure of AmtB at 1.35 Å. Science 305, 1587–1594. ( 10.1126/science.1101952) [DOI] [PubMed] [Google Scholar]
- 25.Ishikita H, Knapp E-W. 2007. Protonation states of ammonia/ammonium in the hydrophobic pore of ammonia transporter protein AmtB. J. Am. Chem. Soc. 129, 1210–1215. ( 10.1021/ja066208n) [DOI] [PubMed] [Google Scholar]
- 26.Ho MC, Menetret JF, Tsuruta H, Allen KN. 2009. The origin of the electrostatic perturbation in acetoacetate decarboxylase. Nature 459, 393–397. ( 10.1038/nature07938) [DOI] [PubMed] [Google Scholar]
- 27.Ishikita H. 2010. Origin of the pKa shift of the catalytic lysine in acetoacetate decarboxylase. FEBS Lett. 584, 3464–3468. ( 10.1016/j.febslet.2010.07.003) [DOI] [PubMed] [Google Scholar]
- 28.Kokesh FC, Westheimer FH. 1971. A reporter group at the active site of acetoacetate decarboxylase. II. Ionization constant of the amino group. J. Am. Chem. Soc. 93, 7270–7274. ( 10.1021/ja00755a025) [DOI] [PubMed] [Google Scholar]
- 29.Nozaki Y, Tanford C. 1967. Acid–base titrations in concentrated guanidine hydrochloride. Dissociation constants of the guamidinium ion and of some amino acids. J. Am. Chem. Soc. 89, 736–742. ( 10.1021/ja00980a002) [DOI] [PubMed] [Google Scholar]
- 30.Ludwig ML, Pattridge KA, Metzger AL, Dixon MM, Eren M, Feng Y, Swenson RP. 1997. Control of oxidation–reduction potentials in flavodoxin from Clostridium beijerinckii: the role of conformation changes. Biochemistry 36, 1259–1280. ( 10.1021/bi962180o) [DOI] [PubMed] [Google Scholar]
- 31.Ludwig ML, Schopfer LM, Metzger AL, Pattridge KA, Massey V. 1990. Structure and oxidation-reduction behavior of 1-deaza-FMN flavodoxins: modulation of redox potentials in flavodoxins. Biochemistry 29, 10 364–10 375. ( 10.1021/bi00497a011) [DOI] [PubMed] [Google Scholar]
- 32.Ishikita H. 2007. Contributions of protein environment to redox potentials of quinones in flavodoxins from Clostridium beijerinckii. J. Biol. Chem. 282, 25 240–25 246. ( 10.1074/jbc.M702788200) [DOI] [PubMed] [Google Scholar]
- 33.Hunt J, Massey V, Dunham WR, Sands RH. 1993. Redox potentials of milk xanthine dehydrogenase. Room temperature measurement of the FAD and 2Fe/2S center potentials. J. Biol. Chem. 268, 18 685–18 691. [PubMed] [Google Scholar]
- 34.Barber MJ, Siegel LM. 1982. Oxidation–reduction potentials of molybdenum, flavin, and iron-sulfur centers in milk xanthine oxidase: variation with pH. Biochemistry 21, 1638–1647. ( 10.1021/bi00536a026) [DOI] [PubMed] [Google Scholar]
- 35.Ishikita H, Eger BT, Okamoto K, Nishino T, Pai EF. 2012. Protein conformational gating of enzymatic activity in xanthine oxidoreductase. J. Am. Chem. Soc. 134, 999–1009. ( 10.1021/ja207173p) [DOI] [PMC free article] [PubMed] [Google Scholar]
- 36.Limbach H-H, Tolstoy PM, Pérez-Hernández N, Guo J, Shenderovich IG, Denisov GS. 2009. OHO hydrogen bond geometries and NMR chemical shifts: from equilibrium structures to geometric H/D isotope effects, with applications for water, protonated water, and compressed ice. Isr. J. Chem. 49, 199–216. ( 10.1560/IJC.49.2.199) [DOI] [Google Scholar]
- 37.Hibbert F, Emsley J. 1990. Hydrogen bonding and chemical reactivity. Adv. Phys. Org. Chem. 26, 255–379. ( 10.1016/S0065-3160(08)60047-7) [DOI] [Google Scholar]
- 38.Saito K, Ishikita H. 2012. H atom positions and nuclear magnetic resonance chemical shifts of short H bonds in photoactive yellow protein. Biochemistry 51, 1171–1177. ( 10.1021/bi201877e) [DOI] [PubMed] [Google Scholar]
- 39.Yamaguchi S, Kamikubo H, Kurihara K, Kuroki R, Niimura N, Shimizu N, Yamazaki Y, Kataoka M. 2009. Low-barrier hydrogen bond in photoactive yellow protein. Proc. Natl Acad. Sci. USA 106, 440–444. ( 10.1073/pnas.0811882106) [DOI] [PMC free article] [PubMed] [Google Scholar]
- 40.Sprenger WW, Hoff WD, Armitage JP, Hellingwerf KJ. 1993. The eubacterium Ectothiorhodospira halophila is negatively phototactic, with a wavelength dependence that fits the absorption spectrum of the photoactive yellow protein. J. Bacteriol. 175, 3096–3104. [DOI] [PMC free article] [PubMed] [Google Scholar]
- 41.Baca M, Borgstahl GE, Boissinot M, Burke PM, Williams DR, Slater KA, Getzoff ED. 1994. Complete chemical structure of photoactive yellow protein: novel thioester-linked 4-hydroxycinnamyl chromophore and photocycle chemistry. Biochemistry 33, 14 369–14 377. ( 10.1021/bi00252a001) [DOI] [PubMed] [Google Scholar]
- 42.Kim M, Mathies RA, Hoff WD, Hellingwerf KJ. 1995. Resonance Raman evidence that the thioester-linked 4-hydroxycinnamyl chromophore of photoactive yellow protein is deprotonated. Biochemistry 34, 12 669–12 672. ( 10.1021/bi00039a024) [DOI] [PubMed] [Google Scholar]
- 43.Xie A, Hoff WD, Kroon AR, Hellingwerf KJ. 1996. Glu46 donates a proton to the 4-hydroxycinnamate anion chromophore during the photocycle of photoactive yellow protein. Biochemistry 35, 14 671–14 678. ( 10.1021/bi951898l) [DOI] [PubMed] [Google Scholar]
- 44.Demchuk E, Genick UK, Woo TT, Getzoff ED, Bashford D. 2000. Protonation states and pH titration in the photocycle of photoactive yellow protein. Biochemistry 39, 1100–1113. ( 10.1021/bi991513p) [DOI] [PubMed] [Google Scholar]
- 45.Saito K, Ishikita H. 2012. Energetics of short hydrogen bonds in photoactive yellow protein. Proc. Natl Acad. Sci. USA 109, 167–172. ( 10.1073/pnas.1113599108) [DOI] [PMC free article] [PubMed] [Google Scholar]
- 46.Borgstahl GE, Williams DR, Getzoff ED. 1995. 1.4 Å structure of photoactive yellow protein, a cytosolic photoreceptor: unusual fold, active site, and chromophore. Biochemistry 34, 6278–6287. ( 10.1021/bi00019a004) [DOI] [PubMed] [Google Scholar]
- 47.Getzoff ED, Gutwin KN, Genick UK. 2003. Anticipatory active-site motions and chromophore distortion prime photoreceptor PYP for light activation. Nat. Struct. Biol. 10, 663–668. ( 10.1038/nsb958) [DOI] [PubMed] [Google Scholar]
- 48.Kandori H, Iwata T, Hendriks J, Maeda A, Hellingwerf KJ. 2000. Water structural changes involved in the activation process of photoactive yellow protein. Biochemistry 39, 7902–7909. ( 10.1021/bi000357f) [DOI] [PubMed] [Google Scholar]
- 49.Sigala PA, Tsuchida MA, Herschlag D. 2009. Hydrogen bond dynamics in the active site of photoactive yellow protein. Proc. Natl Acad. Sci. USA 106, 9232–9237. ( 10.1073/pnas.0900168106) [DOI] [PMC free article] [PubMed] [Google Scholar]
- 50.Anderson S, Crosson S, Moffat K. 2004. Short hydrogen bonds in photoactive yellow protein. Acta Crystallogr. D Biol. Crystallogr. 60, 1008–1016. ( 10.1107/S090744490400616X) [DOI] [PubMed] [Google Scholar]
- 51.Ishida T. 2006. Low-barrier hydrogen bond hypothesis in the catalytic triad residue of serine proteases: correlation between structural rearrangement and chemical shifts in the acylation process. Biochemistry 45, 5413–5420. ( 10.1021/bi051515b) [DOI] [PubMed] [Google Scholar]
- 52.Steiner T. 1998. Lengthening of the covalent X−H bond in heteronuclear hydrogen bonds quantified from organic and organometallic neutron crystal structures. J. Phys. Chem. A 102, 7041–7052. ( 10.1021/jp981604g) [DOI] [Google Scholar]
- 53.Perrin CL, Thoburn JD. 1992. Symmetries of hydrogen bonds in monoanions of dicarboxylic acids. J. Am. Chem. Soc. 114, 8559–8565. ( 10.1021/ja00048a031) [DOI] [Google Scholar]
- 54.Perrin CL. 2010. Are short, low-barrier hydrogen bonds unusually strong? Acc. Chem. Res. 43, 1550–1557. ( 10.1021/ar100097j) [DOI] [PubMed] [Google Scholar]
- 55.Hoff WD, van Stokkum IH, van Ramesdonk HJ, van Brederode ME, Brouwer AM, Fitch JC, Meyer TE, van Grondelle R, Hellingwerf KJ. 1994. Measurement and global analysis of the absorbance changes in the photocycle of the photoactive yellow protein from Ectothiorhodospira halophila. Biophys. J. 67, 1691–1705. ( 10.1016/S0006-3495(94)80643-5) [DOI] [PMC free article] [PubMed] [Google Scholar]
- 56.Ujj L, Devanathan S, Meyer TE, Cusanovich MA, Tollin G, Atkinson GH. 1998. New photocycle intermediates in the photoactive yellow protein from Ectothiorhodospira halophila: picosecond transient absorption spectroscopy. Biophys. J. 75, 406–412. ( 10.1016/S0006-3495(98)77525-3) [DOI] [PMC free article] [PubMed] [Google Scholar]
- 57.Unno M, Kumauchi M, Hamada N, Tokunaga F, Yamauchi S. 2004. Resonance Raman evidence for two conformations involved in the L intermediate of photoactive yellow protein. J. Biol. Chem. 279, 23 855–23 858. ( 10.1074/jbc.C400137200) [DOI] [PubMed] [Google Scholar]
- 58.Ihee H, et al. 2005. Visualizing reaction pathways in photoactive yellow protein from nanoseconds to seconds. Proc. Natl Acad. Sci. USA 102, 7145–7150. ( 10.1073/pnas.0409035102) [DOI] [PMC free article] [PubMed] [Google Scholar]
- 59.Bernard C, Houben K, Derix NM, Marks D, van der Horst MA, Hellingwerf KJ, Boelens R, Kaptein R, van Nuland NA. 2005. The solution structure of a transient photoreceptor intermediate: Δ25 photoactive yellow protein. Structure 13, 953–962. ( 10.1016/j.str.2005.04.017) [DOI] [PubMed] [Google Scholar]
- 60.Carroll EC, Song SH, Kumauchi M, van Stokkum IH, Jailaubekov A, Hoff WD, Larsen DS. 2010. Subpicosecond excited-state proton transfer preceding isomerization during the photorecovery of photoactive yellow protein. J. Phys. Chem. Lett. 1, 2793–2799. ( 10.1021/jz101049v) [DOI] [PMC free article] [PubMed] [Google Scholar]
- 61.Saito K, Kandori H, Ishikita H. 2012. Factors that differentiate the H-bond strengths of water near the Schiff bases in bacteriorhodopsin and Anabaena sensory rhodopsin. J. Biol. Chem. 287, 34 009–34 018. [DOI] [PMC free article] [PubMed] [Google Scholar]
- 62.Brudler R, et al. 2000. Coupling of hydrogen bonding to chromophore conformation and function in photoactive yellow protein. Biochemistry 39, 13 478–13 486. ( 10.1021/bi0009946) [DOI] [PubMed] [Google Scholar]
- 63.Joshi CP, Otto H, Hoersch D, Meyer TE, Cusanovich MA, Heyn MP. 2009. Strong hydrogen bond between glutamic acid 46 and chromophore leads to the intermediate spectral form and excited state proton transfer in the Y42F mutant of the photoreceptor photoactive yellow protein. Biochemistry 48, 9980–9993. ( 10.1021/bi9012897) [DOI] [PubMed] [Google Scholar]
- 64.Saito K, Shen J-R, Ishida T, Ishikita H. 2011. Short hydrogen-bond between redox-active tyrosine YZ and D1-His190 in the photosystem II crystal structure. Biochemistry 50, 9836–9844. ( 10.1021/bi201366j) [DOI] [PubMed] [Google Scholar]
- 65.van Brederode ME, Gensch T, Hoff WD, Hellingwerf KJ, Braslavsky SE. 1995. Photoinduced volume change and energy storage associated with the early transformations of the photoactive yellow protein from Ectothiorhodospira halophila. Biophys. J. 68, 1101–1109. ( 10.1016/S0006-3495(95)80284-5) [DOI] [PMC free article] [PubMed] [Google Scholar]
- 66.Diner BA, Rappaport F. 2002. Structure dynamics, and energetics of the primary photochemistry of photosystem II of oxygenic photosynthesis. Annu. Rev. Plant Biol. 53, 551–580. ( 10.1146/annurev.arplant.53.100301.135238) [DOI] [PubMed] [Google Scholar]
- 67.Renger G, Renger T. 2008. Photosystem II: the machinery of photosynthetic water splitting. Photosynth. Res. 98, 53–80. ( 10.1007/s11120-008-9345-7) [DOI] [PubMed] [Google Scholar]
- 68.Holzwarth AR. 2008. Ultrafast primary reactions in the photosystems of oxygen evolving organisms. In Ultrashort laser pulses in biology and medicine, biological and medical physics, biomedical engineering (eds Braun M, Gilch P, Zinth W.), pp. 141–164. Dordrecht, The Netherlands: Springer. [Google Scholar]
- 69.Cardona T, Sedoud A, Cox N, Rutherford AW. 2012. Charge separation in photosystem II: a comparative and evolutionary overview. Biochim. Biophys. Acta 1817, 26–43. ( 10.1016/j.bbabio.2011.07.012) [DOI] [PubMed] [Google Scholar]
- 70.Muh F, Glockner C, Hellmich J, Zouni A. 2012. Light-induced quinone reduction in photosystem II. Biochim. Biophys. Acta 1817, 44–65. ( 10.1016/j.bbabio.2011.05.021) [DOI] [PubMed] [Google Scholar]
- 71.Petrouleas V, Crofts AR. 2005. The iron-quinone acceptor complex. In Photosystem II: the light-driven water: plastoquinone oxidoreductase (eds Wydrzynski T, Satoh K.), pp. 177–206. Dordrecht, The Netherlands: Springer. [Google Scholar]
- 72.Kawakami K, Umena Y, Kamiya N, Shen J-R. 2011. Structure of the catalytic, inorganic core of oxygen-evolving photosystem II at 1.9 Å resolution. J. Photochem. Photobiol. B 104, 9–18. ( 10.1016/j.jphotobiol.2011.03.017) [DOI] [PubMed] [Google Scholar]
- 73.Ishikita H, Knapp E-W. 2005. Control of quinone redox potentials in photosystem II: electron transfer and photoprotection. J. Am. Chem. Soc. 127, 14 714–14 720. ( 10.1021/ja0446045) [DOI] [PubMed] [Google Scholar]
- 74.Robinson HH, Crofts AR. 1984. Kinetics of proton uptake and the oxidation–reduction reactions of the quinone acceptor complex of photosystem_II from pea chloroplasts. In Advances in photosynthesis research, vol. 1 (ed. Sybesma C.), pp. 477–480. The Hague: Martinus Nijhoff/Dr. W. Junk Publishers. [Google Scholar]
- 75.Rutherford AW, Renger G, Koike H, Inoue Y. 1984. Thermoluminescence as a probe of photosystem II. The redox and protonation states of the secondary acceptor quinone and the O2-evolving enzyme. Biochim. Biophys. Acta 767, 548–556. ( 10.1016/0005-2728(84)90054-9) [DOI] [Google Scholar]
- 76.Crofts AR, Robinson HH, Andrews K, Van Doren S, Berry E. 1987. Catalytic sites for reduction and oxidation of quinones. In Cytochrome systems: molecular biology and bioenergetics (eds Papa S, Chance B, Ernster L.), pp. 617–624. New York, NY: Plenum Publication. [Google Scholar]
- 77.Bruice TC, Schmir GL. 1958. Imidazole catalysis. II. The reaction of substituted imidazoles with phenyl acetates in aqueous solution. J. Am. Chem. Soc. 80, 148–156. ( 10.1021/ja01534a040) [DOI] [Google Scholar]
- 78.Okamura MY, Paddock ML, Graige MS, Feher G. 2000. Proton and electron transfer in bacterial reaction centers. Biochim. Biophys. Acta 1458, 148–163. ( 10.1016/S0005-2728(00)00065-7) [DOI] [PubMed] [Google Scholar]
- 79.Swallow AJ. 1982. Physical chemistry of biologically active quinones. In Function of quinones in energy conserving systems (ed. Trumpower BL.), pp. 59–72. New York, NY: Academic Press. [Google Scholar]
- 80.Zhu Z, Gunner MR. 2005. Energetics of quinone-dependent electron and proton transfers in Rhodobacter sphaeroides photosynthetic reaction centers. Biochemistry 44, 82–96. ( 10.1021/bi048348k) [DOI] [PubMed] [Google Scholar]
- 81.Zu Y, Couture MM, Kolling DR, Crofts AR, Eltis LD, Fee JA, Hirst J. 2003. Reduction potentials of Rieske clusters: importance of the coupling between oxidation state and histidine protonation state. Biochemistry 42, 12 400–12 408. ( 10.1021/bi0350957) [DOI] [PubMed] [Google Scholar]
- 82.Hsueh KL, Westler WM, Markley JL. 2010. NMR investigations of the Rieske protein from Thermus thermophilus support a coupled proton and electron transfer mechanism. J. Am. Chem. Soc. 132, 7908–7918. ( 10.1021/ja1026387) [DOI] [PMC free article] [PubMed] [Google Scholar]
- 83.Berthomieu C, Hienerwadel R. 2001. Iron coordination in photosystem II: interaction between bicarbonate and the QB pocket studied by Fourier transform infrared spectroscopy. Biochemistry 40, 4044–4052. ( 10.1021/bi002236l) [DOI] [PubMed] [Google Scholar]
- 84.Loll B, Kern J, Saenger W, Zouni A, Biesiadka J. 2005. Towards complete cofactor arrangement in the 3.0 Å resolution structure of photosystem II. Nature 438, 1040–1044. ( 10.1038/nature04224) [DOI] [PubMed] [Google Scholar]
- 85.Guskov A, Kern J, Gabdulkhakov A, Broser M, Zouni A, Saenger W. 2009. Cyanobacterial photosystem II at 2.9-Å resolution and the role of quinones, lipids, channels and chloride. Nat. Struct. Mol. Biol. 16, 334–342. ( 10.1038/nsmb.1559) [DOI] [PubMed] [Google Scholar]
- 86.Faller P, Goussias C, Rutherford AW, Un S. 2003. Resolving intermediates in biological proton-coupled electron transfer: a tyrosyl radical pair to proton movement. Proc. Natl Acad. Sci. USA 100, 8732–8735. ( 10.1073/pnas.1530926100) [DOI] [PMC free article] [PubMed] [Google Scholar]
- 87.Yan S, Kang S, Hayashi T, Mukamel S, Lee JY. 2009. Computational studies on electron and proton transfer in phenol-imidazole-base triads. J. Comput. Chem. 31, 393–402. [DOI] [PubMed] [Google Scholar]
- 88.Un S, Boussac A, Sugiura M. 2007. Characterization of the tyrosine-Z radical and its environment in the spin-coupled S2TyrZ* state of photosystem II from Thermosynechococcus elongatus. Biochemistry 46, 3138–3150. ( 10.1021/bi062084f) [DOI] [PubMed] [Google Scholar]
- 89.Barry BA, Babcock GT. 1987. Tyrosine radicals are involved in the photosynthetic oxygen-evolving system. Proc. Natl Acad. Sci. USA 84, 7099–7103. ( 10.1073/pnas.84.20.7099) [DOI] [PMC free article] [PubMed] [Google Scholar]
- 90.Debus RJ, Barry BA, Babcock GT, McIntosh L. 1988. Site-directed mutagenesis identifies a tyrosine radical involved in the photosynthetic oxygen-evolving system. Proc. Natl Acad. Sci. USA 85, 427–430. ( 10.1073/pnas.85.2.427) [DOI] [PMC free article] [PubMed] [Google Scholar]
- 91.Vermass WFJ, Rutherford AW, Hansson O. 1988. Site-directed mutagenesis in photosystem II of the cyanobacterium Synechocystis sp. PCC 6803: donor D is a tyrosine residue in the D2 protein. Proc. Natl Acad. Sci. USA 85, 8477–8481. ( 10.1073/pnas.85.22.8477) [DOI] [PMC free article] [PubMed] [Google Scholar]
- 92.Rutherford AW, Boussac A, Faller P. 2004. The stable tyrosyl radical in photosystem II: why D? Biochim. Biophys. Acta 1655, 222–230. ( 10.1016/j.bbabio.2003.10.016) [DOI] [PubMed] [Google Scholar]
- 93.Babcock GT, Barry BA, Debus RJ, Hoganson CW, Atamian M, McIntosh L, Sithole I, Yocum CF. 1989. Water oxidation in photosystem II: from radical chemistry to multielectron chemistry. Biochemistry 28, 9557–9565. ( 10.1021/bi00451a001) [DOI] [PubMed] [Google Scholar]
- 94.Diner BA, Babcock GT. 1996. Structure, dynamics, and energy conversion efficiency in photosystem II. In oxygenic photosynthesis: the light reactions (eds Ort DR, Yocum CF.), pp. 213–247. Dordrecht, The Netherlands: Kluwer Academic Publishers. [Google Scholar]
- 95.Berthomieu C, Hienerwadel R. 2005. Vibrational spectroscopy to study the properties of redox-active tyrosines in photosystem II and other proteins. Biochim. Biophys. Acta 1707, 51–66. ( 10.1016/j.bbabio.2004.03.011) [DOI] [PubMed] [Google Scholar]
- 96.Faller P, Debus RJ, Brettel K, Sugiura M, Rutherford AW, Boussac A. 2001. Rapid formation of the stable tyrosyl radical in photosystem II. Proc. Natl Acad. Sci. USA 98, 14 368–14 373. ( 10.1073/pnas.251382598) [DOI] [PMC free article] [PubMed] [Google Scholar]
- 97.Buser CA, Thompson LK, Diner BA, Brudvig GW. 1990. Electron-transfer reactions in manganese-depleted photosystem II. Biochemistry 29, 8977–8985. ( 10.1021/bi00490a014) [DOI] [PubMed] [Google Scholar]
- 98.Ferreira KN, Iverson TM, Maghlaoui K, Barber J, Iwata S. 2004. Architecture of the photosynthetic oxygen-evolving center. Science 303, 1831–1838. ( 10.1126/science.1093087) [DOI] [PubMed] [Google Scholar]
- 99.Hienerwadel R, Diner BA, Berthomieu C. 2008. Molecular origin of the pH dependence of tyrosine D oxidation kinetics and radical stability in photosystem II. Biochim. Biophys. Acta 1777, 525–531. ( 10.1016/j.bbabio.2008.04.004) [DOI] [PubMed] [Google Scholar]
- 100.Takahashi R, Sugiura M, Noguchi T. 2007. Water molecules coupled to the redox-active tyrosine Y(D) in photosystem II as detected by FTIR spectroscopy. Biochemistry 46, 14 245–14 249. ( 10.1021/bi701752d) [DOI] [PubMed] [Google Scholar]
- 101.Tang XS, Chisholm DA, Dismukes GC, Brudvig GW, Diner BA. 1993. Spectroscopic evidence from site-directed mutants of Synechocystis PCC6803 in favor of a close interaction between histidine 189 and redox-active tyrosine 160, both of polypeptide D2 of the photosystem II reaction center. Biochemistry 32, 13 742–13 748. ( 10.1021/bi00212a045) [DOI] [PubMed] [Google Scholar]
- 102.Mino H, Satoh J-I, Kawamori A, Toriyama K, Zimmermann J-L. 1993. Matrix ENDOR of tyrosine D+ in oriented Photosystem II membranes. Biochim. Biophys. Acta 1144, 426–433. ( 10.1016/0005-2728(93)90130-8) [DOI] [Google Scholar]
- 103.Manna P, LoBrutto R, Eijckelhoff C, Dekker JP, Vermaas W. 1998. Role of Arg180 of the D2 protein in photosystem II structure and function. Eur. J. Biochem. 251, 142–154. ( 10.1046/j.1432-1327.1998.2510142.x) [DOI] [PubMed] [Google Scholar]
- 104.Saito K, Rutherford AW, Ishikita H. 2013. Mechanism of tyrosine D oxidation in Photosystem II. Proc. Natl Acad. Sci. USA 110, 7690–7695. ( 10.1073/pnas.1300817110) [DOI] [PMC free article] [PubMed] [Google Scholar]
- 105.Ishikita H, Knapp EW. 2006. Function of redox-active tyrosine in photosystem II. Biophys. J. 90, 3886–3896. ( 10.1529/biophysj.105.076984) [DOI] [PMC free article] [PubMed] [Google Scholar]
- 106.Mikenda W. 1986. Stretching frequency versus bond distance correlation of O-D(H)...Y (Y=N, O, S, Se, Cl, Br, I) hydrogen bonds in solid hydrates. J. Mol. Struct. 147, 1–15. ( 10.1016/0022-2860(86)87054-5) [DOI] [Google Scholar]