

Abstract
It has recently been suggested that the competition for a finite pool of microRNAs (miRNA) gives rise to effective interactions among their common targets (competing endogenous RNAs or ceRNAs) that could prove to be crucial for posttranscriptional regulation. We have studied a minimal model of posttranscriptional regulation where the emergence and the nature of such interactions can be characterized in detail at steady state. Sensitivity analysis shows that binding free energies and repression mechanisms are the key ingredients for the cross-talk between ceRNAs to arise. Interactions emerge in specific ranges of repression values, can be symmetrical (one ceRNA influences another and vice versa) or asymmetrical (one ceRNA influences another but not the reverse), and may be highly selective, while possibly limited by noise. In addition, we show that nontrivial correlations among ceRNAs can emerge in experimental readouts due to transcriptional fluctuations even in the absence of miRNA-mediated cross-talk.
Introduction
MicroRNAs (miRNAs) are 21–23 nucleotides (nt) long, endogenous, noncoding RNA molecules, that perform posttranscriptional regulation by specifically binding target messenger RNAs (mRNAs), typically leading to a reduction in the levels of the corresponding proteins (1–3). They are transcribed from independent miRNA genes or from introns of protein-coding transcripts. After being processed into maturity, a miRNA is loaded onto a specialized class of proteins to form the RNA-induced silencing complex (RISC), which specifically binds miRNA response elements (MREs) located in target mRNAs (usually in their 3′ untranslated region) through a basepairing recognition mechanism which requires at least 6-nt complementarity. The whole process, known as RNA interference, results in gene silencing through translation inhibition and mRNA destabilization (3,4).
Each mRNA can typically interact with several miRNAs, and each miRNA can target many different mRNAs. Within the complex network of potential interactions that ensues, miRNAs have long been thought to function mainly as fine-tuners for regulation by weakly dampening the protein output (1,5). This view is supported by the fact that the statistically overrepresented motifs (feed-forward or feed-back loops) that have been identified in the known miRNA–mRNA interaction network are indeed capable of buffering the noise level in the output layer (proteins) (6–9). More recently, the attention has been directed to system-level effects. In particular, it has been realized that miRNA-based regulation is strongly affected by global properties like the total concentration of available targets (a feature known as dilution effect (10)). The combination of the repressive effects of miRNAs on their targets and of the weakening of such repression due to dilution effects lead to effective, positive interactions between joint targets of a given miRNA (cross-talk interactions). In addition, it is now known that pseudo-genes and other long noncoding RNAs also possess MREs and can be bound by the RISC. This implies that, besides mRNAs, noncoding RNAs sharing identical MREs compete for common miRNAs (11,12). Thus, miRNAs appear to mediate the cross-talk between a broad class of competing endogenous RNAs (ceRNAs) which includes both mRNAs and noncoding RNAs commonly targeted by miRNAs, leading to a large-scale network of indirect interactions across the transcriptome (13,14). Recent studies have shown that such interactions play a central role in many biological contexts, from muscle differentiation (12) to cancer (15,16).
Despite the body of experimental evidence, a clear quantitative understanding of miRNA-mediated regulation is still lacking. To address this issue, we formulate a minimal model of posttranscriptional regulation and analyze its steady state, aiming at quantifying the intensity of the interactions arising from competition through an analysis of the sensitivity to changes in the ceRNA transcription rates. We show that binding free energies and repression mechanisms are the key ingredients for the cross-talk between ceRNAs to arise. The emergent interactions can be symmetrical (one ceRNA influences another and vice versa) or asymmetrical (one ceRNA influences another but not the reverse) and may be highly selective, although possibly hampered by noise.
We furthermore argue that the identification of cross-talk from gene expression data can be hindered by the fact that statistically significant correlations among ceRNAs can emerge in the experimental readouts simply due to transcriptional fluctuations.
Results
One miRNA species, N ceRNA species
We start by considering a highly simplified system formed by N different species of ceRNA molecules, labeled mi (i = 1,…,N), targeted by a single miRNA species labeled μ. Each mi value can reversibly bind μ in complexes labeled ci. Conforming to the experimental evidence (17,18), we assume that translational repression is fast and precedes mRNA destabilization, implying that complexes cannot be translated and repression of translation simply occurs by sequestration of free ceRNAs. Taking a constant translation rate, the levels of unbound ceRNA can be used as a direct proxy for protein concentrations at steady state. The allowed processes with their respective rates are then as follows (see Fig. 1):
Figure 1.
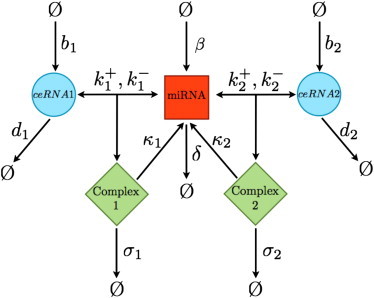
Schematic representation of the considered processes for a system N = 2 ceRNA species and one miRNA.
Note that complexes are assumed to be degraded either through a catalytic channel (which gives back the miRNA to the cytosol) or through a stoichiometric channel (where both molecules are degraded with the complex). This choice serves the purpose of keeping the model as general as possible. The quantity wi = σi/(σi + κi) measures the degree of stoichiometricity of complex decay: it ranges between 0 (in the case of fully catalytic degradation, σi = 0, κi > 0) and 1 (in the case of fully stoichiometric degradation, σi > 0, κi = 0). It will play an important role in our theory and we will refer to this as the stoichiometricity ratio. The exact mechanism of target repression is still a matter of debate, and during the past few years, several mechanisms have been reported (2–4). Generically, miRNAs incorporated into the RISC do not seem to decay with their target, thus becoming again available for a new round of target RNA silencing. Nevertheless, complexes may enter in specific cellular structurelike P-bodies, thus resulting in an effective stoichiometric sequestration of both the miRNA and the target.
Clearly, this setup represents a coarse-graining of the real biological processes, which typically requires multiple catalyzed elementary steps (e.g., in the formation of the RISC). However, such details may be disregarded if, in presence of many different targets, the only rate-limiting factor is the miRNA concentration. This will indeed be our main assumption (together with the fact that mi values can only interact through μ).
Denoting the concentration of species x by [x], we can write the mass-action kinetic rate equations for the above system as
| (1) |
In turn, they lead to the steady-state equations
| (2) |
where we defined mi⋆ = bi/di, ci⋆ = bi/(σi + κi), and
| (3) |
with ϕi = ki−/(σi + κi). Note that mi⋆ and ci⋆ represent the maximum concentrations of free ceRNAs and complexes, achievable in absence of miRNAs and in the limit of infinite miRNA concentration, respectively. A simple calculation shows that the binding free energy of the complex (in units of kBT) is given by
| (4) |
This clarifies the physical meaning of ϕi: if ϕi >> 1, then complex formation is close to equilibrium; if ϕi << 1 instead, the process is unbalanced toward association.
On the other hand, one sees that the quantity μ0,i defined in Eq. 3 (which only depends on the kinetic parameters of ceRNA mi) gives the miRNA level for which the concentrations of free ceRNAs and of complexes equal half of their theoretical maxima. Therefore, in practice, we have the following situation:
Case 1. If [μ] << μ0,i (or [μ]/μ0,i| = (ϵ)), then [mi] << mi⋆ and [ci] << ci⋆: here the levels of free ceRNAs are largest, while complexes are roughly absent; spontaneous degradation is the dominant channel of ceRNA decay.
Case 2. If [μ] ≃ μ0,i (or |1 − [μ]/μ0,i| = (ϵ)), then [mi] ≃ mi⋆/2 and ci ≃ ci⋆/2: here free ceRNA concentration is roughly half the theoretical maximum; spontaneous ceRNAs decay and miRNA-mediated degradations have similar weight.
Case 3. If [μ] >> μ0,i (or μ0,i/[μ] = (ϵ)), then [mi] << mi⋆ and [ci] ≃ ci⋆: here the levels of complexes are largest, while free ceRNAs are roughly absent; miRNA-mediated degradation is the prevailing channel of ceRNA decay.
It is reasonable to expect that in Cases 1 and 3, the steady-state level of free ceRNA [mi] will only be weakly sensible to (small) variations in [μ]. We shall call these regimes Free and Bound ( and for brevity), respectively. In Case 2, instead, the microRNA concentration lies in the dynamical range of Fi, so that [mi] will respond to (small) variations in [μ]. We will call this regime Susceptible ( for brevity). The outlook is that once the kinetic parameters of the ceRNAs are given, the μ0,i values are given as well, and the miRNA level suffices to show whether a ceRNA is in the -, -, or -regime.
Biologically reasonable values of the model parameters (ki+ ∼ 10−3 nM−1 s−1 and di ∼ 10−4 s−1 as used in Wang et al. (19)) suggest that di/ki+ ∼ μ0,i should approximatively have a nanomolar order of magnitude, which is comparable to the range of miRNA concentrations (20,21). Note, however, that analysis of the RNA interference enzyme complex has shown that its kinetics can vary substantially across different targets and that it is strongly affected by the degree of complementarity (22).
This means that, in principle, different targets may have very different μ0,i values and may thus be located in distinct regimes of regulation at fixed [μ] and that the three states (, , ) are actually assumed by ceRNAs. Furthermore, different miRNAs species may have concentrations spanning many orders of magnitude in a given cell type (23). For instance, it has been experimentally demonstrated that only the most abundant miRNAs have significant impact on gene expression and mediate target suppression (23), suggesting that ceRNAs are free from miRNAs when their regulators have very low concentrations. Moreover, it has been observed that protein production in the presence of miRNA is highly repressed below a given threshold level for mRNA transcriptional activity and it responds sensitively to transcription above this threshold (24), suggesting the transition from an unexpressed, bound regime to an expressed, susceptible one.
To illustrate the emergent interactions between ceRNAs, we plot in Fig. 2 the steady-state levels of m1, m2, and μ as a function of b1 in a system with N = 2 in which all other kinetic parameters are fixed. One clearly sees that, even within this basic model, a change in the transcription rate of a ceRNA can affect the steady-state concentration of a different ceRNA. The shaded area in the top panel of Fig. 2 highlights the difference between the steady-state level of ceRNA2 with or without (i.e., for b1 = 0) its competitor m1: [m2] is sensible to variations of b1 (via the change of the free miRNA concentration [μ], which is correspondingly dropping) only in an intermediate, narrow interval.
Figure 2.
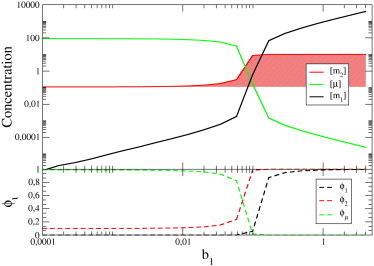
(Top) Steady-state concentrations in a system with N = 2 ceRNAs, obtained by fixing all parameters but the transcription rate b1 of ceRNA 1. (Bottom) Fractions of free molecules, namely , , and , versus b1. The dynamical range of the cross-talk interaction between the two ceRNAs corresponds to the window where free and bound molecules have similar concentration, i.e., to the -regime. Parameters for this case (in their respective units) are as follows: b2 = 10, , , , , σ1 = σ2 = 10, and κ1 = κ2 = 1.
We will show that the intensity of such a cross-talk depends on the regimes to which the ceRNAs belong. In essence, strong interactions can be achieved only (symmetrically) between ceRNAs in the -regimes, and (asymmetrically) from a ceRNA in the -regime to a ceRNA in the -regime. This scenario will define a selective, possibly asymmetric channel of communication that links ceRNAs targeted by a common miRNA.
Our goal here is to characterize cross-talk interactions quantitatively by computing the susceptibilities (i, j = 1,…, N),
| (5) |
which for i ≠ j measure the magnitude of the interaction between ceRNA mi and ceRNA mj. Using Eq. 2, we get
| (6) |
The cross-susceptibility (the last term in Eq. 6) can thus be seen as the product of two factors: the response of the miRNA level to perturbations of the transcription rate of ceRNA mj, and the response of the level of ceRNA mi ([mi] = mi⋆Fi) to perturbations of the miRNA level. For the latter, we get
| (7) |
Note that, expectedly, this function is negative and is largest for [μ] ≃ μ0,i, i.e., when the ceRNA is in the -regime. To compute ∂[μ]/∂bj, we need an explicit expression for [μ], which should be obtained from the steady-state condition in Eq. 2. We rewrite this as
| (8) |
where . Equation 8 tells us that if σi = 0 for all i (i.e., if complex decay is purely catalytic), then [μ] = β/δ and no cross-talk is achievable because [μ] is independent of bj. If, however, σi ≠ 0 for some i, then other solutions are possible. In particular, Eq. 8 is an algebraic equation of order N + 1 at most, an approximate solution of which can be obtained under the assumption that ceRNAs can be separated in the different regimes defined above. Using the fact that, up to next-to-leading order in << 1,
| (9) |
and neglecting (when necessary) terms of order 2 or higher, one finds that (see Derivation of the miRNA Concentration at Steady-State in the Supporting Material for a detailed derivation)
| (10) |
One now sees that
| (11) |
where we have defined the shorthand
| (12) |
Given a shift in the level of a ceRNA, the response of the miRNA is always negative (because an increase in bj causes an increase in the level of complexes cj). Also, if mj ∈ , then [μ]/μ0,j << 1, i.e., the level of microRNA is roughly insensitive to small changes of the production rate of ceRNAs in the Free regime.
Finally, combining Eqs. 7 and 11, we obtain for χij,
| (13) |
where WR(i),R(j) is a coefficient that depends only on the regimes R(i) and R(j) to which i and j belong. In other words, R(i),R(j) ∈ {,,} and the 3×3 matrix is given by
| (14) |
Three important observations can now be made about χij:
-
1.
Because both terms in Eqs. 7 and 11 are negative, the cross-talk between ceRNAs tends to correlate their levels.
-
2.
The matrix is not symmetric, as might perhaps have been expected.
-
3.
For i ≠ j, all of the elements of are of order ε or smaller except and , which are of order 1.
This implies that, in this scenario, two types of effective interactions arise: the first one encodes the response of a ceRNA in the -regime to a perturbation of another ceRNA in the -regime, and it is symmetric; the second one encodes the response of a ceRNA in the -regime to a perturbation of a ceRNA in the -regime, and it is not symmetric (i.e., perturbing the susceptible ceRNA the bound one will not respond).
In other words, the scenario described here corresponds to a linear response theory in which a change in the transcription rate of a ceRNA (i.e., bj → bj + δbj) induces a shift in [mj] (i.e., with χij > 0) and a shift in the level of miRNA (i.e., with ). In turn, this affects [mi] (i.e., with χij > 0). So, for instance, if δbj > 0, then [mj] increases, [μ] decreases, and [mi] increases. The quantities can be seen to induce a hierarchy of interactions: ceRNAs in the -regime (higher binding affinity) can unidirectionally affect ceRNAs in the -regime, which in turn may influence other ceRNAs in the -regime. On the other hand, ceRNAs in the -regime (lower binding affinity) interact weakly with the rest of the system and fluctuations in their transcription rates do not propagate to other ceRNAs. It is important to remark that cross-talk appears only when the miRNA level is in a specific range, implying that the structure of the emergent interaction network is flexible and dynamical: the set of ceRNA species that interact may change upon varying [μ].
The emergence of selectivity and directionality as features of the cross-talk can be seen in a concrete case in Fig. 3, where we plot the susceptibilities for a system of N = 4 ceRNAs. One sees that different interactions are switched on in different ranges of values for the miRNA transcription rate, leading to a gradual modification of the structure of the interaction network as β changes. Note that heterogeneity in the quantities μ0,i leads to interaction asymmetry. A schematic summary of the cross-talk in this system is given in Fig. 4.
Figure 3.
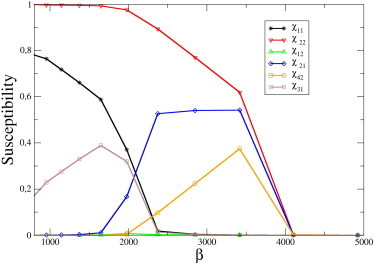
Susceptibilities χij in a system of N = 4 ceRNAs, as a function of miRNA transcription rate β (all other parameters being fixed). In this example, ceRNAs are cast in two groups: group A, formed by ceRNAs m1 and m3, and group B, formed by ceRNAs m2 and m4. CeRNAs belonging to the same group share identical kinetic parameters. In particular, . For β smaller than ∼500, no cross-talk is observed; however, as β increases, a symmetric interaction between ceRNAs in group A (of magnitude comparable to the self-susceptibilities) appears: . As β increases further, this interaction is switched off, and ceRNAs in group B begin to cross-talk instead: . In this region, a change of transcription of a ceRNA in group A can affect the level of ceRNAs in group B, but not vice versa (asymmetric cross-talk): . Finally, for sufficiently large β, no cross-talk takes place.
Figure 4.
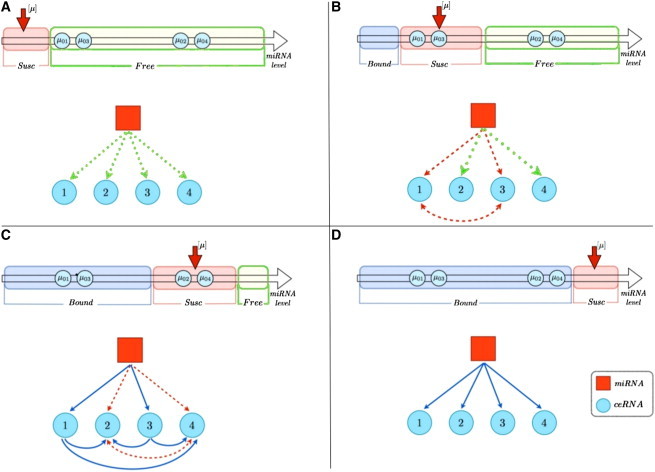
Schematic representation of the patterns of interactions arising in a system of N = 4 ceRNAs at different miRNA levels (increasing from A to D). (A) All ceRNAs are in the -regime () and there is no interaction between them. (B) ceRNAs 1 and 3 are in the -regime () and a symmetrical interaction between them is switched on. (C) ceRNAs 1 and 3 are now in the -regime () while ceRNAs 2 and 4 are in the -regime (): the resulting interactions are symmetric between 2 and 4, and asymmetric between ceRNAs 1 and 3 on ceRNAs 2 and 4. (D) All ceRNAs are in the -regime () and no cross-talk occurs.
We note that the intensity of the cross-talk described by Eq. 13 is modulated by the factor
| (15) |
where we used [μ] ≃ μ0,k for k ∈ and neglected the contribution to [μ] due to ceRNAs in the -regime (see Eq. 10), which is of order ε. Again, we see that an effective interaction requires some degree of stoichiometric degradation: if wj = 0 (i.e., if the complex decays in a purely catalytic manner) the cross-susceptibility vanishes. In addition, Eq. 15 suggests that the magnitude of the interaction is weakened only by ceRNAs lying in the -regime, so that, even in the presence of a large number of interacting ceRNA species, cross-talk can be large if the overall population of ceRNAs in the -regime is restricted. On the other hand, many factors, such as the overall population of ceRNAs in the -regime, affect the rate of miRNA transcription required in order for a given ceRNA to be susceptible.
A rough approximate expression for the range Δβ of values of the miRNA transcription rate where ceRNA mi is most responsive to the miRNA can be derived, considering as susceptible a window Δμ of [μ] values such that . If so, then
| (16) |
where we used . One sees that Δβ mainly depends on the transcription rate of the overall population of ceRNAs in the susceptible regime and on the degree of stoichiometricity of degradation.
Finally, we observe that an analogous cross-talk scenario emerges for a system in which M miRNA species share the same target RNA: the level of a miRNA species may be highly susceptible to a change in the transcription rate of a different miRNA when the level of the target RNA lies in a specific window (for details, see The Mirror System: One Target, M miRNA Species in the Supporting Material).
N ceRNA Species, M miRNA Species
Let us now consider the general case of a system formed by M miRNA species μα (α = 1,…, M) and N ceRNA species mi (i = 1,…, N), defined by the rates
and for which the following steady-state equations hold:
| (17) |
Again, we shall focus on computing ceRNA sensitivities to perturbations of transcription rates of other ceRNAs. Neglecting higher-order interactions involving two or more miRNAs (which is justified for a large, sparse miRNA-ceRNA network in the absence of connectivity correlations), we have
| (18) |
The NM + N + M steady-state expressions in Eq. 17 can be reduced to N + M coupled equations for the N + M unknown {μα, mi} by eliminating the complexes. After some straightforward algebra, we get and with
| (19) |
where
| (20) |
| (21) |
In turn, the levels of free miRNA and ceRNA are described by
| (22) |
| (23) |
with and . The quantity Fi can be rewritten as
| (24) |
where
Note that sum in Zi(α) includes all miRNA species except for μα.
Equation 24 tells us that, in the presence of many miRNA species, we may account for the effect of species μα on ceRNA mi by just rescaling Fi by Zi(α) and shifting the reference level μ0i,α by Zi(α). A simple interpretation of the above expressions can be gained by introducing an effective decay rate di(α) = diZi(α) and noting that
| (25) |
One immediately recognizes the same form of the steady-state equation, Eq. 3, for the case M = 1, and sees that Zi(α) ultimately plays the role of a factor accelerating the effective turnover. Note that all miRNAs targeting ceRNA i give positive contributions to the sum Zi(α) and thus increase the effective turnover, but the most important contributions come from those miRNAs whose level [μγ] is high with respect to the term μ0i,γ.
By analogy with the case M = 1, we will say that a ceRNA is free with respect to miRNA μα (and write i ∈ (α)) if ; it will be susceptible with respect to μα (or i ∈ (α)) if ; it will be bound with respect to μα (or i ∈ (α)) if . Note that being bound with respect to a miRNA species is sufficient for a ceRNA to be translationally repressed. For consistency, a ceRNA can only be bound with respect to one miRNA species (in that case, it will be free with respect to all other miRNAs). Separating the different regimes, we have
| (26) |
In turn, for the levels of free miRNAs, we obtain
| (27) |
where
One may now compute the different terms of the susceptibilities. For the quantity χij,α (see Eq. 18), we finally get the M > 1 analog of Eq. 13, i.e.,
| (28) |
where the matrices are given by
| (29) |
In this case, the intensity of the cross-talk described by Eq. 28 is modulated by the factor
| (30) |
We therefore conclude that miRNA μα gives a relevant contribution to the overall susceptibility χij if any of the following apply:
-
1.
i ∈ (α);
-
2.
j ∈ (α) or j ∈ (α) (in the latter case, μα is the main repressor of mj);
-
3.
Zi(α) ≃ 1, i.e., ceRNA mi has few repressors besides μα; or
-
4.
Few ceRNA species belong to (α), so that dilution is limited.
In summary, the effect of background miRNAs, which do not mediate interactions, is an increase in the effective rate of decay, and consequently a shift in the susceptibility threshold. On the other hand, the effect of background ceRNAs is a dilution of the cross-talk among ceRNAs, as seen in the case M = 1. An illustrative example of the interactions arising among ceRNAs in a system with N = 4 and M = 3 is shown in Fig. 5.
Figure 5.
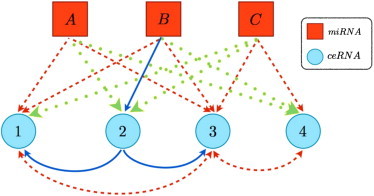
Schematic representation of a system of N = 4 ceRNAs species and N = 3 miRNA species. (Continuous blue arrows) Linkage of miRNA α to ceRNA i if i ∈ (α); (dashed red arrows) if i ∈ (α); (dotted green arrows) if i ∈ (α). In this case, ceRNAs 1 and 3 are both in (A) and (B), ceRNAs 3 and 4 are in (C), and ceRNA is 1 in (A). This situation results in the following interactions: symmetric cross-talk between ceRNAs 1 and 3, mediated by miRNAs A and B; symmetric cross-talk between ceRNAs 3 and 4, mediated by miRNA C; asymmetric cross-talk from ceRNA 2 to ceRNA 1, mediated by miRNA B; asymmetric cross-talk from ceRNA 2 to ceRNA 3, mediated by miRNA B.
To conclude, we note that network topology can play an important role as interaction enhancer. For instance (see The Role of Topology in the Supporting Material), cross-talk can take place among ceRNAs in the Free regime (despite the small χij,α), provided they are commonly targeted by a large number of miRNA species. In other terms: interactions between ceRNAs can be mediated by a large number of miRNA species which, individually, would only weakly dampen ceRNA levels. However, to achieve efficient cross-talk, strong correlations in the network connectivity are needed, so that highly clustered networks can allow for much stronger cross-talk than random graphs.
Steady-State Fluctuations
Genetic circuits that regulate cellular functions are subject to stochastic fluctuations, specifically in the levels of the different molecular species that interact (25,26). Noise, far from being just a nuisance, plays an essential role in cellular activities—for example, by enabling coordination of gene expression across large regulons, or by allowing for probabilistic differentiation of otherwise identical cells (27). On the other side, a noisy gene expression is potentially harmful in many situations: in developmental circuits, for example, it can lead either to arrested development, aberrant positional expression of tissue-specific genes, or overrepresentation of specific cell types (28). If there is only a relatively narrow protein level which is optimal, some sort of tuning must act to prevent fluctuations outside the functional range. Cross-talk of the type discussed so far may either result in an amplification of upstream fluctuations or represent an efficient noise buffering mechanism. To analyze this issue in some detail, we focus on the role of transcriptional noise, the primary cause of variability in gene expression among cells in isogenic populations (29). If one assumes that extrinsic transcriptional noise is the dominant source of stochasticity and neglects molecular noise entirely, it is possible to estimate concentration fluctuations in the ceRNA-miRNA networks at steady state, obtaining expressions valid in the linear response regime.
Let us consider for simplicity a system of N = 2 ceRNA species and M = 1 miRNA species, and let P(r) denote a distribution of transcription rates (where r = {b1,b2,β}), such that an ensemble of systems at steady state can be constructed by sampling a vector r from P(r) for each system in the ensemble. For P(r), one may, for simplicity, take a Gaussian, i.e.,
| (31) |
where is the mean and Σ is the correlation matrix of inputs. Clearly, a distribution of transcription rates induces a distribution of steady-state concentrations. The latter is what we aim at characterizing.
If variability in transcription rates is sufficiently small, we can expand the steady-state levels (note that ≡ (r)) around (small noise expansion), obtaining
| (32) |
where . In this approximation,
| (33) |
where , being the matrix of susceptibilities defined in Eq. 32. The joint probability distribution and the susceptibility matrix can then be used to characterize steady-state fluctuations and correlations, e.g.,
| (34) |
For uncorrelated transcription rates, the covariance matrix Σ is diagonal, and Eq. 34 reduces to
where, as expected, each term positively contributes to increase the noise. As shown in Fig. 6, fluctuations can become very large in the susceptible regime as the system is strongly coupled, possibly limiting the efficiency of signaling in the ceRNA network.
Figure 6.
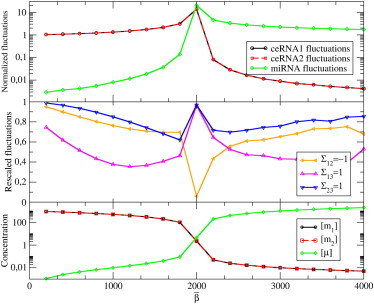
Level fluctuations induced by transcriptional noise in a system with N = 2 ceRNA species and M = 1 miRNA species. We took Gaussian distributions for the transcription rates β, b1, and b2, keeping the ratio between the average and the width fixed in each case. All parameters and distributions of rates are also kept fixed, except for the miRNA transcription rate distribution P(β), which is parameterized by its average value . In this case: , , , , σ1 = σ2 = 10, and κ1 = κ2 = 1. (Top) Normalized fluctuations (ratio between the width of the fluctuations in the interacting and the noninteracting system, the latter corresponding to ) for uncorrelated distributions of transcription rates. (Center) Ratio between the normalized fluctuations of the level of ceRNA 1 obtained in the presence of correlations and in the uncorrelated case. (Yellow line) Maximal anti-correlation between b1 and b2 (Σ12 = −1); (purple line) maximal correlation between b1 and β (Σ13 = 1); and (blue line) maximal correlation between b2 and β (Σ23 = 1). (Bottom) Average molecular levels.
In presence of correlations at the transcriptional level, however, the signs of off-diagonal terms become crucial. Recalling that, generically, χi,μ < 0, χi,μ > 0, and χμ,i < 0, one sees that anti-correlated ceRNA transcriptions and correlated miRNA-ceRNAs transcriptions may lead to a reduction of fluctuations with respect to the uncorrelated case, as shown again in Fig. 6. On the other hand, negative miRNA-ceRNA correlations and positive ceRNA-ceRNA correlations strongly amplify fluctuations. In other terms, miRNA-mediated cross-talk coupled with correlation of transcriptional inputs may represent a powerful noise-processing mechanism.
Detection of miRNA-Mediated Cross-Talk from Gene Expression Data
A key issue of the ceRNA scenario concerns the detection of cross-talk in gene expression data, typically from correlations or related quantities. It is important to note that, within the theoretical framework we discuss, the presence of statistically significant correlations between ceRNAs is not necessarily a signature in this sense. Indeed, the Pearson correlation coefficient between ceRNAs, for independent transcription rates, reads
| (35) |
where σk2 is the variance of rk. However, if χ12 = 0, then
| (36) |
with A > 0 as a constant. Because both susceptibilities on the right-hand side are negative, a positive correlation between ceRNAs can emerge also in absence of miRNA-mediated cross-talk.
More recently, information theoretical quantities have been employed as a means to detect miRNA-mediated cross-talk. In Sumazin et al. (14), for instance, the functional
| (37) |
(I (x,y) denoting the mutual information of random variables x and y, 〈⋅⋅⋅〉z denoting the average with respect to the random variable z) has been proposed, with the rationale that if ΔI > 0, then the knowledge of [m2] increases the mutual dependence of [m1] and [μ], which can be interpreted as a signature of cross-talk between m1 and m2.
In the previous section, we have shown that by neglecting molecular noise entirely and assuming that extrinsic transcriptional noise is the dominant source of stochasticity, it is possible to characterize concentration fluctuations at stationarity using mean-field steady-state equations once input noise is known. We note, however, that under the expressions in Eq. 17, free ceRNA levels depend only on the levels of the miRNA they interact with, so that the joint probability distribution of the levels of the various molecular species involved can be factorized, e.g., for N = 2 and M = 1,
| (38) |
This in turn implies that, within this mean field steady-state framework, the three-species correlation functions can also be factorized,
leading to ΔI = 0 independently of there being cross-talk or not.
Quite importantly, however, in a typical experimental output (e.g., by microarray or deep sequencing analysis), it is hard to disentangle the contribution of free and bound ceRNAs and the experimental readouts give proxies for the quantities
| (39) |
Based on Eq. 2, one has, in particular,
| (40) |
| (41) |
Note that if the lifetime of complexes (σi + κi) is shorter than that of ceRNAs di, as it is reasonable to expect, [mi]xp is, like [mi], a decreasing function of [μ]. One sees that, in general, it is not possible to express the experimental ceRNA levels in terms of the miRNA levels only. Therefore, the quantity in Eq. 37, computed using the experimental readouts in Eq. 39, can be different from zero. Again, however, this is not necessarily a signature of cross-talk. An argument is given on the significance of conditional mutual information as a means to signal cross-talk in the Supporting Material, where it is shown how nonzero values of
can be obtained even in absence of stoichiometric complex degradation (and hence of cross-talk at stationarity).
In summary, more refined detection methods are likely to be needed to identify cross-talk among ceRNAs from gene expression data.
Discussion
Recent experimental studies have suggested that the miRNA-mediated competition between ceRNAs could constitute an additional level of posttranscriptional regulation, playing important roles in many biological contexts. Trying to achieve a clear quantitative understanding of the emergence of this effect has been the goal of this work. We have presented a minimal, rate-equation-based model that is able to describe the cross-talk arising from competition at steady state through a systematic analytical characterization of the sensitivity to small changes in the transcription rates. To keep mathematical complexities to a minimum, we have adopted a coarse-grained view of the real biological process, even neglecting details of the miRNA-mediated regulation that could impact the emergence of cross-talk among ceRNAs. For instance, binding to the Argonaute/Ago protein (the catalytic component of the RISC) may represent a significant rate-limiting step (30), and the competition for Ago has been shown to contribute to the emergence of ceRNA-ceRNA cross-talk (31).
The emerging scenario, valid in the linear response regime, is rather rich and complex. Interestingly, the competitive interactions can give rise to a rather selective communication channel: only ceRNAs in an intermediate, susceptible regime are responsive to miRNA perturbations and significantly contribute to diluting the strength of the interaction. Thus, even in the case of a dense miRNA-ceRNA network, the resulting ceRNA-ceRNA cross-talk pattern may be rather sparse. Moreover, interactions switch on only in specific ranges of miRNA concentrations, so that the structure of the emergent ceRNA-ceRNA network can adjust in response to variations in the miRNA levels. Perhaps unexpectedly, heterogeneity of kinetic parameters can give rise both to symmetric and asymmetric couplings. Furthermore, an analogous cross-talk scenario emerges between different miRNA species sharing the same target RNA. And, finally, the topology of the ceRNA-miRNA network may play an important role as strong correlations in connectivity in that network can enhance the ceRNA-ceRNA cross-talk.
The above picture requires that miRNA-ceRNA complexes decay, at least partially, through a stoichiometric channel of degradation: for purely catalytic decay, no cross-talk is possible at stationarity, and perturbations of transcription rates only cause a transient response. Dynamical effects may nevertheless play an important role on the timescales of many cellular processes, and will be explored in a forthcoming work.
To evaluate the robustness of the miRNA-mediated coupling, we have also performed a basic analysis of the impact of noise. Assuming extrinsic transcriptional noise as the dominant source of stochasticity, we estimated level fluctuations in the ceRNA-miRNA networks at steady state, again obtaining expressions valid in the linear response regime. It turns out that miRNA-mediated cross-talk, coupled with correlated transcriptional inputs, represents a powerful noise-processing mechanism that can lead to either noise reduction or amplification. It is interesting to observe that a circuit displaying specific transcriptional correlations has been discussed in Cesana et al. (12), where a muscle-specific miRNA (miR-133b) embedded in a noncoding transcript (linc-MD1) has been identified. Clearly, linc-MD1’s transcript acts as a very efficient decoy for miR-133b. A theory for this case is worked out in The miRNA-Decoy Transcript in the Supporting Material.
It would be important to carry the analysis of the role of noise beyond the steps discussed here. Posttranscriptional regulation based on stoichiometric repression has been shown to cause large intrinsic fluctuations in intermediate regimes of repression (32), effectively posing a limit to the possibility of having an efficient quantitative signaling between ceRNAs. Our analysis suggests, on the other hand, that cross-talk mediated by a large number of miRNAs might be more robust. A more thorough mathematical/computational analysis, including molecular noise, may be able to shed light on this important aspect.
We have finally shown that nontrivial correlations among ceRNAs can emerge in experimental readouts due to transcriptional fluctuations even in absence of miRNA-mediated cross-talk.
Acknowledgments
We thank C. Bosia, I. Bozzoni, M. Caselle, A. Martirosyan, P. Mehta, A. Pagnani, and R. Zecchina for stimulating discussions.
While completing this article, we learned that C. Bosia, A. Pagnani, and R. Zecchina have independently studied the same problem, reporting results which are consistent with those obtained here.
Supporting Material
References
- 1.Bartel D.P. MicroRNAs: genomics, biogenesis, mechanism, and function. Cell. 2004;116:281–297. doi: 10.1016/s0092-8674(04)00045-5. [DOI] [PubMed] [Google Scholar]
- 2.Bartel D.P. MicroRNAs: target recognition and regulatory functions. Cell. 2009;136:215–233. doi: 10.1016/j.cell.2009.01.002. [DOI] [PMC free article] [PubMed] [Google Scholar]
- 3.Chekulaeva M., Filipowicz W. Mechanisms of miRNA-mediated post-transcriptional regulation in animal cells. Curr. Opin. Cell Biol. 2009;21:452–460. doi: 10.1016/j.ceb.2009.04.009. [DOI] [PubMed] [Google Scholar]
- 4.Valencia-Sanchez M.A., Liu J., Parker R. Control of translation and mRNA degradation by miRNAs and siRNAs. Genes Dev. 2006;20:515–524. doi: 10.1101/gad.1399806. [DOI] [PubMed] [Google Scholar]
- 5.Flynt A., Lai E.C. Biological principles of microRNA-mediated regulation: shared themes amid diversity. Nat. Rev. Genet. 2008;9:831–842. doi: 10.1038/nrg2455. [DOI] [PMC free article] [PubMed] [Google Scholar]
- 6.Tsang J., Zhu J., van Oudenaarden A. MicroRNA-mediated feedback and feedforward loops are recurrent network motifs in mammals. Mol. Cell. 2007;26:753–767. doi: 10.1016/j.molcel.2007.05.018. [DOI] [PMC free article] [PubMed] [Google Scholar]
- 7.Re A., Corá D., Caselle M. Genome-wide survey of MicroRNA-transcription factor feed-forward regulatory circuits in human. Mol. Biosyst. 2009;5:854–867. doi: 10.1039/b900177h. [DOI] [PMC free article] [PubMed] [Google Scholar]
- 8.Osella M., Bosia C., Caselle M. The role of incoherent MicroRNA-mediated feedforward loops in noise buffering. PLOS Comput. Biol. 2011;7:e1001101. doi: 10.1371/journal.pcbi.1001101. [DOI] [PMC free article] [PubMed] [Google Scholar]
- 9.Wang S., Raghavachari S. Quantifying negative feedback regulation by micro-RNAs. Phys. Biol. 2011;8:055002. doi: 10.1088/1478-3975/8/5/055002. [DOI] [PMC free article] [PubMed] [Google Scholar]
- 10.Arvey A., Larsson E., Marks D.D. Target mRNA abundance dilutes microRNA and siRNA activity. Mol. Syst. Biol. 2010;6:363. doi: 10.1038/msb.2010.24. [DOI] [PMC free article] [PubMed] [Google Scholar]
- 11.Poliseno L., Salmena L., Pandolfi P.P. A coding-independent function of gene and pseudogene mRNAs regulates tumor biology. Nature. 2010;465:1033–1038. doi: 10.1038/nature09144. [DOI] [PMC free article] [PubMed] [Google Scholar]
- 12.Cesana M., Cacchiarelli D., Bozzoni I. A long noncoding RNA controls muscle differentiation by functioning as a competing endogenous RNA. Cell. 2011;147:358–369. doi: 10.1016/j.cell.2011.09.028. [DOI] [PMC free article] [PubMed] [Google Scholar]
- 13.Salmena L., Poliseno L., Pandolfi P.P. A ceRNA hypothesis: the Rosetta Stone of a hidden RNA language? Cell. 2011;146:353–358. doi: 10.1016/j.cell.2011.07.014. [DOI] [PMC free article] [PubMed] [Google Scholar]
- 14.Sumazin P., Yang X., Califano A. An extensive microRNA-mediated network of RNA-RNA interactions regulates established oncogenic pathways in glioblastoma. Cell. 2011;147:370–381. doi: 10.1016/j.cell.2011.09.041. [DOI] [PMC free article] [PubMed] [Google Scholar]
- 15.Tay Y., Kats L., Pandolfi P.P. Coding-independent regulation of the tumor suppressor PTEN by competing endogenous mRNAs. Cell. 2011;147:344–357. doi: 10.1016/j.cell.2011.09.029. [DOI] [PMC free article] [PubMed] [Google Scholar]
- 16.Karreth F.A., Tay Y., Pandolfi P.P. In vivo identification of tumor- suppressive PTEN ceRNAs in an oncogenic BRAF-induced mouse model of melanoma. Cell. 2011;147:382–395. doi: 10.1016/j.cell.2011.09.032. [DOI] [PMC free article] [PubMed] [Google Scholar]
- 17.Baek D., Villén J., Bartel D.P. The impact of microRNA on protein output. Nature. 2008;455:64–71. doi: 10.1038/nature07242. [DOI] [PMC free article] [PubMed] [Google Scholar]
- 18.Djuranovic S., Bahvi A., Green R. miRNA-mediated gene silencing by translational repression followed by mRNA deadenylation and decay. Science. 2012;336:237–240. doi: 10.1126/science.1215691. [DOI] [PMC free article] [PubMed] [Google Scholar]
- 19.Wang X., Li Y., Wang Y. Toward a system-level understanding of microRNA pathway via mathematical modeling. Biosystems. 2010;100:31–38. doi: 10.1016/j.biosystems.2009.12.005. [DOI] [PubMed] [Google Scholar]
- 20.Bissels U., Wild S., Bosio A. Absolute quantification of microRNAs by using a universal reference. RNA. 2009;15:2375–2384. doi: 10.1261/rna.1754109. [DOI] [PMC free article] [PubMed] [Google Scholar]
- 21.Liang Y., Ridzon D., Chen C. Characterization of microRNA expression profiles in normal human tissues. BMC Genomics. 2007;8:166. doi: 10.1186/1471-2164-8-166. [DOI] [PMC free article] [PubMed] [Google Scholar]
- 22.Haley B., Zamore P.D. Kinetic analysis of the RNAi enzyme complex. Nat. Struct. Mol. Biol. 2004;11:599–606. doi: 10.1038/nsmb780. [DOI] [PubMed] [Google Scholar]
- 23.Mullokandov G., Baccarini A., Brown B.D. High-throughput assessment of microRNA activity and function using microRNA sensor and decoy libraries. Nature Methods. 2012;9:840–846. doi: 10.1038/nmeth.2078. [DOI] [PMC free article] [PubMed] [Google Scholar]
- 24.Mukherji S., Ebert M.S., van Oudenaarden A. MicroRNAs can generate thresholds in target gene expression. Nat. Genet. 2011;43:854–859. doi: 10.1038/ng.905. [DOI] [PMC free article] [PubMed] [Google Scholar]
- 25.Swain P.S., Elowitz M.B., Siggia E.D. Intrinsic and extrinsic contributions to stochasticity in gene expression. Proc. Natl. Acad. Sci. USA. 2001;99:12795–12800. doi: 10.1073/pnas.162041399. [DOI] [PMC free article] [PubMed] [Google Scholar]
- 26.Raser J.M., O’Shea E. Noise in gene expression: origins, consequences, and control. Science. 2005;309:2010–2013. doi: 10.1126/science.1105891. [DOI] [PMC free article] [PubMed] [Google Scholar]
- 27.Eldar A., Elowitz M.B. Functional roles for noise in genetic circuits. Nature. 2010;467:167–173. doi: 10.1038/nature09326. [DOI] [PMC free article] [PubMed] [Google Scholar]
- 28.Clarke P.A., te Poele R., Workman P. Gene expression microarray analysis in cancer biology, pharmacology, and drug development: progress and potential. Biochem. Pharmacol. 2001;62:1311–1336. doi: 10.1016/s0006-2952(01)00785-7. [DOI] [PubMed] [Google Scholar]
- 29.Raj A., van Oudenaarden A. Nature, nurture, or chance: stochastic gene expression and its consequences. Cell. 2008;135:216–226. doi: 10.1016/j.cell.2008.09.050. [DOI] [PMC free article] [PubMed] [Google Scholar]
- 30.Koller E., Propp S., Dean N.M. Competition for RISC binding predicts in vitro potency of siRNA. Nucleic Acids Res. 2006;34:4467–4476. doi: 10.1093/nar/gkl589. [DOI] [PMC free article] [PubMed] [Google Scholar]
- 31.Loinger A., Shemla Y., Biham O. Competition between small RNAs: a quantitative view. Biophys. J. 2012;102:1712–1721. doi: 10.1016/j.bpj.2012.01.058. [DOI] [PMC free article] [PubMed] [Google Scholar]
- 32.Mehta P., Goyal S., Wingreen N.S. A quantitative comparison of sRNA-based and protein-based gene regulation. Mol. Syst. Biol. 2008;4:221. doi: 10.1038/msb.2008.58. [DOI] [PMC free article] [PubMed] [Google Scholar]
Associated Data
This section collects any data citations, data availability statements, or supplementary materials included in this article.