

Significance
The microclimatic contrast between opposing slopes of “Evolution Canyon” (Mount Carmel, Israel) provides a natural laboratory for testing the effects of abiotic factors on biodiversity and population genetic differentiation in a geographical microscale. Drosophila melanogaster fruitflies originating from the opposite canyon slopes are subject to divergent selection leading to slope-specific adaptations, accompanied by incipient mating isolation, all in the face of pervasive demographic processes, including ongoing genetic exchange. We demonstrate that interslope genetic changes in this species accumulate in a number of chromosomal differentiation “islands” and that gene networks related to adaptive responses and reproductive processes are thus significantly affected.
Keywords: adaptive evolution, sequence divergence, genome sequencing
Abstract
The opposite slopes of “Evolution Canyon” in Israel have served as a natural model system of adaptation to a microclimate contrast. Long-term studies of Drosophila melanogaster populations inhabiting the canyon have exhibited significant interslope divergence in thermal and drought stress resistance, candidate genes, mobile elements, habitat choice, mating discrimination, and wing-shape variation, all despite close physical proximity of the contrasting habitats, as well as substantial interslope migration. To examine patterns of genetic differentiation at the genome-wide level, we used high coverage sequencing of the flies’ genomes. A total of 572 genes were significantly different in allele frequency between the slopes, 106 out of which were associated with 74 significantly overrepresented gene ontology (GO) terms, particularly so with response to stimulus and developmental and reproductive processes, thus corroborating previous observations of interslope divergence in stress response, life history, and mating functions. There were at least 37 chromosomal “islands” of interslope divergence and low sequence polymorphism, plausible signatures of selective sweeps, more abundant in flies derived from one (north-facing) of the slopes. Positive correlation between local recombination rate and the level of nucleotide polymorphism was also found.
Thermal gradients play an essential role in the adaptive strategies of many organisms on Earth. An exceptional stress could result in the extinction of populations without initiating an adaptive response, but milder stress might induce adaptive changes to ensure survival. Adaptation to temperature and drought stress can be experimentally explored as a proxy model for adaptive trait complexes and genomic responses to climate change (1–3). Compared with laboratory studies, relatively fewer efforts were invested in analyzing the genomic basis of environmental adaptation in natural populations, especially in stressful conditions, or comparing consequences of experimental evolution with those of evolutionary processes in the wild.
Drosophila melanogaster seems to be an ideal model organism to study responses to thermal selection: (i) it can withstand low (i.e., >11 °C) and high (<32 °C) temperatures (these extremes themselves are stressful as they do not allow development of full-fledged generations) (4, 5), (ii) it is amenable to experimental evolution, including various thermal regimes, and (iii) its natural populations are differentiated along ecological/thermal gradients with respect to body size, developmental time, and egg size (6–8), which is a clear hallmark of temperature being a selective agent. Temperature promotes the evolution of clinal size differences due to the fact that its impact varies in a predicted way along clines (9). Sampling whole-genome differentiation between opposite ends of a well-studied latitudinal cline of D. melanogaster from the east coast of Australia provided evidence for extensive divergence between temperate and tropical populations, with regulatory and unannotated genomic regions exhibiting the highest levels of differentiation (10).
A question arises whether a similar genome differentiation can evolve in microclimatically highly heterogeneous microsites, such as the well-studied “Evolution Canyon” (EC) (Lower Nahal Oren, Mt. Carmel, Israel). The opposite slopes of the canyon separated by100 and 400 m at the bottom and top, respectively, show strong abiotic contrasts due to the higher insolation on the south-facing slope (SFS) compared with the north-facing slope (NFS) and differences in temperature and humidity (11) (Fig. 1). This microclimatic gradient has considerable consequences for species composition and population genetic structure in a diversity of organisms (12–16). Within this system, Drosophila is an excellent model to study the interplay between factors affecting population adaptation and differentiation: selection, migration, sexual behavior, and demography. Interslope migration of flies is easy and was verified by capture–recapture tests in the field (17). Despite sympatric settings, significant genetic divergence was documented between D. melanogaster populations inhabiting the opposite slopes, including such traits as thermal and drought tolerances, longevity, viability, habitat choice (preferences in oviposition temperature), mate choice (tendency to positive assortative mating), and peculiarities in sexual behavior and courtship song signals, microsatellites, P-element insertions, sequence polymorphism of some candidate behavioral genes and induced expression of heat shock-related genes in response to high temperature treatment (18–28).
Fig. 1.

Evolution Canyon, Lower Nahal Oren, Israel.
Because these differences persist despite likely gene flow between the two populations, this differentiation pattern may be indicative of a tight linkage and strong selection. To characterize genome-wide differentiation patterns between D. melanogaster populations from the opposing slopes of Evolution Canyon, we used high-coverage whole-genome sequencing. Recent advances in next-generation sequencing technologies and bioinformatics provide a new dimension to the detection of selection and demography signatures at the sequence level. Patterns of sequence polymorphism and divergence were surveyed in relation to their functional implications, especially in the context of previously documented interslope phenotypic differentiation and a tendency to mating isolation.
Results
Genome Scanning for Interslope Differentiation.
SNPs showed a “nonneutral” pattern upon comparisons of interslope differentiation for different gene regions, as shown by variation in SNP density among gene regions for all polymorphic SNPs, as well as density of SNPs significantly differentiated between the slopes (Table 1). Specifically, higher mean SNP density (per kb) was observed in introns compared with coding DNA sequences (CDSs) and UTRs whereas the lowest SD for the between-gene variation was observed in CDSs and 3′ UTRs, and highest in 5′ UTRs and introns. The analogous variation in the density of interslope significant SNPs was 3- to 20-fold lower than the overall density of SNPs. The lowest density of differentiated SNPs was found in CDSs followed by the intronic regions whereas the UTRs showed higher density. If the interslope differentiating SNPs (Fst > 0.1) were subject to differential selection regimes, one expects to find SNPs with higher differentiation in coding compared with noncoding DNA, in genic compared with intergenic DNA, whereas, if neutrality or demographic factors were prevailing, no considerable differences should be present. Indeed, there was higher interslope differentiation of CDS SNPs compared with intronic and, especially, intergenic SNPs; the most pronounced effect was on the 3R arm and the weakest on the X chromosome (Table 2).
Table 1.
Nonrandom variation of within-gene SNP density in flies from EC
| Gene region | All SNPs/kb |
Interslope significant SNPs/kb |
||||
| N | Mean | SD | N | Mean | SD | |
| 5′UTR | 11,121 | 12.666 ± 0.191 | 20.11 | 450 | 4.418 ± 0.373 | 7.92 |
| CDS | 13,361 | 13.325 ± 0.073 | 8.41 | 2,953 | 0.676 ± 0.010 | 0.57 |
| First intron | 11,357 | 18.400 ± 0.184 | 19.59 | 1,274 | 1.940 ± 0.125 | 4.46 |
| Other introns | 8,664 | 19.133 ± 0.185 | 17.21 | 1,935 | 1.040 ± 0.060 | 2.63 |
| 3′UTR | 11,113 | 11.991 ± 0.132 | 13.94 | 552 | 3.353 ± 0.214 | 5.02 |
Table 2.
Interslope differentiation of SNPs in coding vs. noncoding DNA (by Mann–Whitney test)
| Chromosome arm | Avg P × 103 |
Sample size |
Z | P level | ||
| CDS | Noncoding | CDS | Noncoding | |||
| X | 1.73 | 2.37 | 100 | 1,124 | 3.124 | 2 × 10⁻³ |
| 2L | 1.16 | 2.28 | 137 | 1,693 | 5.509 | 4 × 10⁻⁸ |
| 2R | 1.44 | 1.89 | 174 | 1,439 | 3.359 | 8 × 10⁻⁴ |
| 3L | 1.22 | 2.06 | 156 | 1,511 | 5.712 | 1 × 10⁻⁸ |
| 3R | 0.96 | 1.95 | 229 | 2,109 | 6.886 | 6 × 10⁻¹² |
A question arises whether significantly differentiated SNPs are evenly distributed along the chromosomes or, alternatively, are concentrated in a relatively small number of chromosomal regions, as one would expect for sympatric populations subjected to differentiating selection regime (29, 30). To address this question, we compared the regional distribution of SNPs assigned by the Hidden Markov Model (HMM) analysis to the highly differentiated state with the genomic distribution of all SNPs polymorphic in the population. For intervals of 1 Mb in size, we found a rather small number of regions (1-3 Mb in size) with highly significant excess of differentiating SNPs relative to the H0 expectation of an even distribution: 4, 2, 3, and 3 regions in X, 2L, 2R, and 3R, respectively (Fig.2). About 25% of the genes were found in the highly differentiated regions (Fig. 2). We then used a finer scale with comparison of “high island” (HI) values of 10-kb intervals with the distribution of their reshuffled Fst values, repeated 10,000 times, which enabled us to reveal genomic regions with significantly higher differentiation (reflected in their observed HI value) compared with random expectations. In total, 572 genes significantly different in allele frequency between the slopes (NFS vs. SFS) were found in the 10-kb HI intervals (permutation test, P < 0.0001).
Fig. 2.

Ratio of observed to expected (assuming even distribution) number of interslope differentiating SNPs. Green circles, positions of genes from the list of 106 slope-divergent genes coinciding with significant intervals; blue triangles, positions of genes (from the list of 62 genes) obtained in Tajima analysis, coinciding with significant intervals.
Gene Ontology Term Enrichment.
We identified a total of 74 significantly enriched Gene Ontology (GO) terms associated with 106 out of the 572 genes with SNP frequencies different between the slopes (Fig. 3 and Tables S1 and S2). Remarkably, nearly 50% of them belonged to the large (at the 1-Mb window scale) islands of high differentiation, pointing to some functional relevance of the most differentiated regions (Fig. 2). A closer examination of genes falling into the three most significant intervals of 3R revealed a number of genes contributing to important biological processes that could be responsible for interslope differentiation: CG31524 associated with oxidation-reduction process, Ir94b, Ir94c, CG31464 contributing to detection of chemical stimulus, Axn involved in a number of processes (oogenesis, imaginal disk pattern formation, heart development, phagocytosis), amon responsible for hatching behavior, mod(mdg4) regulating apoptosis; and three genes (sima, heph, and trx) involved in response to DNA damage. Especially interesting is the fact that, in a ∼60-kb region (9,069,408–9,127,928 bp) from the 3-Mb interval in 3R that showed a high excess of SNPs assigned by HMM analysis to high-differentiating state (Fig. 2), NFS-specific SNPs were found in exons of nine genes (Ace, Ravus, Su(var)3–7, CG8449, CG8630, CG15888, Osi22, CG8773, CG8774), and four out of these nine had also NFS-specific intronic SNPs. We found 13 SNPs in Ace exonic sequences, of which two (positions 9,069,054 and 9,069,408) produce nonsynonymous changes in highly conserved sites (Fig. 4). Representative of other SNPs in the region, nonreference alleles in the two loci were near-fixed (9069054) or fixed (9069408) on NFS whereas frequency of the alternative (reference-like) alleles was higher on SFS.
Fig. 3.

Chromosomal distribution (A) of genes with significantly different allele frequencies belonging to enriched Gene Ontology terms and their representation across biological processes (B).
Fig. 4.

An island of sequence differentiation between NFS and SFS on chromosomal arm 3R, with a number of exonic SNPs within gene Ace highlighted (S, synonymous changes; N, nonsynonymous; reference genotype in blue, nonreference in red).
Nonneutrality Hallmarks.
The analysis of Tajima’s D values distribution for the same nonoverlapping 10-kb windows used in HI significance testing along the five major chromosome arms revealed a massive bias of D scores toward negative values for both slopes (Fig. 5). DSFS and DNFS values scored for SFS and NFS data in 10-kb windows across the genome were positively correlated (Spearman rank correlation +0.81), but the analysis of D values showed highly significant differences between the slopes using nonparametric sign test: Z = 6.54 and P < 6 × 10⁻¹¹ for the n = 1,703 intervals with pHI < 0.001, and Z = 14.53, P < 5 × 10⁻¹⁸ for the remaining n = 9,428 intervals. The difference between absolute DSFS and DNFS values tended to be higher in intervals with pHI < 0.001 but their average values (DNFS = −0.401 and DSFS = −0.345) were also slightly higher compared with those in the remaining intervals (DNFS = −0.525 and DSFS = −0.484). The observed bias may result from a combination of demographic effects in both populations and “remnants” of selective sweeps more pronounced on NFS than SFS. However, there were no significant differences for any of the five chromosomal arms in the subset of 10-kb windows of either DNFS < −2.0 or DSFS < −2.0.
Fig. 5.
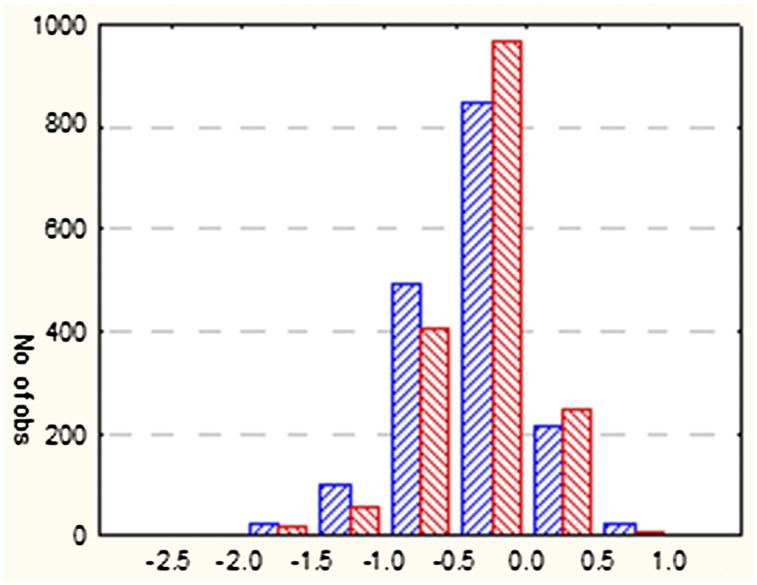
Distribution of D values (Tajima test) scored for nonoverlapping 10-kb windows from pooled DNA of SFS (red) and NFS (blue) with pHI < 0.001.
Remarkably, D values were significantly correlated with HI values, but the sign of correlation differed between the groups of windows with pHI < 0.001 and the remaining windows, and the levels of correlation were different in DNFS and DSFS. In windows with pHI < 0.001, the rank correlation between HI and D was −0.119 (P = 8 × 10⁻⁷) and −0.066 (P = 7 × 10⁻³) for NFS and SFS, respectively, whereas, for the remaining windows, the corresponding values were +0.172 (P < 5 × 10⁻¹⁸) and +0.183 (P < 5 × 10⁻¹⁸) in NFS and SFS, respectively. The negative correlation is consistent with highly differentiated segments tending to have lower D values. By combining both criteria, namely D < −2 and significant interslope differentiation (pHI < 0.0001), we have revealed only three genomic regions potentially exhibiting strong differentiating selection. Relaxing these criteria to pHI < 0.01 and D < −1.62 (corresponding to 2.5% threshold calculated using the combined distribution of NFS and SFS D values over all 10-kb windows) enabled us to detect up to 37 regions with some indication of interslope differentiating selection and containing 62 candidate genes (Table S3) enriched in GO terms related to glutathione metabolism and glutathione transferase activity. Two of the GO terms belong to the metabolism of xenobiotics by cytochrome P450. Another gene from the list of 62 genes, l(3)L1231, which matches the most significant interval in 3R, is involved in intermale aggressive behavior, consistent with our previous findings on peculiarities of mating behavior observed in the flies derived from the opposite slopes of the canyon (22, 27). Overall, positions of 14 genes from 3R, two genes from 2L, and one gene from X chromosome coincide with the significant intervals (Fig. 2).
Variation in SNP Densities in Relation to Recombination Rate.
In our previous study using D. melanogaster from EC, genetic variation of microsatellite markers decreased with marker physical distance from the centromere, a strong suppressor of recombination (21). The association between allele number and distance from the centromere was negative but not significant whereas the correlation between allele number and recombination rate was positive and significant. In the current study, we tested, albeit indirectly, the effect of recombination on population polymorphism in the canyon for SNP sites. A highly significant positive association was found between the density of polymorphic sites in the canyon (all/kb score) for gene sequences in all five arms and local recombination rate (r) (Table S4), corroborating the earlier findings on Drosophila and other organisms interpreted in terms of background selection and selective sweep (31, 32). The effect was stronger for the autosomes compared with X chromosome, and for CDS and introns compared with 5′ and 3′ UTR sequences. Although r is correlated with dist (Spearman R, 0.37–0.72), these two variables reflect different aspects related to recombination rate: variation in r depends not only on the suppressing effect of the centromere on recombination but also on the effect of local hotspots of recombination and other modifiers (33). Results imply complementary effects of two recombination-related scores, r and dist; for some parameter–arm combinations, these were of similar importance whereas, for others, one was predominating (Table S4). In general, stronger dependence on recombination parameters was observed on the autosomes compared with X chromosome and in chromosome 3 compared with chromosome 2. Increased recombination promotes higher polymorphism in the population, and the effect is higher in CDS compared with introns and in CDS and introns compared with 5′ and 3′ UTR. There was also a significant positive correlation between nucleotide diversity (pi) and recombination on all chromosomes (Spearman R correlation ranging from 0.60 on 2R to 0.87 on 2L chromosome arms, P < 0.0002) with exons and introns combined. We also examined the association of density of SNPs significantly differentiated between the slopes (parameter sig/kb) and population differentiation displayed by the parameters resulting from HMM analysis independently of the SNPs location, with the same two recombination-related parameters as above (Table S4). In general, the density of interslope-significant SNPs was positively associated with the distance to centromere and local recombination rate. The effect was displayed mainly by intronic SNPs on all autosomes. The association of HMM-derived differentiation scores with recombination parameters was less uniform across the chromosomes: higher effect was found on autosomes compared with X chromosome, and among the autosomes higher on chromosome 3 than chromosome 2.
Discussion
Drosophila melanogaster from Evolution Canyon belong to one of the most extensively studied natural populations of this species in the world, following the discovery of divergent oviposition temperature preferences, viability, and longevity under heat and drought stress in flies derived from the opposite slopes of the canyon (18), paralleled by similar adaptive changes in other organisms (15, 19, 34). SFS flies tended to exceed NFS flies in basal and inducible thermotolerance after various heat shocks, and the pattern has been shown to hold across multiple generations of independent sampling over a period of more than 7 y, regardless of whether isofemale lines, synthetic populations, or inbred lines were analyzed (26, 28). Tolerance to desiccation and starvation treatments was significantly higher in SFS than NFS lines, even after 1.5 y maintenance of flies in the laboratory (18, 35). Additionally, SFS larvae have been observed to develop significantly slower at both normal and elevated temperatures, with the interslope difference increased in higher temperatures (35). The results suggest that interslope difference in thermotolerance may have genetic underpinnings despite substantial migration between NFS and SFS (17) and likely gene flow.
Indeed, striking variation in the regulatory region of hsp70Ba, one of at least five D. melanogaster hsp70 paralogs that encode a major inducible heat-shock protein was found in D. melanogaster from EC (21, 36). The hsp70Ba promoter was polymorphic for a 1.2 kb P element insertion, 28 times more frequent in NFS than in SFS, reducing hsp70 expression by about 22%. Elevated levels of Hsp70 are typically beneficial for inducible thermotolerance but deleterious for growth and development (37, 38), consistent with the pattern of increased thermotolerance and slower development of SFS-inhabiting flies. Differences were also found in expression of another heat-shock protein gene, Hsp83, after moderate, severe, and combined heat-shock treatments (35). Expression of the Hsp83 gene was higher in NFS flies at 36 °C but decreased under more severe subsequent treatments, in contrast to SFS flies whose Hsp83 gene expression spiked after severe heat shocks. Additionally, a higher level of Hsp40 expression was manifested by heat shock-treated (36 °C for 1 h) SFS lines relative to NFS lines (28).
Although single candidate gene-based surveys have proven their value in population genetic research, genome-wide approaches supported by next generation sequencing (10, 39–41) hold promise of new insights into sequence differentiation due to selection or demographic factors in populations of D. melanogaster and other organisms. For example, Kolaczkowski et al. (10) compared two northern and two southern populations from the east coast of Australia and identified distinct patterns of clinal differentiation, with strong evidence for selection acting on a number of key biological functions and pathways. Similarly, we complement the extensive phenotypic and candidate gene-oriented surveys of EC D. melanogaster with deep Illumina sequencing of entire genomes. Levels of interslope differentiation on the order of Fst = 0.03 were comparable with those between distant D. melanogaster populations in Africa (41) or North America (39).
More than 930 slope-specific SNPs were found, out of which about 250 (∼27%) were fixed on one of the slopes. Similar to Kolaczkowski et al. (10) and Fabian et al. (39), chromosomal arm 3R seemed to be the most strongly differentiated region of the genome. Exonic sequences of nine genes were enriched in slope-specific SNPs in this region, including Ace, a key insecticide resistance locus that encodes acetylcholinesterase (AChE) (42, 43) and is capable of rapid evolution in D. melanogaster populations (43, 44). Other genes from the ∼60 kb of the large “island” (chromosome positions from 9,069,408 to 9,127,928 bp) are represented by the dominant modifier of position-effect variegation Su(var)3–7 and its adjacent but much shorter paralog Ravus, CG8449 with Rab GTPase activator functionality, as well as CG8630 with stearoyl-CoA 9-desaturase activity. Although introns had the highest density of SNPs across all chromosomes, coding sequences had the highest statistical contribution to genome differentiation between NFS and SFS (Table 2), suggesting that selection rather than drift might be in play.
Traditionally, classic (hard) selective sweeps, whereby newly arising beneficial mutations are driven to fixation, have been the most sought-after trophy in evolutionary genetic studies, and most of the current statistical approaches for the study of adaptation rely on the expected signatures of hard sweeps (45, 46). Adaptive mutations that sweep through a population leave behind positive selection signatures, such as reduced linked neutral variation (47, 48), increased frequency polymorphisms (49, 50), and unusually long haplotypes associated with the beneficial mutant (51). However, Drosophila belong to organisms that undergo recurrent boom-bust cycles dramatically reducing the long-term Ne and allowing adaptation during the boom years to occur in populations of large short-term Ne, making short-term evolution act primarily on preexisting intermediate-frequency genetic variants that are swept the remainder of the way to fixation, a process known as a soft sweep (43, 46). Tajima’s D values tended to be lower in NFS than in SFS flies, which, combined with the observation that NFS also accumulated more unique SNPs, cautions against a naïve supposition that thermal stress on SFS is the only possible force driving divergence between the genomes. Gene ontology analysis of the 572 genes significantly different in allele frequency between the slopes revealed 74 enriched GO terms, such as response to stimulus, regulation of response to stress, development, and larval behavior, consistent with described phenotypic and behavioral divergence between NFS and SFS flies.
One of the questions that we asked was whether genetic polymorphism in the EC was affected by recombination rates. Similar to other studies, we found a positive correlation between local recombination rate and the level of nucleotide polymorphism (31, 52, 53), a pattern typically attributed to natural selection. This effect was more pronounced in autosomes than in X chromosome and in chromosome 3 compared with chromosome 2, also consistent with our findings of higher differentiation exhibited by chromosome 3. Increased recombination was associated with higher polymorphism across all chromosomal arms, and the effect was higher in CDS relative to introns, and in CDS and introns compared with 5′ and 3′ UTR.
Natural populations of D. melanogaster are subject to boom and bust cycles, and the Evolution Canyon population is unlikely to be an exception from the species’ demography. Seasonal repopulation of the canyon will boost short-term Ne and facilitate recurrent, although unstable, local adaptation complexes and interslope divergence patterns, a probable cause of the inconsistencies in microsatellite variation (ref .21 versus ref. 54) and mating-discrimination behavior (refs. 20, 22, and 23 versus ref. 55) observed over the nearly two decade-long studies of the population. However, the overall genome-wide patterns of interslope differentiation are largely compatible with the phenotypic data showing divergence in characteristics related to thermal adaptation, stress resistance, life history, and behavior. The microclimate contrast in EC may create divergent or disruptive selection capable of exerting its footprints despite pervasive demographic processes.
Environmentally driven divergence may lead to incipient speciation with gene flow if three conditions are met: there is (i) an ecological source of divergent selection, (ii) a reproductive isolating mechanism, and (iii) a genetic mechanism to link divergent selection and reproductive isolation (56–59). Accordingly, we have demonstrated that (i) abiotic and biotic factors of NFS and SFS of EC can create a powerful source of divergent selection (reviewed by Nevo in refs. 15 and 60) and that (ii) mating discrimination emerges against males from the opposite slopes in D. melanogaster (20, 23), accompanied by interslope changes in courtship song (27) and other components of sexual and reproductive behavior (22), whereas (iii) their plausible genetic determinants, such as desaturase2 (25) and l(3)L1231 are in linkage disequilibrium with multiple genes related to stress response, development, and reproduction (current results). The Drosophila system from EC has thus all the potential to greatly advance our understanding of how local adaptations and reproductive isolation can originate despite presumed ongoing genetic exchange.
Materials and Methods
For detailed materials and methods, see SI Materials and Methods.
Sampling and DNA Extractions.
A total of 16 NFS and 16 SFS D. melanogaster isofemale lines were established from females collected in EC (Mount Carmel, Israel) in October 2010. Approximately 1 µg of DNA from each line was pooled to make EC slope representations. Illumina paired-end libraries were constructed and sequenced with HiSeq, 100-cycle, at ∼40× coverage per population.
Mapping Reads and Data Processing.
Paired-end reads were filtered for minimum average base quality score of 20 and a minimum length of 50 bp. Trimmed reads were mapped to the D. melanogaster reference genome using Burrows--Wheeler aligner. Paired-end data were converted to binary alignment/map format and filtered for a minimum mapping quality of 20 using SAMtools. For each detected SNP, differentiation between populations was calculated using both Fst and Fisher exact test. Footprints of natural selection were detected using Tajima's D calculated over nonoverlapping 10-kb windows along chromosome arms.
Detection of Interslope Selective Differentiated Genomic Regions.
Hidden Markov Model (HMM) analysis in R was used to discriminate between the distributions of three hidden states corresponding to high, moderate, and low interslope differentiation, and to assign each SNP to a corresponding state, using interslope Fst values. To search for high differentiation regions along chromosome arms, we used 10-kb nonoverlapping windows. For each window, the level of differentiation was represented by two parameters, LI = nL/nT (“low island”) and HI = nH/nT (“high island”), where nT is the total number of SNPs within each window whereas nH and nL are the numbers of SNPs assigned in the HMM step to either high- or low-differentiation states, respectively. Following this step, a permutation test was conducted to detect genomic regions with significant enrichment of HI scores.
GO Term Analysis.
To study the biological significance of genes under diversifying selection, an enrichment analysis of gene ontology (GO) terms was conducted with the Bioconductor package goseq, which accounts for the gene-length bias. Genes located in genomic regions found to be under differentiation between slopes (HI) were further tested for their association with the detected differentiation. For each SNP within each gene, a Fisher exact test was performed, and the proportion of significantly differentiated SNPs (P < 0.01) was recorded for each gene.
Effects of Recombination.
The effect of recombination was tested based on the local recombination rates using data from Marais et al. (61), represented by the score r, cM/Mb, and physical position of the gene loci in the chromosome sequence relative to the centromere (dist, Mb) known as strong suppressor of recombination (“centromeric effect”) (see review in ref. 33). The two variables, r and dist, allow taking into account the centromeric effect and local variation of recombination superimposed on the centromeric effect.
Supplementary Material
Acknowledgments
We thank Francisco Ayala and Alan Templeton for their critical comments. The project was supported by United States–Israel Binational Science Foundation Grant 2011438.
Footnotes
The authors declare no conflict of interest.
This article contains supporting information online at www.pnas.org/lookup/suppl/doi:10.1073/pnas.1321533111/-/DCSupplemental.
References
- 1.Korol AB, Preygel IA, Preygel SI. Recombination Variability and Evolution: Algorithms of Estimation and Population-Genetic Models. London: Chapman & Hall; 1994. [Google Scholar]
- 2.James AC, Partridge L. Thermal evolution of rate of larval development in Drosophila melanogaster in laboratory and field populations. J Evol Biol. 1995;8(3):315–330. [Google Scholar]
- 3.Hoffmann AA, Harshman LG. Desiccation and starvation resistance in Drosophila: Patterns of variation at the species, population and intrapopulation levels. Heredity (Edinb) 1999;83(Pt 6):637–643. doi: 10.1046/j.1365-2540.1999.00649.x. [DOI] [PubMed] [Google Scholar]
- 4.Pétavy G, Morin JP, Moreteau B, David JR. Growth temperature and phenotypic plasticity in two Drosophila sibling species: Probable adaptive changes in flight capacities. J Evol Biol. 1997;10(6):875–887. [Google Scholar]
- 5.Chakir M, Chafik A, Moreteau B, Gibert P, David JR. Male sterility thermal thresholds in Drosophila: D. simulans appears more cold-adapted than its sibling D. melanogaster. Genetica. 2002;114(2):195–205. doi: 10.1023/a:1015154329762. [DOI] [PubMed] [Google Scholar]
- 6.Hoffmann AA, Shirriffs J, Scott M. Relative importance of plastic vs genetic factors in adaptive differentiation: Geographical variation for stress resistance in Drosophila melanogaster from eastern Australia. Funct Ecol. 2005;19(2):222–227. [Google Scholar]
- 7.Sarup P, Sørensen JG, Dimitrov K, Barker JS, Loeschcke V. Climatic adaptation of Drosophila buzzatii populations in southeast Australia. Heredity (Edinb) 2006;96(6):479–486. doi: 10.1038/sj.hdy.6800828. [DOI] [PubMed] [Google Scholar]
- 8.Bubliy OA, Loeschcke V. Variation of life-history and morphometrical traits in Drosophila buzzatii and Drosophila simulans collected along an altitudinal gradient from a Canary island. Biol J Linn Soc Lond. 2005;84(1):119–136. [Google Scholar]
- 9.Hoffmann AA, Sorensen JG, Loeschcke V. Adaptation of Drosophila to temperature extremes: Bringing together quantitative and molecular approaches. J Therm Biol. 2003;28(3):175–216. [Google Scholar]
- 10.Kolaczkowski B, Kern AD, Holloway AK, Begun DJ. Genomic differentiation between temperate and tropical Australian populations of Drosophila melanogaster. Genetics. 2011;187(1):245–260. doi: 10.1534/genetics.110.123059. [DOI] [PMC free article] [PubMed] [Google Scholar]
- 11.Pavlíček T, Sharon D, Kravchenko V, Saaroni H, Nevo E. Microclimatic interslope differences underlying biodiversity contrasts in “Evolution Canyon”, Mt. Carmel, Israel. Isr J Earth Sci. 2003;52:1–9. [Google Scholar]
- 12. Nevo E (1995) Asian, African and European biota meet at Evolution-Canyon Israel: Local tests of global biodiversity and genetic diversity patterns. Proc R Soc Lond B 262(1364):149–155.
- 13.Nevo E. Evolution in action across phylogeny caused by microclimatic stresses at “Evolution Canyon”. Theor Popul Biol. 1997;52(3):231–243. doi: 10.1006/tpbi.1997.1330. [DOI] [PubMed] [Google Scholar]
- 14.Sikorski J, Nevo E. Adaptation and incipient sympatric speciation of Bacillus simplex under microclimatic contrast at “Evolution Canyons” I and II, Israel. Proc Natl Acad Sci USA. 2005;102(44):15924–15929. doi: 10.1073/pnas.0507944102. [DOI] [PMC free article] [PubMed] [Google Scholar]
- 15.Nevo E. Evolution of genome-phenome diversity under environmental stress. Proc Natl Acad Sci USA. 2001;98(11):6233–6240. doi: 10.1073/pnas.101109298. [DOI] [PMC free article] [PubMed] [Google Scholar]
- 16.Nevo E. “Evolution Canyon,” a potential microscale monitor of global warming across life. Proc Natl Acad Sci USA. 2012;109(8):2960–2965. doi: 10.1073/pnas.1120633109. [DOI] [PMC free article] [PubMed] [Google Scholar]
- 17.Pavlicek T, Frenkel Z, Korol AB, Beiles A, Nevo E. Drosophila at the “Evolution Canyon” microsite, Mt. Carmel, Israel: Selection overrules migration. Isr J Ecol Evol. 2008;54(2):165–180. [Google Scholar]
- 18.Nevo E, Rashkovetsky E, Pavlicek T, Korol A. A complex adaptive syndrome in Drosophila caused by microclimatic contrasts. Heredity (Edinb) 1998;80(Pt 1):9–16. doi: 10.1046/j.1365-2540.1998.00274.x. [DOI] [PubMed] [Google Scholar]
- 19.Harry M, et al. Fine-scale biodiversity of Drosophilidae in “Evolution Canyon” at the Lower Nahal Oren microsite, Israel. Biologia. 1999;54(6):685–705. [Google Scholar]
- 20.Korol A, et al. Nonrandom mating in Drosophila melanogaster laboratory populations derived from closely adjacent ecologically contrasting slopes at “Evolution Canyon”. Proc Natl Acad Sci USA. 2000;97(23):12637–12642. doi: 10.1073/pnas.220041397. [DOI] [PMC free article] [PubMed] [Google Scholar]
- 21.Michalak P, et al. Genetic evidence for adaptation-driven incipient speciation of Drosophila melanogaster along a microclimatic contrast in “Evolution Canyon,” Israel. Proc Natl Acad Sci USA. 2001;98(23):13195–13200. doi: 10.1073/pnas.231478298. [DOI] [PMC free article] [PubMed] [Google Scholar]
- 22.Iliadi K, et al. Sexual and reproductive behaviour of Drosophila melanogaster from a microclimatically interslope differentiated population of “Evolution Canyon” (Mount Carmel, Israel) Proc Biol Sci. 2001;268(1483):2365–2374. doi: 10.1098/rspb.2001.1822. [DOI] [PMC free article] [PubMed] [Google Scholar]
- 23.Singh SR, Rashkovetsky E, Iliadi K, Nevo E, Korol A. Assortative mating in Drosophila adapted to a microsite ecological gradient. Behav Genet. 2005;35(6):753–764. doi: 10.1007/s10519-005-6119-2. [DOI] [PubMed] [Google Scholar]
- 24.Zamorzaeva I, Rashkovetsky E, Nevo E, Korol A. Sequence polymorphism of candidate behavioural genes in Drosophila melanogaster flies from ‘Evolution canyon’. Mol Ecol. 2005;14(10):3235–3245. doi: 10.1111/j.1365-294X.2005.02616.x. [DOI] [PubMed] [Google Scholar]
- 25.Zamorzaeva I, Rashkovetsky E, Nevo E, Korol A. Deletions in the desaturase2 gene in Israeli populations of Drosophila melanogaster: Possible role in mate recognition. Insect Mol Biol. 2009;18(1):61–69. doi: 10.1111/j.1365-2583.2008.00846.x. [DOI] [PubMed] [Google Scholar]
- 26.Rashkovetsky E, et al. Adaptive differentiation of thermotolerance in Drosophila along a microclimatic gradient. Heredity (Edinb) 2006;96(5):353–359. doi: 10.1038/sj.hdy.6800784. [DOI] [PubMed] [Google Scholar]
- 27.Iliadi KG, et al. [Peculiarities of the courtship song in the Drosophila melanogaster populations adapted to gradient of microecological conditions] Zh Evol Biokhim Fiziol. 2009;45(5):478–485. [PubMed] [Google Scholar]
- 28.Carmel J, Rashkovetsky E, Nevo E, Korol A. Differential expression of small heat shock protein genes Hsp23 and Hsp40, and heat shock gene Hsr-omega in fruit flies (Drosophila melanogaster) along a microclimatic gradient. J Hered. 2011;102(5):593–603. doi: 10.1093/jhered/esr027. [DOI] [PubMed] [Google Scholar]
- 29.Turner TL, Hahn MW, Nuzhdin SV. Genomic islands of speciation in Anopheles gambiae. PLoS Biol. 2005;3(9):e285. doi: 10.1371/journal.pbio.0030285. [DOI] [PMC free article] [PubMed] [Google Scholar]
- 30.Michel AP, et al. Widespread genomic divergence during sympatric speciation. Proc Natl Acad Sci USA. 2010;107(21):9724–9729. doi: 10.1073/pnas.1000939107. [DOI] [PMC free article] [PubMed] [Google Scholar]
- 31.Begun DJ, Aquadro CF. Levels of naturally occurring DNA polymorphism correlate with recombination rates in D. melanogaster. Nature. 1992;356(6369):519–520. doi: 10.1038/356519a0. [DOI] [PubMed] [Google Scholar]
- 32.Hudson RR. How can the low levels of DNA sequence variation in regions of the drosophila genome with low recombination rates be explained? Proc Natl Acad Sci USA. 1994;91(15):6815–6818. doi: 10.1073/pnas.91.15.6815. [DOI] [PMC free article] [PubMed] [Google Scholar]
- 33.Korol AB. Recombination. In: Levin SA, editor. Encyclopedia of Biodiversity. 2nd Ed. Waltham, MA: Academic; 2013. pp. 353–369. [Google Scholar]
- 34.Lidzbarsky GA, Shkolnik T, Nevo E. Adaptive response to DNA-damaging agents in natural Saccharomyces cerevisiae populations from “Evolution Canyon”, Mt. Carmel, Israel. PLoS ONE. 2009;4(6):e5914. doi: 10.1371/journal.pone.0005914. [DOI] [PMC free article] [PubMed] [Google Scholar]
- 35.Korol A, Rashkovetsky E, Iliadi K, Nevo E. Drosophila flies in “Evolution Canyon” as a model for incipient sympatric speciation. Proc Natl Acad Sci USA. 2006;103(48):18184–18189. doi: 10.1073/pnas.0608777103. [DOI] [PMC free article] [PubMed] [Google Scholar]
- 36.Lerman DN, Michalak P, Helin AB, Bettencourt BR, Feder ME. Modification of heat-shock gene expression in Drosophila melanogaster populations via transposable elements. Mol Biol Evol. 2003;20(1):135–144. doi: 10.1093/molbev/msg015. [DOI] [PubMed] [Google Scholar]
- 37.Krebs RA, Feder ME. Deleterious consequences of Hsp70 overexpression in Drosophila melanogaster larvae. Cell Stress Chaperones. 1997;2(1):60–71. doi: 10.1379/1466-1268(1997)002<0060:dcohoi>2.3.co;2. [DOI] [PMC free article] [PubMed] [Google Scholar]
- 38.Zatsepina OG, et al. A Drosophila melanogaster strain from sub-equatorial Africa has exceptional thermotolerance but decreased Hsp70 expression. J Exp Biol. 2001;204(Pt 11):1869–1881. doi: 10.1242/jeb.204.11.1869. [DOI] [PubMed] [Google Scholar]
- 39.Fabian DK, et al. Genome-wide patterns of latitudinal differentiation among populations of Drosophila melanogaster from North America. Mol Ecol. 2012;21(19):4748–4769. doi: 10.1111/j.1365-294X.2012.05731.x. [DOI] [PMC free article] [PubMed] [Google Scholar]
- 40.Boitard S, Schlötterer C, Nolte V, Pandey RV, Futschik A. Detecting selective sweeps from pooled next-generation sequencing samples. Mol Biol Evol. 2012;29(9):2177–2186. doi: 10.1093/molbev/mss090. [DOI] [PMC free article] [PubMed] [Google Scholar]
- 41.Pool JE, et al. Population Genomics of sub-saharan Drosophila melanogaster: African diversity and non-African admixture. PLoS Genet. 2012;8(12):e1003080. doi: 10.1371/journal.pgen.1003080. [DOI] [PMC free article] [PubMed] [Google Scholar]
- 42.Hall LM, Spierer P. The Ace locus of Drosophila melanogaster: Structural gene for acetylcholinesterase with an unusual 5′ leader. EMBO J. 1986;5(11):2949–2954. doi: 10.1002/j.1460-2075.1986.tb04591.x. [DOI] [PMC free article] [PubMed] [Google Scholar]
- 43.Karasov T, Messer PW, Petrov DA. Evidence that adaptation in Drosophila is not limited by mutation at single sites. PLoS Genet. 2010;6(6):e1000924. doi: 10.1371/journal.pgen.1000924. [DOI] [PMC free article] [PubMed] [Google Scholar]
- 44.Menozzi P, Shi MA, Lougarre A, Tang ZH, Fournier D. Mutations of acetylcholinesterase which confer insecticide resistance in Drosophila melanogaster populations. BMC Evol Biol. 2004;4:4. doi: 10.1186/1471-2148-4-4. [DOI] [PMC free article] [PubMed] [Google Scholar]
- 45.Sella G, Petrov DA, Przeworski M, Andolfatto P. Pervasive natural selection in the Drosophila genome? PLoS Genet. 2009;5(6):e1000495. doi: 10.1371/journal.pgen.1000495. [DOI] [PMC free article] [PubMed] [Google Scholar]
- 46.Burke MK, et al. Genome-wide analysis of a long-term evolution experiment with Drosophila. Nature. 2010;467(7315):587–590. doi: 10.1038/nature09352. [DOI] [PubMed] [Google Scholar]
- 47.Smith JM, Haigh J. The hitch-hiking effect of a favourable gene. Genet Res. 2007;89(5-6):391–403. doi: 10.1017/S0016672308009579. [DOI] [PubMed] [Google Scholar]
- 48.Kaplan NL, Hudson RR, Langley CH. The “hitchhiking effect” revisited. Genetics. 1989;123(4):887–899. doi: 10.1093/genetics/123.4.887. [DOI] [PMC free article] [PubMed] [Google Scholar]
- 49.Tajima F. Statistical method for testing the neutral mutation hypothesis by DNA polymorphism. Genetics. 1989;123(3):585–595. doi: 10.1093/genetics/123.3.585. [DOI] [PMC free article] [PubMed] [Google Scholar]
- 50.Fay JC, Wu CI. Hitchhiking under positive Darwinian selection. Genetics. 2000;155(3):1405–1413. doi: 10.1093/genetics/155.3.1405. [DOI] [PMC free article] [PubMed] [Google Scholar]
- 51.Kim Y, Nielsen R. Linkage disequilibrium as a signature of selective sweeps. Genetics. 2004;167(3):1513–1524. doi: 10.1534/genetics.103.025387. [DOI] [PMC free article] [PubMed] [Google Scholar]
- 52.Aguade M, Miyashita N, Langley CH. Reduced variation in the yellow-achaete-scute region in natural populations of Drosophila melanogaster. Genetics. 1989;122(3):607–615. doi: 10.1093/genetics/122.3.607. [DOI] [PMC free article] [PubMed] [Google Scholar]
- 53.Andolfatto P, Przeworski M. Regions of lower crossing over harbor more rare variants in African populations of Drosophila melanogaster. Genetics. 2001;158(2):657–665. doi: 10.1093/genetics/158.2.657. [DOI] [PMC free article] [PubMed] [Google Scholar]
- 54.Schlötterer C, Agis M. Microsatellite analysis of Drosophila melanogaster populations along a microclimatic contrast at lower Nahel Oren canyon, Mount Carmel, Israel. Mol Biol Evol. 2002;19(4):563–568. doi: 10.1093/oxfordjournals.molbev.a004112. [DOI] [PubMed] [Google Scholar]
- 55.Panhuis TM, Swanson WJ, Nunney L. Population genetics of accessory gland proteins and sexual behavior in Drosophila melanogaster populations from Evolution Canyon. Evolution. 2003;57(12):2785–2791. doi: 10.1111/j.0014-3820.2003.tb01520.x. [DOI] [PubMed] [Google Scholar]
- 56.Kirkpatrick M, Ravigné V. Speciation by natural and sexual selection: Models and experiments. Am Nat. 2002;159(Suppl 3):S22–S35. doi: 10.1086/338370. [DOI] [PubMed] [Google Scholar]
- 57.McKinnon JS, et al. Evidence for ecology’s role in speciation. Nature. 2004;429(6989):294–298. doi: 10.1038/nature02556. [DOI] [PubMed] [Google Scholar]
- 58.Schluter D. Ecology and the origin of species. Trends Ecol Evol. 2001;16(7):372–380. doi: 10.1016/s0169-5347(01)02198-x. [DOI] [PubMed] [Google Scholar]
- 59. Papadopulos AST, Baker WJ, Savolainen V (2013) Sympatric speciation in plants: The natural laboratory of Lor Howe Island. Speciation: Natural Processes, Genetics, and Biodiversity, ed Michalak P (Nova Science Publishers, New York), pp 37–57.
- 60. Nevo E (2011) Selection overrules gene flow at “Evolution Canyons”, Israel. Advance in Genetics Research, ed Urbano KV (Nova Science Publishers, New York), pp 67–89.
- 61.Marais G, Mouchiroud D, Duret L. Does recombination improve selection on codon usage? Lessons from nematode and fly complete genomes. Proc Natl Acad Sci USA. 2001;98(10):5688–5692. doi: 10.1073/pnas.091427698. [DOI] [PMC free article] [PubMed] [Google Scholar]
Associated Data
This section collects any data citations, data availability statements, or supplementary materials included in this article.