

Abstract
Background: Epidemiologic and experimental studies support an association between PM2.5 exposure and insulin resistance (IR). Innate immune cell activation has been suggested to play a role in the pathogenesis of these effects.
Objectives: We sought to evaluate the role of CC-chemokine receptor 2 (CCR2) in PM2.5-mediated inflammation and IR.
Methods: Wild-type C57BL/6 and CCR2–/– male mice were fed a high-fat diet and exposed to either concentrated ambient PM2.5 or filtered air for 17 weeks via a whole-body exposure system. We evaluated glucose tolerance and insulin sensitivity. At euthanasia, blood, spleen, and visceral adipose tissue (VAT) were collected, and inflammatory cells were measured using flow cytometry. We used standard immunoblots, immunohistochemical methods, and quantitative PCR (polymerase chain reaction) to assess pathways of interest involving insulin signaling, inflammation, and lipid and glucose metabolism in various organs. Vascular function was assessed using myography.
Results: PM2.5 exposure resulted in whole-body IR and increased hepatic lipid accumulation in the liver, which was attenuated in CCR2–/– mice by inhibiting SREBP1c-mediated transcriptional programming, decreasing fatty acid uptake, and suppressing p38 MAPK activity. Abnormal phosphorylation levels of AKT, AMPK in VAT, and adipose tissue macrophage content in wild-type mice were not present in CCR2–/– mice. However, the impaired whole-body glucose tolerance and reduced GLUT-4 in skeletal muscle in response to PM2.5 was not corrected by CCR2 deficiency.
Conclusions: PM2.5 mediates IR by regulating VAT inflammation, hepatic lipid metabolism, and glucose utilization in skeletal muscle via both CCR2-dependent and -independent pathways. These findings provide new mechanistic links between air pollution and metabolic abnormalities underlying IR.
Citation: Liu C, Xu X, Bai Y, Wang TY, Rao X, Wang A, Sun L, Ying Z, Gushchina L, Maiseyeu A, Morishita M, Sun Q, Harkema JR, Rajagopalan S. 2014. Air pollution–mediated susceptibility to inflammation and insulin resistance: influence of CCR2 pathways in mice. Environ Health Perspect 122:17–26; http://dx.doi.org/10.1289/ehp.1306841
Introduction
Recent epidemiologic studies and experimental evidence support adverse cardiometabolic consequences of air-pollution exposure by worsening of whole-body insulin sensitivity (Rajagopalan and Brook 2012). Studies from our group first demonstrated that exposure to PM2.5 (particulate matter < 2.5 μm) exaggerates insulin resistance (IR) and visceral inflammation/adiposity in mice fed either a high-fat diet (HFD) or a normal diet (Sun et al. 2009; Xu et al. 2010). Inflammation in insulin-sensitive tissues, such as visceral adipose tissue (VAT) and liver, is a central abnormality in obesity/insulin resistance (IR) (Hotamisligil 2006; Ouchi et al. 2011; Shoelson et al. 2006), with recruitment of innate immune cells (e.g., monocytes) into adipose tissue and the liver driving the development of glucose and lipoprotein dysregulation (Lumeng et al. 2008; Weisberg et al. 2003, 2006; Xu et al. 2003).
CC-chemokine receptor 2 (CCR2) plays a critical role in the entry of innate immune cells into tissue through direct interaction with its ligands, CCL2 (monocyte chemoattractant protein 1; MCP-1), CCL7, CCL8, and CCL12 (Charo and Ransohoff 2006; Proudfoot 2002). Recent studies have shown that the CCR2/CCL2 system is not only critical to VAT inflammation but also to the recruitment of macrophages to the liver in response to an HFD (Oh et al. 2012). Consistent with a central role in immune cell recruitment, CCR2 deficiency ameliorates obesity, VAT inflammation, and systemic IR; in fact, hematopoietic CCR2 deficiency is essential for improvement (Ito et al. 2008; Weisberg et al. 2006). In light of the obligatory role of the innate immune system in PM2.5 effects and data presented in the studies cited above, we hypothesized that the adverse effects of PM2.5 exposure on metabolic dysregulation are mediated through coordinated effects on the liver and VAT. We systematically investigated this question in wild-type (WT) and CCR2–/– mice subjected to air pollution exposure.
Materials and Methods
Animals. Male C57BL/6 WT and CCR2–/– mice were purchased from Jackson Laboratories (Bar Harbor, ME, USA). At 18 weeks of age, all mice were housed in groups and maintained at 21°C on a 12-hr light/12-hr dark cycle; they had free access to water and were fed an HFD that derived 60% of calories from lipids (Harlan Teklad, Indianapolis, IN, USA). The protocols and the use of animals were approved by and in accordance with The Ohio State University Animal Care and Use Committee, and the animals were treated humanely and with regard for alleviation of suffering. To avoid sex-dependent differences, we included only male mice in the study.
Whole-body inhalation. Both WT and CCR2–/– (CCR2) mice were exposed by inhalation to either filtered air (FA) or concentrated PM2.5 (PM) for 6 hr/day, 5 days/week from 28 November 2011 to 23 March 2012 (a total duration of 117 days; ~ 17 weeks). Inhalation exposure was carried out in a mobile exposure system, the Ohio Air Pollution Exposure System for Interrogation of Systemic Effects, located at The Ohio State University Animal Facility (Columbus, OH, USA). The animal groups were as follows: WT-FA (n = 8), WT-PM (n = 9), CCR2-FA (n = 9), and CCR2-PM (n = 8). Animal exposures and monitoring of the exposure environment were performed as described previously (Sun et al. 2009; Xu et al. 2010).
PM2.5 concentration and composition in the exposure chambers. To calculate PM2.5 mass concentrations in the exposure chambers, samples were collected on Teflon filters (Teflo; 37 mm, 2-μm pore; PALL Life Sciences, Ann Arbor, MI, USA) at least once each week. Gravimetric determinations were made using an MT-5 microbalance (Mettler Toledo, Columbus, OH, USA) in a temperature- and humidity-controlled Class 100 clean laboratory. PM samples collected on Teflon filters were wet with ethanol and extracted in 10% nitric acid solution. Sample extracts were then analyzed for a suite of trace elements using inductively coupled plasma-mass spectrometry (ELEMENT2; Thermo Finnigan, San Jose, CA, USA) as described by Morishita et al. (2011).
Blood glucose homeostasis and insulin sensitivity. Four days before exposure (baseline) and 4 days after inhalation exposure ended, mice were fasted overnight, and blood samples were collected for assessment of fasting insulin/glucose levels. Glucose tolerance was then analyzed using an intraperitoneal (ip) glucose tolerance test (IPGTT). For this test, mice were administered glucose (2 mg/kg) by ip injection and blood was collected at 0, 30, 60, 90, and 120 min for blood glucose measurement.
One day before exposure to FA or PM2.5, after 8 weeks of exposure, and again 1 day after the exposure ended, mice were fasted for 4.5 hr and assessed for insulin sensitivity by the insulin tolerance test (ITT) (Hagiwara et al. 2012). For this test, mice were administered insulin (0.5 U/kg) by ip injection and blood was collected at 0, 30, 60, 90, and 120 min for blood glucose measurement.
We then performed homeostasis model assessment of the IR index (HOMA-IR), calculated based on 1 mg of insulin being equivalent to 24 IU, using the formula HOMA-IR = [fasting insulin concentration (nanograms per milliliter) × 24 × fasting glucose concentration (milligrams per deciliter)] ÷ 405 (Xu et al. 2010). The HOMA of β-cell function (HOMA-β) was calculated using the formula HOMA-β = 360 × [fasting insulin concentration (nanograms per milliliter)] ÷ [fasting glucose concentration (milligrams per deciliter)] – 63, with values given as percentages.
Circulating inflammatory biomarkers and lipid profile. Cytokine levels in plasma were determined using a Cytometric Bead Array (BD Biosciences, San Diego, CA, USA). Serum was incubated with beads specific for tumor necrosis factor α (TNFα), interferon γ (IFNγ), monocyte chemoattractant protein 1 (MCP-1), interleukin (IL)-6, IL-10, and IL-12p70 according to the manufacturer’s instructions. The total amount of cytokines was determined using a BD LSR II flow cytometer and analyzed by BD CBA software (BD Biosciences) (Xu et al. 2011). Triglyceride and cholesterol levels in liver and/or blood were measured according to the methods of Allain et al. (1974) and McGowan et al. (1983).
Myograph study. After the final IPGTT and ITT measurements, which took place at the end of 17 weeks of PM2.5 or FA exposure, mice were killed by isoflurane inhalation. The thoracic aorta, with adhesive tissue removed, was dissected out, and vascular function (acetylcholine and insulin-induced vasorelaxation) was evaluated in a 5-mL chamber on a Multi Myograph (Danish Myo Technology A/S, Aarhus, Denmark) as previously described (Liu et al. 2009; Sun et al. 2009).
Histology and immunohistochemistry. Segments of liver were frozen in liquid nitrogen and embedded in Tissue-Tek OCT compound (Sakura Finetek USA Inc., Torrance, CA, USA) for staining with Oil Red O. Additional paraffinized liver sections were deparaffinized and stained with hematoxylin and eosin (H&E) to observe tissue morphology. In addition, we used immunohistochemistry to identify cell surface glycoprotein F4/80 (F4/80) in liver and VAT sections (Xu et al. 2011).
Immunoblotting. VAT and liver were homogenized with M-PER Mammalian Protein Extraction Reagent (Thermo Scientific, Rockford, IL, USA), and proteins were loaded on a 10% SDS-PAGE gel. After electrophoresis, proteins were transferred to Immobilon-P polyvinylidene difluoride membranes (Sigma-Aldrich, St. Louis, MO, USA), which were incubated with different primary antibodies. Antibodies for AKT (protein kinase B) and phosphorylated (P)-AKT (phosphorylation at Ser473), PI3K (phosphatidylinositol 3-kinase), AMPK (AMP-activated protein kinase) and P-AMPK (phosphorylation at Thr172), IRS1 (insulin receptor substrate 1) and P-IRS-1 (phosphorylation at Tyr612), GSK3β (glycogen synthase kinase-3 beta) and P-GSK3β (phosphorylation at Ser9), and MAPK (mitogen-activated protein kinase) pathway proteins were obtained from Cell Signaling Technology (Danvers, MA, USA); and that for PEPCK (phosphoenolpyruvate carboxykinase) was from Santa Cruz Biotechnology (Santa Cruz, CA, USA). After incubation with the primary antibody, the immunoblots were incubated with a horseradish peroxidase–conjugated secondary antibody, visualized with enhanced chemiluminescence, and quantitated by densitometric analysis using ImageJ software (National Institutes of Health, Bethesda, MD, USA). β-Actin was used as a loading control.
Quantitative reverse-transcriptase polymerase chain reaction (RT-PCR).RT-PCR was performed using RNA extracted from liver and VAT of mice as described previously (Hagiwara et al. 2012; Xu et al. 2011). Gene expression levels were calculated using the ΔCt method relative to β-actin and are expressed as relative mRNA levels compared with internal control. We used the following primers: HSL (hormone sensitive lipase), ATGL (adipose triglyceride lipase), LPL (lipoprotein lipase), COX4 (cytochrome c oxidase subunit IV), COX5A, COX7A, PGC1α (peroxisome proliferator-activated receptor gamma coactivator 1α), PGC1β, MCAD (medium-chain acyl-CoA dehydrogenase), NrF1 (nuclear respiratory factor 1), mtTFA (mitochondrial transcription factor A), ACO (acyl-CoA oxidase), CPT-1 (carnitine palmitoyltransferase 1), PPARα (peroxisome proliferator-activated receptor α), FABP1 (fatty acid binding protein 1), FABP2, FABP5, CD36, MTP (microsomal triglyceride transfer protein), and APOB (apolipoprotein B). The sequences of all primers are available upon request.
Flow cytometric evaluation of inflammation in blood and tissues. VAT, spleen, and blood from mice (WT-FA, WT-PM, CCR2-FA, and CCR2-PM groups) were processed as described by Kampfrath et al. (2011) and Zhong et al. (2013). Blood cells and spleen cells were incubated with PE-labeled anti-CD11b, FITC-labeled anti-7/4, and PE-Cy7–labeled anti-Gr-1 (Ly-6G/Ly-6C), and the stromal vascular fraction of VAT was incubated with PE-labeled anti-CD11b, PE-Cy5–labeled anti-CD11c (integrin alpha-X), and APC-Cy7–labeled anti-F4/80 (a member of the epidermal growth factor-transmembrane 7 family). All antibodies were purchased from Biolegend (San Diego, CA, USA), Miltenyi Biotec (Bergisch Gladbach, Germany), or BD Biosciences. Cells were then evaluated by flow cytometry using a BD FACS LSR II™ flow cytometer (BD Biosciences), and data were analyzed using BD FACS Diva software (BD Biosciences).
Electrophoretic mobility shift assay. Nuclear proteins were extracted from mouse livers using the NE-PER Nuclear and Cytoplasmic Extraction Reagents kit, and the electrophoretic mobility shift assay (EMSA) was conducted using the LightShift kit (both from Pierce, Rockford, IL, USA) according to manufacturer’s instructions. Specificity of the SREBP1C (sterol regulatory element-binding protein 1 precursor) probe (5´-GAT CCT GAT CAC CCC ACT GAG GAG-3´) (Seo et al. 2003) was confirmed in assays in which unlabeled SREBP1c probe was added in excess as a competitor and by the supershift of SREBP1c–DNA complexes.
Data analysis. Data are presented as mean ± SE unless otherwise indicated. We used Graphpad Prism software (version 5; GraphPad Software Inc., La Jolla, CA, USA) for one-way analysis of variance (ANOVA) and Bonferroni’s post hoc test where appropriate. When there was no significant difference between WT-PM and WT-FA by one-way ANOVA, we determined exact p-values using the t-test. We determined EC50 values (concentration needed to induce 50% of the maximal effect) using nonlinear regression curve fitting. Concentration-relaxation curves were analyzed by two-way ANOVA followed by Bonferroni’s post-tests. A p-value of < 0.05 was considered statistically significant.
Results
PM2.5 exposure concentration and compositional assessment. The mean ± SD PM2.5 concentrations were 9.56 ± 2.9 μg/m3 at the study site (daily ambient level), 2.26 ± 1.9 μg/m3 in the FA chamber, and 116.9 ± 34.2 μg/m3 in the PM2.5 exposure chamber. The concentration in the PM2.5 exposure chamber was approximately 12.5 times that in ambient air (see Supplemental Material, Figure S1). The elemental composition of these air samples is available in Supplemental Material, Table S1.
Role of CCR2 in metabolic impairment by PM2.5. We observed no significant difference between exposure groups in body weight, fasting blood glucose level, glucose tolerance (IPGTT), or insulin sensitivity (ITT) at baseline (prior to consumption of the HFD or assignment to exposure groups) (Figure 1A,B,E,G). After 8 weeks of PM2.5 exposure in conjunction with the HFD, we observed no significant difference in body weight (Figure 1A) or insulin sensitivity (Figure 1H) compared with FA-exposed mice. However, at 17 weeks of exposure, the WT-PM group displayed elevated fasting glucose level and HOMA-IR index, decreased HOMA-β function, abnormal glucose tolerance, and attenuation of whole-body insulin sensitivity (Figure 1B–D,F,I). At this time point, CCR2-PM mice had lower body weight and lower blood glucose concentration than did WT-PM mice (Figure 1A,B). CCR2 deficiency did not affect IPGTT values (Figure 1F); however ITT values were statistically significant at 17 weeks (Figure 1I) but not at 8 weeks (Figure 1H). Taken together, these results suggest that CCR2–/– mice are protected from PM2.5-induced abnormalities in whole-body insulin sensitivity but that CCR2 is not required for regulation of postprandial glycemic response.
Figure 1.
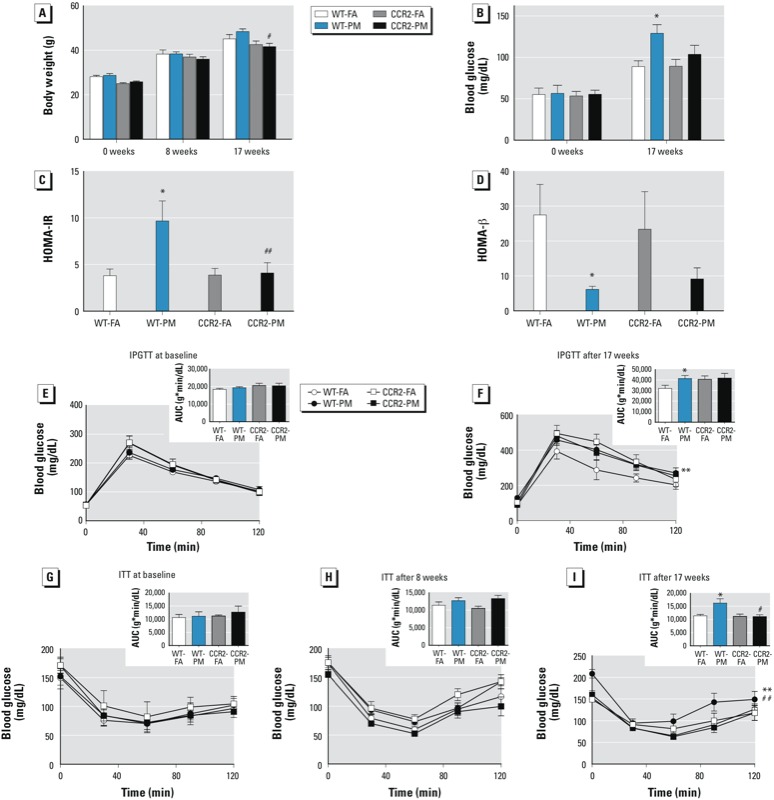
Effect of PM2.5 exposure and HFD on glucose homeostasis in WT and CCR2–/– mice; experiments were performed at baseline and after 8 and 17 weeks of exposure to PM2.5 or FA. (A–B) Body weight (A) and fasting blood glucose (B). (C–D) HOMA-IR (C) and HOMA-β (D) after 17 weeks of exposure. (E–F) Results of IPGTT in overnight-fasted mice at baseline (E) and after 17 weeks of exposure (F). (G–I) Results of ITT in 4.5‑hr–fasted mice before exposure (G) and after 8 weeks (H) and 17 weeks (I) of exposure. Insets (E–I) are results of GTT and ITT analyzed by area under the curve (AUC). Values shown are mean ± SE of 7–9 mice/group. *p < 0.05, and **p < 0.01, compared with the WT‑FA group. #p < 0.05, and ##p < 0.01, compared with the WT‑PM group.
CCR2 deficiency ameliorates inflammatory monocytes in blood and spleen. Because CCR2 plays a central role in the egress of monocytes from systemic reservoirs and in depot-specific inflammation (Charo and Ransohoff 2006; Tsou et al. 2007), we investigated the monocyte response to PM2.5 exposure. We defined monocytes as side scatter (SSC)–high, forward scatter (FSC)–low cells expressing the myeloid antigen 7/4 (high populations; 7/4hi) and high levels of CD11b but low for the neutrophil marker Gr-1 (CD11b+Gr-1low), which corresponds to Ly6Chi monocytes and represents the inflammatory subtype (Combadiére et al. 2008; Henderson et al. 2003; Kampfrath et al. 2011). We noted an increase in circulating CD11b+Gr-1low7/4hi cells, the inflammatory subtype in response to PM2.5 exposure (Figure 2A). In contrast, splenic levels of CD11b+Gr-1low7/4hi cells remained unchanged (Figure 2B). The levels of CD11b+Gr-1low7/4hi in circulation following PM2.5 inhalation were significantly reduced in CCR2–/– mice (Figure 2A) with a corresponding decrease in the spleen (Figure 2B). Supplemental Material, Table S2, depicts circulating cytokines in response to PM2.5 exposure. The concentration of MCP-1 was significantly higher in CCR2–/– mice than WT mice, whereas there were no differences in other measures.
Figure 2.

Representative flow cytometric dot plots and analysis showing effects of PM2.5 exposure and HFD on inflammatory monocytes in blood (A) and spleen (B) from WT and CCR2–/– mice; animals were exposed to PM2.5 or FA for 17 weeks. Abbreviations: FSC, forward scatter; SSC, side scatter. Data were analyzed by relative percentage or absolute cell counts and are presented as mean ± SE of 7–9 mice/group). *p < 0.05, and ***p < 0.001, compared with the WT‑FA group. #p < 0.05, ##p < 0.01, and ###p < 0.001 for CCR2‑PM compared with the WT‑PM group.
CCR2 deficiency does not improve PM2.5-impaired endothelium function. PM2.5-exposed C57BL/6 mice demonstrated a decrease in relaxation in response to both acetylcholine and insulin (see Supplemental Material, Figure S2). However, vascular function impaired by PM2.5 was not significantly different between CCR2–/– and WT mice (see Supplemental Material, Figure S2). These results suggest that abnormalities in endothelium-dependent relaxation are not modulated through CCR2-dependent pathways in response to air pollution exposure.
CCR2 modulates adipose inflammation in response to PM2.5. F4/80 is a well-characterized membrane protein that is the best known marker for mature mouse macrophages. In the present study, F4/80+ adipose tissue macrophages (ATMs) were increased in VAT of WT-PM mice but not in CCR2-PM mice (Figure 3A). This observation was confirmed by mRNA levels of F4/80 and an alternate macrophage marker, CD68 (Figure 3B). PPARγ, a transcription factor required for alternate macrophage differentiation, was down-regulated in VAT of WT-PM mice, but was only partially down-regulated in CCR2-PM mice (Figure 3B). The expression of adipose-derived mediators was not altered by CCR2 deficiency or in response to PM2.5 exposure (see Supplemental Material, Figure S3A). As determined by flow cytometry, F4/80+/CD11b+ and F4/80+/CD11c+ were increased VAT in response to PM2.5 exposure in WT mice but not in CCR2–/– mice (Figure 3D,E).
Figure 3.
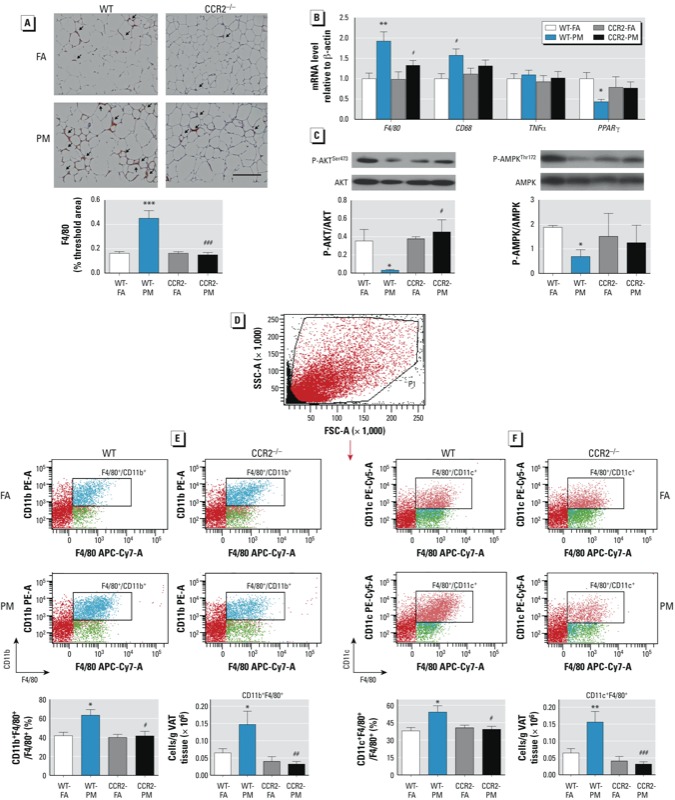
Effect of PM2.5 exposure and HFD on inflammation and insulin signaling in VAT from WT and CCR2–/– mice; animals were exposed to PM2.5 or FA for 17 weeks. (A) Representative image (top; bar = 100 μm) and analysis of F4/80+ staining. (B) mRNA levels of genes involved in inflammation (F4/80, CD68, TNFα, and PPARγ). (C) Western blots and analysis of phosphorylated AKT (P-AKT)/total AKT (left) and phosphorylated AMPK (P-AMPK)/total AMPK (right). (D) Representative flow cytometric dot plot of living cells. (E–F) Representative flow cytometric dot plots showing F4/80+/CD11b+ (E) and F4/80+/CD11c+ (F) with respective analysis by relative percentage or absolute cell count/g VAT. Data are presented as mean ± SE of 7–9 mice/group) *p < 0.05, **p < 0.01, and ***p < 0.001, compared with the WT‑FA group. #p < 0.05, ##p < 0.01, and ###p < 0.001 compared with the WT‑PM group.
We found no difference in the weight of VAT between groups (data not shown). We also observed no change in expression of genes involved in lipolysis and mitochondrial oxidation (see Supplemental Material, Figure S3B). NrF1 and mtTFA are transcription factors involved in mitochondrial biogenesis. Neither PM2.5 exposure nor CCR2 genotype induced a change in mtTFA expression. However, NrF1 levels were significantly lower in the WT-PM group than that in the WT-FA group, and this was partially restored in CCR2-PM mice (see Supplemental Material, Figure S3B).
CCR2 modulates hepatic steatosis in response to PM2.5. Compared with WT-PM mice, CCR2–/– mice showed improved lipid deposition (H&E staining; Figure 4A) and intracytoplasmic lipids (Oil Red O staining; Figure 4B), as well as a trend toward lower liver weight (Figure 4C). In WT-PM mice, levels of hepatic triglycerides and plasma triglycerides were elevated (Figure 4D), suggesting increased production of triglyceride-containing lipoproteins in the liver. We next examined genes involved in lipid metabolism in the liver. Expression of key lipid synthesis enzymes [acetyl-CoA carboxylase 2 (ACC2), fatty acid synthase (FAS), and diacylglycerol acyl transferase (DGAT2)] were all significantly increased in the liver of WT-PM mice compared with WT-FA mice (Figure 4E), whereas there was no difference in expression of other genes. The mRNA level of SREBP1 (a key transcription factor involved in activation of lipogenic genes)—but not SREBP2—was significantly increased in the liver of WT-PM mice (Figure 4F). EMSA of nuclear extracts from the liver demonstrated a trend toward increased SREBP1c binding activity in WT-PM mice, with a smaller increase in CCR2-PM mice (Figure 4G). The increases in lipogenic gene expression observed in WT-PM mice were nearly normal in CCR2-PM mice, with the exception of DGAT2 (Figure 4E). We observed no significant difference in genes related to fatty acid oxidation (see Supplemental Material, Figure S3C). FABP1 mRNA—but not FABP2, FABP5, or CD36—was significantly decreased in the liver of WT-PM mice (see Supplemental Material, Figure S3C). Expression of genes encoding fatty acid export, including APOB and MTP were unaffected by exposure to PM2.5 (see Supplemental Material, Figure S3C).
Figure 4.
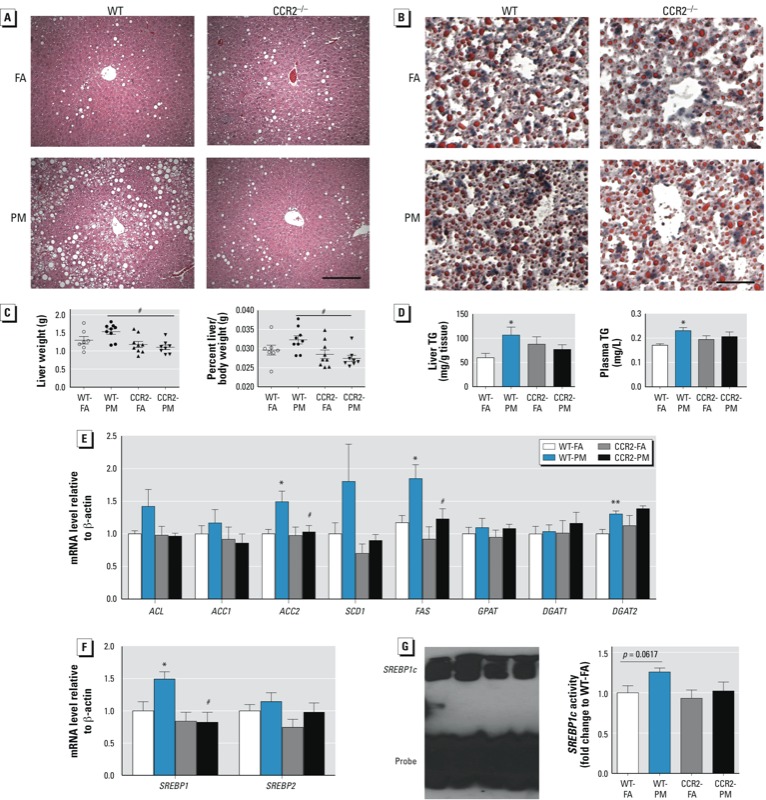
Effect of PM2.5 exposure and an HFD on lipid homeostasis in WT and CCR2–/– mice; animals were exposed to PM2.5 or FA for 17 weeks. (A) Representative images of H&E-stained liver sections; bar = 100 μm. (B) Representative images of oil red O–stained liver sections; bar = 25 μm. (C) Liver weight (left) and liver weight/body weight ratio (right). (D) TG levels in liver (left) and plasma (right). (E) mRNA levels of genes involved in de novo lipid synthesis in the liver. (F) mRNA levels of SREBP1 and SREBP2. (G) The DNA binding activity of SREBP1c in the liver. Data are presented as mean ± SE of 7–9 mice/group. *p < 0.05 for WT‑PM compared with WT‑FA. #p < 0.05 for CCR2‑PM compared with the WT‑PM group.
Role of CCR2 in PM2.5-impaired hepatic glucose metabolism. To investigate mechanisms of hyperglycemia in response to PM2.5, we examined pathways involved in gluconeogenesis and glycolysis. We observed no alteration of a rate-limiting enzyme involved in gluconeogenesis, phosphoenolpyruvate carboxykinase (PEPCK), at both mRNA and protein levels (see Supplemental Material, Figure S4A,B). However, we noted inhibition in expression of G6pase, FBPase, and pyruvate carboxylase (PC) in the liver of WT-PM mice compared with that of WT-FA mice (see Supplemental Material, Figure S4A). We found no difference in expression of the transcription factor C/EBP-α, the coactivator (PGC1α), or glycogen synthase kinase 3 beta (GSK3β; regulating glycogen synthase) in the liver of WT-PM animals (see Supplemental Material, Figure S4A,D). These results suggest that enhanced gluconeogenesis or glycogen synthesis is unlikely to contribute to hyperglycemia in response to PM2.5 exposure.
We observed no differences in glucokinase (GK), a key glycolytic enzyme, in response to PM2.5. However, GK expression was increased in the liver of CCR2–/– mice (both FA and PM groups) compared with WT mice (see Supplemental Material, Figure S4C). This may partially explain the reduced glucose levels in CCR2–/– mice. We found a trend of decreased expression of another enzyme of glucose metabolism, L-type pyruvate kinase (L-PK). Expression of GLUT-2 [solute carrier family 2 (facilitated glucose transporter), member 2] was significantly decreased in the liver of WT-PM mice (compared with WT-FA mice), but it was significantly increased in CCR2-PM mice (compared with WT-PM mice). In addition, the transcription factor ChREBP (carbohydrate response element binding protein), indicative of reduced glucose utilization in the liver, was decreased in WT-PM mice. The ChREBP level was not modulated by CCR2–/– (see Supplemental Material, Figure S4C). As shown in Supplemental Material, Figure S4E, GLUT-4 expression in skeletal muscle was decreased in both WT-PM and CCR2-PM mice.
CCR2 modulates hepatic p38 activation in response to PM2.5. To further explore mechanisms by which PM2.5 impairs glucose homeostasis and hyperlipidemia, we assessed inflammatory signals implicated in hepatic IR. We noted no differences in F4/80 content in the liver of mice exposed to PM2.5, in excess of that induced by HFD (Figure 5A); this was confirmed by quantitative RT-PCR analysis (Figure 5B). The alternative (M2) macrophage activation marker galactose-N-acetylgalactosamine-specific lectin (MgI1) was down-regulated in WT-PM mice but not in CCR2-PM mice (Figure 5B). Western blot analysis demonstrated that activated p38—but not extracellular signal-regulated kinase (ERK) or c-Jun N-terminal kinase (JNK)—was increased in the liver of PM2.5-exposed mice compared with that in FA-exposed mice (Figure 5D). Levels of phosphorylated p38 appeared to be lower in the liver of CCR2–/– mice.
Figure 5.
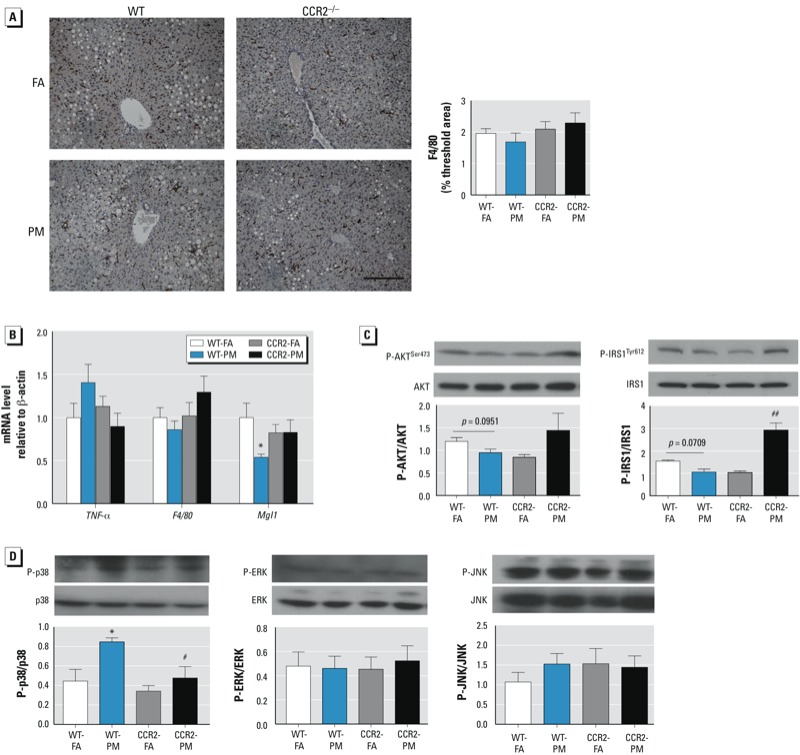
Effects of PM2.5 exposure and HFD on inflammation, insulin, and MAPK signaling pathways in the liver of WT and CCR2–/– mice; animals were exposed to PM2.5 or FA for 17 weeks. (A) Representative image (left; bar = 100 μm) and analysis (right) of F4/80 immunostaining (n = 7–9 mice/group). (B) mRNA levels of three genes involved in inflammation: F4/80, TNFα, and MgI1 (n = 7–9 mice/group). (C) Western blot analysis of phosphorylated AKT (P-AKT)/total AKT and phosphorylated IRS1 (P-IRS1)/total IRS1 (n = 3–7 mice/group). (D) Western blot analysis of signaling molecules involved in the MAPK pathway: phosphorylated p38/p38, phosphorylated ERK/ERK, and phosphorylated JNK/JNK(n = 3–5 mice/group). Data are presented as mean ± SE. *p < 0.05, compared with the WT‑FA group. #p < 0.05, and ##p < 0.01, compared with the WT‑PM group.
Defective insulin signaling in VAT and liver. Phosphorylated AKT (Ser473) was reduced in VAT of WT-PM mice compared with WT-FA mice, but this was not observed in CCR2–/– mice (Figure 3C). Phosphorylated AMPK (Thr172) was inhibited in VAT of WT-PM mice compared with WT-FA mice (Figure 3C), but it was not significantly altered in CCR2-PM mice. Although we observed no significant difference in the liver, there was a clear trend toward a decrease in phosphorylation levels of both AKT at the Ser473 site and insulin receptor substrate-1 (IRS1) at the Tyr612 site in WT-PM mice; however, these levels were increased in the CCR2-PM group (Figure 5C).
Discussion
In the present study, we delineated the effects of PM2.5 inhalation on multiple aspects of glucose/lipid metabolism; our results support a contributing role of CCR2 in PM2.5-mediated effects in conjunction with HFD. We found a) impairment of systemic insulin sensitivity by PM2.5 in WT but not CCR2–/– mice; b) CCR2-dependent potentiation of VAT inflammation and impairment of AMPK and AKT signaling by PM2.5; c) CCR2-dependent enhancement of hepatic lipogenesis/steatosis and activation of p38 MAPK and reduction of insulin signaling by PM2.5; and d) worsening of fasting hyperglycemia via CCR2-independent nongluconeogenic mechanisms.
We previously reported an important association between PM2.5 inhalation and an HFD, providing evidence for an important interaction between environmental and dietary signals (Sun et al. 2009). A component of this effect is recruitment and activation of myeloid cells in tissues such as VAT and liver, where they contribute to adverse metabolic consequences (Oh et al. 2012; Weisberg et al. 2006; Xu et al. 2010; Zheng et al. 2012). Given the importance of the CCR2/CCL2 system in regulating monocyte/macrophage chemotaxis and inflammation in response to HFD signals, we hypothesized that ablation of CCR2 would mitigate adverse consequences of air-pollution exposure in conjunction with an HFD. We did not study normal diet conditions in this investigation because the MCP-1/CCR2 system does not substantially alter inflammation or metabolism in the normal-diet context (Lumeng et al. 2007a; Obstfeld et al. 2010; Weisberg et al. 2006).
PM2.5 exposure attenuated whole-body insulin sensitivity and glucose homeostasis after a substantial latency period (> 8 weeks). In keeping with our original hypothesis, we noted increased numbers of immune cells in the peripheral circulation and VAT in response to PM2.5 exposure, which was not present in CCR2–/– mice, suggesting a dependence of PM2.5 on CCR2 in recruitment of innate immune cells (Ito et al. 2008; Tsou et al. 2007; Weisberg et al. 2006). Infiltration of monocytes is enhanced in obesity via local tissue cues, with a progressive transformation of these cells to a CD11c+ status, resulting in a polarization of the local adipose milieu to an M1 state from a predominantly M2 state under conditions of normal diet (Lumeng et al. 2007b; Oh et al. 2012). Given the significantly higher numbers of CD11c+ cells (absolute numbers) in WT-PM2.5 mice, our results suggest that these cells in VAT may be a consequence of recruitment rather than polarization of existing cell populations.
A key defect in IR is abnormal insulin signaling through alterations in the IRS1–PI3K–AKT pathway. The reduced phosphorylation of the downstream signaling mediator AKT is well implicated as a key marker of IR and has been strongly linked to inflammatory triggers in VAT (Lumeng et al. 2007a, 2007b; McGillicuddy et al. 2009; Osborn and Olefsky 2012; Sun et al. 2009). Similarly, abnormalities in AMP-kinase signaling have been noted as a potential target of inflammation in metabolic diseases (Canto et al. 2009; Salminen et al. 2011; Yu et al. 2010). Reduction in phosphorylated AKT and AMPK in VAT in response to PM2.5 exposure in WT mice—with no reduction in CCR2–/– mice—suggests a dependence of abnormal signaling on inflammation in these pathways. Similarly, in livers from the WT-PM group, we noted a clear trend toward a decrease in levels of phosphorylated AKT and phosphorylated IRS1 at Tyr 612, which was not observed in the CCR2-PM group. These results complement our prior work, which clearly demonstrated increased Ser 636 and Ser 1101 phosphorylation in the liver from mice exposed to PM2.5, collectively suggesting a PM2.5-triggered inhibition of IRS1 signaling (Zheng et al. 2012).
Obesity is well known to induce hepatic triglyceride accumulation and fatty liver, a process coordinated by broad transcriptional programs governing carbohydrate and lipid metabolism. CCR2/CCL2 has previously been shown to regulate triglyceride accumulation (Baeck et al. 2012; Mandrekar et al. 2011). We found that triglyceride levels and neutral fat deposition were markedly higher in WT-PM mice compared with the WT-FA group, which may partly explain the increased liver mass. SREBP1c activation in response to PM2.5 exposure is likely critical to the up-regulation of multiple enzymes involved in triglyceride synthesis. We noticed FABP1, a protein highly expressed in tissues (i.e., liver) that is active in long-chain fatty acid uptake and metabolism, was down-regulated in response to PM2.5 exposure in WT mice but not in CCR2–/– mice. Martin et al. (2008) reported that FABP1-ablated mice exhibited increased age-dependent obesity, which is in line with our study. Taken together, increased lipogenesis and decreased fatty acid uptake, but not fatty acid oxidation or lipid export pathways, account for excess triglyceride accumulation in the liver in response to PM2.5 exposure.
p38 MAPK belongs to a family of evolutionarily conserved serine–threonine MAPKs that link extracellular signals to intracellular machinery regulating a plethora of cellular processes. Together with JNK, they are activated by environmental or genotoxic stress and described as stress-activated protein kinases (Chang and Karin 2001; Coulthard et al. 2009; Morrison and Davis 2003) Consistent with studies that demonstrated the role of p38 in mediating adverse consequences (Liu and Cao 2009), in the present study, we found that p38 was selectively up-regulated in response to PM2.5, with the effect stronger in WT than in CCR2–/– mice. However, Lee et al. (2011) have suggested a protective effect in which increases in p38 activity may regulate Xbp1 nuclear translocation and activity, and thus may represent a compensatory mechanism to maintain homeostatic response. Therefore, the significance of this finding may need additional study.
Circulating glucose levels reflect a balance between glucose production and utilization. Skeletal muscle, which accounts for approximately 80% of insulin-stimulated whole-body glucose disposal, is by far the most affected organ with respect to impaired insulin-stimulated glucose disposal in states of IR. GLUT-4 expression in skeletal muscle was decreased in response to PM2.5 exposure in WT mice, indicating a defect in glucose utilization. Interestingly, a decrease in GLUT-4 levels also occurred in CCR2–/– mice and may represent a potential explanation for lack of improvement in glucose-tolerance. Gluconeogenesis is tightly regulated by insulin signaling (suppressed), with mitigation of this suppression with IR (in the face of continued insulin-mediated lipogenesis). This process requires coordinated activity of four enzymes: PEPCK, G6pase, FBPase, and PC (Jitrapakdee 2012). Surprisingly, we found reduced expression of G6pase, FBPase, and PC mRNA levels, with no alteration of PEPCK levels, after PM2.5 exposure, suggesting an adaptive negative feedback regulation of gluconeogenesis. We found no difference in expression of transcription factors responsible for regulating gluconeogenesis/glycogen synthesis in liver of WT-PM animals, suggesting that enhanced gluconeogenesis or glycogen synthesis is unlikely to contribute to hyperglycemia in response to PM2.5 exposure. Using the DNA motif of the L-PK gene as an affinity tag, Uyeda and Repa (2006) purified a transcription factor from nuclear extracts of liver tissue, which was named ChREBP. Decreased ChREBP in response to PM2.5 exposure may provide an explanation for a trend of glycolysis inhibition. In contrast, GLUT-2, a transporter in liver cells that functions to mediate glucose uptake in the liver for glycolysis, was reduced by PM2.5 exposure. This may contribute to attenuated glucose uptake in the liver and PM2.5-mediated hyperglycemia in the present study. Although CCR2–/– mice showed no improvement in ChREBP or L-PK, the normalized GLUT-2 expression and GK overexpression in these mice may be expected to alleviate glucose dysregulation induced by PM2.5 exposure. Additional experimentation will be required to clarify the mechanism.
In summary, the present study demonstrates complex effects of PM2.5 in exaggerating effects of an HFD. CCR2 plays important roles in adverse effects of PM2.5 by modulating VAT inflammation and hepatic steatosis but not glucose utilization in skeletal muscle. These findings provide new mechanistic links between air pollution and metabolic abnormalities.
Supplemental Material
Footnotes
This work was supported in part by National Institute of Environmental Health Sciences (NIEHS) grants R01ES017290, R01ES015146, and RO1ES019616 to S.R.; NIEHS grant RO1ES018900 to Q.S.; U.S. Environmental Protection Agency (EPA) Clean Air Research Center and Great Lakes Air Center for Integrated Environmental Research grant RD83479701 to S.R., Q.S., and J.R.H.; and Hangzhou Health Program of China grant 20100633B10 and Zhejiang Provincial Natural Science Foundation of China grant LQ13H070002 to C.L.
The contents of this article are solely the responsibility of the grantees and do not necessarily represent the official views of the U.S. EPA. Further, the U.S. EPA does not endorse the purchase of any commercial products or services mentioned in the article.
The authors declare they have no actual or potential competing financial interests.
References
- Allain CC, Poon LS, Chan CS, Richmond W, Fu PC. Enzymatic determination of total serum cholesterol. Clin Chem. 1974;20(4):470–475. [PubMed] [Google Scholar]
- Baeck C, Wehr A, Karlmark KR, Heymann F, Vucur M, Gassler N, et al. Pharmacological inhibition of the chemokine CCL2 (MCP-1) diminishes liver macrophage infiltration and steatohepatitis in chronic hepatic injury. Gut. 2012;61(3):416–426. doi: 10.1136/gutjnl-2011-300304. [DOI] [PubMed] [Google Scholar]
- Canto C, Gerhart-Hines Z, Feige JN, Lagouge M, Noriega L, Milne JC, et al. AMPK regulates energy expenditure by modulating NAD+ metabolism and SIRT1 activity. Nature. 2009;458(7241):1056–1060. doi: 10.1038/nature07813. [DOI] [PMC free article] [PubMed] [Google Scholar]
- Chang L, Karin M. Mammalian MAP kinase signalling cascades. Nature. 2001;410(6824):37–40. doi: 10.1038/35065000. [DOI] [PubMed] [Google Scholar]
- Charo IF, Ransohoff RM. The many roles of chemokines and chemokine receptors in inflammation. N Engl J Med. 2006;354(6):610–621. doi: 10.1056/NEJMra052723. [DOI] [PubMed] [Google Scholar]
- Combadiére C, Potteaux S, Rodero M, Simon T, Pezard A, Esposito B, et al. Combined inhibition of CCL2, CX3CR1, and CCR5 abrogates Ly6Chi and Ly6Clo monocytosis and almost abolishes atherosclerosis in hypercholesterolemic mice. Circulation. 2008;117(13):1649–1657. doi: 10.1161/CIRCULATIONAHA.107.745091. [DOI] [PubMed] [Google Scholar]
- Coulthard LR, White DE, Jones DL, McDermott MF, Burchill SA. p38MAPK: stress responses from molecular mechanisms to therapeutics. Trends Mol Med. 2009;15(8):369–379. doi: 10.1016/j.molmed.2009.06.005. [DOI] [PMC free article] [PubMed] [Google Scholar]
- Hagiwara A, Cornu M, Cybulski N, Polak P, Betz C, Trapani F, et al. Hepatic mTORC2 activates glycolysis and lipogenesis through Akt, glucokinase, and SREBP1c. Cell Metab. 2012;15(5):725–738. doi: 10.1016/j.cmet.2012.03.015. [DOI] [PubMed] [Google Scholar]
- Henderson RB, Hobbs JA, Mathies M, Hogg N. Rapid recruitment of inflammatory monocytes is independent of neutrophil migration. Blood. 2003;102(1):328–335. doi: 10.1182/blood-2002-10-3228. [DOI] [PubMed] [Google Scholar]
- Hotamisligil GS. Inflammation and metabolic disorders. Nature. 2006;444(7121):860–867. doi: 10.1038/nature05485. [DOI] [PubMed] [Google Scholar]
- Ito A, Suganami T, Yamauchi A, Degawa-Yamauchi M, Tanaka M, Kouyama R, et al. Role of CC chemokine receptor 2 in bone marrow cells in the recruitment of macrophages into obese adipose tissue. J Biol Chem. 2008;283(51):35715–35723. doi: 10.1074/jbc.M804220200. [DOI] [PubMed] [Google Scholar]
- Jitrapakdee S. Transcription factors and coactivators controlling nutrient and hormonal regulation of hepatic gluconeogenesis. Int J Biochem Cell Biol. 2012;44(1):33–45. doi: 10.1016/j.biocel.2011.10.001. [DOI] [PubMed] [Google Scholar]
- Kampfrath T, Maiseyeu A, Ying Z, Shah Z, Deiuliis JA, Xu X, et al. Chronic fine particulate matter exposure induces systemic vascular dysfunction via NADPH oxidase and TLR4 pathways. Circ Res. 2011;108(6):716–726. doi: 10.1161/CIRCRESAHA.110.237560. [DOI] [PMC free article] [PubMed] [Google Scholar]
- Lee J, Sun C, Zhou Y, Gokalp D, Herrema H, Park SW, et al. p38 MAPK-mediated regulation of Xbp1s is crucial for glucose homeostasis. Nat Med. 2011;17(10):1251–1260. doi: 10.1038/nm.2449. [DOI] [PMC free article] [PubMed] [Google Scholar]
- Liu CQ, Leung FP, Wong SL, Wong WT, Lau CW, Lu L, et al. Thromboxane prostanoid receptor activation impairs endothelial nitric oxide-dependent vasorelaxations: the role of Rho kinase. Biochem Pharmacol. 2009;78(4):374–381. doi: 10.1016/j.bcp.2009.04.022. [DOI] [PubMed] [Google Scholar]
- Liu Z, Cao W. p38 Mitogen-activated protein kinase: a critical node linking insulin resistance and cardiovascular diseases in type 2 diabetes mellitus. Endocr Metab Immune Disord Drug Targets. 2009;9(1):38–46. doi: 10.2174/187153009787582397. [DOI] [PubMed] [Google Scholar]
- Lumeng CN, Bodzin JL, Saltiel AR. Obesity induces a phenotypic switch in adipose tissue macrophage polarization. J Clin Invest. 2007a;117(1):175–184. doi: 10.1172/JCI29881. [DOI] [PMC free article] [PubMed] [Google Scholar]
- Lumeng CN, DelProposto JB, Westcott DJ, Saltiel AR. Phenotypic switching of adipose tissue macrophages with obesity is generated by spatiotemporal differences in macrophage subtypes. Diabetes. 2008;57(12):3239–3246. doi: 10.2337/db08-0872. [DOI] [PMC free article] [PubMed] [Google Scholar]
- Lumeng CN, Deyoung SM, Saltiel AR. Macrophages block insulin action in adipocytes by altering expression of signaling and glucose transport proteins. Am J Physiol Endocrinol Metab. 2007b;292(1):E166–E174. doi: 10.1152/ajpendo.00284.2006. [DOI] [PMC free article] [PubMed] [Google Scholar]
- Mandrekar P, Ambade A, Lim A, Szabo G, Catalano D. An essential role for monocyte chemoattractant protein-1 in alcoholic liver injury: regulation of proinflammatory cytokines and hepatic steatosis in mice. Hepatology. 2011;54(6):2185–2197. doi: 10.1002/hep.24599. [DOI] [PMC free article] [PubMed] [Google Scholar]
- Martin GG, Atshaves BP, McIntosh AL, Mackie JT, Kier AB, Schroeder F. Liver fatty acid-binding protein gene-ablated female mice exhibit increased age-dependent obesity. J Nutr. 2008;138(10):1859–1865. doi: 10.1093/jn/138.10.1859. [DOI] [PMC free article] [PubMed] [Google Scholar]
- McGillicuddy FC, Chiquoine EH, Hinkle CC, Kim RJ, Shah R, Roche HM, et al. Interferon γ attenuates insulin signaling, lipid storage, and differentiation in human adipocytes via activation of the JAK/STAT pathway. J Biol Chem. 2009;284(46):31936–31944. doi: 10.1074/jbc.M109.061655. [DOI] [PMC free article] [PubMed] [Google Scholar]
- McGowan MW, Artiss JD, Strandbergh DR, Zak B. A peroxidase-coupled method for the colorimetric determination of serum triglycerides. Clin Chem. 1983;29(3):538–542. [PubMed] [Google Scholar]
- Morishita M, Keeler GJ, Kamal AS, Wagner JG, Harkema JR, Rohr AC. Identification of ambient PM2.5 sources and analysis of pollution episodes in Detroit, Michigan using highly time-resolved measurements. Atmos Environ. 2011;45(8):1627–1637. [Google Scholar]
- Morrison DK, Davis RJ. Regulation of MAP kinase signaling modules by scaffold proteins in mammals. Annu Rev Cell Dev Biol. 2003;19:91–118. doi: 10.1146/annurev.cellbio.19.111401.091942. [DOI] [PubMed] [Google Scholar]
- Obstfeld AE, Sugaru E, Thearle M, Francisco AM, Gayet C, Ginsberg HN, et al. C-C chemokine receptor 2 (CCR2) regulates the hepatic recruitment of myeloid cells that promote obesity-induced hepatic steatosis. Diabetes. 2010;59(4):916–925. doi: 10.2337/db09-1403. [DOI] [PMC free article] [PubMed] [Google Scholar]
- Oh DY, Morinaga H, Talukdar S, Bae EJ, Olefsky JM. Increased macrophage migration into adipose tissue in obese mice. Diabetes. 2012;61(2):346–354. doi: 10.2337/db11-0860. [DOI] [PMC free article] [PubMed] [Google Scholar]
- Osborn O, Olefsky JM. The cellular and signaling networks linking the immune system and metabolism in disease. Nat Med. 2012;18(3):363–374. doi: 10.1038/nm.2627. [DOI] [PubMed] [Google Scholar]
- Ouchi N, Parker JL, Lugus JJ, Walsh K. Adipokines in inflammation and metabolic disease. Nat Rev Immunol. 2011;11(2):85–97. doi: 10.1038/nri2921. [DOI] [PMC free article] [PubMed] [Google Scholar]
- Proudfoot AE. Chemokine receptors: multifaceted therapeutic targets. Nat Rev Immunol. 2002;2(2):106–115. doi: 10.1038/nri722. [DOI] [PMC free article] [PubMed] [Google Scholar]
- Rajagopalan S, Brook RD. Air pollution and type 2 diabetes: mechanistic insights. Diabetes. 2012;61(12):3037–3045. doi: 10.2337/db12-0190. [DOI] [PMC free article] [PubMed] [Google Scholar]
- Salminen A, Hyttinen JM, Kaarniranta K. AMP-activated protein kinase inhibits NF-κB signaling and inflammation: impact on healthspan and lifespan. J Mol Med (Berl) 2011;89(7):667–676. doi: 10.1007/s00109-011-0748-0. [DOI] [PMC free article] [PubMed] [Google Scholar]
- Seo JB, Noh MJ, Yoo EJ, Park SY, Park J, Lee IK, et al. Functional characterization of the human resistin promoter with adipocyte determination- and differentiation-dependent factor 1/sterol regulatory element binding protein 1c and CCAAT enhancer binding protein-α. Mol Endocrinol. 2003;17(8):1522–1533. doi: 10.1210/me.2003-0028. [DOI] [PubMed] [Google Scholar]
- Shoelson SE, Lee J, Goldfine AB. Inflammation and insulin resistance. J Clin Invest. 2006;116(7):1793–1801. doi: 10.1172/JCI29069. [DOI] [PMC free article] [PubMed] [Google Scholar]
- Sun Q, Yue P, Deiuliis JA, Lumeng CN, Kampfrath T, Mikolaj MB, et al. Ambient air pollution exaggerates adipose inflammation and insulin resistance in a mouse model of diet-induced obesity. Circulation. 2009;119(4):538–546. doi: 10.1161/CIRCULATIONAHA.108.799015. [DOI] [PMC free article] [PubMed] [Google Scholar]
- Tsou CL, Peters W, Si Y, Slaymaker S, Aslanian AM, Weisberg SP, et al. Critical roles for CCR2 and MCP-3 in monocyte mobilization from bone marrow and recruitment to inflammatory sites. J Clin Invest. 2007;117(4):902–909. doi: 10.1172/JCI29919. [DOI] [PMC free article] [PubMed] [Google Scholar]
- Uyeda K, Repa JJ. Carbohydrate response element binding protein, ChREBP, a transcription factor coupling hepatic glucose utilization and lipid synthesis. Cell Metab. 2006;4(2):107–110. doi: 10.1016/j.cmet.2006.06.008. [DOI] [PubMed] [Google Scholar]
- Weisberg SP, Hunter D, Huber R, Lemieux J, Slaymaker S, Vaddi K, et al. CCR2 modulates inflammatory and metabolic effects of high-fat feeding. J Clin Invest. 2006;116(1):115–124. doi: 10.1172/JCI24335. [DOI] [PMC free article] [PubMed] [Google Scholar]
- Weisberg SP, McCann D, Desai M, Rosenbaum M, Leibel RL, Ferrante AW., Jr Obesity is associated with macrophage accumulation in adipose tissue. J Clin Invest. 2003;112(12):1796–1808. doi: 10.1172/JCI19246. [DOI] [PMC free article] [PubMed] [Google Scholar]
- Xu H, Barnes GT, Yang Q, Tan G, Yang D, Chou CJ, et al. Chronic inflammation in fat plays a crucial role in the development of obesity-related insulin resistance. J Clin Invest. 2003;112(12):1821–1830. doi: 10.1172/JCI19451. [DOI] [PMC free article] [PubMed] [Google Scholar]
- Xu X, Liu C, Xu Z, Tzan K, Zhong M, Wang A, et al. Long-term exposure to ambient fine particulate pollution induces insulin resistance and mitochondrial alteration in adipose tissue. Toxicol Sci. 2011;124(1):88–98. doi: 10.1093/toxsci/kfr211. [DOI] [PMC free article] [PubMed] [Google Scholar]
- Xu X, Yavar Z, Verdin M, Ying Z, Mihai G, Kampfrath T, et al. Effect of early particulate air pollution exposure on obesity in mice: role of p47phox. Arterioscler Thromb Vasc Biol. 2010;30(12):2518–2527. doi: 10.1161/ATVBAHA.110.215350. [DOI] [PMC free article] [PubMed] [Google Scholar]
- Yu LF, Qiu BY, Nan FJ, Li J. AMPK activators as novel therapeutics for type 2 diabetes. Curr Top Med Chem. 2010;10(4):397–410. doi: 10.2174/156802610790980611. [DOI] [PubMed] [Google Scholar]
- Zheng Z, Xu X, Zhang X, Wang A, Zhang C, Huttemann M, et al. Exposure to ambient particulate matter induces a NASH-like phenotype and impairs hepatic glucose metabolism in an animal model. J Hepatol. 2012;58(1):148–154. doi: 10.1016/j.jhep.2012.08.009. [DOI] [PMC free article] [PubMed] [Google Scholar]
- Zhong J, Rao X, Deiuliis J, Braunstein Z, Narula V, Hazey J, et al. A potential role for dendritic cell/macrophage-expressing DPP4 in obesity-induced visceral inflammation. Diabetes. 2013;62(1):149–157. doi: 10.2337/db12-0230. [DOI] [PMC free article] [PubMed] [Google Scholar]
Associated Data
This section collects any data citations, data availability statements, or supplementary materials included in this article.