

Abstract
It has been suggested that the human gut microbiota can be divided into enterotypes based on the abundance of specific bacterial groups; however, the biological significance and stability of these enterotypes remain unresolved. Here, we demonstrated that subjects (n = 62) 18 to 65 years old with central obesity and components of metabolic syndrome could be grouped into two discrete groups simply by their relative abundance of Prevotella spp. divided by Bacteroides spp. (P/B ratio) obtained by quantitative PCR analysis. Furthermore, we showed that these groups remained stable during a 6-month, controlled dietary intervention, where the effect of consuming a diet in accord with the new Nordic diet (NND) recommendations as opposed to consuming the average Danish diet (ADD) on the gut microbiota was investigated. In this study, subjects (with and without stratification according to P/B ratio) did not reveal significant changes in 35 selected bacterial taxa quantified by quantitative PCR (ADD compared to NND) resulting from the dietary interventions. However, we found higher total plasma cholesterol within the high-P/B group than in the low-P/B group after the intervention. We propose that stratification of humans based simply on their P/B ratio could allow better assessment of possible effects of interventions on the gut microbiota and physiological biomarkers.
INTRODUCTION
The human gut microbiota constitutes a very complex microbial community which interacts with and influences the health status of the human host (1). Gut microbiota composition has been associated with several diseases and disorders, including obesity, diabetes, allergies, and inflammatory bowel diseases (2–5). Even though it is not fully understood to what extent shifts in microbiota composition are part of the cause of such diseases, evidence is mounting to support the view that gut microbial composition does play an important role in human health (6, 7). Clarifying the microbial complexity of the gut microbiota and linking the gut microbial patterns with clinical traits are needed. Recently, it has been suggested to group human gut microbiota compositions into three main compositional categories denoted enterotypes based on a relatively high abundance of Bacteroides spp. (enterotype 1), Prevotella spp. (enterotype 2), or Ruminococcus (enterotype 3) (8). Two of these enterotypes (1 and 2), which are mostly driven by the abundance of the genera Prevotella and Bacteroides, have been suggested to be associated with long-term diets within subjects 2 to 50 years old (9). Notably, a 10-day controlled diet intervention with either high-fat/low-fiber or low-fat/high-fiber diets in 10 subjects 18 to 40 years old caused modulations of the gut microbiota but did not lead to a shift in enterotypes (9). However, it is uncertain whether a longer dietary intervention could cause a shift in enterotypes. The existence and biological significance of enterotypes have been much debated (10), and especially the Ruminococcus-driven enterotype (enterotype 3) currently seems less evident (9, 11, 12). The possibility to broadly categorize gut microbiota compositions to simplify and bring clarity to complex ecosystems is attractive and could have both biological and clinical relevance. To date, the biological significance of enterotypes remains largely unknown (8). Nevertheless, a recent study has shown that individuals with an enterotype characterized by enriched proportions of Prevotella have significantly higher plasma concentration of trimethylamine-N-oxide (TMAO), a proatherogenic metabolite, than individuals with a Bacteroides enterotype, indicating that enterotypes affect the host (13). The number of studies dealing with enterotypes is still very limited, and their exact definition and stability in longitudinal studies remain unresolved. Therefore, we aimed to investigate in Danish subjects 18 to 65 years old (i) whether enterotypes could be inferred simply by a Prevotella-to-Bacteroides ratio (P/B ratio), (ii) the stability of enterotypes during a 6-month controlled diet intervention following the new Nordic diet (NND) recommendations (14) with more fruits, vegetables, and whole grain, less added sugar, and less saturated fat, as opposed to an average Danish diet (ADD), and (iii) whether subjects responded differently to the diet intervention according to their enterotype assessed by quantitative PCR of 35 selected bacterial groups representing different taxonomical levels, including phyla, genera, and species, and by selected plasma biomarkers.
MATERIALS AND METHODS
Samples and subjects.
Fecal samples analyzed in the present study were collected from a subgroup of 62 subjects who participated in a 6-month dietary intervention study, including a total of 147 Danish participants 18 to 65 years old with central obesity and components of metabolic syndrome (see Table S1 in the supplemental material) (15). The 62 subjects were, prior to the dietary intervention, selected by random to deliver fecal samples during the study. The effect of consuming a diet following the NND recommendations as opposed to an ADD were investigated, and findings on the primary endpoints, including body weight loss and risk markers of metabolic syndrome, type 2 diabetes, and cardiovascular diseases, are reported elsewhere (15). The dietary intervention study is registered with ClinicalTrials.gov, study identifier NCT01195610. The Ethical Committee of the Capital Region of Denmark approved the study (H-3-2010-058), and informed written consent was obtained from the subjects involved in the study. The dietary intervention study of the NND (n = 36 subjects) compared to the ADD (n = 26 subjects) was performed as a 6-month, nonblinded, parallel, randomized, controlled, ad libitum dietary intervention trial and was carried out between October 2010 and July 2011. For 6 months, the subjects could collect free food from a dedicated store at the Department of Nutrition, Exercise and Sports at University of Copenhagen. All food was registered and ensured to be in accordance with the subject's designated diet (see Table S2 in the supplemental material). All subjects initially completed a run-in period of 7 to 10 days of consuming an ADD, after which the subjects were randomized into two diet groups, receiving either the NND or ADD (Table 1). The randomization was concealed until the end of the run-in period (baseline). The randomization list was generated by an independent senior investigator who did not participate in the subsequent randomization procedure, which was carried out by a scientific assistant. The intervention lasted for 24 to 28 weeks. Two fecal samples from each of the 62 subjects were collected. One fecal sample was collected at the end of the run-in period (baseline) and the other at the end of the intervention.
TABLE 1.
Characteristics of subjects
| Characteristic | Valuec |
P value | |
|---|---|---|---|
| ADD (n = 26 subjects) | NND (n = 36 subjects) | ||
| No. (%) of males | 9 (35) | 11 (31) | 0.74b |
| Mean age (yrs) ± SD | 43.3 ± 12.7 | 44.9 ± 13.9 | 0.64a |
| Mean BMI (kg/m2) ± SD | 29.7 ± 4.4 | 29.3 ± 4.8 | 0.72a |
Unpaired two-sided t test.
Chi-square test.
ADD, average Danish diet; NND, new Nordic diet.
Fecal sample collection handling.
Fecal samples were stored at 5°C upon defecation, and within the same day each fecal sample (minimum of 50 g) was processed by adding an equal amount of demineralized water followed by homogenization with an immersion blender. Aliquots of 0.75 ml of the homogenized fecal samples were transferred to 1-ml CryoTubes and stored at −80°C until use. The immersion blender was cleaned in water and ethanol after each fecal sample was processed.
Fecal sample preparation and DNA extraction.
Prior to DNA extraction, each fecal sample was thawed at room temperature, vortexed for 5 s, and centrifuged at 13,000 × g for 5 min, and the supernatant was subsequently removed. The pellet was resuspended in 1.8 ml maximum recovery diluent (0.9% NaCl with peptone) and centrifuged at 300 × g for 2 min to precipitate the largest particles. The liquid phase containing bacteria was distributed into aliquots of 250 μl. Finally, aliquots were centrifuged at 13,000 × g for 5 min, the supernatant was discarded, and pellets were stored at −80°C. All centrifugation steps were carried out at 4°C. DNA was extracted from the frozen pellets using the Mo Bio PowerLyzer PowerSoil DNA isolation kit (Mo Bio Laboratories, Carlsbad, CA) by following the instructions provided by the manufacturer. Bead beating was conducted at 30 cycles/s for 4 min (Retsch MM 300 mixer mill). The final concentration of the DNA was determined using a fluorescence-based quantification assay (Qubit double-stranded DNA [dsDNA] BR assay; Invitrogen) and stored at −20°C until use. Fecal samples from the same individual were prepared in parallel to ensure equal handling.
Primers used for qPCR.
The majority of the primers used in the present study have been published previously (16). Additionally, primers targeting Alistipes species were designed using 16S rRNA gene sequences obtained through Ribosomal Database Project 10 (17). Sequences representing all known species within the Alistipes genus were aligned using CLC Sequence Viewer 6.7 (CLC bio, Aarhus, Denmark), and putative target sites for primers were identified manually. Target sites were further assessed by Primer3 (18) and Primer BLAST (19), and primers were obtained from TAG Copenhagen A/S. Primer specificity was evaluated in silico using the blastn algorithm (20) and by PCR using purified DNA from Alistipes putredinis (DSM17216), Alistipes finegoldii (DSM17242), Alistipes onderdonkii (DSM19147), Alistipes shahii (DSM19121), and Bacteroides vulgatus (DSM1447), obtained from the DSMZ collection (Deutsche Sammlung von Mikroorganismen und Zellkulturen GmbH, Germany), as the template.
Quantitative real-time PCR of fecal samples.
Quantitative real-time PCR was performed on all fecal samples (n = 124) by using primers targeting 16S ribosomal DNA of 35 different bacterial taxa, including phyla, class, family, genera, and species. Primer sequences and amplicon lengths are reported in Table S3 in the supplemental material. The amplification reactions were carried out with 1.5 μl template DNA (1 ng/μl), 4 μl primer (200 μM), and 5.5 μl 2× SYBR green mix (Roche Applied Science) in a total volume of 11 μl. All reactions were performed with four technical replicates on a LightCycler 480 II (Roche Applied Science) by using the following program: 5 min at 95°C, followed by 45 cycles of 10 s at 95°C, 15 s at 60°C, and 45 s at 72°C, followed by dissociation curve generation for assessing amplicon specificity (95°C for 5 s and 65°C for 1 min and then increasing the temperature to 98°C with a rate of 0.11°C/s with continuous fluorescence detection). For amplification of the three Alistipes species, namely, A. putredinis, A. finegoldii, and A. onderdonkii, the annealing temperature was adjusted to 65°C, 63°C, and 61°C, respectively. Lastly, the butyryl coenzyme A (CoA):acetate CoA transferase (BCoAT) genes were quantified in all samples using primers BCoATscrF and BCoATscrR (21), with a primer concentration of 2.5 μM, by using the following program: 3 min at 95°C, followed by 40 cycles of 30 s at 95°C, 30 s at 53°C, and 30 s at 72°C, followed by dissociation curve generation for assessing amplicon specificity (95°C for 5 s and 65°C for 1 min and then increasing the temperature to 98°C with a rate of 0.11°C/s with continuous fluorescence detection).
qPCR data processing.
The qPCR data were processed and analyzed according to Bergström et al. (16). Raw data recorded by the LightCycler 480 software (version 1.5.0) were converted by LC480 Conversion (version 1.6) and imported and analyzed in the LinRegPCR software (22, 23). The LinRegPCR software performs baseline correction, calculates the mean PCR efficiency for each amplicon, and calculates the initial quantities (N0; arbitrary fluorescence units) for each amplicon. The relative abundances of the 35 specific amplicon groups were obtained by normalizing to the N0 value obtained for the universal bacterial amplicon group (all bacteria). Due to interindividual variation, fold changes for specific amplicon groups were calculated as the ratio of the normalized abundance after intervention to the normalized abundance before intervention for all subjects. The fold changes were log2 transformed, and the relative abundances were log transformed before further analysis.
Plasma samples.
Plasma samples were collected at the end of the run-in period (baseline) and at the end of the intervention. Fasting blood samples were obtained from an intravenous catheter in the antecubital vein. The blood samples were analyzed for plasma total cholesterol, plasma triglyceride, and plasma high-density lipoprotein (HDL) cholesterol by using Vitros reagents on a Vitros 5.1 FS (Ortho Clinical Diagnostics, Johnson & Johnson, Denmark). Low-density lipoprotein (LDL) cholesterol was calculated from the measured values of total cholesterol, HDL cholesterol, and triglyceride according to Friedewald et al.'s equation (24).
Statistics and principal component analysis.
Statistical analyses were performed using the GraphPad Prism software (version 5.0b). The bimodal distributions of the log-normalized Prevotella-to-Bacteroides ratio and the log-normalized Prevotella abundance were tested by the dip test of unimodality (25), where the null hypothesis is a unimodal distribution, calculated by the diptest R package (26). Correlations among the log-normalized abundances were calculated using the Spearman rank correlation. A cooccurrence network was created by the qgraph R package (27) of the Spearman rank correlation matrix of log-normalized relative abundances of 35 quantified bacterial taxa correcting for false discovery rate using the fdrtool R package (28). Comparisons between NND and ADD groups for individual bacterial groups were done by t tests (if normally distributed) or Mann-Whitney U test (if not normally distributed) using log2-transformed fold change values. Comparisons of fold changes with baseline (before intervention) were done by a one-sample t test against a theoretical mean value of 0 (indicating no change) if normally distributed and a Wilcoxon signed-rank test against a theoretical median value of 0 if not normally distributed. P values were adjusted for multiple testing using the Benjamini-Hochberg false discovery rate (q value) (29). The normalized N0 values obtained from all bacterial amplicon groups were used as input for principal component analysis (PCA) by using LatentiX (version 2.11) (Latent5, Frederiksberg, Denmark).
RESULTS
Enterotypes inferred by the Prevotella-to-Bacteroides ratio.
To investigate the presence and characteristics of enterotypes, the gut microbiota was characterized by quantitative PCR of 35 bacterial taxa of human fecal samples from subjects (n = 62) that participated in a dietary intervention examining the effect of the NND. The abundances of Prevotella and Bacteroides have been suggested to be the main drivers of two of the enterotypes, while Ruminococcus abundance drives the third type (8, 9). We found that subjects could be grouped by plotting the relative abundance of Bacteroides spp. against the relative abundance of Prevotella spp., resulting in two clearly separated “clouds” in the two-dimensional space (Fig. 1A). A kernel density plot, which can be considered a refinement of a frequency plot, of the relative abundance of Bacteroides before intervention (Fig. 1B) showed a unimodal distribution, whereas a kernel density plot of the relative abundance of Prevotella before intervention indicated a bimodal distribution (P < 0.001) (Fig. 1C). A more pronounced bimodal distribution with only few intermediates was observed when plotting the P/B ratio (P < 0.001) (Fig. 1D).
FIG 1.

Inferred Prevotella/Bacteroides groups. (A) The log-normalized abundances of Bacteroides spp. versus the log-normalized abundances of Prevotella spp. for all subjects before the intervention. Subjects fall into two groups, indicated with two circles. Kernel density plots of log-normalized relative abundance of Bacteroides spp. (B), Prevotella spp. (C), and Prevotella-to-Bacteroides ratio (D) for all subjects. Subjects (n = 8) with no measured Prevotella spp. at any time point were excluded in this figure.
Microbial differences between P/B groups.
Microbial differences between the P/B groups were investigated by comparing the relative abundances of 35 bacterial taxa (see Table S3 in the supplemental material). Grouping subjects according to their P/B ratio, either low-P/B (P/B < 0.01; n = 34 samples) or high-P/B (P/B > 0.01; n = 28 samples), revealed, besides differences in the relative abundance of Bacteroides spp. and Prevotella spp., that the low-P/B group had significantly higher relative abundance of Bacteroides fragilis (q < 0.005) and Bacteroides eggerthii (q = 0.03) and a tendency for higher relative abundance of Alistipes spp. than the high-P/B group (q = 0.08) (see Fig. S1 in the supplemental material). To investigate the observed tendency for Alistipes spp., which seemed to differ between low- and high-P/B groups, three Alistipes species primers were designed and Alistipes putredinis, Alistipes finegoldii, and Alistipes onderdonkii were quantified by qPCR. A. putredinis and A. onderdonkii were found to be present in all subjects, while A. finegoldii was observed in two-thirds of the subjects (see Fig. S2 in the supplemental material). However, none of the Alistipes species differed significantly between the low- and high-P/B groups. To further identify potential microbial differences between P/B groups, microbial cooccurrence relationships with Prevotella and Bacteroides were examined by correlating the log-normalized relative abundances of 35 bacterial taxa of all subjects using the Spearman rank correlation. A cooccurrence network revealed a negative correlation between Prevotella spp. and Bacteroides spp., which indicates a competition between these two genera (Fig. 2). Furthermore, Prevotella spp. were shown to be negatively correlated with B. fragilis, Alistipes spp., A. onderdonkii, Clostridium cluster I, and Clostridium cluster IV. Bacteroides spp. were positively correlated with Gammaproteobacteria and several groups within the Bacteroidetes phylum and negatively correlated with Lactobacillus spp.
FIG 2.

Cooccurrence network of 35 quantified bacterial taxa. The different colors refer to the different bacterial phyla, and nodes represent bacterial taxa. Positively correlated taxa are marked with blue lines, and negatively correlated taxa are marked with orange lines, with the thickness of the line indicating the significance of the correlation. Note that different taxonomical levels are shown. BCoAT, butyryl CoA:acetate CoA transferase.
Stability of P/B groups over 6 months.
To test the stability of the P/B groups, we compared the P/B ratio of the subjects before and after a 6-month diet intervention with either the ADD or NND. The P/B ratio was generally shown to be stable during the 6 months, as only two individuals (both in the NND group) experienced a change in this ratio sufficient enough to result in a shift in the P/B group (Fig. 3). The P/B ratio for these two subjects after the intervention was verified by repeating the qPCR analysis. The overall effect of the diet intervention was evaluated by examining the relative abundances as well as the mean fold changes in 35 bacterial taxa relative to baseline for each diet group, i.e., NND and ADD. The two diet groups could not be distinguished from each other by principal component analysis of the relative bacterial abundances after intervention (Fig. 4). With respect to mean fold changes of all bacterial taxa within both diet groups, no bacterial taxon was found to differ significantly between the ADD and NND group after correcting for multiple testing (see Fig. S3 in the supplemental material). Nevertheless, compared to baseline, several bacterial groups differed significantly (q < 0.05) within both diet groups (see Fig. S3).
FIG 3.
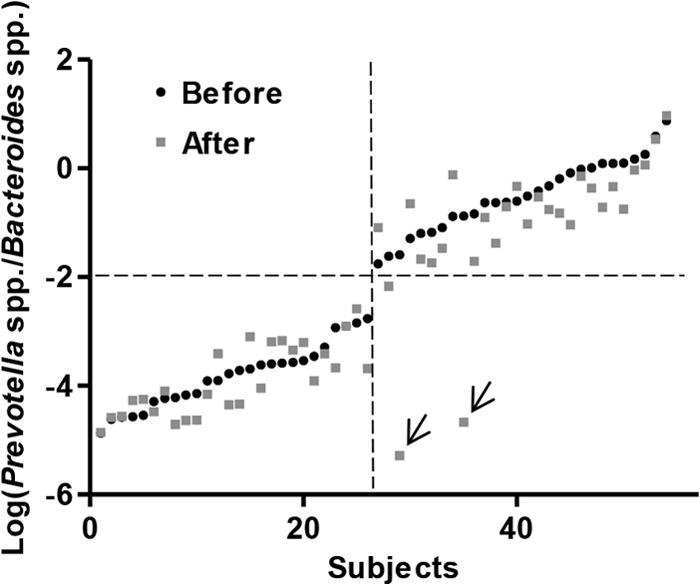
Log-normalized Prevotella-to-Bacteroides ratio (P/B ratio) for all subjects before and after the intervention, sorted by increasing the log-normalized P/B ratio before the intervention. The P/B ratios remain stable overall during the 6 months, as only two subjects (marked by two arrows) shifted their ratio substantially. Subjects (n = 8) with no measured Prevotella spp. at any time point were excluded from the figure.
FIG 4.

Principal component analysis (PCA) of subjects' fecal composition before and after diet intervention. The PCA is based on relative abundances of 16S ribosomal DNA of 28 different bacterial groups in a total of 124 fecal samples collected before and after the intervention. B. breve and B. eggerthii were excluded from the PCA due to low prevalence in the fecal samples, and A. onderdonkii, A. putredinis, and A. finegoldii were not included. (A) PCA score plot with the average Danish diet (ADD) before intervention (red), ADD after intervention (blue), new Nordic diet (NND) before intervention (green), and NND after intervention (pink). (B) PCA loading plot of the different bacterial groups. The six colored circles indicate the five main phyla (two circles for Firmicutes) and show how the bacterial groups cluster together within their phylum.
Stratification of subjects by P/B ratio.
We showed that the P/B ratio generally was stable over 6 months, suggesting that the P/B ratio could be a tool to stratify subjects when examining the effect of an intervention on the gut microbiota. Although no bacterial differences were seen between the diet groups as a result of the intervention, we hypothesized that by stratifying subjects into low- and high-P/B groups, we might be able to see bacterial differences between diet groups within each P/B group. However, examining the relative abundances as well as the mean fold changes in 35 bacterial taxa relative to baseline for each diet group, the low- and high-P/B groups did not differ significantly in their responses to the diet intervention (data not shown). Nevertheless, stratification of subjects into P/B groups revealed significant differences between P/B groups in the total plasma cholesterol after the diet intervention (P < 0.05) and a tendency before intervention (P = 0.08) (Fig. 5A). In comparison, no significant differences were seen between the ADD and NND groups in total plasma cholesterol before and after diet intervention (Fig. 5B). The other measures from plasma (triglyceride, LDL, and HDL) did not differ between P/B groups.
FIG 5.
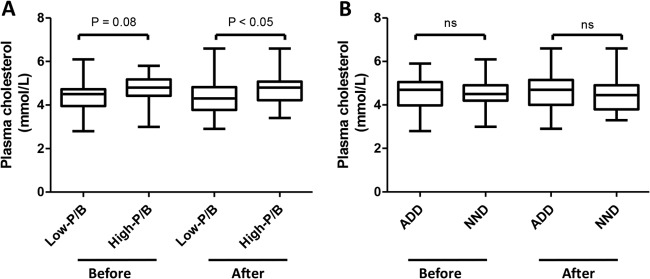
Total plasma cholesterol concentrations in low- and high-P/B groups (A) and ADD and NND groups (B) before and after the diet intervention. ADD, average Danish diet; NND, new Nordic diet; ns, not significant.
DISCUSSION
We found a negative correlation between Prevotella spp. and Bacteroides spp. in the fecal communities of the 62 subjects included in this study (Fig. 2). Competition for nutrients in the intestinal ecosystem between these two genera, both belonging to the Bacteroidales order, has previously been suggested (30) and has been proposed to be the main driver of two of the three previously described enterotypes (8, 9). In agreement with this, we found that the relative abundance of Prevotella spp. separated the subjects into low- and high-Prevotella groups, as seen from the clear bimodal distribution (Fig. 1C). Even though the distribution of Bacteroides spp. appeared monomodal (Fig. 1B), which has also been observed in other studies (8, 9, 31), it was observed that applying the ratio between Prevotella spp. and Bacteroides spp. (P/B ratio) further augmented the separation into two distinct groups (Fig. 1D). This supports that humans can be stratified effectively into a low-P/B group and a high-P/B group, with Prevotella being the main discriminatory taxon, as previously reported (9, 32). Using the P/B ratio as a simplified proxy to determine enterotypes, we focused on the two enterotypes driven by these genera and thus did not expect to detect subjects belonging to the proposed Ruminococcus-driven enterotype (8) based on this approach. Whether the low- and high-P/B groups are directly comparable to the previously suggested enterotypes is uncertain, as several approaches to define these enterotypes have been suggested and the enterotype definition is highly dependent on choice of clustering method (31). In the current study, a tendency was observed for a higher abundance of Alistipes spp. in the low-P/B group than in the high-P/B group (see Fig. S1 in the supplemental material), and a positive correlation between Alistipes spp. and Bacteroides spp. was observed (Fig. 2), which is in line with previous reports showing the Bacteroides enterotype to be additionally characterized by the presence of Alistipes (9). Additionally, the two P/B groups differed significantly with respect to relative abundance of B. fragilis and B. eggerthii, and the abundance of Prevotella spp. was shown to be negatively correlated with B. fragilis and Alistipes spp. (Fig. 2).
The Bacteroides enterotype has previously been associated with animal protein, a variety of amino acids, and saturated fat, while the Prevotella enterotype has been associated with carbohydrate-based diets (9). This has been supported by a study comparing the gut microbiota of children from Burkina Faso, characterized by consuming a rural diet, with European children, characterized by consuming a modern Western diet, reporting a higher abundance of Bacteroidetes, including Prevotella, in the children from Burkina Faso (33). Moreover, a recent study compared Africans and African-Americans and found predominance of Prevotella in native Africans (Prevotella enterotype) and of Bacteroides in African-Americans (Bacteroides enterotype) (34). The subjects of the present study all had a Western life style, and subjects with the Prevotella enterotype would thus not be expected in a high number. However, we found a higher frequency of the high-P/B group (Prevotella enterotype) than observed in some previous studies (8, 9) based on the original definition of enterotypes. We speculate that the higher frequency of the high-P/B group could be caused by the included subjects all being overweight and/or having components of metabolic syndrome. Comparable results in Irish elderly subjects have, however, recently been obtained in a study (11) where the P/B ratio, deduced from 16S rRNA sequencing, was distributed in a similar way as reported here.
To test the stability of the low- and high-P/B groups, we compared the P/B ratios before and after a 6-month dietary intervention. Until now, few studies have assessed the stability of enterotypes over time. However, enterotypes have been shown to be stable over 10 days (9), and a long-term study of the gut microbiota composition over several years suggested that enterotypes may shift during a period of 10 years (35). Here, we showed that only 2 out of 62 subjects had changed their P/B ratio notably after the intervention (Fig. 3), indicating that this ratio generally remains stable over 6 months. One of the two shifters consumed antibiotics for 1 week in the middle of the intervention, which may explain the shift in P/B group. However, 15 other subjects also consumed antibiotics (see Table S4 in the supplemental material) during the intervention without experiencing a shift in P/B group. The other shifter did not take antibiotics and experienced a more dramatic change in the overall gut microbiota composition compared to that of the shifter who took antibiotics during the intervention. Both subjects were above 55 years of age, and both consumed the NND but did not differ from other subjects in terms of physiological changes as a result of the dietary intervention. Based on the available data, it is not possible to conclude what caused the shifts.
Overall, the gut microbiota of subjects was not markedly differently affected by the two types of diet (ADD or NND) over a 6-month period (Fig. 4; see also Fig. S3 in the supplemental material). Previous reports of diet-induced changes in the gut microbiota have examined the effect of more extreme dietary changes, such as a shift to a high-fat/low-fiber, low-fat/high-fiber, or high-protein/low-carbohydrate diet (9, 36, 37). In the present study, we addressed the effects of a more moderate dietary intervention, based on NND recommendations. Our results highlight the intrinsic stability of the gut microbiota, which has been shown to remain stable over years (38, 39). Even though diet is well known to influence our gut microbiota (9, 33), substantial changes in the diet might be needed in order to shift P/B groups (enterotypes). This is supported by a recent study which showed that even a diet shift to a strict vegetarian diet for 1 month did not result in a change of enterotypes (40). Stratification of subjects based on P/B ratio is expected to facilitate the detection of changes not seen when looking at all subjects collectively; however, in the present case, we did not find any significant differences between the low- and high-P/B groups with respect to their response to the dietary interventions after correcting for multiple testing. However, inspired by a recent study which showed that individuals belonging to the Prevotella enterotype had significantly higher plasma concentrations of TMAO, a proatherogenic metabolite, than individuals belonging to the Bacteroides enterotype (13), we compared measurements of plasma between P/B groups before and after intervention. Interestingly, we found higher total plasma cholesterol within the high-P/B group than in the low-P/B group after the intervention and a tendency for this also before intervention (Fig. 5A); however, no differences were seen between diet groups (Fig. 5B). This observation suggests a link between the gut microbiota and the amount of cholesterol in plasma. A relationship between blood cholesterol levels and cardiovascular disease is undisputed (41), while the link between blood cholesterol and gut microbiota is still unresolved. It is known that the gut microbiota affects the blood metabolome (42), and it has been shown in mice that the gut microbiota affects the lipid and cholesterol metabolism, thereby changing the level of cholesterol in serum (43, 44). Also a study on pregnant women observed associations between the gut microbiota and plasma cholesterol (45). Koeth et al. showed that, apart from a higher presence of TMAO in plasma of subjects with the Prevotella enterotype, TMAO in vivo reduces reverse cholesterol transport (13). We therefore propose that the larger amount of cholesterol in the plasma of subjects in the high-P/B group than in the low-P/B group could be due to reduced reverse cholesterol transport caused by an increased level of TMAO in plasma.
In conclusion, we were able to group subjects by their P/B ratio into two discrete groups, which remained stable over a period of 6 months. The stability of the P/B groups suggests that classification of human subjects by the P/B ratio may be a useful tool to reduce the variability given by the large interindividual variation of the gut microbiota, which could help to better assess effects of interventions on the gut microbiota and corresponding metabolome of feces, blood, and urine. However, in the present study, stratification of subjects into low- and high-P/B groups did not reveal differences in terms of microbial composition response to the dietary interventions. Therefore, the use of the P/B ratio to stratify subjects should be further investigated.
Supplementary Material
ACKNOWLEDGMENTS
This work was supported by funds from the Nordea Foundation and was part of the OPUS project “Optimal well-being, development and health for Danish children through a healthy New Nordic Diet.” Additionally, it was partly supported by a grant from the Danish Strategic Research Council given to T.R.L. (11-116163, Research Center on Gut, Grain and Greens). Furthermore, H.M.R. received personal financial support from the Novo Scholarship Programme funded by Novozymes.
We thank Bodil Madsen and Kate Vibefeldt for excellent technical assistance.
Footnotes
Published ahead of print 2 December 2013
Supplemental material for this article may be found at http://dx.doi.org/10.1128/AEM.03549-13.
REFERENCES
- 1.Neish AS. 2009. Microbes in gastrointestinal health and disease. Gastroenterology 136:65–80. 10.1053/j.gastro.2008.10.080 [DOI] [PMC free article] [PubMed] [Google Scholar]
- 2.Ley RE, Turnbaugh PJ, Klein S, Gordon JI. 2006. Microbial ecology: human gut microbes associated with obesity. Nature 444:1022–1023. 10.1038/4441022a [DOI] [PubMed] [Google Scholar]
- 3.Larsen N, Vogensen FK, van den Berg FW, Nielsen DS, Andreasen AS, Pedersen BK, Al-Soud WA, Sørensen SJ, Hansen LH, Jakobsen M. 2010. Gut microbiota in human adults with type 2 diabetes differs from nondiabetic adults. PLoS One 5:e9085. 10.1371/journal.pone.0009085 [DOI] [PMC free article] [PubMed] [Google Scholar]
- 4.Round JL, Mazmanian SK. 2009. The gut microbiota shapes intestinal immune responses during health and disease. Nat. Rev. Immunol. 9:313–323. 10.1038/nri2515 [DOI] [PMC free article] [PubMed] [Google Scholar]
- 5.Spor A, Koren O, Ley R. 2011. Unravelling the effects of the environment and host genotype on the gut microbiome. Nat. Rev. Microbiol. 9:279–290. 10.1038/nrmicro2540 [DOI] [PubMed] [Google Scholar]
- 6.Tremaroli V, Bäckhed F. 2012. Functional interactions between the gut microbiota and host metabolism. Nature 489:242–249. 10.1038/nature11552 [DOI] [PubMed] [Google Scholar]
- 7.Wu G, Bushmanc F, Lewis J. 30 March 2013. Diet, the human gut microbiota, and IBD. Anaerobe. [Epub ahead of print.] 10.1016/j.anaerobe.2013.03.011 [DOI] [PubMed] [Google Scholar]
- 8.Arumugam M, Raes J, Pelletier E, Le Paslier D, Yamada T, Mende DR, Fernandes GR, Tap J, Bruls T, Batto JM, Bertalan M, Borruel N, Casellas F, Fernandez L, Gautier L, Hansen T, Hattori M, Hayashi T, Kleerebezem M, Kurokawa K, Leclerc M, Levenez F, Manichanh C, Nielsen HB, Nielsen T, Pons N, Poulain J, Qin J, Sicheritz-Ponten T, Tims S, Torrents D, Ugarte E, Zoetendal EG, Wang J, Guarner F, Pedersen O, de Vos WM, Brunak S, Dore J, Meta Consortium HIT, Antolin M, Artiguenave F, Blottiere HM, Almeida M, Brechot C, Cara C, Chervaux C, Cultrone A, Delorme C, Denariaz G, Dervyn R, Foerstner KU, Friss C, van de Guchte M, Guedon E, Haimet F, Huber W, van Hylckama-Vlieg J, Jamet A, Juste C, Kaci G, Knol J, Lakhdari O, Layec S, Le Roux K, Maguin E, Merieux A, Melo Minardi R, M'rini C, Muller J, Oozeer R, Parkhill J, Renault P, Rescigno M, Sanchez N, Sunagawa S, Torrejon A, Turner K, Vandemeulebrouck G, Varela E, Winogradsky Y, Zeller G, Weissenbach J, Ehrlich SD, Bork P. 2011. Enterotypes of the human gut microbiome. Nature 473:174–180. 10.1038/nature09944 [DOI] [PMC free article] [PubMed] [Google Scholar]
- 9.Wu GD, Chen J, Hoffmann C, Bittinger K, Chen YY, Keilbaugh SA, Bewtra M, Knights D, Walters WA, Knight R, Sinha R, Gilroy E, Gupta K, Baldassano R, Nessel L, Li H, Bushman FD, Lewis JD. 2011. Linking long-term dietary patterns with gut microbial enterotypes. Science 334:105–108. 10.1126/science.1208344 [DOI] [PMC free article] [PubMed] [Google Scholar]
- 10.Jeffery I, Claesson M, O'Toole P, Shanahan F. 2012. Categorization of the gut microbiota: enterotypes or gradients? Nat. Rev. Microbiol. 10:591–592. 10.1038/nrmicro2859 [DOI] [PubMed] [Google Scholar]
- 11.Claesson MJ, Jeffery IB, Conde S, Power SE, O'Connor EM, Cusack S, Harris HM, Coakley M, Lakshminarayanan B, O'Sullivan O, Fitzgerald GF, Deane J, O'Connor M, Harnedy N, O'Connor K, O'Mahony D, van Sinderen D, Wallace M, Brennan L, Stanton C, Marchesi JR, Fitzgerald AP, Shanahan F, Hill C, Ross RP, O'Toole PW. 2012. Gut microbiota composition correlates with diet and health in the elderly. Nature 488:178–184. 10.1038/nature11319 [DOI] [PubMed] [Google Scholar]
- 12.Huse S, Ye Y, Zhou Y, Fodor A. 2012. A core human microbiome as viewed through 16S rRNA sequence clusters. PLoS One 7:e34242. 10.1371/journal.pone.0034242 [DOI] [PMC free article] [PubMed] [Google Scholar]
- 13.Koeth RA, Wang Z, Levison BS, Buffa JA, Org E, Sheehy BT, Britt EB, Fu X, Wu Y, Li L, Smith JD, Didonato JA, Chen J, Li H, Wu GD, Lewis JD, Warrier M, Brown JM, Krauss RM, Tang WH, Bushman FD, Lusis AJ, Hazen SL. 2013. Intestinal microbiota metabolism of l-carnitine, a nutrient in red meat, promotes atherosclerosis. Nat. Med. 19:576–585. 10.1038/nm.3145 [DOI] [PMC free article] [PubMed] [Google Scholar]
- 14.Mithril C, Dragsted LO, Meyer C, Blauert E, Holt MK, Astrup A. 2012. Guidelines for the new Nordic diet. Public Health Nutr. 15:1941–1947. 10.1017/S136898001100351X [DOI] [PubMed] [Google Scholar]
- 15.Poulsen SK, Due A, Jordy AB, Kiens B, Stark KD, Stender S, Holst C, Astrup A, Larsen TM. 20 November 2013. Health effect of the New Nordic Diet in adults with increased waist circumference: a 6-mo randomized controlled trial. Am. J. Clin. Nutr. [Epub ahead of print.] 10.3945/ajcn.113.069393 [DOI] [PubMed] [Google Scholar]
- 16.Bergström A, Licht TR, Wilcks A, Andersen JB, Schmidt LR, Gronlund HA, Vigsnaes LK, Michaelsen KF, Bahl MI. 2012. Introducing GUt low-density array (GULDA): a validated approach for qPCR-based intestinal microbial community analysis. FEMS Microbiol. Lett. 337:38–47. 10.1111/1574-6968.12004 [DOI] [PubMed] [Google Scholar]
- 17.Cole JR, Wang Q, Cardenas E, Fish J, Chai B, Farris RJ, Kulam-Syed-Mohideen AS, McGarrell DM, Marsh T, Garrity GM, Tiedje JM. 2009. The Ribosomal Database Project: improved alignments and new tools for rRNA analysis. Nucleic Acids Res. 37:D141–D145. 10.1093/nar/gkn879 [DOI] [PMC free article] [PubMed] [Google Scholar]
- 18.Untergasser A, Cutcutache I, Koressaar T, Ye J, Faircloth BC, Remm M, Rozen SG. 2012. Primer3—new capabilities and interfaces. Nucleic Acids Res. 40:e115. 10.1093/nar/gks596 [DOI] [PMC free article] [PubMed] [Google Scholar]
- 19.Ye J, Coulouris G, Zaretskaya I, Cutcutache I, Rozen S, Madden TL. 2012. Primer-BLAST: a tool to design target-specific primers for polymerase chain reaction. BMC Bioinformatics 13:134. 10.1186/1471-2105-13-134 [DOI] [PMC free article] [PubMed] [Google Scholar]
- 20.Altschul SF, Gish W, Miller W, Myers EW, Lipman DJ. 1990. Basic local alignment search tool. J. Mol. Biol. 215:403–410. 10.1016/S0022-2836(05)80360-2 [DOI] [PubMed] [Google Scholar]
- 21.Louis P, Flint HJ. 2007. Development of a semiquantitative degenerate real-time PCR-based assay for estimation of numbers of butyryl-coenzyme A (CoA) CoA transferase genes in complex bacterial samples. Appl. Environ. Microbiol. 73:2009–2012. 10.1128/AEM.02561-06 [DOI] [PMC free article] [PubMed] [Google Scholar]
- 22.Ramakers C, Ruijter JM, Deprez RH, Moorman AF. 2003. Assumption-free analysis of quantitative real-time polymerase chain reaction (PCR) data. Neurosci. Lett. 339:62–66. 10.1016/S0304-3940(02)01423-4 [DOI] [PubMed] [Google Scholar]
- 23.Ruijter JM, Ramakers C, Hoogaars WM, Karlen Y, Bakker O, van den Hoff MJ, Moorman AF. 2009. Amplification efficiency: linking baseline and bias in the analysis of quantitative PCR data. Nucleic Acids Res. 37:e45. 10.1093/nar/gkp045 [DOI] [PMC free article] [PubMed] [Google Scholar]
- 24.Friedewald WT, Levy RI, Fredrickson DS. 1972. Estimation of the concentration of low-density lipoprotein cholesterol in plasma, without use of the preparative ultracentrifuge. Clin. Chem. 18:499–502 [PubMed] [Google Scholar]
- 25.Hartigan JA, Hartigan PM. 1985. The dip test of unimodality. Ann. Stat. 13:70–84. 10.2307/2241144 [DOI] [Google Scholar]
- 26.Mächler M. 2012. Diptest: Hartigan's dip test statistic for unimodality, R package version 0.75-4. The Comprehensive R Archive Network. http://cran.r-project.org/web/packages/diptest/diptest.pdf [Google Scholar]
- 27.Epskamp S, Cramer AOJ, Waldorp LJ, Schmittmann VD, Borsboom D. 2012. qgraph: network visualizations of relationships in psychometric data. J. Stat. Software 48:1–18 [Google Scholar]
- 28.Strimmer K. 2008. fdrtool: a versatile R package for estimating local and tail area-based false discovery rates. Bioinformatics 24:1461–1462. 10.1093/bioinformatics/btn209 [DOI] [PubMed] [Google Scholar]
- 29.Benjamini Y, Hochberg Y. 1995. Controlling the false discovery rate—a practical and powerful approach to multiple testing. J. R. Stat. Soc. Ser. B Methodol. 57:289–300 [Google Scholar]
- 30.Faust K, Sathirapongsasuti JF, Izard J, Segata N, Gevers D, Raes J, Huttenhower C. 2012. Microbial cooccurrence relationships in the human microbiome. PLoS Comput. Biol. 8:e1002606. 10.1371/journal.pcbi.1002606 [DOI] [PMC free article] [PubMed] [Google Scholar]
- 31.Koren O, Knights D, Gonzalez A, Waldron L, Segata N, Knight R, Huttenhower C, Ley RE. 2013. A guide to enterotypes across the human body: meta-analysis of microbial community structures in human microbiome datasets. PLoS Comput. Biol. 9:e1002863. 10.1371/journal.pcbi.1002863 [DOI] [PMC free article] [PubMed] [Google Scholar]
- 32.Yatsunenko T, Rey FE, Manary MJ, Trehan I, Dominguez-Bello MG, Contreras M, Magris M, Hidalgo G, Baldassano RN, Anokhin AP, Heath AC, Warner B, Reeder J, Kuczynski J, Caporaso JG, Lozupone CA, Lauber C, Clemente JC, Knights D, Knight R, Gordon JI. 2012. Human gut microbiome viewed across age and geography. Nature 486:222–227. 10.1038/nature11053 [DOI] [PMC free article] [PubMed] [Google Scholar]
- 33.De Filippo C, Cavalieri D, Di Paola M, Ramazzotti M, Poullet JB, Massart S, Collini S, Pieraccini G, Lionetti P. 2010. Impact of diet in shaping gut microbiota revealed by a comparative study in children from Europe and rural Africa. Proc. Natl. Acad. Sci. U. S. A. 107:14691–14696. 10.1073/pnas.1005963107 [DOI] [PMC free article] [PubMed] [Google Scholar]
- 34.Ou J, Carbonero F, Zoetendal E, Delany J, Wang M, Newton K, Gaskins H, O'Keefe S. 2013. Diet, microbiota, and microbial metabolites in colon cancer risk in rural Africans and African Americans. Am. J. Clin. Nutr. 98:111–120. 10.3945/ajcn.112.056689 [DOI] [PMC free article] [PubMed] [Google Scholar]
- 35.Rajilic-Stojanovic M, Heilig HG, Tims S, Zoetendal EG, de Vos WM. 2013. Long-term monitoring of the human intestinal microbiota composition. Environ. Microbiol. 15:1146–1159. 10.1111/1462-2920.12023 [DOI] [PubMed] [Google Scholar]
- 36.Duncan SH, Belenguer A, Holtrop G, Johnstone AM, Flint HJ, Lobley GE. 2007. Reduced dietary intake of carbohydrates by obese subjects results in decreased concentrations of butyrate and butyrate-producing bacteria in feces. Appl. Environ. Microbiol. 73:1073–1078. 10.1128/AEM.02340-06 [DOI] [PMC free article] [PubMed] [Google Scholar]
- 37.Russell WR, Gratz SW, Duncan SH, Holtrop G, Ince J, Scobbie L, Duncan G, Johnstone AM, Lobley GE, Wallace RJ, Duthie GG, Flint HJ. 2011. High-protein, reduced-carbohydrate weight-loss diets promote metabolite profiles likely to be detrimental to colonic health. Am. J. Clin. Nutr. 93:1062–1072. 10.3945/ajcn.110.002188 [DOI] [PubMed] [Google Scholar]
- 38.Faith J, Guruge J, Charbonneau M, Subramanian S, Seedorf H, Goodman A, Clemente J, Knight R, Heath A, Leibel R, Rosenbaum M, Gordon J. 2013. The long-term stability of the human gut microbiota. Science 341:1237439. 10.1126/science.1237439 [DOI] [PMC free article] [PubMed] [Google Scholar]
- 39.Martínez I, Muller C, Walter J. 2013. Long-term temporal analysis of the human fecal microbiota revealed a stable core of dominant bacterial species. PLoS One 8:e69621. 10.1371/journal.pone.0069621 [DOI] [PMC free article] [PubMed] [Google Scholar]
- 40.Kim M, Hwang S, Park E, Bae J. 2013. Strict vegetarian diet improves the risk factors associated with metabolic diseases by modulating gut microbiota and reducing intestinal inflammation. Environ. Microbiol. Rep. 5:765–775. 10.1111/1758-2229.12079 [DOI] [PubMed] [Google Scholar]
- 41.Prospective Studies Collaboration. Lewington S, Whitlock G, Clarke R, Sherliker P, Emberson J, Halsey J, Qizilbash N, Peto R, Collins R. 2007. Blood cholesterol and vascular mortality by age, sex, and blood pressure: a meta-analysis of individual data from 61 prospective studies with 55,000 vascular deaths. Lancet 370:1829–1839. 10.1016/S0140-6736(07)61778-4 [DOI] [PubMed] [Google Scholar]
- 42.Wikoff W, Anfora A, Liu J, Schultz P, Lesley S, Peters E, Siuzdak G. 2009. Metabolomics analysis reveals large effects of gut microflora on mammalian blood metabolites. Proc. Natl. Acad. Sci. U. S. A. 106:3698–3703. 10.1073/pnas.0812874106 [DOI] [PMC free article] [PubMed] [Google Scholar]
- 43.Velagapudi V, Hezaveh R, Reigstad C, Gopalacharyulu P, Yetukuri L, Islam S, Felin J, Perkins R, Borén J, Oresic M, Bäckhed F. 2010. The gut microbiota modulates host energy and lipid metabolism in mice. J. Lipid Res. 51:1101–1112. 10.1194/jlr.M002774 [DOI] [PMC free article] [PubMed] [Google Scholar]
- 44.Rabot S, Membrez M, Bruneau A, Gérard P, Harach T, Moser M, Raymond F, Mansourian R, Chou C. 2010. Germ-free C57BL/6J mice are resistant to high-fat-diet-induced insulin resistance and have altered cholesterol metabolism. FASEB J. 24:4948–4959. 10.1096/fj.10-164921 [DOI] [PubMed] [Google Scholar]
- 45.Santacruz A, Collado M, García-Valdés L, Segura M, Martín-Lagos J, Anjos T, Martí-Romero M, Lopez R, Florido J, Campoy C, Sanz Y. 2010. Gut microbiota composition is associated with body weight, weight gain and biochemical parameters in pregnant women. Br. J. Nutr. 104:83–92. 10.1017/S0007114510000176 [DOI] [PubMed] [Google Scholar]
Associated Data
This section collects any data citations, data availability statements, or supplementary materials included in this article.