Abstract
Studying connectivities among functional brain regions and the functional dynamics on brain networks has drawn increasing interest. A fundamental issue that affects functional connectivity and dynamics studies is how to determine the best possible functional brain regions or ROIs (regions of interest) for a group of individuals, since the connectivity measurements are heavily dependent on ROI locations. Essentially, identification of accurate, reliable and consistent corresponding ROIs is challenging due to the unclear boundaries between brain regions, variability across individuals, and nonlinearity of the ROIs. In response to these challenges, this paper presents a novel methodology to computationally optimize ROIs locations derived from task-based fMRI data for individuals so that the optimized ROIs are more consistent, reproducible and predictable across brains. Our computational strategy is to formulate the individual ROI location optimization as a group variance minimization problem, in which group-wise consistencies in functional/structural connectivity patterns and anatomic profiles are defined as optimization constraints. Our experimental results from multimodal fMRI and DTI data show that the optimized ROIs have significantly improved consistency in structural and functional profiles across individuals. These improved functional ROIs with better consistency could contribute to further study of functional interaction and dynamics in the human brain.
Keywords: ROI optimization, structural connectivity, functional connectivity
1. Introduction
The human brain’s function is segregated into distinct regions and integrated via structural and functional connectivities (Sporns et al., 2005; Friston 2009; Biswal 2010; Van Dijk et al., 2010; Hagmann et al., 2010). Studying connectivity among these regions and modeling their functional interactions and dynamics has drawn increasing interest and effort from the neuroimaging and neuroscience communities (Friston et al., 2003; Sporns et al., 2005; Biswal 2010; Van Dijk et al., 2010; Lynall et al., 2010; Kennedy, 2010; Hagmann et al., 2010). For example, a variety of computational models such as DCM (dynamic causal modeling), GCM (Granger causality modeling) and MVA (multivariate autoregressive modeling) have been proposed (Friston et al., 2003; Goebel et al., 2003; Harrison et al., 2003) to describe the functional interactions among brain regions, or regions of interests (ROIs). When modeling brain connectivity and functional interactions, network node ROIs provide the structural substrates for extracting fMRI signals, and thus the identification of reliable, reproducible, accurate and consistent functional ROIs is critically important for the success of network construction and connectivity analysis (Bullmore et al., 2009; Poldrack 2011). This fundamental problem of how to determine the best possible ROIs (regions of interests) across a group of individuals, widely-recognized as the problem of “blobology” (Poldrack 2011), has been a longstanding challenge that affects numerous neuroimaging analyses for years. From our perspective (Liu, 2011), the major challenges come from uncertainties in ROI boundary definition (Cabeza et al., 2001), the remarkable structural and functional variability across individuals (Van Essen et al., 2007), and high nonlinearities within and around ROIs (Li et al., 2010a). For instance, a minor change to the ROI location or size would significantly alter its structural and functional connectivity patterns (Li et al., 2010a; Liu, 2011).
Currently, there are four broad categories of approaches for ROI identification (Liu, 2011), and each has its own merits. The first approach is manual labeling of structural images by experts (Biswal et al., 2010; Sobel et al., 1993). This approach makes full use of the experts’ abilities, but it is difficult to perform on large datasets and might be vulnerable to inter-subject variability. The second is a data-driven clustering of ROIs from the brain image itself. For instance, the ReHo (regional homogeneity) algorithm (Zang et al., 2004) has been used to identify regional homogeneous regions as ROIs from resting state fMRI data. Another example is the ICA-based methods for ROI identification (Calhoun et al., 2004). This approach is purely data-driven and thus not biased, but in some situations they may have difficulty in building correspondences among those data-driven clustering centers across individuals. Other data-driven methods for ROI identification include cortical parcellation approaches by using morphological (e.g., Mangin et al., 1995; Li et al., 2009), connectional (e.g., Behrens et al., 2004; Jbabdi et al., 2009), or functional (e.g., Heuvel et al., 2008; Nelson et al., 2010) features. The third is to predefine ROIs in a template brain image, and warp them to the individual subject space using image registration algorithms (e.g., Jenkinson et al., 2002; Shen and Davatzikos, 2002; Avants et al., 2008; Yap et al., 2009; Yeo et al., 2010). Apparently, ROI correspondence is a built-in feature for this category of image registration. The accuracy of ROIs, however, might be heavily dependent on the warping techniques, the atlas used, and the anatomical variability across subjects (Derrfuss and Mar, 2009). Lastly, ROIs can be defined from the activated regions observed during a task-based fMRI paradigm (e.g., Faraco et al., 2011). This method is widely used in the fMRI community to determine functionally-specialized brain regions (Friston, 2009).
Even identifying ROIs using task-based fMRI, regarded as the standard approach for ROI identification (Friston, 2009), still needs substantial improvements. For instance, it was reported that spatial smoothing, a common preprocessing technique in fMRI analysis to enhance SNR, may introduce artificial localization shifts (up to 12.1 mm for Gaussian kernel volumetric smoothing) (Jo et al., 2008) or generate overly smoothed activation maps that may obscure important details (Ou et al. 2010). For example, as shown in Fig. 1a, the local maximum of a working memory ROI (Faraco et al., 2011) was shifted by 4mm due to the spatial smoothing process. As a consequence, the ROI’s structural connectivity profile (Fig. 1b) was significantly altered. Furthermore, group-based activation maps may show different patterns from an individual’s activation map; Fig. 1c depicts such an example. The top panel is the group activation map from a working memory study (Faraco et al., 2011), while the bottom panel is the activation map of one subject in the study. As we can see from the highlighted boxes, the subject has less activated regions than the group analysis result. In the working memory dataset (Faraco et al., 2011) used in this paper, there were about 16% of subjects that had the above mentioned problem. In conclusion, standard analysis of task-based fMRI paradigm data is inadequate to accurately localize ROIs for individuals.
Figure 1.
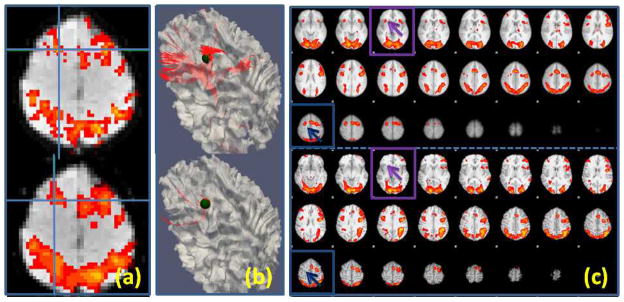
(a): Local activation map maxima (marked by the blue cross) shift of one ROI due to spatial volumetric smoothing. The top one was detected using unsmoothed data while the bottom one used smoothed data (FWHM: 6.875mm). (b): The corresponding fiber tracts (in red) for the ROIs in (a). The ROIs are represented using a sphere (radius: 5mm). (c): Activation map differences between the group (top) and one subject (bottom). The highlighted boxes show two missing activated ROIs for the subject, which were detected from the group analysis.
In this paper, we premise that computational optimization of functional ROIs based on existing fMRI/DTI data can contribute to identification of accurate, reliable and consistent functionally-specialized brain regions. With these optimized functional ROIs, the reliability and robustness of brain connectivity analysis and computational modeling of functional interactions among brain networks could be potentially improved significantly (Bullmore et al., 2009). To this end, this paper proposes a novel computational methodology to optimize the locations of an individual’s ROIs initialized from task-based fMRI with the objective of jointly maximizing the group-wise consistency of functional and structural connectivity patterns and anatomic profiles within a group of subjects. We use the ROIs identified in a block-based working memory paradigm (Faraco et al., 2011) as a test bed application to develop and evaluate our methodology. The optimization of ROI locations is formulated as an energy minimization problem and is solved via the well-established simulated annealing approach (Granville et al., 1994). Our experimental results show that the proposed optimization framework achieved our ROI optimization objective of improving group-wise consistency of the ROIs’ structural and functional connectivity profiles across different brains. Also, our experiments demonstrate that the optimization procedure only optimizes those individual ROIs that are not consistent with the rest of the group, but does not systematically move the fMRI-derived ROIs to different functional regions. This result reveals an important observation: the same corresponding functional ROI identified by fMRI data across different brains has quite consistent structural fiber connection patterns derived from DTI data within the group after optimization, suggesting the close relationship between structural fiber connection pattern and brain function. Our work might stimulate further research into the possibility of learning predictive models of functional ROIs based on consistent DTI-derived fiber shape patterns.
The major contributions of this paper are summarized as follows. First, we proposed a novel computational pipeline that jointly models group-wise anatomic, structural connectivity and functional connectivity profiles as constraints for the purpose of ROI optimization. We designed five experiments to evaluate and validate this computational pipeline and demonstrated that our ROI optimization objective is effectively achieved. Second, our experimental results demonstrate the close relationship between structural fiber connection patterns and brain function, which are defined by DTI tractography and fMRI-derived functionally-specialized regions respectively. This result provides direct support to the “connectional fingerprint” concept proposed in Passingham et al. 2002, which states that each brain’s cytoarchitectonic area has a unique set of extrinsic inputs and outputs and this is crucial in determining the functions that each brain area performs. Third, our ROI optimization framework achieved more consistent functional ROIs across different brains, providing more reliable and accurate structural substrates for brain connectivity analysis and computational modeling of functional interactions in the future. In addition, these consistent functional ROIs offer novel insights into the regularity of brain structure and function, and might stimulate future investigation of structured representation of common brain architecture.
The arrangement for the rest of the paper is as follows. In section 2, we detail the data acquisition and preprocessing of the multimodal data including fMRI and DTI data; then we formulate the energy function for ROI optimization, introduce the anatomical constraint energy, structural connectivity constraint energy and functional connectivity constraint energy respectively, and provide the energy minimization solution. Section 3 presents five carefully designed experiments, the results, and their interpretations. Discussions and conclusion are provided in Section 4.
2. Materials and Methods
2.1 Data acquisition and preprocessing
Twenty-five healthy university students were recruited to participate in this study. Each participant performed an fMRI modified version of a complex working memory span task, the operation span (OSPAN) task (3 block types: OSPAN, Arithmetic, and Baseline) while fMRI data was acquired (Faraco et al., 2011). DTI scans were also acquired for each participant. FMRI and DTI scans were acquired on a 3T GE Signa scanner at The University of Georgia Bioimaging Research Center. Acquisition parameters were as follows: fMRI: 64×64 matrix, 4mm slice thickness, 220mm FOV, 30 slices, TR=1.5s, TE=25ms, ASSET=2; DTI: 128×128 matrix, 2mm slice thickness, 256mm FOV, 60 slices, TR=15100ms, TE= variable, ASSET=2, 3 B0 images, 30 optimized gradient directions, b-value=1000).
To generate the initial functional ROIs, we analyzed fMRI data using FSL’s FEAT (Smith et al., 2004; Woolrich et al., 2009), and adopted group activation map from the OSPAN (OSPAN > Baseline) contrast to obtain activated functional ROIs. In total, we identified 16 consistent ROIs across the twenty five subjects based on the activated peak voxels. These ROIs included bilateral insula, superior frontal gyrus, precentral gyrus, paracingulate gyrus, inferior parietal lobule, and precuneus, and left medial frontal gyrus, right dorsolateral prefrontal cortex, left occipital pole, and right lateral occipital gyrus. Then, for each participant, these ROIs were identified based on the activated peak regions from its OSPAN activation map under the guidance of group-wise activation maps. If certain functional ROI was not detected as activated by FEAT for a subject (see Fig. 1c), this ROI was initialized by registering the group ROI to the individual space via FSL FLIRT (Jenkinson et al., 2002).
Fig. 2 shows an example of the locations of 16 working memory ROIs for an individual; these ROIs are mapped onto the corresponding WM (white matter)/GM (gray matter) cortical surface reconstructed from DTI data via the approaches in Li et al., (2010b). The fiber tracts and WM/GM cortical surface were obtained from DTI data as follows. DTI data was pre-processed by brain extracting, motion correcting, and eddy current correction. Then deterministic tractography was performed using MEDINRIA (Fillard and Gerig, 2003; Fillard et al. 2007) with FA (fractional anisotropy) threshold of 0.2, smoothness of 20 and minimum fiber length of 20. When necessary, fibers were extended along their tangent directions to reach into the gray matter via the approaches in Li et al. 2010b. Brain tissue segmentation was also conducted on DTI data by the method in Liu et al., 2007 and the cortical surface was reconstructed from the tissue maps using the marching cubes algorithm (Lorensen and Cline, 1987). The cortical surface was then parcellated into anatomical regions using the HAMMER tool (Shen and Davatzikos 2002).
Figure 2.
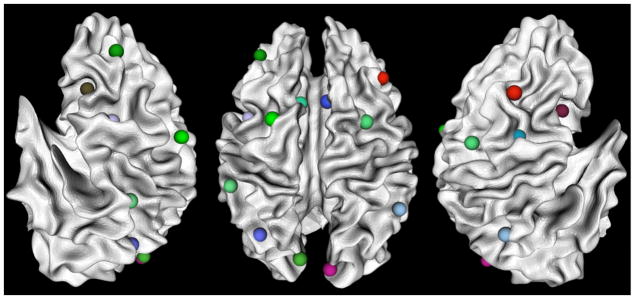
OSPAN working memory ROIs mapped onto a WM/GM surface. From left to right are left lateral view, dorsal view and right lateral view respectively. The images are in radiological convention.
In this paper, the DTI image space, instead of T1-weighted structural MRI image, was used as the standard space from which to generate the GM (gray matter) segmentation and from which to report the functional ROI locations on the cortical surface. Since the fMRI and DTI sequences are both EPI (echo planar imaging) sequences, the geometric distortions tend to be similar and the misalignment between DTI and fMRI images is much less than that between T1 and fMRI images, as demonstrated in Fig. 3. Co-registration between DTI and fMRI data was performed using the FSL FLIRT (Jenkinson et al. 2002).
Figure 3.
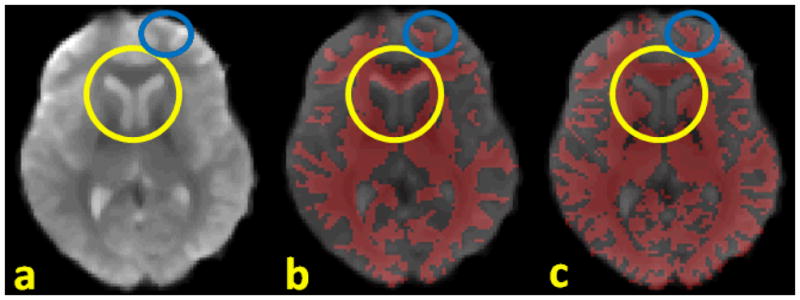
Comparison of misalignments between different modalities. (a): fMRI data; (b): fMRI overlapped by WM segmentation from T1 data; (c): fMRI overlapped by WM segmentation from DTI data; the yellow circles and blue circles highlight the severe misalignment of T1 segmentation to fMRI versus that of DTI segmentation.
FMRI BOLD signals and the activated ROIs were then mapped onto the cortical surface. We do so because the main generators of electrical brain activity captured by fMRI signal are known to be the pyramidal neurons of layer IV (Grova et al., 2006). Therefore, the cortical surface-based mapping of fMRI BOLD signals should be a faithful representation of functional activity in the brain (Li et al., 2010b). Additionally, the complex and variable geometry of the cerebral cortex is well represented by the cortical surface. This mapping facilitates the geodesically grouping of vertices into brain regions and networks, which is more biologically meaningful than that based on Euclidean distance. To conduct the mapping, we adopted GM tissue segmentation maps and fiber tracts as constraints to ensure that vertices of the cortical surface would faithfully represent the BOLD signal from the correct GM voxels. As an illustration, Fig. 4 depicts the process of fMRI signal mapping under the guidance of structural information inferred from DTI-derived fibers and cortical surface. Specifically, first, we ensure that vertices on the cortical surface represent the fMRI BOLD signals extracted from GM voxels. For a cortical surface vertex that has fibers passing through its neighborhood, we extracted the fMRI BOLD signal of the GM voxel where these fibers end (e.g., the GM voxel in red color in Fig. 4a). Since fiber tractography has difficulty in tracking into GM voxels, there might be some fibers that do not end in the GM. For these cases, we extend the fibers slightly along their orientations to the GM, as illustrated in our recent work in Zhang et al., 2010. For a cortical surface vertex that has no neighboring fibers, we used its normal direction on the surface to find the GM correspondence, as illustrated by the green GM voxel in Fig. 4a. Second, the fMRI BOLD signals are geodetically smoothed (Gaussian kernel; sigma: 4mm) around the cortical surface to enhance the signal-to-noise ratio (SNR). This step uses a geodesic neighborhood rather than a Euclidian one, which should make smoothing more appropriate.
Figure 4.
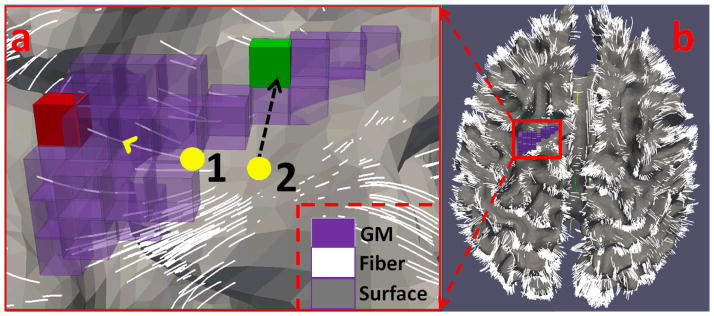
Illustration of BOLD signal mapping for two cortical vertices (yellow bubbles) that are not in the GM (in purple). In Fig. 4(a), vertex 1 uses fiber guidance to find the GM voxel target (in red); vertex 2 uses its normal direction to find the GM target (in green). Fig. 4(b) shows the cortical surface overlaid by the fiber tracts.
2.2 Joint representation of anatomical, structural connectivity and functional connectivity profiles
Despite high degree of variability in brain structure and function across subjects, the task-based fMRI data (Faraco et al., 2011) already identified consistently activated functional brain regions in the working memory network (e.g., Fig. 2). Also, there are several other aspects of regularity on which we base the proposed approach of joint representation of brain structure and function. First, across subjects, the functional ROIs have similar anatomical locations, e.g., similar locations in the atlas space. Second, the corresponding functional ROIs possess similar structural connectivity profiles across subjects. In other words, fibers penetrating the same functional ROIs have at least similar target regions across subjects. Last, individual functional networks identified by task-based paradigms, like the working memory network we adapted as a test bed in this paper, have similar functional connectivity pattern across subjects. Therefore, a joint representation of anatomical, structural connectivity and functional connectivity profiles would have the benefit of capturing rich, complementary attributes of the same functional ROI simultaneously, thus facilitating the optimization of ROIs towards a more consistent and reliable location.
The neuroscience bases of the above premises include: 1) structural and functional brain connectivity are closely related (Passingham et al., 2002; Honey et al., 2009), and cortical folding and axongenesis processes are closely coupled (Van Essen 1997). Hence, it is reasonable to assume that there is complementary information within anatomical, connectional and functional profiles of each ROI and to put these three types of complementary information in a joint representation framework; 2) Extensive studies have already demonstrated the existence of a common structural and functional architecture of the human brain (Fox and Raichle, 2007; Van Dijk et al., 2010), and it makes sense to assume that the working memory network has similar structural and functional connectivity patterns across individuals; 3) Our experiments using resting state fMRI demonstrated that the functional networks have strong structural connections (Li et al., 2010b), which gives further precedence to jointly modeling functional profiles and structural profiles. As an example shown in Fig. 5a, the diagonal elements have the highest intensities (0.59±0.09) amongst each row. This means most of the functional networks have very strong structural connections within themselves. In Fig. 5b, we show an example of one functional network (motor network) and the DTI-derived fibers connecting this network. As we can see, the functional motor network has strong structural connections. This observation suggests the consistency between functional and structural connectivity of the cerebral cortex.
Figure 5.
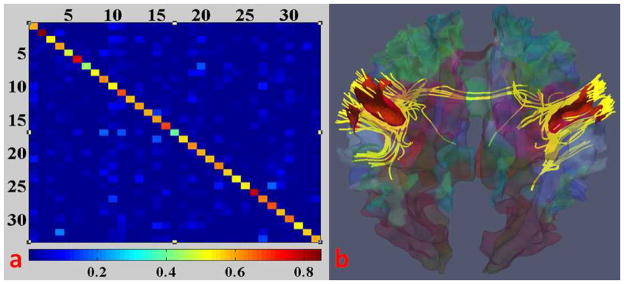
(a) Structural connection matrix of resting state functional networks (34 networks in all) from a subject; bottom: color bar, red means high self-structural connection. (b) The fibers (in yellow) connecting the motor network (in red) of the subject.
Based on the above premises, we propose to optimize the locations of individual functional ROIs by jointly modeling the anatomic profiles, structural connectivity patterns, and functional connectivity patterns as illustrated in Fig. 6. The goal is to minimize the group-wise variance, or maximize group-wise consistency, of these jointly modeled profiles so that the optimized individual ROIs have consistent anatomical, structural and functional profile across the group. Mathematically, we modeled the group-wise variance of a brain network as energy E as follows. A volumetric ROI from the fMRI statistical activation analysis result is mapped onto the cortical surface (Li et al., 2010b), and is represented by a center vertex of the surface and its neighborhood. Suppose Rij is the ROI j on the cortical surface of subject i; we find a corresponding surface ROI region Sij so that the energy E is minimized:
| (1) |
where Eaij, Ecij and Efij are the anatomical constraint, the structural connectivity constraint, and the functional connectivity constraint for the jth ROI of subject i respectively; λ is a weighting parameter between 0 and 1, and it is experimentally specified; if not specially designated, n is the number of subjects, and m is the number of ROIs in this paper. The details of these energy terms will be provided in the following sections. Notably, our experiments show that anatomical profiles are more easily influenced by inter-individual variability, in comparison with structural and functional connectivity patterns. Therefore, the implemented anatomical constraint energy Eaij in Eq. (1) is multiplicative, which is designed to provide constraint only to ROIs that are in unreasonable locations. The reasonable range was statistically modeled by the locations of ROIs warped onto the atlas space in Section 2.2.1.
Figure 6.
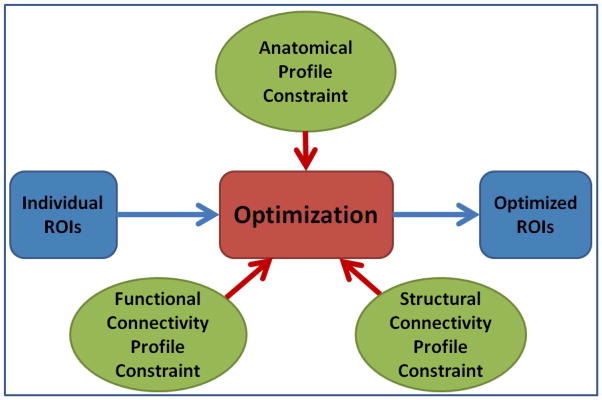
ROI optimization scheme. The inputs are individual ROIs that are either identified by task-based fMRI data or registration of group activated ROIs into individual space. The outputs are optimized individual ROIs that have consistent anatomical, structural and functional profiles across the group.
2.2.1 Anatomical constraint energy
Anatomical constraint energy is defined to ensure that the optimized ROIs have similar anatomical locations within a computationally modeled neighborhood in the atlas space. Without losing generalization, we model the locations of jth ROIs for all subjects in the atlas space using a Gaussian model (mean: MXj, and standard deviation: σXj ). Let Xij be the center coordinate of region Sij in the atlas space, then Eaij is expressed as:
| (2) |
where
| (3) |
||●||, is the length of a vector; i∈[1, n]; j∈[1, m]; and n is the number of subjects, m is the number of functional ROIs. The model parameters MXj and σXj were estimated using the initial center coordinates Xij1 in the atlas space:
| (4) |
| (5) |
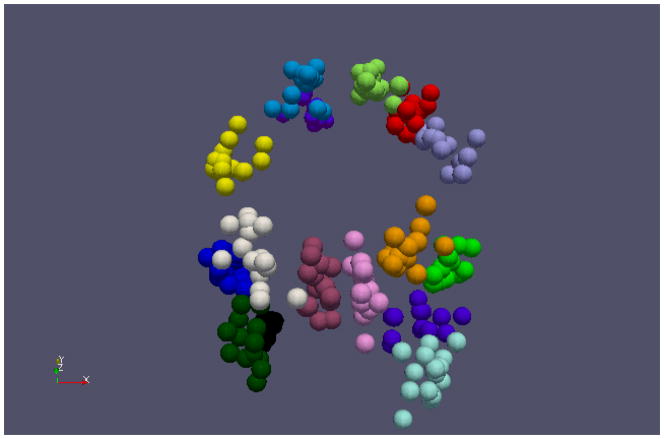
In this paper, a random subject’s MRI image was selected and used as the atlas space, and all others’ MRI images were registered to this atlas image via the HAMMER algorithm (Shen and Davatzikos, 2002). Fig. 7 shows an example of all working memory ROIs for 15 randomly selected subjects in the atlas space. It is evident that these warped ROIs roughly follow a Gaussian-like distribution in the atlas space, which partly supports our models in Eq. (2)–(5). The visualization of the warped ROIs in Fig. 7 also supports our premise that the locations of each ROI should be constrained to be within a neighborhood during the ROI optimization.
Figure 7.
ROI distribution in the atlas space. Each ROI is represented by a sphere and different colors refer to different functional ROIs. 15 out of 25 subjects were random selected and displayed for clarity.
Under the definition in Eq. (2), if Xij is within the range of 3σXj from the distribution model center MXj, the anatomical constraint energy Eaij will be one; otherwise, there will be an exponential increase of the energy which punishes the possible involvement of outliers. In other words, this energy factor Eaij will ensure the optimized jth ROI of subject i will not significantly deviate away from the expected group anatomical location MXj.
2.2.2 Structural connectivity constraint energy
Based on the neuroscience foundation that similar functional regions should possess similar structural fingerprints (Passingham et al., 2002), we premise that the DTI-derived fibers emanating from the same functional ROIs defined by task-based fMRI should have similar connectivity patterns. Thus, one of our primary ROI optimization objectives is to maximize the consistency of group-wise fiber connectivity patterns for the same functional ROI across different brains. To achieve this objective, a structural connectivity constraint energy, represented by Ecij, is defined to ensure that the overall distance between structural connectivity profiles across a group of subjects is minimized after ROI optimization. Specifically, the energy is defined as:
| (6) |
where Cij is the structural connectivity pattern vector for ROI j of subject i, MCj is the group mean for ROI j, and Covc−1 is the inverse of the covariance matrix for the connectivity pattern vector. Intuitively, the energy function in Eq. (6) measures the overall variance of the structural connectivity patterns among all possible ROI pairs within the 16 working memory network. Therefore, minimization of this energy function will achieve the maximal consistency of structural connectivity profiles of the functional ROIs in consideration.
The connectivity pattern vector Cij is a fiber target region distribution histogram. To obtain this histogram, first, we parcellated all the brain surfaces into nine regions including four cortical lobes for each hemisphere and subcortical region (as shown in Fig. 8(a)) using the HAMMER algorithm (Shen and Davatzikos, 2002). A finer parcellation is available but was not used due to the relatively lower parcellation accuracy at the gyral/sulcal scale, which might render the histogram too sensitive to the parcellation result. Then, we extracted fibers penetrating each region Sij, and calculated the distribution of the fibers’ target brain regions that are indexed by the above brain parcellation. Fig. 8 illustrates the definition of structural connectivity pattern. In particular, Fig. 8c shows the structural connectivity pattern vectors of the blue and green ROIs in Fig. 8b, demonstrating that the structural connectivity pattern vector can reasonably represent the structural connection profile.
Figure 8.
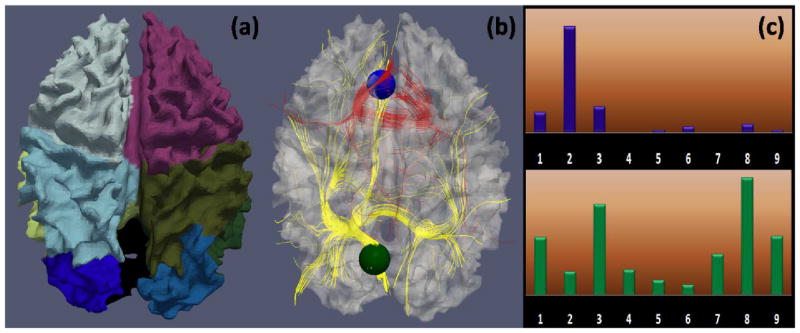
Structural connectivity pattern descriptor. (a): Brain surface parcellation using HAMMER (Shen and Davatzikos 2002); (b): Joint visualization of the cortical surface, two ROIs (blue and green spheres), and fibers penetrating the ROIs (in red and yellow, respectively); (c): Corresponding target region distribution histogram of ROIs in (b). There are nine bins corresponding to the nine brain regions. Each bin contains the number of fibers that penetrate the ROI and are connected to the corresponding brain region. Fiber numbers are normalized across subjects. Under the definition in Eq. (6), the same functional ROIs, e.g., the jth ROIs, will have similar connectivity pattern vector after optimization, which means these ROIs connect to the same corresponding anatomical regions in different brains.
2.2.3 Functional connectivity constraint energy
The characterizing attribute of functional networks is that the brain regions within the network have coherent temporal activities (Fox and Raichle, 2007). Thus, another primary ROI optimization objective in this paper is to maximize the consistency of group-wise functional connectivity patterns for the same functional ROI across different brains. Specifically, a functional connectivity constraint energy, represented by Efij, is defined to ensure that the overall distance between functional connectivity profiles across a group of subjects is minimized after ROI optimization. The functional connectivity constraint energy Efij is defined as follows.
| (7) |
where Pijk is the functional connectivity between the jth and kth ROI of subject i, MPjk and σPjk are the group mean and standard deviation of the functional connectivity between ROI j and k in the dataset respectively; k∈[1, m] and k ≠ j. The functional connectivity between each pair of ROIs is measured by the Pearson correlation between two representative fMRI BOLD signals extracted for a pair of ROIs. The representative fMRI signal was obtained by selecting the first component after applying principal component analysis (PCA) on all signals within an ROI. Intuitively, after optimization, the functional connectivity Pijk tends to be similar, which means that the brain network of the group has similar functional connectivity pattern among the ROIs. This premise is in line with other literature reports of the consistency of functional connectivity within brain networks (Ng et al., 2009; Sabuncu et al., 2010).
2.3 Energy minimization solution
The minimization of the energy defined in Section 2.2 is known as a combinatorial optimization problem. Traditional optimization methods may not fit this type of problem, since it presents two difficulties. First, we do not know how the energy changes with the varying locations of functional ROIs. Therefore, techniques like Newton’s method cannot be used. Second, the structure of search space is not smooth, which may lead to multiple local minima during optimization. To address this problem, we adopted the simulated annealing (SA) algorithm (Granville et al., 1994) for the energy minimization. The idea of the SA algorithm is based on random walk through the space for lower energies. In these random walks, the probability of taking a step is determined by the Boltzmann distribution,
| (8) |
Here, Ei and Ei+1 are the system energies at solution configuration i and i + 1 respectively; K is the Boltzmann constant; and T is the system temperature. In other words, when a lower energy is found, the current solution configuration will be taken since it reduces the gross energy; when a higher energy is found, however, the configuration can also be accepted with certain probability p (0 < p <1). This helps avoid local minima in the search space.
3 Results
We designed five experiments to demonstrate the effectiveness of the proposed framework for functional ROI optimization. Our results show that the working memory ROIs have been significantly improved in terms of the consistency of structural and functional profiles across individuals, and the consistency of morphological and anatomic profiles.
3.1 Optimization using anatomical and structural connectivity profiles
In this section, we used only anatomical and structural connectivity profiles to optimize the locations of ROIs. The goal was to verify whether the structural connectivity constraint energy works as expected. As an example, Fig. 9 shows the fiber bundles emanating from the right precuneus for eight subjects before (top panel) and after optimization (bottom panel). The ROI is highlighted in a red sphere for each subject. As we can see from the figure (please refer to the highlighted yellow arrows), after optimization, the third and sixth subjects had significantly improved ROI locations relative to the rest of the group than before optimization. That is, the fiber bundles of these two subjects after optimization are more consistent with the rest of the group. It should be noted that among the eight subjects, only two subjects have significantly ROI location movements (the third and sixth ones), while other six subjects did not move much. This result suggests that our ROI optimization does not systematically move the functional regions, but only optimize those individual ROIs that are not consistent with the rest of the group. The results in Fig. 9 demonstrate the validity of the energy function in Eq. (6) and our optimization strategy.
Figure 9.
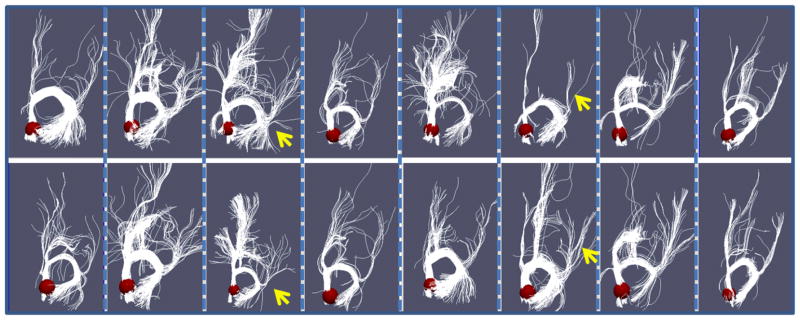
Comparison of structural profiles before and after optimization. Each column shows the corresponding before-optimization (top) and after-optimization (bottom) fibers of one subject. The ROI (right precuneus) is presented by the red sphere.
An important observation from Fig. 9 is that structural connection patterns for the same functional ROI are reasonably consistent across individuals after optimization. As the original ROIs were identified via consistent fMRI-derived activations, we hypothesize that group-wise consistent fiber connection patterns (e.g., Fig. 9) are good predictors of brain function. In the future, we could develop quantitative fiber shape descriptors to computationally model those consistent fiber bundles for the purpose of constructing predictive models of functional ROIs based on DTI data. Once the predictive models are learned in the training stage with both fMRI and DTI data, they can be applied to predict functional ROIs in the absence of fMRI data. These predictive models of functional ROIs can be very useful in many clinical settings, in which fMRI data is difficult to acquire (Jack et al., 2010), but DTI data is relatively easy to obtain.
To have a quantitative description of the optimization performance, we compared the normalized structural connectivity constraint energy before and after optimization, as shown in Fig. 10. The optimization procedure was conducted 15 times with random initial ROI locations. And the gross structural connectivity constraint energy was normalized to range [0, 1] for better visualization. As can be seen from Fig. 10, the structural connectivity constraint energy was consistently reduced to a low level for all the 15 runs, meaning that the structural profiles of the ROIs have similar connectivity patterns with other anatomical brain regions after the optimization. Also, the energy reduction is reproducible across runs, suggesting that our optimization approach is quite reliable. Therefore, the results in Figs. 9–10 demonstrate that our optimization objective is effectively achieved and the optimization procedure indeed improves the consistency of group-wise connection patterns for the corresponding functional ROIs in a group of subjects.
Figure 10.
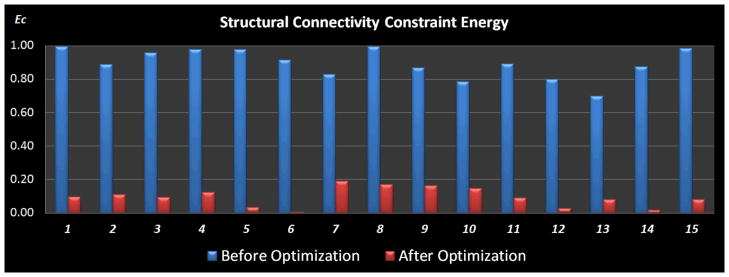
Comparison of the normalized structural connectivity constraint energy between before (blue) and after (red) optimization. The optimization procedure was repeated 15 times, each of which was initialized with random ROI locations. Optimization parameters for simulated annealing algorithm: K = 1,Tstart = 8, and Tend = 0.05.
3.2 Optimization using anatomical and functional connectivity profiles
In this section, we optimized the locations of ROIs using functional connectivity and anatomical profiles, aiming to validate the definition of functional connectivity constraint energy. If this energy constraint works well, the functional connectivity variance within the working memory network across subjects would decrease. Fig. 11 shows the quantitative comparison of the standard deviation of functional connectivity before (left) and after (right) optimization. As we can see, the variance is significantly reduced after optimization. This demonstrated the effectiveness of the defined functional connectivity constraint energy and the optimization procedure.
Figure 11.
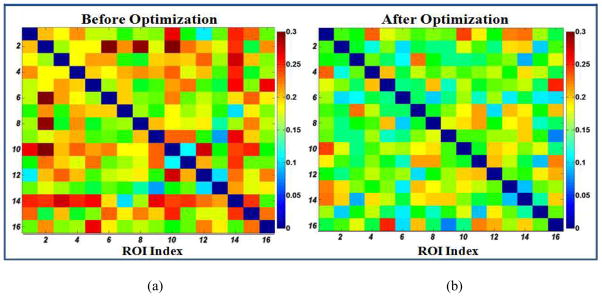
Quantitative comparison of the standard deviation of functional connectivity within the working memory network before (a) and after (b) the optimization. Lower values mean more consistent connectivity pattern cross subjects.
It should be noted that the standard deviations of functional connectivities within the working memory network is quite low after the optimization, e.g., most of the matrix cells in Fig. 11b are below 0.2. This result suggests that the functional connectivities after optimization are reasonably consistent across subjects, partly demonstrating that these optimized functional ROIs are likely to be within the same functional network. This observation is consistent with the reports in the literature (Ng et al., 2009). For instance, it was reported that consistent functional connectivity patterns can be inferred after a procedure of removing outlier ROIs with a functional network via the group replicator dynamics approach (Ng et al., 2009). Therefore, it is reasonable to use consistent functional connectivity patterns across a group of subjects as ROI optimization objective, which is further demonstrated by our quantitative results in Fig. 11.
Again, we compared the functional connectivity constraint energy before and after optimization in order to quantitate the ROI optimization performance in Fig. 12. The optimization procedure was conducted 15 times with random initial ROI locations. And the gross functional connectivity constraint energy was normalized to range [0, 1] for better visualization. As can be seen in Fig. 12, the gross functional connectivity constraint energy consistently decreased and converged to the same level, which means after the optimization the ROIs had similar functional connectivity patterns across the subjects, and the optimized ROI locations remain stable across different runs. This result further demonstrates the effectiveness of our ROI optimization approach.
Figure 12.
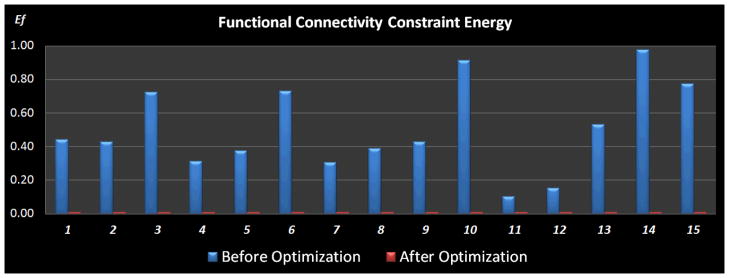
Comparison of the normalized functional connectivity constraint energy between before (blue) and after (red) optimization. The optimization procedure was repeated 15 times, each of which was initialized with random ROI locations. Optimization parameters for simulated annealing algorithm: K = 1, Tstart = 8, and Tend = 0.05.
3.3 Consistency between optimization of functional profiles and structural profiles
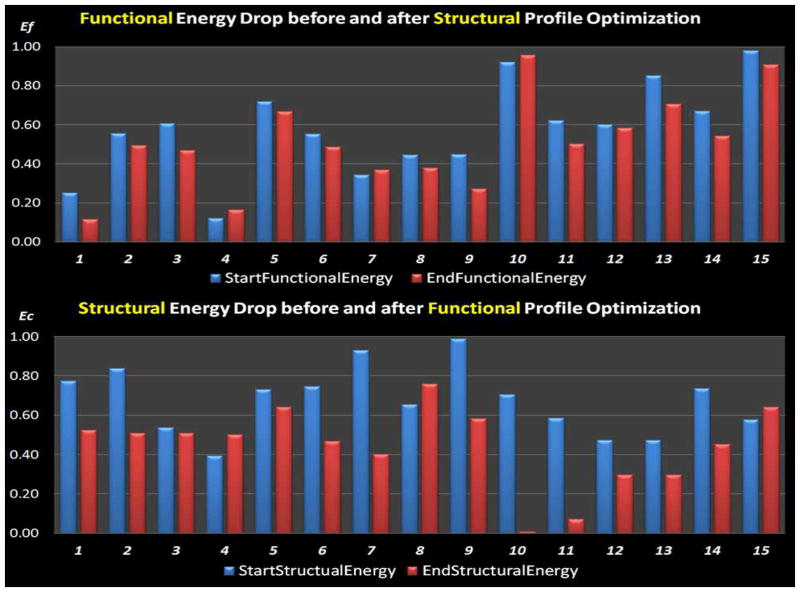
The relationship between brain structure and function has been extensively studied (Honey et al., 2009), and it is widely believed that they are closely related. In this section, we studied the relationship between functional profiles and structural profiles by looking at how a decrease in the energy of one affected the other. Specifically, both of the optimization processes in Section 3.1 and 3.2 were repeated 15 times with random initial ROI locations, and the results are shown in Fig. 13. In general, the functional profile energies and structural profile energies are closely related in such a way that most of the functional profile energies decrease along with the structural profile optimization process (top panel in Fig. 13), and at the same time, a majority of the structural profile energies also decrease as the functional profile is optimized (bottom panel in Fig. 13). This positively correlated decreases of functional profile energy and structural profile energy not only suggest the close relationship between functional and structural profiles, but also demonstrates the consistency between functional connectivity based optimization and structural connectivity based optimization. In particular, this positive correlation independently cross-validates the two ROI optimization approaches based on either functional connectivity or structural connectivity, as they were performed separately in different runs (Fig. 13). Also, the result in Fig. 13 suggests that optimizations based on both functional and structural connectivities will not be in conflict. Instead, they will consistently contribute to moving the functional ROIs towards better locations, which lays down the foundation of the joint optimization of functional and structural connectivities to be detailed in the following section.
Figure 13.
Relationship between ROI optimizations based on either functional connectivity or structural connectivity. Top: Functional profile energy drops along with structural profile optimization; Bottom: Structural profile energy drops along with functional profile optimization. Each experiment was repeated 15 times with random initial ROI locations that met the anatomical constraint.
3.4 Optimization using anatomical, structural and functional connectivity profiles
In this section, we used all of the constraints in Eq. (1) to optimize the individual locations of the 16 working memory ROIs. Ten runs of the optimization were performed using random initial ROI locations that met the anatomical constraint. The weighting parameter λ equaled 0.5 for all these runs. Starting and ending temperatures for the simulated annealing algorithm were 8 and 0.05, respectively; The Boltzmann constant K = 1. The optimization results are shown in Fig. 14. We can see that most runs started to converge at step 24, and the convergence energy was quite close across all runs. This result suggests that our optimization object was effectively achieved and the simulated annealing algorithm provided a valid solution to our optimization problem. Also, the result in Fig. 14 further demonstrates that the three constraints of anatomic, structural and functional connectivity profiles consistently contribute to moving the functional ROIs towards better locations, thus achieving more consistent structural and functional profiles across the group of subjects.
Figure 14.
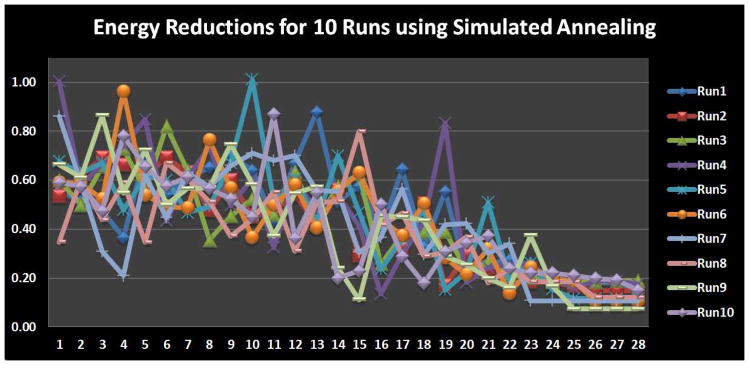
Convergence performance of the simulated annealing. Each run has 28 temperature conditions.
By visual inspection, most of the ROIs moved to more reasonable and consistent locations after the joint optimization. As an example, Fig. 15 depicts the location movements of the right precuneus ROI in Fig. 9 for eight subjects. As we can see, the ROIs for these subjects share a similar anatomical landmark, which appears to be the tip of the upper bank of the parieto-occipital sulcus. If the initial ROI was not at this landmark, it would have moved to the landmark after the optimization, as was the case for subjects 1, 4, and 7. The structural fiber connection profiles of these ROIs are similar to those in Fig. 9. The results in Fig. 15 indicate the substantial improvement of ROI locations, in terms of converging to a common anatomic landmark, achieved by the joint optimization procedure based on anatomical, structural and functional connectivity constraints. Importantly, the results in Fig. 9 and Fig. 15 together demonstrated that our ROI optimization procedure not only improves the consistency of structural fiber connection patterns, but also the consistency of neuroanatomic locations.
Figure 15.
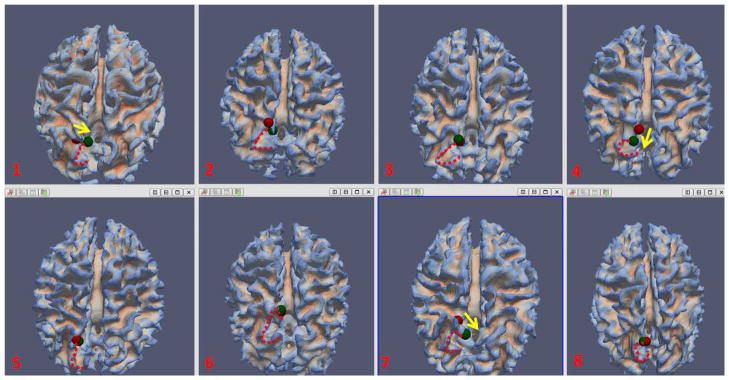
The movement of right precuneus before (in red sphere) and after (in green sphere) optimization for eight subjects. The “C”-shaped red dash curve for each subject depicts a similar anatomical landmark across these subjects. The yellow arrows in subject 1, 4, and 7 visualized the movement direction after optimization.
3.5 Functional validation
In the previous four sections from Section 3.1 to 3.4, we have demonstrated that the optimization pipeline could generate ROIs that have more consistent structural and functional profiles across individuals by optimizing their anatomical locations. A natural question arises: do the optimized ROIs still belong to the original functional network and is there a functional localization improvement obtained by the ROI optimization? To answer this question, we identified the individual functional networks by finding the activation peaks in the individual brains, and considered them as the benchmarks with which to compare the optimized ROIs. As illustrated in Fig. 16, the procedure of identifying benchmark activation peaks is as follows. First, we performed a group-level activation analysis based on all subjects and obtained the group activation map corresponding to the OSPAN working memory stimulus. Then the group-level ROIs were identified by locating the activated peak regions in the group activation map. Afterwards, these ROIs were registered into individual brains to serve as a guide for locating the individualized ROIs. As an example, Fig. 16a shows the group activation map and a group-level ROI (i.e., the blue one highlighted by yellow arrows). In Fig. 16b, this ROI was registered to an individual brain (i.e., the blue one highlighted by yellow arrows). The individualized ROI (i.e., the voxel highlighted by the cross, and the center of the purple circles in Fig. 16c) was visually identified by obtaining the activated peak region around the registered group-level ROI.
Figure 16.
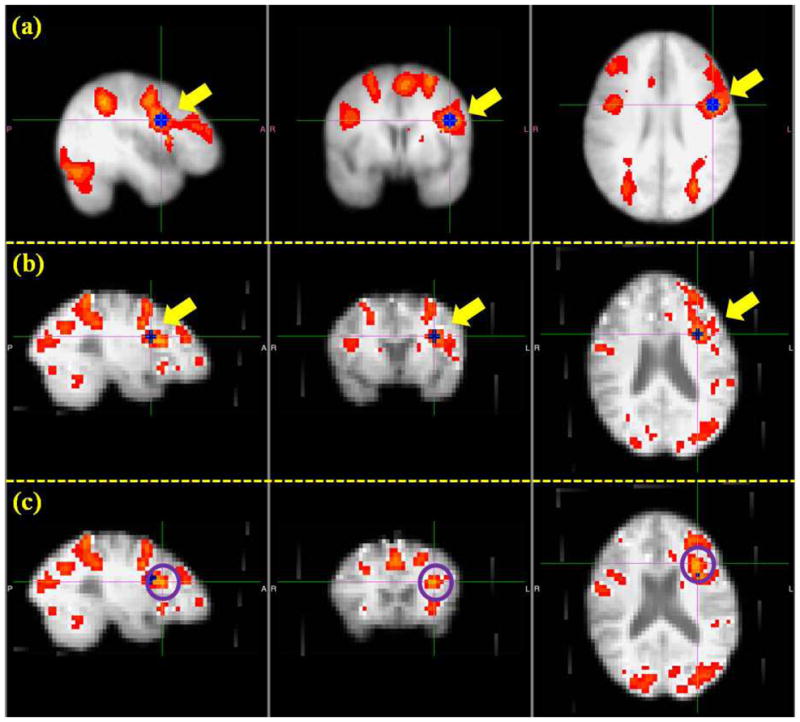
An illustration of the identification of benchmark ROIs. (a): Group activation map and one example of group ROI (the blue one highlighted by yellow arrows). (b): Individual activation map and the registered ROI in the subject space (the blue one highlighted by yellow arrows) from the group template. (c): Identified benchmark ROI (the voxel highlighted by the cross and the center of highlighted circles).
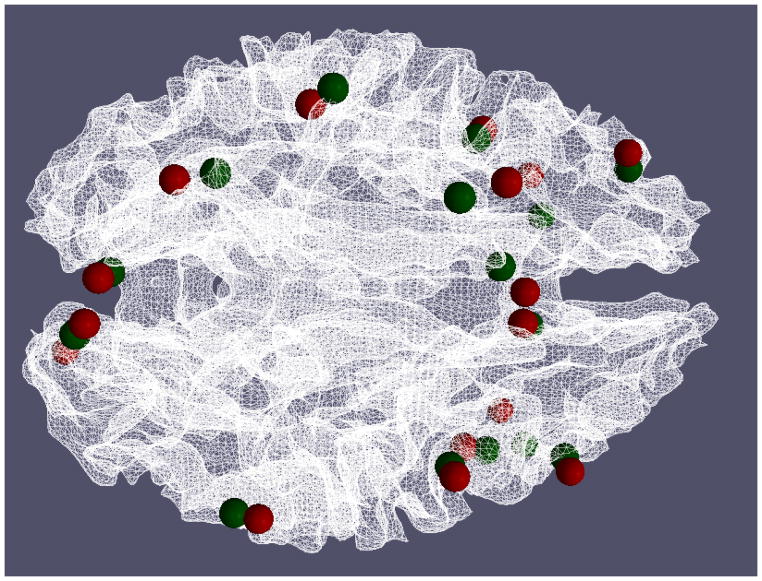
We studied the movements of the optimized ROIs in the previous sections compared with the benchmarks, and found that the Euclidean distance between the optimized ROIs and the benchmark ROIs is averaged at 8.30±0.46mm, which is approximately a 2~3 voxels shift from the activation peak in the fMRI image space. We also visualized the locations of these optimized ROIs and the benchmarks in Fig. 17. As we can see in the figure, the distance between the optimized ROIs (highlighted in green spheres) and the benchmark ROIs (highlighted in red spheres) is relatively small for most of the ROIs. Considering the large activated regions in Fig. 16, this result in Fig. 17 suggests that the optimized ROIs still belong to the same functional regions. As a further quantitative study, we compared the z-values of the optimized ROIs with those of the benchmark ROIs in Fig. 18. The average z-value for an ROI’s 3*3*3 voxel neighborhood is measured in order to make a fair comparison between the benchmark ROIs and the optimized ROIs. As we can see from the comparison in Fig. 18, our optimized ROIs have comparable z-values with the benchmark ROIs’ z-values, which further demonstrates that the optimization pipeline does not move the ROIs out of the original functional regions. Interestingly, the averaged z-value of optimized ROIs (3.38) are even slightly higher than the averaged one of the original benchmark ROIs (3.05) by around 10.8%, suggesting that our ROI optimization can improve the functional localizations of the fMRI-derived ROIs.
Figure 17.
Visualization of optimized ROIs (green spheres) and benchmark ROIs (green spheres). The average distance between optimized ROIs and the benchmarks is 8.30±0.46mm. The average distances for each ROI across 15 runs are 8.31mm, 8.75mm, 7.83mm, 8.18mm, 8.50mm, 8.67mm, 7.77mm, 7.55mm, 8.08mm, 9.40mm, 8.45mm, 8.42mm, 8.00mm, 8.70mm, 8.39mm, and 7.89mm respectively.
Figure 18.
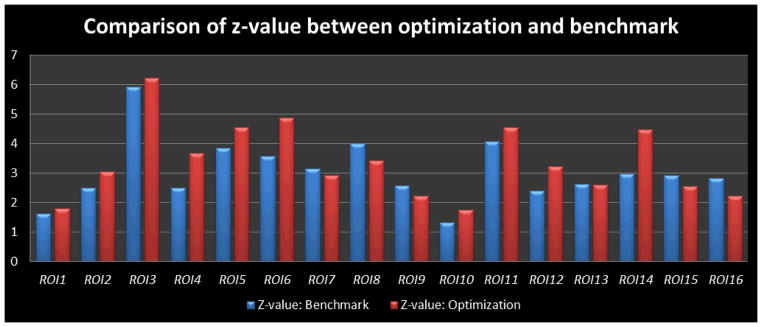
Z-values of the 16 optimized ROIs (red ones) compared with those of the 16 benchmark ROIs (blue ones). For the ROI in consideration, a 3*3*3 neighbourhood of the activated peak voxel was used to generate the z-values, and only gray matter voxels were taken into consideration to obtain the mean z-values. The average z-vlaue for the benchmark ROIs is 3.05, and the average z-value for the optimizized ROIs is 3.38.
3.6 Reproducibility
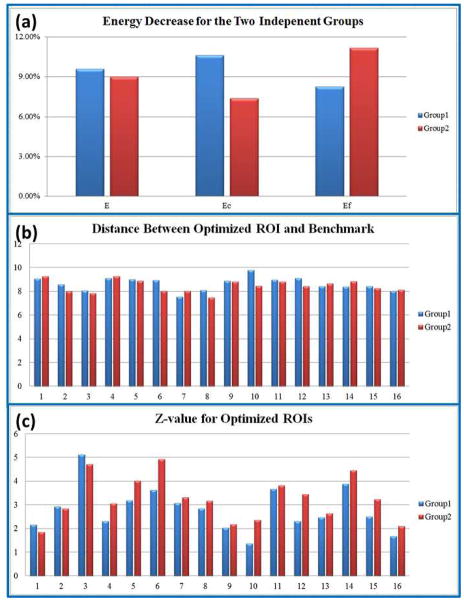
In order to evaluate the reproducibility of the proposed computational framework, we randomly separated the dataset in section 2.1 into two independent groups, each of which consists of nine subjects. We applied the method on both groups using the same parameters as those in Section 3.4, and compared the optimization performance in Figure 19. As we can see from Figure 19(a), the two groups have similar optimization performances in terms of increased group-wise consistency of anatomical, structural and functional profiles. The overall energy E in Eq. (1) decreased about 9% for both groups. Specifically, group one has more structural energy decrease than functional energy, while group two has less structural energy decrease than functional energy, suggesting the initial configuration of group one has better group-wise consistency in functional connectivity than group two, and the latter has better initial group-wise consistency in structural connectivity than the former. We also compared the distances between optimized ROIs and the benchmark in Figure 19 (b), and z-values of optimized ROIs in Figure 19(c). The two groups have similar performances as in Section 3.5 (group one distance: 8.65±0.56 mm, and group two distance: 8.45±0.51 mm). Z-values of the optimized ROIs for two groups are also comparable to the benchmark in Figure 18. The average z-values for both groups are 2.82 and 3.25 respectively, suggesting that the optimized ROIs still belong to original functional regions while obtaining increased group-wise consistency in structural and functional profiles. These results indicate that the proposed computational framework is reproducible on the independent groups.
Figure 19.
Reproducibility study using two independent groups. (a) Decreases of energy E, Ec and Ef after optimization. (b) Distance between optimized ROIs and the benchmarks. (c) Z-values for the 16 optimized ROIs.
4. Conclusion
This paper presented a novel computational approach to optimizing the locations of 16 ROIs identified from working memory task-based fMRI data by maximizing the group-wise consistency of structural and functional connectivity patterns and anatomical locations. The structural and functional profiles of ROIs are jointly represented and modeled in the DTI image space. The ROI optimization problem is formulated by an energy function, which is then minimized by the simulated annealing optimization algorithm. Experimental results demonstrated the optimized ROIs have more reasonable localizations after optimization, as demonstrated by the improved consistency of their structural and functional connectivity profiles and morphological and anatomic profiles across subjects. It has been demonstrated that the ROI optimization procedure only moves those ROIs that are not consistent with the rest of the group to better locations, instead of systematically re-locating the functional ROIs. These optimized ROIs with improved group-wise consistency and correspondence will provide more accurate structural substrates for future modeling of functional connectivity and interactions among brain networks via fMRI data across individuals and populations.
An interesting observation that can be made from our results in Fig. 9 and other sections is that specific white matter fiber connection patterns can be good predictor of functional brain regions. That is, the white matter fiber connection patterns for the same functional region in different brains are quite consistent, suggesting their predictive relationship. This is in agreement with the “connectional fingerprint” concept presented in Passingham et al., 2002. That is, each brain’s cytoarchitectonic area has a unique set of extrinsic structural connectivity patterns, called the “connectional fingerprint” (Passingham et al., 2002), and this is crucial in determining the functions of a brain region. The predictive relationship between structural connectivity patterns and brain function indicates that it could be possible to predict functional brain regions via consistent structural connectivity patterns in the future. This capability could enable many applications in which no task-based fMRI data is available. For instance, multimodal DTI and resting state fMRI data is widely available, but it is more challenging to acquire task-based fMRI data for functional localization (i.e. it is impractical for children or elder patients to perform extensive tasks during neuroimaging scans). In these situations, prediction of functional ROIs based on widely available DTI data can be an effective solution to accurately localizing functional brain regions.
In the computational framework, three criteria (i.e., group-wise consistency in anatomical, structural and functional profiles) were adopted as ROI optimization constraints. These criteria play different roles in the optimization process. Specifically, the anatomical constraint optimized the ROI locations at the coarse level. It ensures that the ROIs do not deviate away from reasonable cortical regions during optimization. At the fine level, structural and functional connectivity profiles are the constraints that drive the ROIs to accurate, reliable and consistent functional localizations for individuals. As mentioned in the above paragraph and demonstrated in the result sections, structural connectivity patterns and the brain’s functions are closely related. Therefore, there seems to exist some redundancy in Eq. (1) by integrating both structural connectivity profile and functional connectivity profile into the energy function. However, in real situations, these two items usually reveal complementary information on characteristics of functional ROIs due to factors like inadequate imaging resolution. Thus, it is highly recommended to keep both items in the energy function when both DTI and fMRI data are available, and to change the weighting parameter λ accordingly based on the data qualities.
The calculation of structural connectivity pattern was based on fibers tracts, which were tracked via MedINRIA (version 1.90; Fillard et al., 2007). One particular issue about fiber tracking in MedINRIA is that it effectively estimates the Rician noise in DWI images via a MAP model, which regularizes the tensor at the same time (Fillard et al., 2007). This model results in smooth tensor field, thus leading to more regular and longer fibers. The default tracking parameters in MedINRIA (FA threshold: 0.3, maximum angle of deviation: 90°) will generate reasonable and satisfactory fibers. It needs to note that using smaller angle of deviation threshold in fiber tracking may segment a long fiber into pieces, which cannot represent the structural connectivity profile of a functional region. Under such conditions, the optimization framework may have difficulty in identifying individual ROIs, especially when λ is large.
The energy minimization is a combinational optimization problem, and we adopted the well-established simulated annealing (SA) algorithm (Granville et al., 1994) as the solution. Although it well fits our optimization scenario, an open problem, however, is to determine the optimal parameters for this algorithm. Usually, it may take several tries before one finds appropriate parameters. In this paper, the starting and ending temperatures for simulated annealing were 8 and 0.05, and the temperature decrease factor was 1.2. Once the parameters are determined, the computational cost of the optimization process is moderate. On a laptop with Intel Core i5 2.6G CPU, the optimization with 9 subjects and 16 ROIs takes about 30 minutes. Thus, it is feasible to apply the proposed computational framework on other brain networks of similar sizes. However, it may take considerably longer time for much larger brain networks, e.g., whole brain network with hundreds of ROIs.
In this paper, the ROIs were defined as spheres with fixed size. Our future work will extend this ROI optimization framework to optimize other parameters such as ROI size and ROI shape to achieve better accuracy. Currently, we used the working memory network defined from OSPAN task-based fMRI data. In the future, we plan to evaluate our ROI optimization methodology by using more functional ROIs identified in other brain systems such as the visual, auditory, language, attention, and emotion networks. This extension will entail the availability of multimodal DTI and fMRI datasets of these brain networks. Finally, we plan to apply our methodology to clinical datasets in order to optimize functional ROI locations and elucidate the possible alterations in structural and functional connectivities in brain diseases such as Alzheimer’s disease.
Acknowledgments
K Li was supported by the NWPU Foundation for Fundamental Research. T Liu was supported by the NIH Career Award EB 006878, NIH R01 HL087923-03S2, and The University of Georgia start-up research funding. We would like to thank the anonymous reviewers whose comments helped to significantly improve this paper.
Footnotes
Information Sharing Statement
Source codes of the proposed computational algorithms and methods are available at: http://www.cs.uga.edu/~tliu/neuroinformatics/neuroinformatics_jointmodeling.htm.
References
- Avants BB, Epstein CL, Grossman M, Gee JC. Symmetric diffeomorphic image registration with cross-correlation: Evaluating automated labeling of elderly and neurodegenerative brain. Med Image Anal. 2008;12:26–41. doi: 10.1016/j.media.2007.06.004. [DOI] [PMC free article] [PubMed] [Google Scholar]
- Biswal Bharat B. Toward discovery science of human brain function. PNAS. 2010 Mar 9;107(10):4734–4739. doi: 10.1073/pnas.0911855107. [DOI] [PMC free article] [PubMed] [Google Scholar]
- Bullmore E, Sporns O. Complex brain networks: graph theoretical analysis of structural and functional systems. Nat Rev Neurosci. 2009;186(10) doi: 10.1038/nrn2575. [DOI] [PubMed] [Google Scholar]
- Cabeza R, Kingstone A. Handbook of Functional Neuroimaging of Cognition. 2 [Google Scholar]
- Calhoun VD, Pekar JJ, Pearlson GD. Alcohol intoxication effects on simulated driving: Exploring alcohol-dose effects on brain activation using functional MRI. Neuropsychopharmacology. 2004;29:2097–3017. doi: 10.1038/sj.npp.1300543. [DOI] [PubMed] [Google Scholar]
- Jan Derrfuss, Mar Raymond A. Lost in localization: the need for a universal coordinate database. NeuroImage. 2009;48(1):1–7. doi: 10.1016/j.neuroimage.2009.01.053. [DOI] [PubMed] [Google Scholar]
- Grova C, Makni S, Flandin G, Ciuciu P, Gotmana J, Poline JB. Anatomically informed interpolation of fMRI data on the cortical surface. NeuroImage. 2006;31(4):1475–86. doi: 10.1016/j.neuroimage.2006.02.049. [DOI] [PubMed] [Google Scholar]
- Faraco Carlos Cesar, Unsworth Nash, Langley Jason, Terryb Doug, Li Kaiming, Zhang Degang, Liu Tianming, Stephen Miller L. Complex span tasks and hippocampal recruitment during working memory. NeuroImage. 2011;55(2):773–787. doi: 10.1016/j.neuroimage.2010.12.033. [DOI] [PubMed] [Google Scholar]
- Friston KJ, Harrison L, Penny W. Dynamic causal modeling. Neuroimage. 2003;19:1273–1302. doi: 10.1016/s1053-8119(03)00202-7. [DOI] [PubMed] [Google Scholar]
- Friston K. Modalities, modes, and models in functional neuroimaging. Science. 2009;326(5951):399–403. doi: 10.1126/science.1174521. [DOI] [PubMed] [Google Scholar]
- Fox MD, Raichle ME. Spontaneous fluctuations in brain activity observed with functional magnetic resonance imaging. Nat Rev Neurosci. 2007;8:700–711. doi: 10.1038/nrn2201. [DOI] [PubMed] [Google Scholar]
- Goebel R, Roebroeck A, Kim DS, Formisano E. Investigating directed cortical interactions in time-resolved fMRI data using vector autoregressive modeling and Granger causality mapping. Magnetic Resonance Imaging. 2003;21(10):1251–1261. doi: 10.1016/j.mri.2003.08.026. [DOI] [PubMed] [Google Scholar]
- Granville V, Krivanek M, Rasson JP. Simulated annealing: A proof of convergence. IEEE Transactions on PAMI. 1994;16 (6):652–656. [Google Scholar]
- Hagmann P, Cammoun L, Gigandet X, Gerhard S, Ellen Grant P, Wedeen V, Meuli R, Thiran JP, Honey CJ, Sporns O. MR connectomics: Principles and challenges. J Neurosci Methods. 2010 doi: 10.1016/j.jneumeth.2010.01.014. [DOI] [PubMed] [Google Scholar]
- Harrison L, Penny WD, Friston K. Multivariate autoregressive modeling of fMRI time series. NeuroImage. 2003;19(4):1477–1491. doi: 10.1016/s1053-8119(03)00160-5. [DOI] [PubMed] [Google Scholar]
- van den Heuvel Martijn, Mandl Rene, Hilleke Hulshoff Pol. Normalized cut group clustering of resting-state fMRI data. PLoS One. 2008;3(4):e2001. doi: 10.1371/journal.pone.0002001. [DOI] [PMC free article] [PubMed] [Google Scholar]
- Behrens Johansen-Berg H, Robson TEJ, Drobnjak MD, Rushworth I, Brady MFS, Smith JM, Higham SM, Matthews DJ. Changes in connectivity profiles define functionally distinct regions in human medial frontal cortex. Proc Natl Acad Sci USA. 2004;101:13335–13340. doi: 10.1073/pnas.0403743101. [DOI] [PMC free article] [PubMed] [Google Scholar]
- Honey CJ, Sporns O, Cammoun L, Gigandet X, Thiran JP, Meuli R, Hagmann P. Predicting human resting-state functional connectivity from structural connectivity. PNAS. 2009;106(6):2035–40. doi: 10.1073/pnas.0811168106. [DOI] [PMC free article] [PubMed] [Google Scholar]
- Jack CR, Jr, Bernstein MA, Borowski BJ, Gunter JL, Fox NC, Thompson PM, Schuff N, Krueger G, Killiany RJ, Decarli CS, Dale AM, Carmichael OW, Tosun D, Weiner MW. Update on the magnetic resonance imaging core of the Alzheimer’s disease neuroimaging initiative. Alzheimers Dement. 2010;6(3):212–20. doi: 10.1016/j.jalz.2010.03.004. [DOI] [PMC free article] [PubMed] [Google Scholar]
- Jbabdi S, Woolrich MW, Behrens TEJ. Multiple-subjects connectivity-based parcellation using hierarchical Dirichlet process mixture models. NeuroImage. 2009;44:373–384. doi: 10.1016/j.neuroimage.2008.08.044. [DOI] [PubMed] [Google Scholar]
- Jenkinson M, Bannister P, Brady M, Smith S. Improved optimization for the robust and accurate linear registration and motion correction of brain images. Neuroimage. 2002;17:825–841. doi: 10.1016/s1053-8119(02)91132-8. [DOI] [PubMed] [Google Scholar]
- Kennedy David N. Making Connections in the Connectome Era. Neuroinformatics. 2010;8(2):61–62. doi: 10.1007/s12021-010-9070-1. [DOI] [PubMed] [Google Scholar]
- Li Gang, Guo Lei, Nie Jingxin, Tianming Liu. Automatic cortical sulcal parcellation based on surface principal direction flow field tracking. NeuroImage. 2009;46(4):923–37. doi: 10.1016/j.neuroimage.2009.03.039. [DOI] [PMC free article] [PubMed] [Google Scholar]
- Li Kaiming, Guo Lei, Faraco Carlos, Zhu Dajiang, Deng Fan, Zhang Tuo, Jiang Xi, Zhang Degang, Chen Hanbo, Hu Xintao, Stephen Miller L, Liu Tianming. Individualized ROI Optimization via Maximization of Group-wise Consistency of Structural and Functional Profiles. Adv Neural Info Proc Syst. 2010;23 (Proceedings of NIPS ‘10) [Google Scholar]
- Li K, Guo L, Li G, Nie J, Faraco C, Zhao Q, Miller S, Liu T. Cortical surface based identification of brain networks using high spatial resolution resting state fMRI data. International Symposium of Biomedical Imaging (ISBI); 2010. [DOI] [Google Scholar]
- Liu Tianming, Li Hai, Wong Kelvin, Tarokh Ashley, Guo Lei, Wong Stephen. Brain Tissue Segmentation Based on DTI Data. NeuroImage. 2007;38(1):114–23. doi: 10.1016/j.neuroimage.2007.07.002. [DOI] [PMC free article] [PubMed] [Google Scholar]
- Liu T. A few thoughts on brain ROIs. Brain Imaging and Behavior. 2011 doi: 10.1007/s11682-011-9123-6. in press. [DOI] [PMC free article] [PubMed] [Google Scholar]
- Lorensen William E, Cline Harvey E. Marching Cubes: A high resolution 3D surface construction algorithm. Computer Graphics. 1987;21(4) [Google Scholar]
- Jo HJ, Lee JM, Kim JH, Choi CH, Gu BM, Kang DH, et al. Artificial shifting of fMRI activation localized by volume- and surface-based analyses. NeuroImage. 2008;40(3):1077–1089. doi: 10.1016/j.neuroimage.2007.12.036. [DOI] [PubMed] [Google Scholar]
- Lynall Mary-Ellen, Bassett Danielle S, Kerwin Robert, McKenna Peter J, Kitzbichler Manfred, Muller Ulrich, Bullmore Ed. Functional connectivity and brain networks in schizophrenia. Journal of Neuroscience. 2010;30 (28):9477–87. doi: 10.1523/JNEUROSCI.0333-10.2010. [DOI] [PMC free article] [PubMed] [Google Scholar]
- Mangin Jean-François, Frouin Vincent, Bloch Isabelle, Régis Jean, Jaime López-Krahe. From 3D MR images to structural representations of the cortex topography using topology preserving deformations. J Math Imaging Vis. 1995;5:297–318. [Google Scholar]
- Nelson Steven M, Cohen Alexander L, Power Jonathan D, Wig Gagan S, Miezin Francis M, Wheeler Mark E, Velanova Katerina, Donaldson David I, Phillips Jeffrey S, Schlaggar Bradley L, Petersen Steven E. A parcellation scheme for human left lateral parietal cortex. Neuron. 2010;67(1):156–170. doi: 10.1016/j.neuron.2010.05.025. [DOI] [PMC free article] [PubMed] [Google Scholar]
- Ng B, Abugharbieh R, McKeown MJ. IPMI. 2009. Discovering sparse functional brain networks using group replicator dynamics (GRD) [DOI] [PubMed] [Google Scholar]
- Ou W, Wells WM, III, Golland P. Combining Spatial Priors and Anatomical Information for fMRI Detection. Medical Image Analysis. 2010;14(3):318–331. doi: 10.1016/j.media.2010.02.007. [DOI] [PMC free article] [PubMed] [Google Scholar]
- Fillard Pierre, Arsigny Vincent, Pennec Xavier, Ayache Nicholas. Clinical DT-MRI Estimation, Smoothing and Fiber Tracking with Log-Euclidean Metrics. IEEE Transactions on Medical Imaging. 2007;26(11):1472–1482. doi: 10.1109/TMI.2007.899173. [DOI] [PubMed] [Google Scholar]
- Fillard P, Gerig G. Proc of MICCAI’03, Part II, volume 2879 of LNCS. Springer; 2003. Analysis Tool For Diffusion Tensor MR; pp. 979–980. [Google Scholar]
- Poldrack RA. The future of fMRI in cognitive neuroscience. NeuroImage. 2011 doi: 10.1016/j.neuroimage.2011.08.007. in press. [DOI] [PMC free article] [PubMed] [Google Scholar]
- Shen D, Davatzikos C. HAMMER: hierarchical attribute matching mechanism for elastic registration. IEEE Trans Med Imaging. 2002;21(11):1421–39. doi: 10.1109/TMI.2002.803111. [DOI] [PubMed] [Google Scholar]
- Smith SM, Jenkinson M, Woolrich MW, Beckmann CF, Behrens TE, Johansen-Berg H, Bannister PR, De Luca M, Drobnjak I, Flitney DE, Niazy R, Saunders J, Vickers J, Zhang Y, De Stefano N, Brady JM, Matthews PM. Advances in functional and structural MR image analysis and implementation as FSL. NeuroImage. 2004;23(Suppl 1):S208–219. doi: 10.1016/j.neuroimage.2004.07.051. [DOI] [PubMed] [Google Scholar]
- Sobel DF, Gallen CC, Schwartz BJ, Waltz TA, Copeland B, Yamada S, Hirschkoff EC, Bloom FE. Locating the central sulcus: comparison of MR anatomic and magnetoencephalographic functional methods. AJNR Am J Neuroradiol. 1993;14(4):915–25. [PMC free article] [PubMed] [Google Scholar]
- Sporns O, Tononi G, Kötter R. The human connectome: A structural description of the human brain. PLoS Comput Biol. 2005 Sep;1(4):e42. doi: 10.1371/journal.pcbi.0010042. [DOI] [PMC free article] [PubMed] [Google Scholar]
- Sabuncu Mert R, Singer Benjamin D, Conroy Bryan, Bryan Ronald E, Ramadge Peter J, Haxby James V. Function-based intersubject alignment of human cortical anatomy. Cerebral Cortex. 2010;20(1):130–40. doi: 10.1093/cercor/bhp085. [DOI] [PMC free article] [PubMed] [Google Scholar]
- Passingham RE, Stephan KE, Kötter R. The anatomical basis of functional localization in the cortex. Nat Rev Neurosci. 2002;3(8):606–16. doi: 10.1038/nrn893. [DOI] [PubMed] [Google Scholar]
- Van Dijk KR, Hedden T, Venkataraman A, Evans KC, Lazar SW, Buckner RL. Intrinsic functional connectivity as a tool for human connectomics: theory, properties, and optimization. J Neurophysiol. 2010;103(1):297–321. doi: 10.1152/jn.00783.2009. [DOI] [PMC free article] [PubMed] [Google Scholar]
- Van Essen D. A tension-based theory of morphogenesis and compact wiring in the central nervous system. Nature. 1997;385:313–318. doi: 10.1038/385313a0. [DOI] [PubMed] [Google Scholar]
- Van Essen DC, Dierker DL. Surface-Based and Probabilistic Atlases of Primate Cerebral Cortex. Neuron. 2007:56. doi: 10.1016/j.neuron.2007.10.015. [DOI] [PubMed] [Google Scholar]
- Woolrich WM, Jbabdi S, Patenaude B, Chappell M, Makni S, Behrens T, Beckmann C, Jenkinson M, Smith SM. Bayesian analysis of neuroimaging data in FSL. NeuroImage. 2009;45:S173–186. doi: 10.1016/j.neuroimage.2008.10.055. [DOI] [PubMed] [Google Scholar]
- Yap Pew-Thian, Wu Guorong, Zhu Hongtu, Lin Weili, Dinggang Shen. TIMER: tensor image morphing for elastic registration. NeuroImage. 2009;15;47(2):549–63. doi: 10.1016/j.neuroimage.2009.04.055. [DOI] [PMC free article] [PubMed] [Google Scholar]
- Thomas Yeo BT, Sabuncu Mert R, Vercauteren Tom, Holt Daphne J, Amunts Katrin, Zilles Karl, Polina Golland, Bruce Fischl. Learning task-optimal registration cost functions for localizing cytoarchitecture and function in the cerebral cortex. IEEE TMI. 2010;29(7):1424–41. doi: 10.1109/TMI.2010.2049497. [DOI] [PMC free article] [PubMed] [Google Scholar]
- Zang Y, Jiang T, Lu Y, He Y, Tian L. Regional homogeneity approach to fMRI data analysis. NeuroImage. 2004;22(1):394–400. doi: 10.1016/j.neuroimage.2003.12.030. [DOI] [PubMed] [Google Scholar]
- Zhang Degang, Guo Lei, Li Gang, Nie Jingxin, Jiang Xi, Deng Fan, Li Kaiming, Zhu Dajiang, Zhao Qun, Liu Tianming. Automatic cortical surface parcellation based on fiber density informaiton. International Symposium of Biomedical Imaging (ISBI).2010. accepted. [Google Scholar]


