

Background: GCAP1 regulates cGMP synthesis in photoreceptors in response to light.
Results: Mutagenesis of the entire GCAP1 surface reveals its guanylyl cyclase interface.
Conclusion: The interface forms a compact patch that enables both primary binding to and allosteric activation of the target enzyme.
Significance: Guanylyl cyclase activation by GCAP1 is indispensable for vision and survival of photoreceptors.
Keywords: Calcium-binding Proteins, Cyclic GMP (cGMP), Eye, Guanylate Cyclase, Neurobiology, Phototransduction
Abstract
Retinal guanylyl cyclase (RetGC)-activating proteins (GCAPs) regulate visual photoresponse and trigger congenital retinal diseases in humans, but GCAP interaction with its target enzyme remains obscure. We mapped GCAP1 residues comprising the RetGC1 binding site by mutagenizing the entire surface of GCAP1 and testing the ability of each mutant to bind RetGC1 in a cell-based assay and to activate it in vitro. Mutations that most strongly affected the activation of RetGC1 localized to a distinct patch formed by the surface of non-metal-binding EF-hand 1, the loop and the exiting helix of EF-hand 2, and the entering helix of EF-hand 3. Mutations in the binding patch completely blocked activation of the cyclase without affecting Ca2+ binding stoichiometry of GCAP1 or its tertiary fold. Exposed residues in the C-terminal portion of GCAP1, including EF-hand 4 and the helix connecting it with the N-terminal lobe of GCAP1, are not critical for activation of the cyclase. GCAP1 mutants that failed to activate RetGC1 in vitro were GFP-tagged and co-expressed in HEK293 cells with mOrange-tagged RetGC1 to test their direct binding in cyto. Most of the GCAP1 mutations introduced into the “binding patch” prevented co-localization with RetGC1, except for Met-26, Lys-85, and Trp-94. With these residues mutated, GCAP1 completely failed to stimulate cyclase activity but still bound RetGC1 and competed with the wild type GCAP1. Thus, RetGC1 activation by GCAP1 involves establishing a tight complex through the binding patch with an additional activation step involving Met-26, Lys-85, and Trp-94.
Introduction
Retinal membrane guanylyl cyclase (RetGC)2 and RetGC-activating proteins (GCAPs) play a critical role in the physiology of vertebrate photoreceptors by producing the second messenger of phototransduction, cGMP, and regulating its synthesis in a light-sensitive manner (1, 2). Photoactivated pigment (e.g. rhodopsin), via Gt protein-dependent stimulation of PDE6 phosphodiesterase, triggers the decay of cGMP and shuts off cGMP-gated channels in the outer segment, thus hyperpolarizing the photoreceptors in response to light (reviewed in Ref. 3). Timely recovery of rods and cones from excitation requires the activation of RetGC by GCAPs through a Ca2+ feedback pathway (4–6). Once the cGMP channels close in response to light, the influx of Ca2+ through the channels stops and the free Ca2+ concentration in the outer segment declines rapidly (7, 8). In the absence of Ca2+, GCAPs convert into a Mg2+-bound state (9–11) that stimulates RetGC to restore the cGMP levels in the outer segment and reopen the channels (reviewed in Ref. 12). Ca2+/GCAP-regulated RetGC isozymes RetGC1 and RetGC2 (13–15) are the only source for the cGMP synthesis in rod and cone outer segments; in their absence, neither Ca2+-sensitive cGMP synthesis nor visual light responses can be detected in the retina (16, 17). GCAPs are present in various isoforms in different Vertebrata species (18, 19), but only GCAP1 (20) and GCAP2 (21) are ubiquitously present throughout the subfilum and are the only two isoforms encoded by the genome in some mammalian species such as mice and rats. Structures of Ca2+-liganded GCAP1 (Fig. 1A), GCAP2, and GCAP3 have been solved mostly by NMR spectroscopy and x-ray crystallography (22–24), and the principal role of GCAPs in physiology and retinal diseases is well understood (2, 25, 26). GCAPs have different Ca2+ sensitivities and target specificities. GCAP1 is present in mammalian rods and cones and primarily regulates RetGC1 (27), isozyme that comprises at least two-thirds of the total RetGC activity in rod outer segments (17), whereas GCAP2 regulates both RetGC1 and RetGC2 in rods (17, 20) but is virtually absent from cones (21, 28).
FIGURE 1.

Effect of amino acid substitutions in GCAP1 on RetGC1 activation. A, three-dimensional model of Ca2+-liganded GCAP1 (24) annotated as follows: Myr, N-myristoyl moiety; EF-1–EF-4, EF-hand domains; α1–α11, α-helices numbered beginning from the amino terminus; hinge, the loop connecting two semi-globules (I and II) between the α5 and α6 helices. Ca2+ ions bound in three metal-binding EF-hand loops (EF-2 through EF-4) are shown as yellow spheres. B, RetGC1 activation by 5 μm GCAP1 mutants normalized to the wild type activation in control samples (mean ± S.D., n = 3). The following mutations were tested: K8E, S9R; E11,12K; S15R,T16A; E17K,C18D; C18T,C106T,C125T; H19R; Q20R; Y22D; K23D; K24D; M26R; T27K; T27E; E28R; C29T; P30Y; S31Y; G32N; Q33R; T35R; L36E; Y37R; E38R; Q41R;; K46D; N47R; P50G; W51N,S53R; E57R; Q58R; E61R; F65N; K67D; Y70A; F73E; M74K; V77E; A78E; S81A; L82S; K85E; K87D; V88R; E89R; Q90R; R93E; W94A; K97S; V101Y; G103R; C106D; R109D; D110R; R117D; R120D; D127R; A132R; E133R; E134R; D137R; F140A; S141Y; K142D; V145R; G147R; E150Y; S152E; L153R; E154C; E155G; M157R; E158R; K162E; Q164R; L166R; L167R; R172E; D175K; R178D; R181E, Q184R; and deletion, ΔGln-184—Gly-205. Additional substitutions, I122E, N1123A, P124E, C125Q, S126Q, D127G,S128K, T129L, M130L, T138R, S141L, and V145E, and the Val-160–Gly-205 region replacement with the corresponding region from GCAP2 were tested as a single chimera construct (47). The assay contained 10 mm MgCl2 and 2 mm EGTA. The threshold level of 50% activation (dashed line) was selected for segregating the mutants for suspected damage of the RetGC1-binding interface. The mutations that caused this decrease are shown in open diamonds, and the substitutions are labeled next to the data points. C, positions of the mutations causing major decrease in RetGC1 activating capacity in the GCAP1 primary structure. All mutated side chains are marked in bold; those in which replacement rendered RetGC1 activation ≤50% of the wild type level are marked in red and underlined, and those in which mutations reduced activation below 80% are marked with red asterisks. The 12-residue loops of EF-1 through EF-4 are shaded.
GCAPs (29–33) and RetGC1 (34–36) have been linked to multiple forms of human congenital blindness caused by mutations that either disable the synthetic activity of RetGC1 (37–39) or affect the Ca2+ sensitivity of its regulation by GCAPs (30, 40–46). Despite the importance of RetGC regulation for the normal retinal physiology and disease and the ample physiological and biochemical data on the regulation of cGMP synthesis in the photoreceptor outer segment, the molecular mechanism of RetGC activation by GCAP remains obscure. To date, there have been several attempts to identify the possible sites of target recognition in GCAPs using chimeras with other neuronal calcium sensor (NCS) proteins (32, 47, 49), implicating several regions in GCAP primary structure as likely parts of the cyclase-binding interface. However, the precise identity of the binding interface(s) with the cyclase could not be derived directly from the earlier low-resolution studies. In the present study, we have described a refined mapping of the residues in GCAP1 using global mutagenesis of the surface-exposed residues combined with functional tests that allowed us to distinguish between the primary binding to the cyclase versus its activation. We found that the residues required for GCAP1 binding to RetGC1 formed a distinct “binding patch” on one side of the molecule that also contains at least two residues, Met-26 and Trp-94, that are not essential for the primary binding but affect secondary interactions required for RetGC1 activation.
EXPERIMENTAL PROCEDURES
GCAP1 Mutagenesis and Purification
Bovine D6S GCAP1 cDNA was mutated using a conventional “splicing by overlap extension” approach utilizing mutations embedded in chemically synthesized PCR primers (Integrated DNA Technologies); the cDNA was amplified and inserted into the NcoI/BamHI sites of pET11d vector (Novagen/Calbiochem) as described previously (10) except for using high fidelity Phusion Flash polymerase (Fermentas/Thermo Fisher Scientific) instead of Pfu polymerase. The constructs were sequenced and transformed into the BLR(DE3) Escherichia coli strain harboring pBB131 plasmid encoding yeast N-myristoyltransferase. The myristoylated GCAP1 expressed in cells cultured in the presence of myristic acid and induced with IPTG was isolated and refolded from inclusion bodies by urea extraction and then purified using hydrophobic and size-exclusion chromatography as described previously in full detail (10, 50, 51), except 5 mm MgCl2 was present during the urea extraction and the subsequent dialysis steps.
eGFP-tagged GCAP1 for RetGC1 co-transfection experiments was expressed in HEK293 cells from pQBIfN3 vector (Clontech) using a calcium phosphate precipitation technique for transfection as described previously (38, 52).
RetGC1 Expression and Activity Assay
The human RetGC1 cDNA was expressed in HEK293 cells from a modified pRCCMV vector (Invitrogen) using calcium phosphate precipitation for the transfection, and the membrane fraction containing expressed RetGC1 was isolated as described previously in detail (11, 50). The activity of the cyclase was assayed using [α-32P]GTP as a substrate, and the [32P]cGMP product was quantified using TLC as described previously (11, 50). Briefly, the assay mixture (25 μl) incubated at 30 °C contained 30 mm MOPS-KOH (pH 7.2), 60 mm KCl, 4 mm NaCl, 1 mm DTT, 2 mm Ca2+/EGTA buffer, 1 mm free Mg2+, 0.3 mm ATP, 4 mm cGMP, 1 mm GTP, and 1 μCi of [α-32P]GTP. The resultant [32P]cGMP product was analyzed by TLC using fluorescently backed polyethyleneimine cellulose plates (Merck) developed in 0.2 m LiCl and eluted with 2 m LiCl as described (11). Up to 20 μm GCAP in the assays did not compromise TLC performance.
Co-transfection Experiments
The mOrange-tagged RetGC1 (51) was used in this study because of brighter fluorescence and lower cytotoxicity compared with the dsRed-tagged RetGC1 (38, 52) under the conditions of our experiments. The mOrange-tagged RetGC1 used for co-transfection experiments was constructed in two steps. The cDNA portion coding for the human RetGC1 (14) extracellular domain (which does not participate in GCAP binding; see Refs. 38, 52, and 53) between Cys-14 and Asp-24 was substituted with a 31-bp fragment containing engineered NheI and AgeI restriction nuclease sites. The mOrange cDNA encoded by the pmOrange plasmid (Clontech) was then amplified using Pfu polymerase (Stratagene/Agilent Technologies) with the NheI and AgeI sites at the ends and inserted in the modified extracellular domain in-frame with the leader sequence of RetGC1. The resultant construct was sequenced, expressed in HEK293 cells to verify preservation of RetGC1 activity and GCAP-dependent regulation, and then co-expressed with the SuperGlo (Clontech) enhanced green fluorescent protein (GFP)-tagged GCAP1 in HEK293 cells at the RetGC1:GCAP1 plasmid, at a ratio of ∼125:1, to test their co-localization using confocal microscopy as described in detail previously (51, 52). Confocal images were taken using an Olympus FV1000 Spectral instrument and processed using Olympus FluoView FV10-ASW software.
A Ca2+ binding assay was performed using Fluo-4FF Ca2+ indicator dye (Molecular Probes/Invitrogen) as described previously in detail (10, 50, 51). The readings of the fluorescence intensity were corrected for the dilution caused by the addition of CaCl2. Free Ca2+ in the reaction mixture was calculated using the formula [Ca]f = Kd × (F − Fmin)/(100 − F), where F is the fluorescence intensity of the Ca2+ indicator in the assay mixture expressed as a percentage of the fluorescence of the Ca2+-saturated indicator (recorded at the end of each experiment in 1 mm [Ca]f), Fmin is the fluorescence intensity of the Ca2+ indicator in the absence of Ca2+ and also expressed as a percentage of the fluorescence of the Ca2+-saturated indicator, and Kd is a corrected constant of the indicator dye for Ca2+ (10).
The tryptophan fluorescence of GCAP1 mutants was measured in the presence of 10 mm Mg2+ and Ca2+/EGTA mixtures as described previously in detail (10, 50, 51). The free metal concentrations in assays containing Ca2+/EGTA mixtures were calculated using Bound and Determined and MaxChelator software correcting for pH, salt, and nucleotide concentrations as well as temperature. The fluorescence data were fitted using a simplified saturating hyperbolic function: ([Ca]bound/[GCAP]) = Bmax × [Caf]/([Caf] + Kd). [Ca]bound is the concentration of Ca2+ bound to GCAP1 calculated as [Ca]bound = [Ca]total − [Ca]free, Bmax is the mol of Ca2+ ions bound per mol of GCAP at saturation, and Kd is the apparent dissociation constant for Ca2+. The trace amounts of EDTA introduced into the assay from the stock solutions of the proteins were negligible compared with the protein concentration in the assay.
NMR Spectroscopy
15N-Labeled GCAP1 was expressed in BL21(DE3) E. coli strain, purified, and analyzed as described previously (54–56). Two-dimensional 15N-1H HSQC spectra with 2048 (1H) × 256 (15N) data points were recorded for 15N-labeled samples of myristoylated GCAP1 mutants (M26R, S31Y, and F73E) using an 800-MHz Bruker Avance III NMR spectrometer equipped with a triple resonance cryogenic probe. Each NMR sample consisted of myristoylated GCAP1 protein dissolved in buffer containing 95% H2O/5% D2O, 10 mm Tris-d11, 2 mm CaCl2, and 1 mm dithiothreitol-d8 (pH 7.4) as described previously (54). All NMR experiments were performed at 37 °C. Spectra were processed using the NMRPipe software package (57) and analyzed using SPARKY.
RESULTS
Mutagenesis and the Primary Screening for the Residues Affecting RetGC1 Activation
A total of 107 residues, surface-exposed based on the Ca2+GCAP1 crystal structure (24), were altered, mostly using a single point mutation, although in some cases residues were substituted in pairs or in larger blocks as indicated in Fig. 1B and Table 1. The residues substituted by mutagenesis have been marked with colors and asterisks in the primary structure of bovine GCAP1 presented in Fig. 1C. For the purposes of a more efficient disruption of GCAP1 interaction with the target enzyme by single point mutations at the surface, the side chains were substituted with those that had distinctly different properties, i.e. negatively charged substituted by positively charged residues and vice versa, a short side chain by a long chain and vice versa, and hydrophobic by hydrophilic residues. In the last case, the hydrophobic residues we mutated were already exposed to the solution in the GCAP1 crystal structure, and their replacement with a hydrophilic residue would not be expected to cause major rearrangement of the protein fold. The opposite would not necessarily be true, and we generally avoided replacement of hydrophilic side chains with Ala and the more hydrophobic residues, Trp or Phe, to minimize the possibility of a nonspecific backbone misfolding. In some cases, when substitutions with Tyr were selected, the correct fold of the protein main chain was evaluated using NMR spectroscopy and other methods as described further below. For the same reason, we did not mutate the internal residues forming the hydrophobic core of the molecule. Additional reasons not to mutate residues embedded deeply in the hydrophobic core of the Ca2+GCAP1 x-ray crystal structure (24) stemmed from the results of recent NMR spectroscopy studies combined with molecular modeling (56), arguing that conformational changes in GCAP1 upon its transition from the Ca2+-bound (inhibitor) state to the activator state do not involve major rearrangement of the overall backbone fold of the molecule. Lastly, we excluded from the mutagenesis those side chains that participate in metal coordination in EF-hands 2 and 3, in order to prevent the loss of Mg2+ binding needed to maintain the activator state of GCAP1 (11, 52), as well as the first five amino residues at the N terminus, to prevent the potential loss of recognition by N-myristoyltransferase.
TABLE 1.
Primary screening for RetGC1 activity in the presence of 5 μm GCAP1
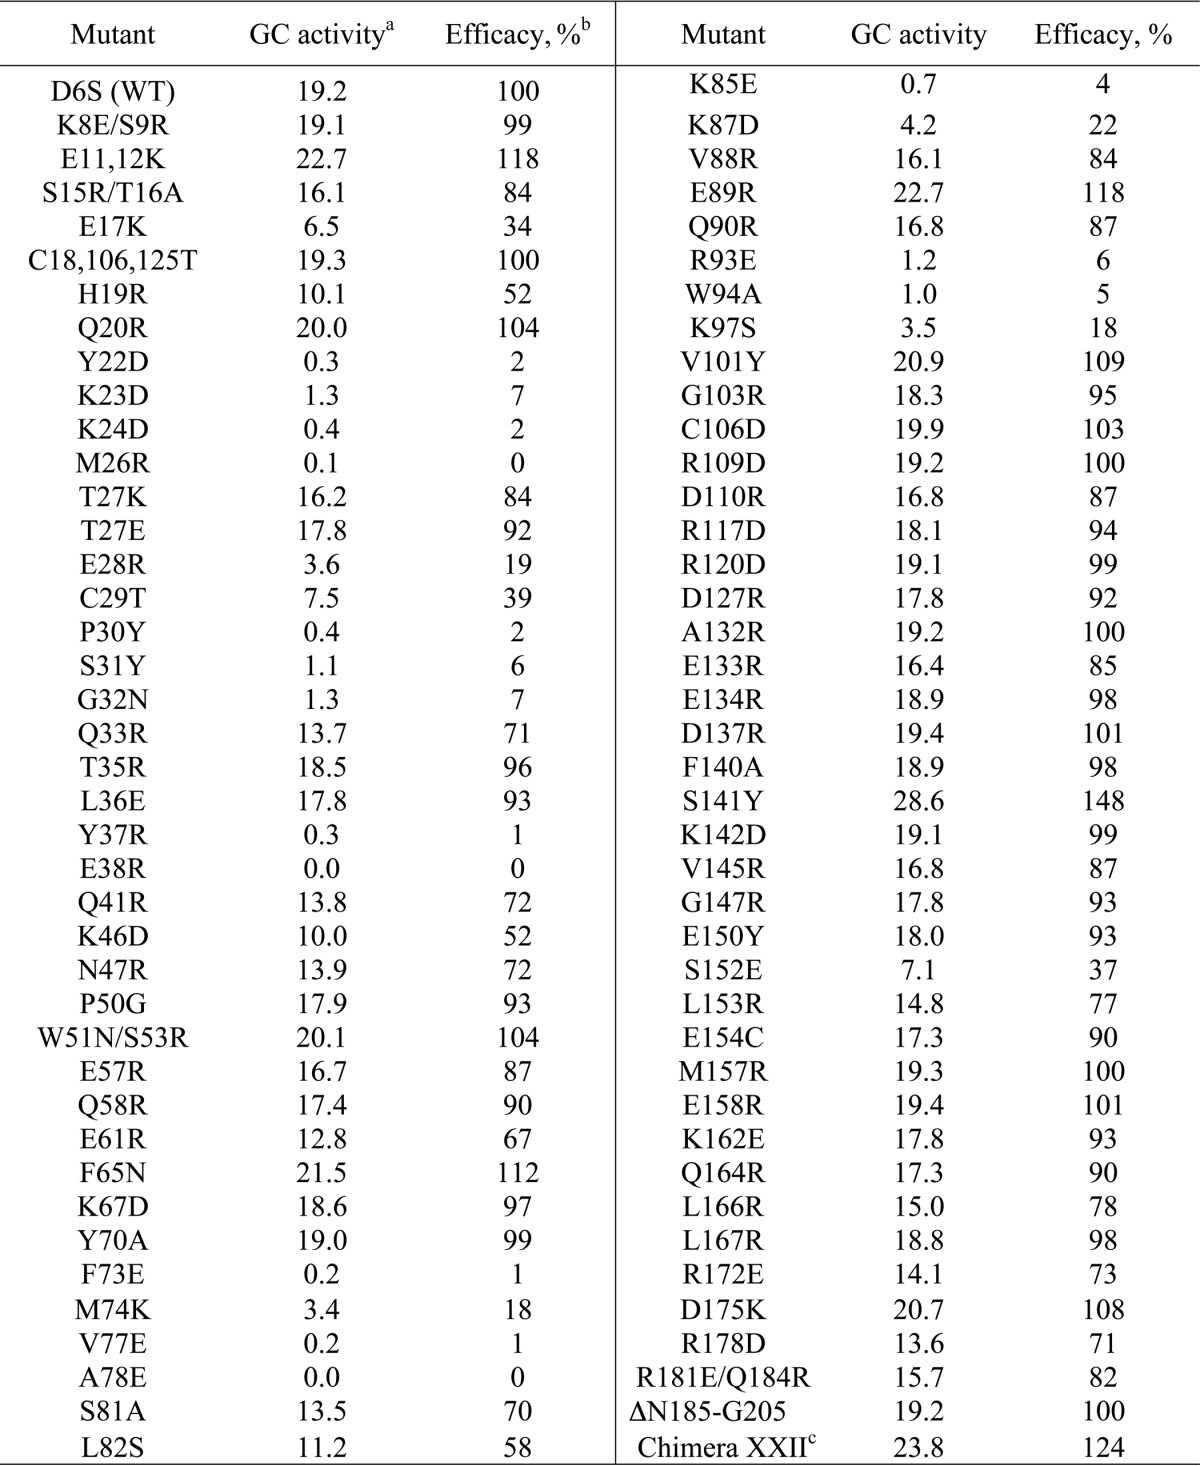
a Nanomol cGMP/min/mg; recombinant RetGC1 was reconstituted with GCAP1 mutants in the presence of 10 mm MgCl2 and 2 mm EGTA and assayed as described in Fig. 1B and “Experimental Procedures.”
b Normalized per RetGC1 activity in the presence of wild type GCAP1 as a 100% efficacy standard. S.D. from three independent measurements did not exceed 5% of the mean value for all tested mutants.
c The chimera containing semi-globule I from GCAP1 and semi-globule II from GCAP2 produced as described in Ref. 47.
Myristoylated GCAP1 mutants expressed in E. coli were purified and screened for their ability to activate RetGC1 in vitro in comparison with the wild type (WT) GCAP1 (Fig. 1B). Based on the WT GCAP1 K1/2 ∼ 10−6 m for RetGC1 activation (38, 56), we used for the initial screening a subsaturating concentration of 5 μm GCAP1, and those mutants in which the activator capacity was substantially compromised were selected using a 50% decrease in the level of RetGC1 activation as the threshold for the primary screening. It also needs to be noted that, to optimize activation of the cyclase and to minimize any potential effects of the mutations on Mg2+ binding affinity of GCAP1, Ca2+ was chelated by EGTA, and the assay was also saturated with Mg2+ added in a large excess (10 mm) over the GCAP1 Kd Mg ∼ 0.2 mm (9, 10).
Most of the mutations introduced at various positions on the surface did not critically affect RetGC1 activation based on the selected threshold (Table 1). Moreover, the vast majority of the surface-exposed residues tolerated a major change in their properties with surprisingly little effect on the cyclase stimulation (Fig. 1, B and C). A chimera protein containing the first two EF-hands from GCAP1 and the C-terminal half from GCAP2 (47) when tested in the conditions of the screening activated RetGC1 just like the wild type (Table 1), despite the substantial diversity of the sequences between the two homologs in the C-terminal portion surrounding EF-hand 4. Moreover, a 19-residue truncation (Asn-185–Gly-205) of the GCAP1 molecule did not suppress its activity (Fig. 1B). This was consistent with earlier observations that the region downstream from Arg-182 tolerates replacement with the C terminus from recoverin (32). However, we also found that, contrary to earlier expectations based on the substitution of larger fragments in GCAP primary structure (32, 47), none of the individually tested surface residues in the exiting helix of EF-hand 4 or in α-helices 10 and 11 was essential for the cyclase activation.
Unlike most of the surface residues, there was a group of 24 mutants for which the ability to activate RetGC1 fell to or below the 50% threshold. In 19 of these residues, the activation was suppressed by ∼80% or was even completely lacking (Fig. 1B): Y22D (<2% normal RetGC1 activation in primary screening); K23D (7%), K24D (2%); M26R (<1%); E28R (19%); P30Y (2%), S31Y (6%); Y37R (1%); E38R (<1%); G32N (7%); F73E (1%); M74K (18%); V77E (1%); A78E (<1%); K85E (4%); K87D (22%); K93E (6%); W94A (5%); and K97S (18%) (Table 1). This suggested that cyclase-binding interface could be compromised in those mutants. These mutations, except for a few that did not show any measurable activity were further subjected to a comparative analysis for concentration dependence of the cyclase activation (Fig. 2), in comparison with several mutations that did not show inactivating effect in the primary screen.
FIGURE 2.

Dose dependence of RetGC1 activation by GCAP1 mutants.
A, mutations in EF-hand I: WT (●); E17K (♦); H19R (♢); K23D (▿); M26R (○); T27K ( ); T27E (▴); E28R (▾); P30Y (⊠); S31Y(■); and G32N (□). B, mutations in EF-hand 2: WT (●); F73E (♢); M74K (▴); V77E (○); and A78E (□). C, mutations in the hinge region and EF-hand 3: WT (●); K85E (○); K87D (▴); W94A (□); and K97S (▵). D, mutations in EF-hand 4 and C-terminal segment: WT (●); S141Y (○); S152E (♢); L153R (▵); L166R (▴); and deletion, Asn-185–Gly-205 (♦). The activation of recombinant RetGC1 by increasing concentrations of purified GCAP1 was assayed in the presence of 2 mm EGTA and 10 mm Mg2+; the data points (mean ± S.D., n = 5 for WT and P30Y, n = 3 for V77E and A78E, and n = 2 for other mutants) were fitted using Synergy KaleidaGraph 4 utilizing the standard Levenberg-Marquardt algorithm of nonlinear least-squares routines, assuming Michaelis function, a = amax [GCAP]/(K1/2 GCAP + [GCAP]), where a is the activity of RetGC in the assay, amax is the maximal activity of RetGC, [GCAP] is the concentration of GCAP, and K1/2 GCAP is the GCAP concentration required for half-maximal activation.
All mutants in EF-hand 1 that retained at least some residual activity displayed a markedly reduced apparent affinity for RetGC1 (Fig. 2). The mutants K23D, E28R, P30Y, S31Y, and G32D all displayed a strong reduction of their apparent affinities for the cyclase, although in some cases (Y22D, M26R, P30Y, S31Y, G32D, Y37R, and E38R) the activity was virtually lacking and therefore neither amax nor K1/2 could be determined precisely from the analysis (Figs. 1B and 2). In contrast, the T27K and T27E substitutions (56) had very little effect.
Some mutations in the part of the GCAP1 surface formed by the exposed residues of EF-hand 2 and EF-hand 3 (Fig. 2, B and C) also strongly reduced the apparent affinity for the cyclase (M74K, K87D, and K97S) or virtually eliminated GCAP1 activity (F73E, V77E, A78E, K85E, and W94A). The complete lack of activity in the latter cases made it impossible to determine the change in kinetic parameters from the dose response of RetGC1 activation.
Compared with EF-hands 1–3, there was very little effect from mutations in the region that contained EF-hand 4 and the portion proximal to the C terminus. None of the tested mutations in that region eliminated GCAP1 ability to activate the cyclase. Only one among the tested mutants, S152E, in the EF-4 loop showed a relatively modest (to 40% wild type level) decrease in the primary screen (Fig. 1B). The decrease resulted from a 4-fold reduction in the apparent affinity for the cyclase (K1/2 7 versus 1.5 μm in WT) (Fig. 2D). Other substitutions had a rather minor effect, and even deletion of the entire C-terminal fragment, Asn-185–Gly-205, affected neither amax nor K1/2 (Fig. 2D).
Cys-29 in EF-hand 1, but No Other Cys Residue, Contributes to GCAP1 Interface for RetGC1
One of the residues in the non-metal-binding EF-hand 1 sensitive to mutagenesis was Cys-29. In contrast, other Cys residues located at positions 18, 106, and 125 contributed little to the recognition of the target enzyme. We replaced all four Cys residues with a similar size residue, Thr (Fig. 3). The mutant lacking all cysteines (Cys−) reduced the affinity for the cyclase GCAP1 almost 10-fold (K1/2 = 12 versus 1.5 μm in WT). However, a single reverse replacement, T29C, thus restoring the Cys-29 in EF-hand 1 (Cys(−)T29C), simultaneously restored the activity of GCAP1 by increasing its apparent affinity for RetGC1 back to normal (1.2 μm) (Table 2). Conversely, alkylation of that single Cys-29 in the C18T,C106T,C125T GCAP1 triple mutant, Cys(−)T29C, by N-ethylmaleimide (NEM) blocked RetGC1 activation.
FIGURE 3.

Cys-29 contributes to the cyclase-binding interface of GCAP1. Dose dependence of RetGC1 activation by GCAP1 mutants: WT (○); WT pretreated with NEM (♢); C18T,C29T,C106T,C125T (Cys(−), ▴); the Cys(−) mutant with Cys-29 restored (Cys(−)T29C,●); and the Cys(−)T29C mutant pretreated with NEM (♦). Where NEM treatment is indicated, GCAP1 was fully reduced by 5 mm DTT, loaded on a butyl-Sepharose chromatography column in 20 mm Tris-HCl (pH 7.5) containing 1 m NaCl, eluted by a step of 5 mm sodium phosphate buffer, and divided into two equal portions, one of which was incubated with 2 mm NEM for 1 h at room temperature; the other portion contained 1 mm DTT instead of NEM. At the end of the reaction, 4 mm DTT was added to quench NEM, and both the alkylated and non-alkylated samples were desalted by several cycles of concentration/dilution using an Amicon Ultra-4 membrane concentrator. Other conditions of the assay were the same as described in the legend for Fig. 2. The data points (mean ± S.E., n = 3) were fitted assuming the Michaelis hyperbolic function.
TABLE 2.
Activation of RetGC1 by selected GCAP1 mutants
This material was compiled from titrations exemplified in Figs. 2 and 3 and Ref. 56. The K1/2 GCAP and amax (means ± S.E.) values are from the fit of the data sum from n independent trials, assuming the Michaelis function a = amax [GCAP]/(K1/2 GCAP + [GCAP]), where a is the activity of RetGC in the assay, amax is the maximal activity of RetGC, [GCAP] is the concentration of GCAP1, and K1/2 GCAP is the GCAP concentration required for half-maximal activation. The data were fitted using KaleidaGraph 4.0 utilizing a conventional Levenberg-Marquardt algorithm of nonlinear least-squares routines. ND, not determined (the activity was too low to reliably extract the parameters).
| GCAP1 | K1/2 GCAP | amax |
|---|---|---|
| WT | 1.6 ± 0.1 | 27 ± 1.6 (n = 5) |
| E17K | 8.3 ± 0.1 | 18 ± 0.3 (n = 2) |
| C18T,C29T,C106T,C125T | 12 ± 2 | 29 ± 1 (n = 3) |
| C18T,C106T,C125T | 1.2 ± 0.2 | 25 ± 0.2 (n = 3) |
| H19R | 4.5 ± 0.4 | 18 ± 1 (n = 2) |
| K23D | 25 ± 4a | 9 ± 0.9 (n = 2) |
| M26R | ND | ND (n = 2) |
| T27K | 3.3 ± 0.5 | 28 ± 2 (n = 2) |
| T27E | 2.9 ± 0.1 | 28 ± 0.4 (n = 2) |
| E28R | 29 ± 4a | 28 ± 3 (n = 2) |
| P30Y | ND | ND (n = 5) |
| S31Y | 60 ± 19a | 10 ± 3 (n = 2) |
| G32N | 13 ± 3a | 39 ± 12 (n = 2) |
| K46D | 9.7 ± 0.9 | 31 ± 1.4 (n = 2) |
| F73E | ND | ND (n = 2) |
| M74K | 7.1 ± 0.5 | 17 ± 1 (n = 2) |
| V77E | ND | ND (n = 3) |
| A78E | ND | ND (n = 3) |
| K85E | ND | ND (n = 2) |
| K87D | 15 ± 1 | 19 ± 0.4 (n = 2) |
| W94A | ND | ND (n = 2) |
| K97S | 13 ± 1 | 12 ± 1 (n = 2) |
| S141Y | 1.6 ± 0.1 | 27 ± 0.4 (n = 2) |
| S152E | 7.2 ± 0.6 | 20 ± 0.6 (n = 2) |
| L153R | 3.2 ± 0.1 | 27 ± 0.5 (n = 2) |
| L166R | 3.9 ± 0.2 | 28 ± 0.7 (n = 2) |
a Because of the dramatic loss of affinity for the target and limitations of the fit method, the error was larger for those mutants in which K1/2 GCAP was similar to or above the maximal GCAP concentration in the assay, and the measured a was much lower than amax.
Effect of the Inactivating Mutations on Co-localization of GCAP1 with RetGC1 in HEK293 Cells
Because RetGC1 complex with GCAPs is unstable in detergents, to directly verify whether or not the mutants that fail to activate RetGC1 in vitro retained their ability to bind with the target enzyme, we co-expressed GCAP1-GFP and mOrange-RetGC1 in HEK293 cells using a previously developed cell-based assay (52) (Figs. 4 and 5). Note that the presence of the fluorescent tags at the C terminus of GCAP1 or at the N terminus of RetGC1 does not block cyclase activation by GCAP1 (38, 52). When expressed alone in HEK293 cells, wild type GCAP1-GFP (Fig. 4A) spreads uniformly throughout the cytoplasm and the nucleus, excluding nucleoli and vacuoles (52). In contrast, when co-expressed with RetGC1, GCAP1 and its active mutants (Figs. 4 and 5) become anchored to the membranes through the cytoplasmic segment of the cyclase. As a result, GCAP1-GFP fluorescence acquires a well defined membrane (predominantly endoplasmic reticulum membranes; see Ref. 52) localization pattern and clears from the nucleus (38, 52). Fig. 4B demonstrates that the distributions of both fluorescent tags across the cell coincide with each other. The Pearson correlation coefficient (PCC) of 0.93 from the whole-cell image analysis in the wild type indicates nearly perfect co-localization of GCAP1 with the cyclase (Fig. 6 and Table 3).
FIGURE 4.

Effect of mutations in EF-hand 1 on direct binding of GCAP1 to RetGC1 in HEK293 cells. A, GCAP1-GFP expressed in HEK293 cells without RetGC1 diffuses throughout the cytoplasm and the nucleus (52): left panel, GCAP1-GFP fluorescence, middle panel, fluorescence superimposed on differential interference contrast (DIC) image; right panel, distribution of GCAP1 fluorescence (arbitrary scale) across the cell scanned along the dashed line shown in the middle panel. B–I, expression vectors coding for GCAP1-GFP (green) and mOrange-RetGC1 (red) were co-transfected in HEK293 cells at an ∼1:125 molar ratio using a previously described method (52). Each row of panels presents (left to right), respectively, the fluorescence image of GCAP1, the fluorescence image of RetGC1, a merged image of the two, and the distribution of the corresponding fluorochrome brightness (arbitrary scale) scanned across the cell along the dashed line shown in the merged image. B, wild type; C, Y22D; D, K24D; E, M26R; F, T27K; G, S31Y; H, G32N; and I, E38R. A minor γ adjustment for better clarity of perception in some panels was applied to the whole view field. The fluorescence intensity distribution in all cases was recorded from the original image within proportional range of the photomultiplier without any adjustments to the image itself. Objective, ×60; the green fluorescence was excited by 488 nm and the red fluorescence by 543 nm laser, respectively.
FIGURE 5.

Effect of mutations in EF-hands 2, 3, and 4 and the C terminus on direct binding of GCAP1 to RetGC1 in HEK293 cells. The analysis was performed and results presented as described in the legend for Fig. 4. A, F73E; B, V77E; C, A78E; D, K85E (asterisks mark those cells that display co-localization pattern); E, K93E; F, W94A; G, K97S; H, G103R; and I, Asn-185–Gly-205 deletion mutant.
FIGURE 6.

mOrange-RetGC1 (left panels) and GCAP1-GFP (middle panels) fluorescence intensities distribution in HEK293 cells and their co-localization tests (right panels). Fluorescence images acquired as presented in Figs. 4 and 5 were processed without editing using Olympus Fluoview FV10-ASW software to reconstruct the fluorescence intensities over the entire confocal cell image in each case. The examples of a cross-correlation test for the red (y axis) versus green (x axis) pixels in each image are shown in the right panels and include the Pearson correlation coefficient (48). The PCC values for each mutant averaged from multiple cells were then summarized in Table 3. A–T, mOrange-RetGC1 co-expressed with the following variants of GCAP1-GFP: A, WT; B, Y22D; C, K24D; D, M26R; E, T27K; F, S31Y; G, G32N; H, E38R; I, F73E; J, V77E; K, A78E; L, K85E; M, K93E; N, W94A; O, K97S; P, G103R; Q, S141Y; R, E158R; S, D175R; and T, deletion, Asn-185–Gly-205. U, wild type GCAP1-GFP was co-expressed with the extracellular portion of RetGC1 containing red fluorescent tag (52) but lacking the entire cytoplasmic segment required for GCAP binding (52, 53).
TABLE 3.
RetGC1 and GCAP1 co-localization in HEK293 cells
The Pearson correlation coefficient for mOrange-RetGC1 and GCAP1-GFP co-expressed in HEK293 cells was determined from analysis of the fluorescence distribution in the respective red and green channels of the confocal images using Olympus FluoView FV10-ASW software.
| GCAP1-GFP | PCCa | pb |
|---|---|---|
| Mean ± S.D. | ||
| WT | 0.93 ± 0.02 (n = 32) | |
| Y22D | 0.45 ± 0.11 (n = 24) | <0.0001 |
| K24D | 0.40 ± 0.14 (n = 23) | <0.0001 |
| M26R | 0.91 ± 0.03 (n = 19) | 1 |
| T27K | 0.92 ± 0.05 (n = 19) | 1 |
| S31Y | 0.48 ± 0.14 (n = 15) | <0.0001 |
| G32N | 0.54 ± 0.12 (n = 21) | <0.0001 |
| E38R | 0.32 ± 0.12 (n = 21) | <0.0001 |
| F73E | 0.26 ± 0.10 (n = 21) | <0.0001 |
| V77E | 0.41 ± 0.10 (n = 18) | <0.0001 |
| A78E | 0.45 ± 0.11 (n = 21) | <0.0001 |
| K85E | 0.70 ± 0.14 (n = 32) | <0.0001 |
| K93E | 0.49 ± 0.14 (n = 20) | <0.0001 |
| W94A | 0.88 ± 0.08 (n = 35) | 1 |
| K97S | 0.51 ± 0.18 (n = 20) | <0.0001 |
| G103R | 0.91 ± 0.05 (n = 20) | 1 |
| S141Y | 0.92 ± 0.03 (n = 17) | 1 |
| E158R | 0.92 ± 0.04 (n = 21) | 1 |
| D175R | 0.93 ± 0.04 (n = 13) | 1 |
| Asn-185–Gly-205 | 0.92 ± 0.04 (n = 22) | 1 |
a mOrange-RetGC1 and GCAP1-GFP were co-expressed in HEK293 cells, and the confocal microscopy was performed as described under “Experimental Procedures.” Note that PCC values ≤0.5 generally indicate absence of co-localization, and PCC = 1.0 indicates perfect co-localization of all red and green pixels in the image (48).
b In comparison with WT, from one-way analysis of variance/Bonferroni all-pairs comparison test (CL = 99%) processed using Synergy KaleidaGraph 4 software.
In contrast to the wild type, mutations in different parts of EF-hand 1 (Y22D, K24D, S31Y, G32N, and E38R) disrupted GCAP1/RetGC1 co-localization such that GCAP1 fluorescence was again mostly spread uniformly over the cytoplasm and the karyoplasm, unlike the fluorescence of the mOrange-RetGC1, which localized only to the membranes (Fig. 4, B, C, and F–H). Consequently, in all five EF-hand 1 mutants, the correlation coefficient for co-localization of the two fluorescent markers (Table 3) fell to and below the threshold (0.5; see Ref. 48) of co-localization. A similar pattern was observed when the entire cytoplasmic portion of RetGC1 was truncated (52) and the red fluorescence in membranes was merely bleeding through the diffuse green fluorescence of GCAP1 in the cytoplasm (Fig. 6U). Hence, the lack of RetGC activation by these mutants can be explained by their failure to bind with the target enzyme. Conversely, the T27K GCAP1, which retained its ability to activate RetGC1 in vitro (Figs. 1 and 2), also displayed normal GCAP1/RetGC co-localization pattern typical for the wild type (Fig. 4F). One exception among the mutations in EF-hand 1 that eliminated GCAP1 activity by blocking its binding to the target was the M26R GCAP1, which clearly retained its ability to co-localize with RetGC1 (Figs. 4E and 6D and Table 3).
A similar heterogeneity was found for the mutations in the region containing EF-hands 2 and 3 (Figs. 5 and 6 and Table 3). F73E, V77E, A78E, K93E, and K97S substitutions, which suppressed RetGC1 activation, all disrupted the co-localization pattern for GCAP1-GFP and mOrange-RetGC1 (Figs. 5, A–C, E, and G, and 6, I–K, M, and O). However, the W94A GCAP1 (Figs. 5F and 6N) retained a well defined co-localization pattern, albeit less sharply defined than in WT GCAP1 (Table 3).
A more complex pattern was observed with the K85E substitution located in the “hinge,” the region between the two semi-globules of GCAP1 connecting EF-hands 2 and 3 (Fig. 5D). In that case, some transfected cells showed no evidence of co-localization between the two proteins, whereas half of them (marked with asterisks in Fig. 5D) still showed co-localization of the two proteins (Fig. 6L), although visibly less prominent than the wild type. Reflecting that variability, the PCC of 0.70 ± 0.14 (Table 3) averaged from multiple cells was above the co-localization criterion threshold (PCC = 0.5 (48)) but substantially lower than the 0.93 ± 0.02 in the wild type. Evidently, the K85E GCAP1 ability to associate with RetGC1 was compromised but not completely lost. Therefore, the complete loss of the cyclase activation by either W94A or K85E (Figs. 1B and 2C) could hardly be explained by disruption of RetGC1 binding.
In control experiments, mutations in EF-hand 3 (G103R, Fig. 5H), EF-hand 4 (S141Y, E158R, and D175R, Fig. 6, Q–S), and the C-terminal fragment (deletion Asn-185–Gly-205, (Figs. 5I and 6T) that did not make GCAP1 lose its ability to activate RetGC did not affect its normal binding pattern, which remained indistinguishable from that of the wild type (Table 3).
GCAP1 Mutants That Fail to Bind RetGC1 Remain Structurally Intact
We tested whether the GCAP1mutants that completely stopped activating RetGC1 and were unable to bind with the target enzyme in a cell-based assay failed to do so because of a nonspecific misfolding. We found that even completely inactive mutants retained the normal Ca2+ binding stoichiometry of 3/molecule (Fig. 7A), thus arguing that the GCAP1 lack of binding to the target was not due to deterioration of the overall main chain fold. To further test the structural integrity, we tested in selected mutants the change in the intrinsic Trp fluorescence in response to the displacement of Mg2+ by Ca2+ in their EF-hands (9, 10, 50). In all cases, the increase of Trp-94 fluorescence, reflecting a metal-dependent conformational change typical for the wild type, remained intact even for the most severely inactivated mutants such as S31Y or V77E (Fig. 7, B–D). Furthermore, we also recorded NMR spectra of two mutants that completely failed to activate RetGC and bind it in a cell-based assay, F73E and S31Y (Fig. 7E). Unlike CD spectroscopy, which only detects changes in the protein secondary structure, NMR spectroscopy detects the overall tertiary fold and therefore provides a more sensitive probe of unfolding. NMR can determine the existence of a molten globule state that retains regular secondary structure but lacks important tertiary contacts in the hydrophobic core, as observed for apoGCAP1 (54). The NMR spectra of the myristoylated forms of M26R, S31Y, and F73E in the Ca2+-bound state are all similar to that of wild type GCAP1 (54, 56), indicating that these mutants are properly folded and structurally intact. The cluster of three downfield NMR peaks near 10.5 ppm (assigned to Gly-69, Gly-105, and Gly-149) indicates that Ca2+ is bound at EF-hands 2, 3, and 4 in each of these mutants with a structural environment similar to that of the wild type (54, 56). We therefore concluded that these point mutations that inactivate RetGC stimulation must specifically affect GCAP1 at the interface that binds to the cyclase and the inactivity of these mutants is not the result of protein misfolding.
FIGURE 7.

GCAP1 mutants that cannot activate RetGC1 can still bind Ca2+.
A, the normal Ca2+ binding stoichiometry of 3/GCAP1 remains unchanged in the mutants that completely failed to activate the cyclase: WT (●); M26R (▵); S31Y (□); G32N (▿); F73E (■); V77E (○); K85E (); and W94A (♦). Ca2+-binding isotherms were obtained using the Ca2+ fluorescent indicator dye Fluo-4FF (10, 48). The fluorescence data were fitted using a simplified saturating hyperbolic function: ([Ca]bound/[GCAP]) = Bmax × [Ca]free/([Ca]free + Kd), where Bmax is the mol of Ca2+ ions bound per mol of GCAP at saturation, Kd is the apparent dissociation constant, [Ca]bound is the concentration of Ca2+ bound to GCAP1 calculated as [Ca]bound = [Ca]total − [Ca]free. The data shown are representative of 2–4 independent experiments producing in each case virtually identical Ca2+ binding stoichiometries. B–D, Ca2+-dependent increase in Trp-94 fluorescence (9, 10) was tested in WT, S31Y, and V77E GCAP1, respectively. The analysis was performed as described under “Experimental Procedures” in the presence of 10 mm MgCl2. E, NMR spectra of GCAP1 mutants. Uniform 15N-labeled samples of Ca2+-bound and myristoylated forms of M26R (top), S31Y (middle), and F73E (bottom) were prepared as described under “Experimental Procedures.” All NMR spectra were recorded at 37 °C using a Bruker Avance III NMR spectrometer equipped with cryogenic TCI probe. Three downfield peaks at ∼10.5 ppm are assigned to Gly-69, Gly-105, and Gly-149 (55), indicating that Ca2+ is bound at EF-2, EF-3, and EF-4. Minor spectral differences are observed for exposed residues in unstructured regions, most likely because of small differences in solvent conditions. However, the overall chemical shift patterns in these spectra are similar to that of wild type GCAP (54, 55), thus confirming that each of the mutants is properly folded and structurally intact.
M26R, W94A, and K85A Compete with the Wild Type GCAP1
Unlike other mutations in GCAP1 that eliminated RetGC stimulation, M26R and W94A and to a lesser extent K85E not only displayed co-localization with RetGC1 in HEK293 cells (Figs. 4–6) but were also able to compete with WT GCAP1 in vitro (Fig. 8). When RetGC1 in the assay was activated half-way by 1 μm WT GCAP1, the addition of the M26R GCAP1 completely negated RetGC1 activation within the low micromolar range (EC50 < 1 μm), thus arguing that the M26R GCAP1 binds to the target almost as efficiently as the wild type, even though such binding does not result in activation of the cyclase. W94A and to a lesser extent K85E were also able to displace the activator effect of the WT GCAP1, even though much higher concentrations of both mutants was required to achieve the EC50 dose (5 and 10 μm, respectively).
FIGURE 8.

The M26R, W94A, and K85E GCAP1 compete with wild type in theRetGC1 assay. RetGC1 activated half-way by 1 μm WT GCAP1 in the presence of 10 mm Mg2+ and 2 mm EGTA was assayed in the presence of increasing concentrations of the following GCAP1 mutants: M26R (○); F73E (●); P30Y (♢); Y37R (■); K85E (♦); R93E (□); and W94A (▴), empirical curve fit.
Dissimilar to the M26R, W94A and K85E, mutants that failed to activate RetGC1 in vitro and co-localize with the target enzyme in HEK293 cells (F73E, R93E, P30Y, and E37R) were unable to compete with the WT GCAP1 even at concentrations as high as 20 μm (Fig. 7). Again, neither M26R, nor W94A, nor K85E underwent nonspecific misfolding as a result of the point mutations, because the stoichiometry of Ca2+ binding remained normal (Fig. 7A). All three mutants retained their ability to bind to the cyclase and compete with the wild type, consistent with proper folding. In addition, we tested the M26R GCAP1 by NMR spectroscopy (Fig. 7E) and found no evidence that its overall backbone fold was compromised compared with that of the myristoylated wild type, GCAP1. These results argue that Met-26 contributes rather little to the primary binding, whereas Trp-94 and Lys-85 contribute to the primary binding of GCAP1 to RetGC1 less than many other residues, creating the cyclase-binding interface; instead, all three residues are very important for maintaining the proper secondary interactions required for the cyclase activation.
DISCUSSION
The Map of RetGC1-binding Interface in GCAP1
Functional analysis of several mutations in different regions of the GCAP1 molecule combined with the NMR spectroscopy (56) demonstrated previously that the amplitude of chemical shift changes (between the activator and the inhibitor states) does not necessarily correlate with the importance of a particular residue for RetGC activation. Indeed, despite the relatively large chemical shift differences observed for Thr-27, Lys-142, and Leu-153, these residues were not sensitive to mutations that radically changed the properties of those side chains (56). In contrast, Lys-23, which shows a rather small chemical shift change, does not tolerate substitution without a severe loss of the activator capacity (56). Hence, functional identification of the residues forming the interface with the cyclase requires direct mutagenesis of the entire surface of the GCAP1 molecule.
In contrast to the Ca2+-myristoyl switch in recoverin (58, 59), GCAPs retain their fatty moiety inside the protein globule (24, 60). Moreover, GCAP1 does not undergo a major rearrangement of its main chain upon metal binding and displays rather modest Ca2+-induced changes in chemical shifts as detected by NMR spectroscopy for its inhibitor versus activator states (54, 56). Therefore, the crystal structure of Ca2+-bound GCAP1 (24) can be used to differentiate between the surface-exposed residues and those embedded into the hydrophobic core. It also needs to be noted that although several regions in GCAP1 have been shown previously not to tolerate substitution with corresponding residues from homologous NCS proteins (32), we mutated the surface residues in our present study in a non-biased fashion not contingent on the previous mapping. The results of such mapping are summarized in Fig. 9, which depicts the color-marked residues in the cyclase-binding interface superimposed on a crystal model of GCAP1 structure (24). The surface residues that do not tolerate substitution without at least a 50% loss in cyclase activation capacity (see Fig. 1B) or strong disruption of GCAP1 co-localization with RetGC1 in HEK293 cells (Figs. 4–6) are marked in red, whereas those residues that have little effect on the cyclase activity are marked in blue. The interface for the cyclase is located on one side of the GCAP1 molecule and is fairly compact. The most sensitive residues create a well defined region on the surface of the semi-globule I formed by EF-hand1 (α-helices α2 and α3 and the non-metal binding loop) as well as the loop and the exiting helix α5 of EF-hand 2, extending through the “hinge” region into the entering helix α6 of EF-hand 3 in semi-globule II (Figs. 1A and 9). Indications that the non-metal-binding EF-hand 1 is likely involved in target recognition emerged in earlier mapping attempts using substitutions of larger fragments in GCAP1 and GCAP2 molecules with those from homologous NCS proteins (47–49) well as a limited number of point mutations (61). The present analysis reveals that most of the target-binding interface is created by a nearly continuous patch on the surface of the adjacent portions of EF-hand 1 (Tyr-22, Lys-23, Lys-24, Met-26, Glu-28, Pro-30, Ser-31, Gly-32, Tyr-37, and Glu-38) and the metal-binding EF-hand 2 (Phe-73, Met-74, Val-77, and Ala-78). Cys-29 located in EF-hand 1 loop is the only Cys residue in GCAP1 contributing to the GCAP1 interface for the target enzyme (Fig. 3). This is consistent with the previous observations that Cys in the EF-hand 1 loop is important for cyclase activation (49, 61). In striking contrast, position 27 (blue in Fig. 9) in the middle of EF-1 loop of the binding patch shows little involvement in cyclase binding and activation (Ref. 56 and Figs. 1, B and C, 2A, and 4E). This indicates that when the complex between GCAP1 and RetGC1 is formed, Thr-27 likely faces an opening in the RetGC1 structure rather than forming a tight contact with the target.
FIGURE 9.

Functional map of the RetGC1-binding interface in GCAP1 three-dimensional structure. A, The RetGC-binding interface is located in a well defined patch of amino acid residues on one side of the GCAP1 molecule. In the template based on the crystal structure of myristoylated GCAP1 (24), those mutated residues for which the RetGC1 activation fell to ≤50% of threshold in Fig. 1B are marked in red (near the threshold, dark red; below 25% normal, bright red and magenta) and those above the threshold are marked in blue. The non-mutated residues are shown in gray, the Ca2+ ions in cyan, and the myristoyl moiety (myr) in black. The model was rotated in three 90° steps. EF-1 through EF-4 mark the respective EF-hand domains. B, close-up views of the cyclase-binding interface shown in A at two different angles. The residues comprising the binding patch are marked in red as above and labeled. Met-26, Trp-94, and Lys-85, marked in magenta, show the position of the residues inside the binding patch that were critical for the cyclase activation but not (or at least not only) through the disruption of the primary binding but rather through affecting the secondary interactions. The Thr-27 (blue) in the middle of the EF-hand 1 portion of the binding patch is very tolerant to the changes in charge and length of the side chain, unlike the surrounding residues. Other explanations are given under “Discussion.”
Our analysis further revealed that the loop of EF-hand 2 also contributes to the cyclase-binding interface. Two side chains in that loop, Phe-73 and Met-74, which face outward and do not participate in coordination of the metal ion (24), both affect the cyclase binding such that the F73E GCAP1 completely loses its ability to bind and activate the target (Figs. 1B, 2B, 5A, and Table 3). The binding patch in GCAP1 extends from the EF-2 loop to the exiting helix α5 of EF-hand 2 and the entering helix α6 of EF-3. The hinge region between the two semi-globules in the GCAPs has been implicated in cyclase regulation (32, 47). We found that three non-charged residues exposed on the surface of exiting helix α5 of EF-2 (Met-74, Val-77, and Ala-78) participate in the cyclase binding. Val-77 and Ala-78 are particularly important, because their replacement with the negatively charged Glu blocks RetGC1 binding entirely (Figs. 1B, 2B, and 5, B and C). Lys-85 in the hinge region and Arg93, Trp-94, and Lys-97 in the entering helix α6 of the EF-hand 3 all contribute strongly to RetGC1 activation, but apparently through different mechanisms, as we discuss further below. It is also important to emphasize that none of the tested mutations that caused complete loss of GCAP1 activation showed any evidence of a nonspecific unfolding of the GCAP1 molecule (Fig. 7). For example, even after reversing the charge of the side chain (such as in K85E and other mutants we tested) the Ca2+ binding stoichiometry and NMR spectra remain perfectly intact; this argues that the inactivation of such mutants could rather result from breaking electrostatic interactions with the target enzyme. That could either shift the equilibrium between the activated versus inactivated states of the cyclase or might, given the severe inactivating effect of the K85E mutation, completely abolish the necessary activation step that utilizes a specific charge in that position.
Earlier studies using chemical cross-linking of Cys residues (62) indicate that the entering helix α2 of EF-hand 1 and the entering helix α6 of EF-hand 3 both come in proximity with the RetGC1 surface. This is consistent with our present findings, because Cys-18, although not essential for the binding itself, is located fairly close to the residues of major importance for the interface, Tyr-22, Val-77, and Ala-78. The Cys-106 in the loop of EF-3 itself is not essential for binding to the target but is located not far from Ser-152, which moderately contributes to the binding, and on the same side as Arg-93 and Lys-97 in the entering helix of EF-3. So it is possible that Cys-106 becomes proximal to the RetGC1 surface once the complex is established through the binding patch in GCAP1. Interestingly, Cys-29 has not been reported among the products of chemical cross-linking between RetGC1 and GCAP1 (62), in contrast to our functional data indicating that Cys-29 is an essential part of the cyclase-binding interface (Fig. 3). We reasoned that GCAP1 binding to the cyclase is so intolerant to alkylation of the Cys-29 that modification of this residue by a cross-linking agent could itself prevent binding of the Cys-29-modified GCAP1 to the cyclase (Fig. 3).
In contrast to the other three EF-hands, EF-4 and the surface of helices α10 and α11 (Fig. 1) show little involvement in target binding. Only one residue in this region, Ser-152, responded to substitution by decreasing cyclase activation down to 40% of the WT level, just below the 50% criterion threshold (Fig. 1B). The S152E mutant indeed displayed an apparent, although relatively modest, increase in the K1/2 for RetGC1 activation (Fig. 2). Naturally, it is also important to remember that EF-4 still remains a critical Ca2+ sensor part of the molecule, responsible for converting GCAP1 into its inhibitor state and affecting the neighboring EF-hand 3 (9, 10). Moreover, mutated EF-4 can even turn GCAP1 into a Ca2+-insensitive constitutive activator of the cyclase causing photoreceptor degeneration (30, 43). Yet, despite being an essential EF-hand for switching the cyclase on and off by the conformational changes induced by Ca2+ binding, the surface of EF-hand 4 contributes rather little to the binding of RetGC1. Interestingly, a chimera protein comprising the semi-globule I from GCAP1 and semi-globule II from GCAP2 (47) activates RetGC1 just like WT GCAP1, despite the substantial difference in the C-terminal sequence between the two GCAPs. This is fully consistent with the lack of strong inactivation of GCAP1 by various single point mutations on the surface of semi-globule II in GCAP1 and argues that those side chains in semi-globule II that are drastically different between the two GCAPs are not essential for the binding interaction with the cyclase.
GCAP1 Binding to the Cyclase Does Not Equal Target Activation, as GCAP1 Activates RetGC by a Two-step Mechanism
RetGC1 is active as a homodimer, because the two active sites in the catalytic domain of the enzyme are formed by two catalytic subunits, each providing one Mg2+ binding and one GTP binding site for the two complementing each other active sites (45, 63). The binding of GCAP1 enhances RetGC dimerization in the complex to promote cyclase activation (64). Two possible thermodynamic mechanisms could explain the activation: (i) the primary binding itself provides the necessary free energy to stimulate RetGC1, or (ii) primary binding itself is not sufficient for activation and some important secondary interactions or allosteric effects are provided in a second step once the complex with the cyclase is formed. Our mutational analysis of Met-26, Lys-85, and Trp-94 provide evidence in favor of the latter scenario. The most intriguing observation of this study is that a few residues (Met-26, Lys-85, and Trp-94, marked in magenta in Fig. 9) located near the binding patch are crucial for cyclase activation but are either not essential (Met-26) or less critical for binding to RetGC1 than many other residues nearby. In other words, mutation of these residues (M26R, K85E, or W94A) abolishes cyclase activation but does not eliminate cyclase binding. Hence, they could affect cyclase activation indirectly by some secondary interaction. For example, GCAP1 activation of RetGC might occur in two steps, where the first step involves direct binding of GCAP1 to RetGC (see residues in red in Fig. 9) followed by a second step that promotes an induced-fit or secondary contact by Met-26, Lys-85, and Trp-94 required for activation. In this two-step mechanism, mutation of Met-26, Lys-85, or Trp-94 would have little effect on the first step of binding but could strongly affect secondary contacts that form during the second step.
The involvement of secondary interactions would be consistent with the observation that GCAPs bind similarly to RetGC in both Ca2+- and Mg2+-saturated forms, yet only Ca2+-free/Mg2+-bound GCAP activates the cyclase (11, 65, 66). The first binding step would be similar for both Ca2+-bound and Ca2+-free GCAP1, but the secondary contacts induced in the second step could be different for activation (Ca2+-free GCAP1) versus inhibition (Ca2+-bound GCAP1). To some extent, Trp-94 and Lys-85 might be involved in both the primary binding and the secondary contacts, because the W94A GCAP1 and K85E GCAP1 compete with the wild type GCAP1 much less efficiently than M26R (Fig. 8). Thus, Met-26 does not appear to be essential for primary binding at all, and its replacement affects only the RetGC activation (Figs. 2A, 4D, and 7). The precise mechanism of activation by Met-26 during the second step remains unclear, because the structure of the RetGC1-GCAP1 complex is unknown. However, there is a possible structural link to metal binding in GCAP1. Met-26 is in close proximity to the Ca2+/Mg2+ binding site in EF-2, and the disposition of the Met-26 side chain could be affected by Ca2+ binding or replacement with Mg2+ in the process of cyclase regulation. Also, Trp-94 fluorescence is strongly affected by metal binding in the neighboring EF-hand 4 (10). This is consistent with EPR spectroscopy analysis (67) indicating movement in that part of the molecule in response to metal binding. Moreover, molecular modeling predicts that the Trp-94 side chain would likely alter its orientation between the activator and the inhibitor states of GCAP1 (56). Conceivably, changing the orientation of the Trp side chain could provide a possible “push-button” action within the RetGC1-GCAP1 complex.
Previous mapping of the regions in GCAP primary structures by larger fragment substitutions also implicate a portion adjacent to the exiting helix in EF-hand 4 as a possible part of the interface for the cyclase (32, 47). To our surprise, we found little evidence that either EF-4 or the adjacent C-terminal portions of the molecule were strongly involved in forming the interface. Why then would the replacement of EF-4 and adjacent C-terminal region with corresponding residues from other NCS proteins affect the ability of the Ca2+-free GCAP1 to activate the cyclase? A possible explanation is that EF-4 is connected to the semi-globule I (Fig. 1A) via two α-helical stretches protruding into the opposite side of the molecule and contacting the myristoyl moiety inside the N-terminal semi-globule I (24). We recently demonstrated that this connection likely creates a “calcium-myristoyl tug” action (50, 51) improving the affinity of GCAP1 for RetGC1. Therefore, altering the “tug” portion in GCAP1 could affect the interface with the cyclase formed by semi-globule I, even though the tug portion of the molecule itself does not form a direct contact with the cyclase.
In conclusion, our results have identified the functional interface with the target enzyme in GCAP1 as a binding patch on one side of the molecule; this region is solely responsible for the binding with RetGC1 that occurs via amino acid residues on the surfaces of EF-hand 1, the loop, and the exiting helix of EF-hand 2 and entering helix of EF-hand 3. Another important conclusion from this study is that a few residues near the binding patch (Met-26, Lys-85, and Trp-94) are critically important for activation of the cyclase, but mutations of these residues do not prevent binding to RetGC1. We propose a two-step mechanism, in which the first step involves primary binding to RetGC via the binding patch (highlighted in red in Fig. 9) followed by a second step that induces secondary contacts important for cyclase activation involving Met-26, Lys-85, and Trp-94.
This work was supported, in whole or in part, by National Institutes of Health Grants EY11522 (to A. M. D.) and EY012347 (to J. B. A.) from NEI. This work was also supported by a CURE Formula Grant (to A. M. D.) from the Pennsylvania Department of Health.
- RetGC
- retinal membrane guanylyl cyclase
- GCAP
- guanylyl cyclase-activating protein
- NEM
- N-ethylmaleimide
- NCS
- neuronal calcium sensor
- PCC
- Pearson correlation coefficient.
REFERENCES
- 1. Koch K. W., Stryer L. (1988) Highly cooperative feedback control of retinal rod guanylate cyclase by calcium ions. Nature 334, 64–66 [DOI] [PubMed] [Google Scholar]
- 2. Mendez A., Burns M. E., Sokal I., Dizhoor A. M., Baehr W., Palczewski K., Baylor D. A., Chen J. (2001) Role of guanylate cyclase-activating proteins (GCAPs) in setting the flash sensitivity of rod photoreceptors. Proc. Natl. Acad. Sci. U.S.A. 98, 9948–9953 [DOI] [PMC free article] [PubMed] [Google Scholar]
- 3. Pugh E. N., Jr., Duda T., Sitaramayya A., Sharma R. K. (1997) Photoreceptor guanylate cyclases: a review. Biosci. Rep. 17, 429–473 [DOI] [PubMed] [Google Scholar]
- 4. Burns M. E., Mendez A., Chen J., Baylor D. A. (2002) Dynamics of cyclic GMP synthesis in retinal rods. Neuron 36, 81–91 [DOI] [PubMed] [Google Scholar]
- 5. Takemoto N., Tachibanaki S., Kawamura S. (2009) High cGMP synthetic activity in carp cones. Proc. Natl. Acad. Sci. U.S.A. 106, 11788–11793 [DOI] [PMC free article] [PubMed] [Google Scholar]
- 6. Sakurai K., Chen J., Kefalov V. J. (2011) Role of guanylyl cyclase modulation in mouse cone phototransduction. J. Neurosci. 31, 7991–8000 [DOI] [PMC free article] [PubMed] [Google Scholar]
- 7. Gray-Keller M. P., Detwiler P. B. (1994) The calcium feedback signal in the phototransduction cascade of vertebrate rods. Neuron 13, 849–861 [DOI] [PubMed] [Google Scholar]
- 8. Woodruff M. L., Sampath A. P., Matthews H. R., Krasnoperova N. V., Lem J., Fain G. L. (2002) Measurement of cytoplasmic calcium concentration in the rods of wild-type and transducin knock-out mice. J. Physiol. 542, 843–854 [DOI] [PMC free article] [PubMed] [Google Scholar]
- 9. Peshenko I. V., Dizhoor A. M. (2004) Guanylyl cyclase-activating proteins (GCAPs) are Ca2+/Mg2+ sensors: implications for photoreceptor guanylyl cyclase (RetGC) regulation in mammalian photoreceptors. J. Biol. Chem. 279, 16903–16906 [DOI] [PubMed] [Google Scholar]
- 10. Peshenko I. V., Dizhoor A. M. (2006) Ca2+ and Mg2+ binding properties of GCAP-1: evidence that Mg2+-bound form is the physiological activator of photoreceptor guanylyl cyclase. J. Biol. Chem. 281, 23830–23841 [DOI] [PubMed] [Google Scholar]
- 11. Peshenko I. V., Dizhoor A. M. (2007) Activation and inhibition of photoreceptor guanylyl cyclase by guanylyl cyclase activating protein 1 (GCAP-1): the functional role of Mg2+/Ca2+ exchange in EF-hand domains. J. Biol. Chem. 282, 21645–21652 [DOI] [PMC free article] [PubMed] [Google Scholar]
- 12. Dizhoor A. M., Olshevskaya E. V., Peshenko I.V. (2010) Mg2+/Ca2+ cation binding cycle of guanylyl cyclase activating proteins (GCAPs): role in regulation of photoreceptor guanylyl cyclase. Mol. Cell. Biochem. 334, 117–124 [DOI] [PMC free article] [PubMed] [Google Scholar]
- 13. Dizhoor A. M., Lowe D. G., Olshevskaya E. V., Laura R. P., Hurley J. B. (1994) The human photoreceptor membrane guanylyl cyclase, RetGC, is present in outer segments and is regulated by calcium and a soluble activator. Neuron 12, 1345–1352 [DOI] [PubMed] [Google Scholar]
- 14. Lowe D. G., Dizhoor A. M., Liu K., Gu Q., Spencer M., Laura R., Lu L., Hurley J. B. (1995) Cloning and expression of a second photoreceptor-specific membrane retina guanylyl cyclase (RetGC), RetGC-2. Proc. Natl. Acad. Sci. U.S.A. 92, 5535–5539 [DOI] [PMC free article] [PubMed] [Google Scholar]
- 15. Yang R. B., Foster D. C., Garbers D. L., Fülle H. J. (1995) Two membrane forms of guanylyl cyclase found in the eye. Proc. Natl. Acad. Sci. U.S.A. 92, 602–606 [DOI] [PMC free article] [PubMed] [Google Scholar]
- 16. Baehr W., Karan S., Maeda T., Luo D. G., Li S., Bronson J. D., Watt C. B., Yau K. W., Frederick J. M., Palczewski K. (2007) The function of guanylate cyclase 1 and guanylate cyclase 2 in rod and cone photoreceptors. J. Biol. Chem. 282, 8837–8847 [DOI] [PMC free article] [PubMed] [Google Scholar]
- 17. Peshenko I. V., Olshevskaya E. V., Savchenko A. B., Karan S., Palczewski K., Baehr W., Dizhoor A. M. (2011) Enzymatic properties and regulation of the native isozymes of retinal membrane guanylyl cyclase (RetGC) from mouse photoreceptors. Biochemistry 50, 5590–5600 [DOI] [PMC free article] [PubMed] [Google Scholar]
- 18. Imanishi Y., Yang L., Sokal I., Filipek S., Palczewski K., Baehr W. (2004) Diversity of guanylate cyclase-activating proteins (GCAPs) in teleost fish: characterization of three novel GCAPs (GCAP4, GCAP5, GCAP7) from zebrafish (Danio rerio) and prediction of eight GCAPs (GCAP1–8) in pufferfish (Fugu rubripes). J. Mol. Evol. 59, 204–217 [DOI] [PMC free article] [PubMed] [Google Scholar]
- 19. Scholten A., Koch K. W. (2011) Differential calcium signaling by cone-specific guanylate cyclase-activating proteins from the zebrafish retina. PLoS One 6, e23117. [DOI] [PMC free article] [PubMed] [Google Scholar]
- 20. Palczewski K., Subbaraya I., Gorczyca W. A., Helekar B. S., Ruiz C. C., Ohguro H., Huang J., Zhao X., Crabb J. W., Johnson R. S., Walsh K. A., Gray-Keller M. P., Detwiller P. B., Baehr W. (1994) Molecular cloning and characterization of retinal photoreceptor guanylyl cyclase-activating protein. Neuron 13, 395–404 [DOI] [PubMed] [Google Scholar]
- 21. Dizhoor A. M., Olshevskaya E. V., Henzel W. J., Wong S. C., Stults J. T., Ankoudinova I., Hurley J. B. (1995) Cloning, sequencing, and expression of a 24-kDa Ca(2+)-binding protein activating photoreceptor guanylyl cyclase. J. Biol. Chem. 270, 25200–25206 [DOI] [PubMed] [Google Scholar]
- 22. Ames J. B., Dizhoor A. M., Ikura M., Palczewski K., Stryer L. (1999) Three-dimensional structure of guanylyl cyclase activating protein-2, a calcium-sensitive modulator of photoreceptor guanylyl cyclases. J. Biol. Chem. 274, 19329–19337 [DOI] [PubMed] [Google Scholar]
- 23. Stephen R., Palczewski K., Sousa M. C. (2006) The crystal structure of GCAP3 suggests molecular mechanism of GCAP-linked cone dystrophies. J. Mol. Biol. 359, 266–275 [DOI] [PMC free article] [PubMed] [Google Scholar]
- 24. Stephen R., Bereta G., Golczak M., Palczewski K., Sousa M. C. (2007) Stabilizing function for myristoyl group revealed by the crystal structure of a neuronal calcium sensor, guanylate cyclase-activating protein 1. Structure 15, 1392–1402 [DOI] [PMC free article] [PubMed] [Google Scholar]
- 25. Makino C. L., Peshenko I. V., Wen X. H., Olshevskaya E. V., Barrett R., Dizhoor A. M. (2008) A role for GCAP2 in regulating the photoresponse: guanylyl cyclase activation and rod electrophysiology in GUCA1B knock-out mice. J. Biol. Chem. 283, 29135–29143 [DOI] [PMC free article] [PubMed] [Google Scholar]
- 26. Makino C. L., Wen X. H., Olshevskaya E. V., Peshenko I. V., Savchenko A. B., Dizhoor A. M. (2012) Enzymatic relay mechanism stimulates cyclic GMP synthesis in rod photoresponse: biochemical and physiological study in guanylyl cyclase-activating protein 1 knockout mice. PLoS One 7, e47637. [DOI] [PMC free article] [PubMed] [Google Scholar]
- 27. Olshevskaya E. V., Peshenko I. V., Savchenko A. B., Dizhoor A. M. (2012) Retinal guanylyl cyclase isozyme 1 is the preferential in vivo target for constitutively active GCAP1 mutants causing congenital degeneration of photoreceptors. J. Neurosci. 32, 7208–7217 [DOI] [PMC free article] [PubMed] [Google Scholar]
- 28. Xu J., Morris L., Thapa A., Ma H., Michalakis S., Biel M., Baehr W., Peshenko I. V., Dizhoor A. M., Ding X.Q. (2013) cGMP accumulation causes photoreceptor degeneration in CNG channel deficiency: evidence of cGMP cytotoxicity independently of enhanced CNG channel function. J. Neurosci. 33, 14939–14948 [DOI] [PMC free article] [PubMed] [Google Scholar]
- 29. Payne A. M., Downes S. M., Bessant D. A., Taylor R., Holder G. E., Warren M. J., Bird A. C., Bhattacharya S. S. (1998) A mutation in guanylate cyclase activator 1A (GUCA1A) in an autosomal dominant cone dystrophy pedigree mapping to a new locus on chromosome 6p21.1. Hum Mol. Genet. 7, 273–277 [DOI] [PubMed] [Google Scholar]
- 30. Wilkie S. E., Li Y., Deery E. C., Newbold R. J., Garibaldi D., Bateman J. B., Zhang H., Lin W., Zack D. J., Bhattacharya S. S., Warren M. J., Hunt D. M., Zhang K. (2001) Identification and functional consequences of a new mutation (E155G) in the gene for GCAP1 that causes autosomal dominant cone dystrophy. Am. J. Hum. Genet. 69, 471–480 [DOI] [PMC free article] [PubMed] [Google Scholar]
- 31. Sato M., Nakazawa M., Usui T., Tanimoto N., Abe H., Ohguro H. (2005) Mutations in the gene coding for guanylate cyclase-activating protein 2 (GUCA1B gene) in patients with autosomal dominant retinal dystrophies. Graefes Arch. Clin. Exp. Ophthalmol. 243, 235–242 [DOI] [PubMed] [Google Scholar]
- 32. Kitiratschky V. B., Behnen P., Kellner U., Heckenlively J. R., Zrenner E., Jägle H., Kohl S., Wissinger B., Koch K. W. (2009) Mutations in the GUCA1A gene involved in hereditary cone dystrophies impair calcium-mediated regulation of guanylate cyclase. Hum. Mutat. 30, E782–E796 [DOI] [PubMed] [Google Scholar]
- 33. Jiang L., Zhang H., Dizhoor A. M., Boye S. E., Hauswirth W. W., Frederick J. M., Baehr W. (2011) Long-term RNA interference gene therapy in a dominant retinitis pigmentosa mouse model. Proc. Natl. Acad. Sci. U.S.A. 108, 18476–18481 [DOI] [PMC free article] [PubMed] [Google Scholar]
- 34. Perrault I., Rozet J. M., Gerber S., Kelsell R. E., Souied E., Cabot A., Hunt D. M., Munnich A., Kaplan J. (1998) A retGC-1 mutation in autosomal dominant cone-rod dystrophy. Am. J. Hum. Genet. 63, 651–654 [DOI] [PMC free article] [PubMed] [Google Scholar]
- 35. Stone E. M. (2007) Leber congenital amaurosis, a model for efficient genetic testing of heterogeneous disorders: LXIV Edward Jackson Memorial Lecture. Am. J. Ophthalmol. 144, 791–811 [DOI] [PubMed] [Google Scholar]
- 36. Kelsell R. E., Gregory-Evans K., Payne A. M., Perrault I., Kaplan J., Yang R. B., Garbers D. L., Bird A. C., Moore A. T., Hunt D. M. (1998) Mutations in the retinal guanylate cyclase (RETGC-1) gene in dominant cone-rod dystrophy. Hum. Mol. Genet. 7, 1179–1184 [DOI] [PubMed] [Google Scholar]
- 37. Perrault I., Rozet J. M., Calvas P., Gerber S., Camuzat A., Dollfus H., Châtelin S., Souied E., Ghazi I., Leowski C., Bonnemaison M., Le Paslier D., Frézal J., Dufier J. L., Pittler S., Munnich A., Kaplan J. (1996) Retinal-specific guanylate cyclase gene mutations in Leber's congenital amaurosis. Nat. Genet. 14, 461–464 [DOI] [PubMed] [Google Scholar]
- 38. Peshenko I. V., Olshevskaya E. V., Yao S., Ezzeldin H. H., Pittler S. J., Dizhoor A. M. (2010) Activation of retinal guanylyl cyclase RetGC1 by GCAP1: stoichiometry of binding and effect of new LCA-related mutations. Biochemistry 49, 709–717 [DOI] [PMC free article] [PubMed] [Google Scholar]
- 39. Jacobson S. G., Cideciyan A. V., Peshenko I. V., Sumaroka A., Olshevskaya E. V., Cao L., Schwartz S. B., Roman A. J., Olivares M. B., Sadigh S., Yau K. W., Heon E., Stone E. M., Dizhoor A. M. (2013) Determining consequences of retinal membrane guanylyl cyclase (RetGC1) deficiency in human Leber congenital amaurosis en route to therapy: residual cone-photoreceptor vision correlates with biochemical properties of the mutants. Hum. Mol Genet. 22, 168–183 [DOI] [PMC free article] [PubMed] [Google Scholar]
- 40. Dizhoor A. M., Boikov S. G., Olshevskaya E. V. (1998) Constitutive activation of photoreceptor guanylate cyclase by Y99C mutant of GCAP-1: possible role in causing human autosomal dominant cone degeneration. J. Biol. Chem. 273, 17311–17314 [DOI] [PubMed] [Google Scholar]
- 41. Sokal I., Dupps W. J., Grassi M. A., Brown J., Jr., Affatigato L. M., Roychowdhury N., Yang L., Filipek S., Palczewski K., Stone E. M., Baehr W. (2005) A novel GCAP1 missense mutation (L151F) in a large family with autosomal dominant cone-rod dystrophy (adCORD). Invest. Ophthalmol. Vis. Sci. 46, 1124–1132 [DOI] [PMC free article] [PubMed] [Google Scholar]
- 42. Olshevskaya E. V., Calvert P. D., Woodruff M. L., Peshenko I. V., Savchenko A. B., Makino C. L., Ho Y. S., Fain G. L., Dizhoor A. M. (2004) The Y99C mutation in guanylyl cyclase-activating protein 1 increases intracellular Ca2+ and causes photoreceptor degeneration in transgenic mice. J. Neurosci. 24, 6078–6085 [DOI] [PMC free article] [PubMed] [Google Scholar]
- 43. Woodruff M. L., Olshevskaya E. V., Savchenko A. B., Peshenko I. V., Barrett R., Bush R. A., Sieving P. A., Fain G. L., Dizhoor A. M. (2007) Constitutive excitation by Gly90Asp rhodopsin rescues rods from degeneration caused by elevated production of cGMP in the dark. J. Neurosci. 27, 8805–8815 [DOI] [PMC free article] [PubMed] [Google Scholar]
- 44. Tucker C. L., Woodcock S. C., Kelsell R. E., Ramamurthy V., Hunt D. M., Hurley J. B. (1999) Biochemical analysis of a dimerization domain mutation in RetGC-1 associated with dominant cone-rod dystrophy. Proc. Natl. Acad. Sci. U.S.A. 96, 9039–9044 [DOI] [PMC free article] [PubMed] [Google Scholar]
- 45. Ramamurthy V., Tucker C., Wilkie S. E., Daggett V., Hunt D. M., Hurley J. B. (2001) Interactions within the coiled-coil domain of RetGC-1 guanylyl cyclase are optimized for regulation rather than for high affinity. J. Biol. Chem. 276, 26218–26229 [DOI] [PubMed] [Google Scholar]
- 46. Peshenko I. V., Moiseyev G. P., Olshevskaya E. V., Dizhoor A. M. (2004) Factors that determine Ca2+ sensitivity of photoreceptor guanylyl cyclase: kinetic analysis of the interaction between the Ca2+-bound and the Ca2+-free guanylyl cyclase-activating proteins (GCAPs) and recombinant photoreceptor guanylyl cyclase 1 (RetGC-1). Biochemistry 43, 13796–13804 [DOI] [PubMed] [Google Scholar]
- 47. Olshevskaya E. V., Boikov S., Ermilov A., Krylov D., Hurley J. B., Dizhoor A. M. (1999) Mapping functional domains of the guanylate cyclase regulator protein, GCAP-2. J. Biol. Chem. 274, 10823–10832 [DOI] [PubMed] [Google Scholar]
- 48. Zinchuk V, Zinchuk O. (2008) Quantitative colocalization analysis of confocal fluorescence microscopy images. Curr. Protoc. Cell Biol. 39, 4.19.1–4.19.15 [DOI] [PubMed] [Google Scholar]
- 49. Hwang J. Y., Schlesinger R., Koch K. W. (2004) Irregular dimerization of guanylate cyclase-activating protein 1 mutants causes loss of target activation. Eur. J. Biochem. 271, 3785–3793 [DOI] [PubMed] [Google Scholar]
- 50. Peshenko I. V., Olshevskaya E. V., Lim S., Ames J. B., Dizhoor A. M. (2012) Calcium-myristoyl Tug is a new mechanism for intramolecular tuning of calcium sensitivity and target enzyme interaction for guanylyl cyclase-activating protein 1: dynamic connection between N-fatty acyl group and EF-hand controls calcium sensitivity. J. Biol. Chem. 287, 13972–13984 [DOI] [PMC free article] [PubMed] [Google Scholar]
- 51. Peshenko I. V., Olshevskaya E. V., Dizhoor A. M. (2012) Interaction of GCAP1 with retinal guanylyl cyclase and calcium: sensitivity to fatty acylation. Front. Mol. Neurosci. 5, 19. [DOI] [PMC free article] [PubMed] [Google Scholar]
- 52. Peshenko I. V., Olshevskaya E. V., Dizhoor A. M. (2008) Binding of guanylyl cyclase activating protein 1 (GCAP1) to retinal guanylyl cyclase (RetGC1). The role of individual EF-hands. J. Biol. Chem. 283, 21747–21757 [DOI] [PMC free article] [PubMed] [Google Scholar]
- 53. Laura R. P., Dizhoor A. M., Hurley J. B. (1996) The membrane guanylyl cyclase, retinal guanylyl cyclase-1, is activated through its intracellular domain. J. Biol. Chem. 271, 11646–11651 [DOI] [PubMed] [Google Scholar]
- 54. Lim S., Peshenko I., Dizhoor A., Ames J. B. (2009) Effects of Ca2+, Mg2+, and myristoylation on guanylyl cyclase-activating protein 1 structure and stability. Biochemistry 48, 850–862 [DOI] [PMC free article] [PubMed] [Google Scholar]
- 55. Lim S., Peshenko I. V., Dizhoor A. M., Ames J. B. (2013) Backbone (1)H, (13)C, and (15)N resonance assignments of guanylyl cyclase activating protein-1, GCAP1. Biomol. NMR Assign. 7, 39–42 [DOI] [PMC free article] [PubMed] [Google Scholar]
- 56. Lim S., Peshenko I. V., Dizhoor A. M., Ames J. B. (2013) Structural insights for activation of retinal guanylate cyclase by GCAP1. PLoS One 8, e 81822, 1–13 [DOI] [PMC free article] [PubMed] [Google Scholar]
- 57. Delaglio F., Grzesiek S., Vuister G. W., Zhu G., Pfeifer J., Bax A. (1995) NMRPipe: a multidimensional spectral processing system based on UNIX pipes. J. Biomol. NMR 6, 277–293 [DOI] [PubMed] [Google Scholar]
- 58. Ames J. B., Ishima R., Tanaka T., Gordon J. I., Stryer L., Ikura M. (1997) Molecular mechanics of calcium-myristoyl switches. Nature 389, 198–202 [DOI] [PubMed] [Google Scholar]
- 59. Ames J. B., Lim S. (2012) Molecular structure and target recognition of neuronal calcium sensor proteins. Biochim. Biophys. Acta 1820, 1205–1213 [DOI] [PMC free article] [PubMed] [Google Scholar]
- 60. Hughes R. E., Brzovic P. S., Dizhoor A. M., Klevit R. E., Hurley J. B. (1998) Ca2+-dependent conformational changes in bovine GCAP-2. Protein Sci. 7, 2675–2680 [DOI] [PMC free article] [PubMed] [Google Scholar]
- 61. Ermilov A. N., Olshevskaya E. V., Dizhoor A. M. (2001) Instead of binding calcium, one of the EF-hand structures in guanylyl cyclase activating protein-2 is required for targeting photoreceptor guanylyl cyclase. J. Biol. Chem. 276, 48143–48148 [DOI] [PubMed] [Google Scholar]
- 62. Krylov D. M., Hurley J. B. (2001) Identification of proximate regions in a complex of retinal guanylyl cyclase 1 and guanylyl cyclase-activating protein-1 by a novel mass spectrometry-based method. J. Biol. Chem. 276, 30648–30654 [DOI] [PubMed] [Google Scholar]
- 63. Liu Y., Ruoho A. E., Rao V. D., Hurley J. H. (1997) Catalytic mechanism of the adenylyl and guanylyl cyclases: modeling and mutational analysis. Proc. Natl. Acad. Sci. U.S.A. 94, 13414–13419 [DOI] [PMC free article] [PubMed] [Google Scholar]
- 64. Yu H., Olshevskaya E., Duda T., Seno K., Hayashi F., Sharma R. K., Dizhoor A. M., Yamazaki A. (1999) Activation of retinal guanylyl cyclase-1 by Ca2+-binding proteins involves its dimerization. J. Biol. Chem. 274, 15547–15555 [DOI] [PubMed] [Google Scholar]
- 65. Laura R. P., Hurley J. B. (1998) The kinase homology domain of retinal guanylyl cyclases 1 and 2 specifies the affinity and cooperativity of interaction with guanylyl cyclase activating protein-2. Biochemistry 37, 11264–11271 [DOI] [PubMed] [Google Scholar]
- 66. Dizhoor A. M., Hurley J. B. (1996) Inactivation of EF-hands makes GCAP-2 (p24) a constitutive activator of photoreceptor guanylyl cyclase by preventing a Ca2+-induced “activator-to-inhibitor” transition. J. Biol. Chem. 271, 19346–19350 [DOI] [PubMed] [Google Scholar]
- 67. Sokal I., Li N., Klug C. S., Filipek S., Hubbell W. L., Baehr W., Palczewski K. (2001) Calcium-sensitive regions of GCAP1 as observed by chemical modifications, fluorescence, and EPR spectroscopies. J. Biol. Chem. 276, 43361–43373 [DOI] [PMC free article] [PubMed] [Google Scholar]