Abstract
Rhythms and timing control of sequential activity in the brain is fundamental to cognition and behavior. Although experimental and theoretical studies support the understanding that neuronal circuits are intrinsically capable of generating different time intervals, the dynamical origin of the phenomenon of functionally dependent timing control is still unclear. Here, we consider a new mechanism that is related to the multi-neuronal cooperative dynamics in inhibitory brain motifs consisting of a few clusters. It is shown that redundancy and diversity of neurons within each cluster enhances the sensitivity of the timing control with the level of neuronal excitation of the whole network. The generality of the mechanism is shown to work on two different neuronal models: a conductance-based model and a map-based model.
Interval timing in the seconds-to-minutes range is crucial in the creation of motor programming, learning, memory and decision making. Recent findings argue for the key role of inhibitory modulation in the cognitive networks that are involved in these processes. For the first time, we present the connection between interval timing control and the functional role of neuronal redundancy in the brain and, based on modeling experiments, we have confirmed our hypothesis that the variation of the excitation level of redundantly interacting inhibitory neurons in recurrent motifs results in interval timing control in a wide dynamical range.
INTRODUCTION
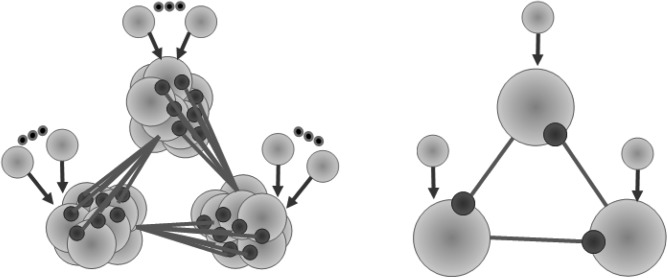
Performance of cognitive tasks like decision making, speech generation, and motor actions is planned over time and evolve over time. There are dynamical mechanisms in the brain that are responsible for timing control. Modern experiments support the view that the brain represents time intervals in a distributed manner and performs timing control by the cooperative activity of different neural populations.1, 2 In particular, it is shown that the striatum network is a “core timer” in such a distributed timing system.3 The interaction between a large number of inhibitory neurons results in fine-tuned temporal intervals.4 The striatum is composed of spiny neurons with inhibitory (GABAergic) collaterals forming a sparse random asymmetric network and receiving excitatory (glutamatergic) signaling from the cortex.5 In the model,2 it has been shown by simulation of a striatal inhibitory network that its cells form firing assemblies in the form of sequential bursts having a constant difference in phase and generate temporal patterns with some characteristic timescale even if the external excitatory input is constant. These results support a new view on the sequential information dynamics in the brain.6 The dynamical origin of the sequential assembly switching was also discussed before using the Winnerless Competition principle (WLC).7, 8, 9 Here, we use a striatum multineuronal inhibitory motif (see Fig. 1) as a modeling circuit to test our hypothesis about the dynamical origin of timing control in the brain. We assume that the redundancy of inhibitory neurons in a recurrent motif is playing an important functional role. We show that the changing of the excitation level of many inhibitory neurons led to a new cooperative effect, i.e., control of interval timing.
Figure 1.
The left panel shows a network model of switching between three externally excited inhibitory coupled groups of neurons with no synaptic connections among the neurons within each group. The right panel shows a similar inhibitory network model build with only three neurons.
We start by setting a network with three clusters of a functionally modulated number of excited spiking neurons with one directional inhibitory connections between clusters but no inhibitory connections within them (see Fig. 1). On the example of the sequential switching of these three clusters, we show here that the switching time is sensitively dependent on the number of inhibitory connections. To accomplish this, we carried out the computer analyses of the motif dynamics using two types of neuronal models—the first one consisting of conductance-based model neurons and the second one consisting of map-based neurons.
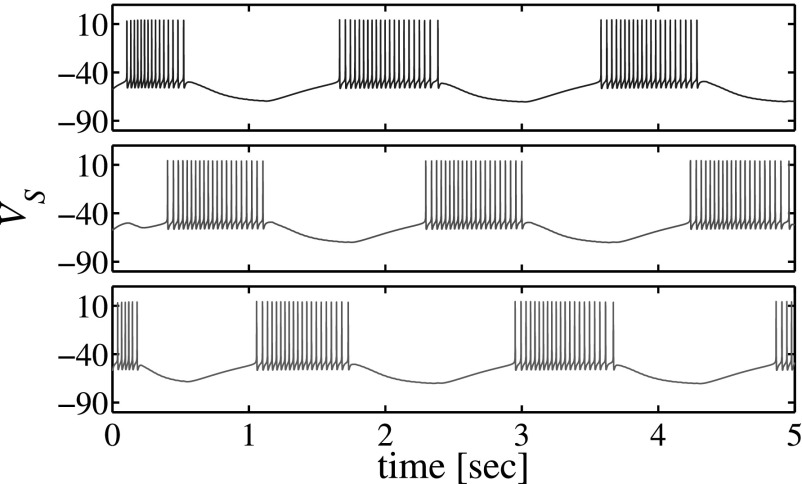
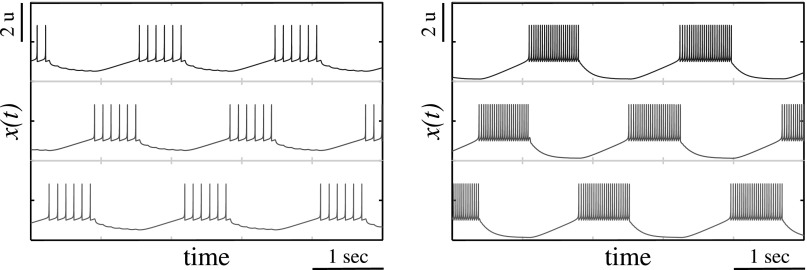
Each neuron that participates in the cluster dynamics is individually working in a tonic spiking regime. The activity of a individual neuron is controlled by an excitatory input. This motif is represented in Fig. 2 as a sequence of spiking bursts. In such types of networks, the behavior is frequently studied with a reduced network model where each group of similar neurons is modeled with a single neuron. This approach frequently helps to achieve the desired pattern of activity. However, it is still unknown how this reduction to the low-dimensional model affects the controllability of the network dynamics. Here, we answer the question of how a large number of neurons involved in the formation of sequential spiking bursting activity can facilitate such control.
Figure 2.
Pattern of switching activity in the three-neuron network for the conductance-based model with Vt = −56.00 mV and .
CONDUCTANCE-BASED MODEL
First, to demonstrate the dependence of the switching time on parameters of coupling in a simple inhibitory motif, see Fig. 1 (right panel), we used a conductance-based model. This model is capable of reproducing the main observed electrophysiological characteristics of a neuron from the hypothalamus network introduced in Ref. 10. This type of neuron has been implicated in neuroendocrine control, energy regulation and various aspects of autonomic function as well as in the sleep/wake cycle.
Two compartments are used in the model: one for the soma and dendrites (VS) and another one for the axon (VA). These dynamics are described by the following set of ODEs:
| (1a) |
| (1b) |
with capacitance CA = CS = 10 pF, VL = −45 mV, connecting conductance gAS = 65 nS and leakage conductance gL = 1.6 nS. The sodium current INa is modeled according to Refs. 11, 12 as
with
where the maximum conductance for sodium is gNa = 260 nS and Vt, the threshold for the excitability of the neuron, which generates an endogenous firing frequency about 3.1 Hz when leading to Vt = −52.35073 mV.10 As the threshold Vt decreases, the excitability of the neuron increases.
The delayed rectifier potassium current is
with
where . The potassium dependent on calcium current is
with . The dynamics of the activation variable is
with
The calcium dynamics are modeled by a first order kinetic equation driven by the calcium current as
where μ sets the degree of dissipation of the calcium concentration dynamics. We set μ = 1.6. The low threshold current is
where gh = 1.2 nS and
The calcium current is described using the Goldman-Hodgkin-Katz formalism to account for the large difference between the intracellular and extracellular calcium concentrations13, 14, 15, 16 as
where gCa = 8.8 nS. This current has a numerical instability at VS = 0. For computer simulation purposes, we make the first order expansion of ICa in the neighborhood of VS = 0 as
The time evolution of the activation variable is described by
The slow current that prevents the neuron from firing out of control, can be described as
with
with gA = 200 nS. Finally, Idc is the input current in nA. We model the synaptic connections of the network, Isyn in Eq. 1b, employing the simplest model for the activation of GABAB synapses.17 There is a receptor R which activates the ion channel, G, and results in the GABAB current which is a nonlinear saturating function of the protein G:
| (2) |
with
with potassium reversal potential Ek = −95 mV, , p = 4, and [T] is the transmitter release.
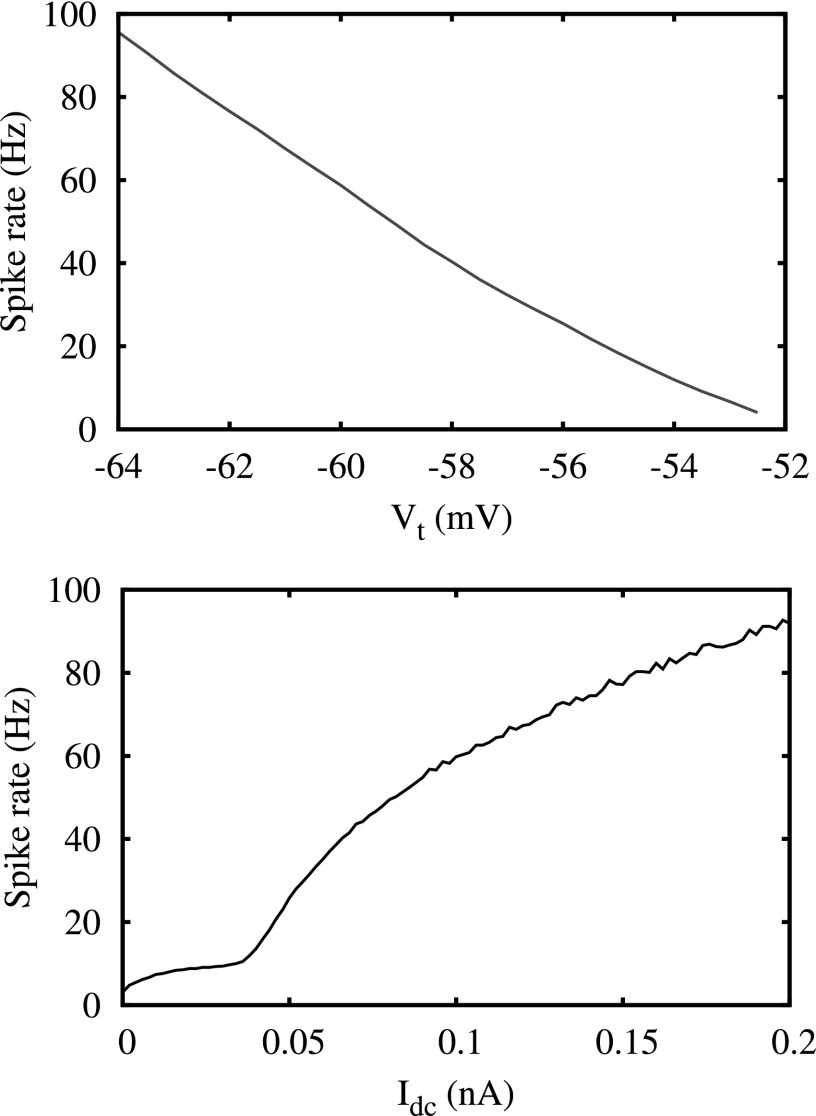
It is possible to find out a range for the input current such that it is equivalent to modify the threshold of the excitability of the neuron without modifying its cyclic timing properties (see Fig. 3).
Figure 3.
Spiking rate for neurons with different excitability. The top panel shows the dependence of the spiking rate on Vt and the bottom panel shows its dependency on Idc.
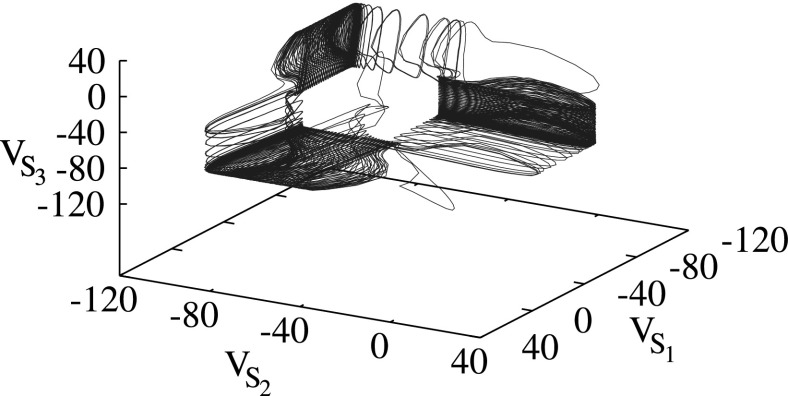
The dynamics of the motif, in fact, do not depend on the type of excitability whether changing the threshold of excitability or changing the input current Idc. A well known mechanism of excitability in the hypothalamus is the effect of neuropeptide receptors like the hypocretin receptor.10, 18 These receptors change the intrinsic excitability of individual neurons. Thus, we used Vt as a parameter to describe excitation in the neurons. Nevertheless, both mechanisms of excitability at the network dynamics level act similarly. An example of switching dynamics is illustrated with the trajectory plotted in the phase space of the three conductance-based neurons is shown in Fig. 4.
Figure 4.
Phase portrait for sequential cyclic switching corresponding to a three-neuron network with GABAB inhibitory connections. The control parameters are Vt = −57.00 mV and Idc = 0. In this case f = 32.1 Hz for individual uncoupled neurons.
MAP-BASED MODEL
The conductance-based model is the most realistic approach, however, the high dimensionality and complexity of the nonlinear functions that constitute this type of model make large-scale networks containing a realistic number of neurons difficult to simulate and interpret. To enable the analysis of large groups of neurons, we use simple map-based models,19 where each neuron is described with the following map:
| (3a) |
| (3b) |
where parameters α = 3.65, μ = 0.0005 define the type of neuronal behavior as a non-bursting neuron, parameter σ sets the baseline level of neuronal activity, σn is an external variable describing synaptic input , and the nonlinear function in Eq. 3a is
where . See Ref. 19 for details.
A map-based model for synaptic current was introduced in Ref. 20 and is computed as
where
parameter g define the strength of the synaptic coupling, γ is the timing characteristic, and the indices pre and post stand for presynaptic and postsynaptic variables, respectively. The parameter xrp defines the type of synapse and for inhibition is set to the value −2.2.
The results of the simulations of switching activity patterns in map-based model are shown in Fig. 5 and demonstrate a close resemblance to patterns observed in a conductance-based model (see Fig. 2). In both models, the baseline of neurons is set to generate tonic spiking. The tonic spiking activity is terminated due to inhibition from the presynaptic neuron. As a result, in the switching regime and at any given time, only one neuron is spiking while inhibiting its postsynaptic neuron and it keeps spiking until its presynaptic neuron recovers from inhibition imposed by the recently inhibited postsynaptic neuron. Therefore, the timing (period) of the switching is controlled by the time interval during which the neuron recovers from the inhibition imposed by presynaptic cell before its activity was terminated. In other words, the timing is controlled by transient dynamics in the silent neurons and the period of network cycling activity is equal to about three recovery time intervals.
Figure 5.
Waveforms of switching activity in the case of three neurons computed for the values of σ = 0.1 (left panel) and σ = 0.2 (right panel).
The qualitative similarity of the transient dynamics imposed by the inhibition in the map-based model and the conductance-based model studied as a function of synaptic strength and excitation levels (neuron baseline) is illustrated in Fig. 6. This similarity guarantees that map-model captures the same dynamical mechanism of timing control in the motif as in the conductance-based model.
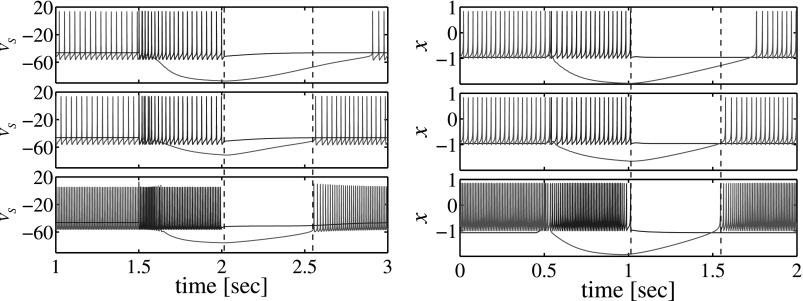
Figure 6.
Waveforms illustrating post-inhibitory recovery time as a function of synaptic strength and excitation level. The left panel shows simulations done with the conductance-based model with Vt = −57.00 mV, ; Vt = −57.00 mV, and Vt = −64.50 mV, up-down, respectively. The right panel shows similar simulations done with the map-based model with σ = 0.2, g = 1.5; σ = 0.2, g = 0.5 and σ = 0.44, g = 0.5 up-down, respectively.
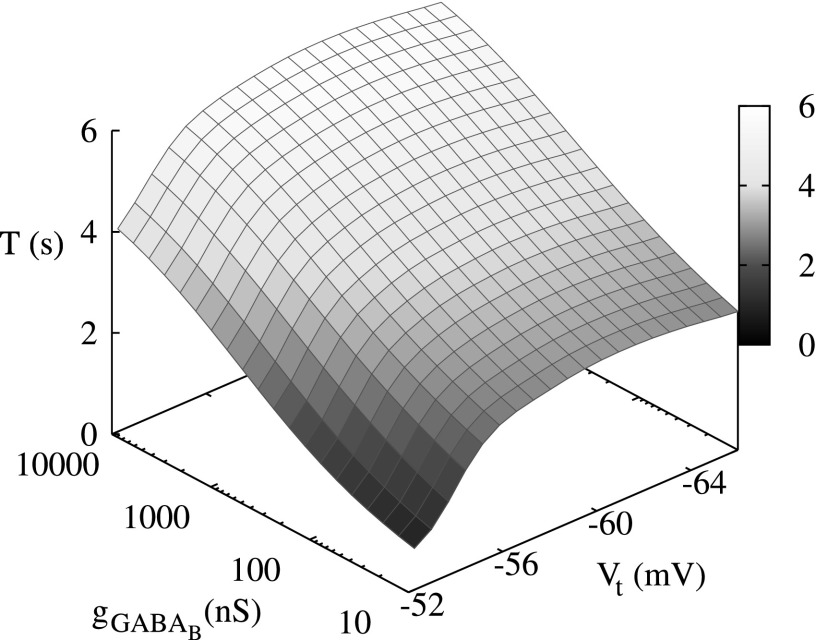
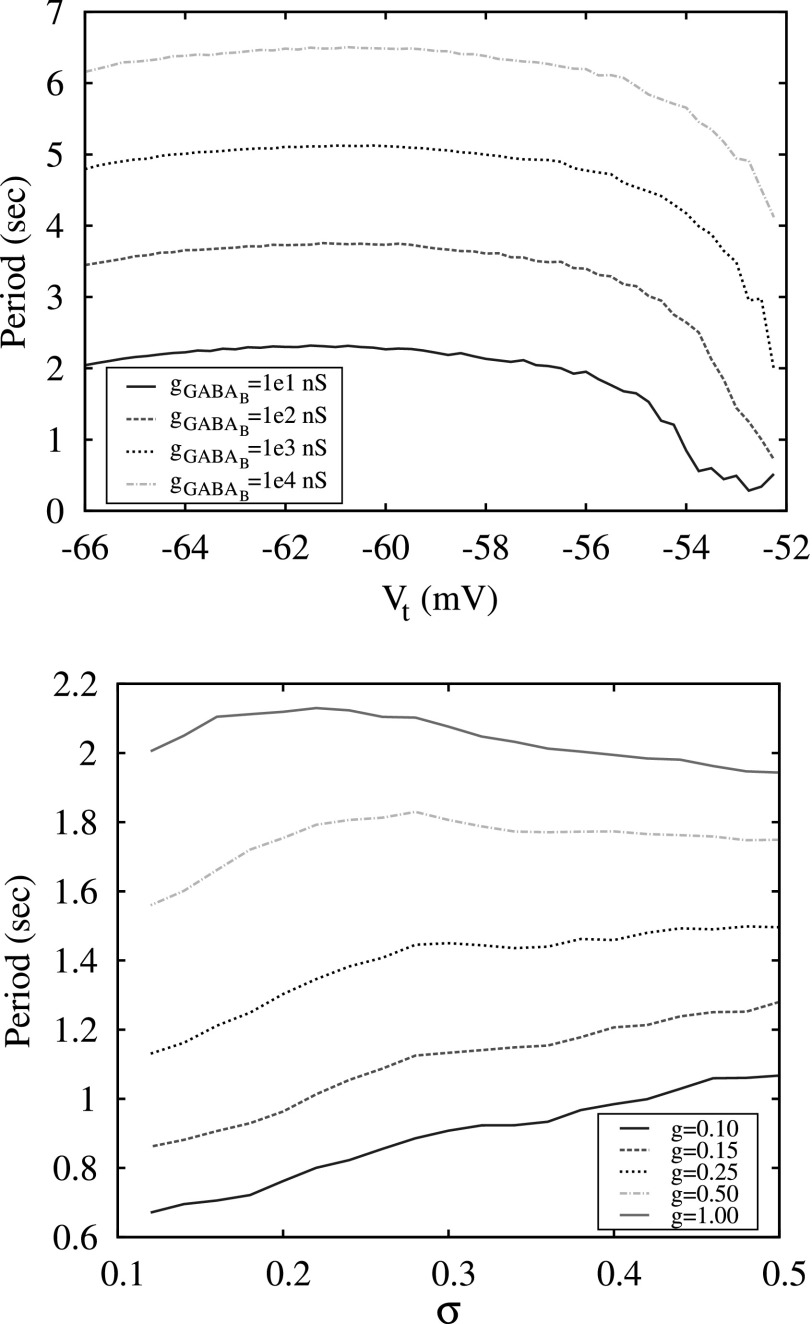
The simulation of a three neuron network in the conductance-based model and the map model shows that while the period of switching activity can be easily controlled by the strength of inhibition, it is not sensitive to the variation of excitation level of the neurons (see Figs. 78). The effect of low sensitivity to excitation level is clearly seen in Fig. 5 and explained by switching mechanisms in the networks discussed above. Indeed, the period of switching in such networks is controlled by the time interval during which the inhibited neuron recovers when its presynaptic neuron becomes inhibited by the third neuron.
Figure 7.
Dependency of the period of switching activity in a conductance-based model three neuron network model on different values of the threshold of excitability Vt and synaptic strength . Below , the network does not display cooperative dynamics.
Figure 8.
The top panel shows the period of switching activity in a conductance-based three-neuron network versus the different values of threshold of excitation, Vt, computed for different values of synaptic strength . The bottom panel shows the period of switching activity in a map-based three-neuron network versus different levels of excitation, σ, and synaptic strength g.
RECOVERY TIME
Simulated transient dynamics also show that the recovery time in the post-inhibitory state is not sensitive to the excitation level when it changes both pre and post synaptic neurons equally. Such behavior in inhibitory coupled neurons is independent of the neuronal model and is observed in simulations that use the two-compartmental conductance-based model, see Fig. 6 (left panel), as well as in simulations that use the map-based model, see Fig. 6 (right panel). This is the result of balance between the processes of inhibition and post-inhibition recovery. On one hand, the inhibition influence is stronger when the frequency of presynaptic spikes increases. On the other hand, the depth of this influence decreases and recovery rate increases in the postsynaptic neuron as its excitation level is also increased. This balance is typical for neurons that do not demonstrate effects of post-inhibitory rebounds and independent of the details of the neuronal model for the regimes of tonic spiking. Additionally, the change of synaptic strength does not affect the baseline condition of the neurons, but it directly affects the depth of inhibition and, therefore, the recovery time in the postsynaptic neuron, see Fig. 6 (top graph at each panel).
MULTINEURONAL CLUSTERS
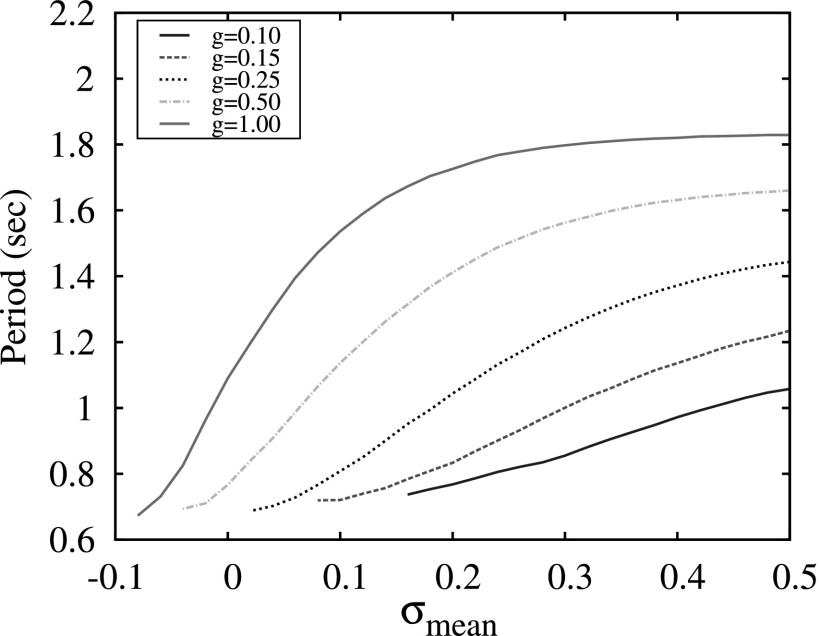
The results of switching dynamics in the 3-neuron network indicate that the modulation of excitation levels of neurons in such a network does not provide efficient control over the switching period. The plots of switching period versus the value of excitation parameter σ are shown in Fig. 8. Comparing these plots with the plot in Fig. 7, one can see that the period changes significantly with the variation of strength of the synaptic coupling g, but remains almost flat versus the parameters of the excitation: Vt and σ for the conductance and the map-based models, respectively. In the map-based model, a small gradual change of the period with signal forms only for small values of g < 0.25, see Fig. 8, bottom panel. Moreover, it is known that in many neural inhibitory networks, in particular, in Central Pattern Generators, that the parameters of the synaptic coupling are fixed and not involved in the modulation of pattern formations.21 The period of switching in CPGs is usually controlled through the mechanisms of modulation of neuronal excitation levels.
To understand how such systems enhance the sensitivity to excitation we make the network model more realistic in terms of network size. We consider the case when each neuron in the original 3-neuron networks is substituted with a large cluster of neurons with randomly dispersed parameter settings.
To model the neurons' diversity within each cluster, we use Gaussian distribution for the neural excitation level controlled by parameter σ in the case of the map-based model and treat the mean value of this parameter, σmean as a control parameter capturing the excitation level of the cluster. Each neuron in the post-synaptic cluster is inhibited by the all neurons located in the presynaptic cluster. The neurons within each cluster are not connected.
The results of the simulations of switching patterns in the three-cluster network where each cluster consists of 100 neurons without inhibitory connections within clusters are summarized in Fig. 9. Here, the parameters σ in each group were dispersed as Gaussian distribution with the value of standard deviation equal to 0.2. The comparison of these plots with the case of the three-neuron network (Fig. 8, bottom panel) shows that, in the instance of a large group, the period of switching becomes sensitive to the average excitation level. Therefore, the use of a large number of neurons in each cluster of the network enables a dynamical mechanism for timing control of the switching activity that is independent of the parameters of individual synapses.
Figure 9.
Period of switching activity in a network consisting on three 100-neuron groups versus different mean values of the levels of excitation, σmean, and group synaptic strength g.
GRADUAL RECRUITMENT MECHANISM
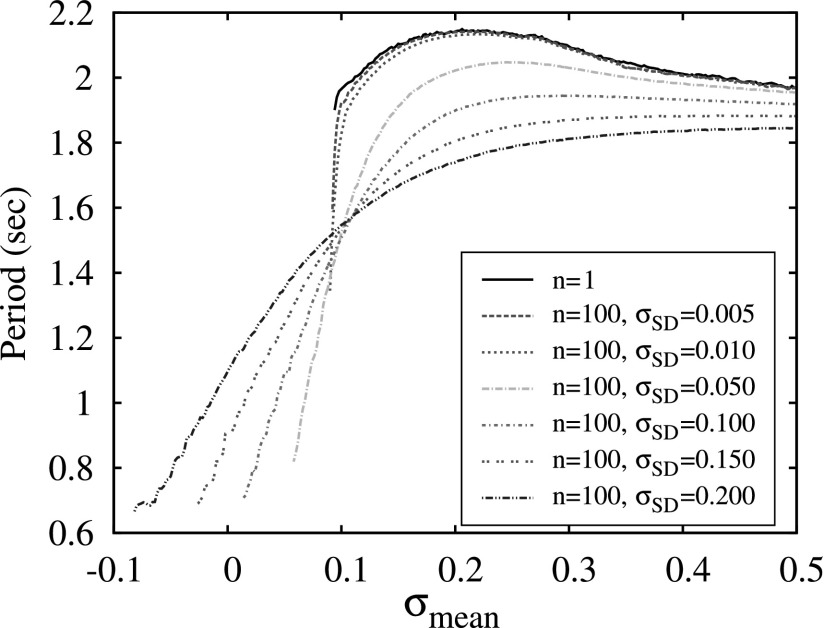
To discuss this mechanism in more detail, we consider how diversity within the clusters affects the dependence of switching period on the mean level of excitation σmean, see Fig. 10. The wide black curve computed for n = 1 is presented here for comparison and the two examples of switching waveforms observed in this case in Fig. 5 show that although the spiking rate of activity increases significantly with the increase of σ it does not affect the period of burst switching. In the case of clusters of 100 neurons and a very small diversity level (σSD = 0.005), the plot of the period looks very similar except for a sharp drop of the period in a very narrow interval of σmean right before the bursting activity disappears. The increase of diversity σSD within the clusters increases the depth of this drop and makes the dependence of the switching period more gradual and, therefore, more suitable for control through the modulation of the excitation level σmean.
Figure 10.
The dependencies of switching period on mean level of cluster excitation σmean computed for a network of 3 neurons (n = 1) and three clusters of 100 neurons with different values of diversity controlled by the value of the standard deviation σSD of Gaussian distribution for the parameter σ. Simulations are done for the strength synaptic g = 1.0 normalized for number of elements in each cluster.
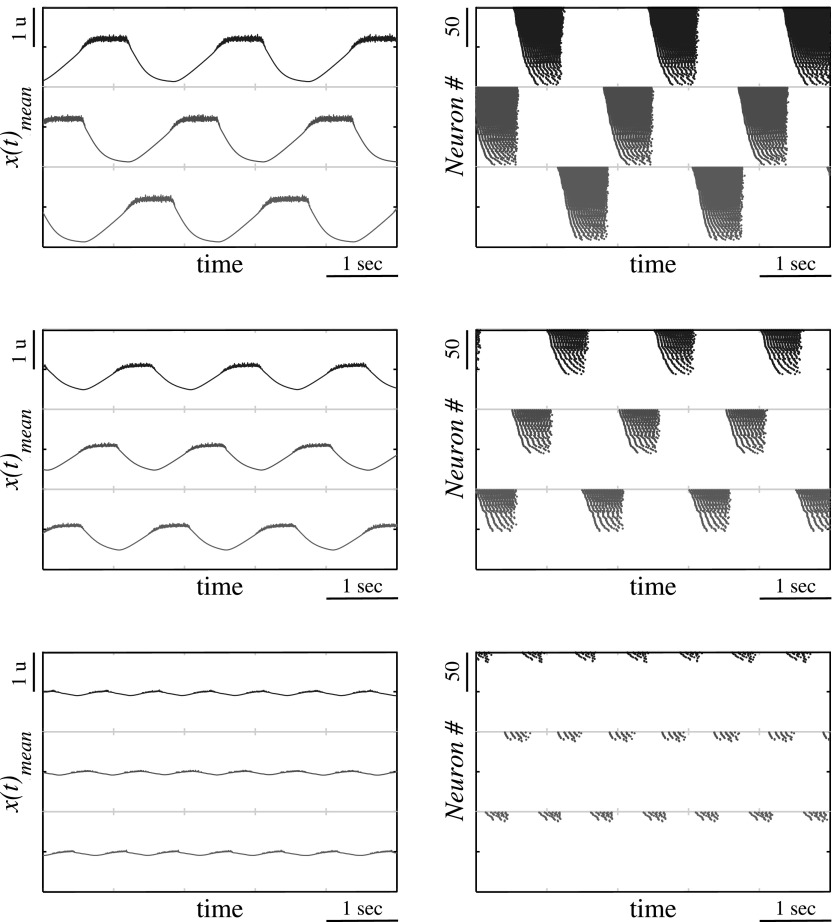
To illustrate how diversity among the neurons forms a slope in the period dependence on the cluster excitation level consider the bursting activity using waveforms of mean field computed for each cluster and the spiking activity within the clusters, see Fig. 11. One can see that the slope is related to the gradual recruitment of neurons within each cluster of the bursting activity as the cluster excitation increases. The increase of the number of active neurons within the cluster is equivalent to the increase of activated synaptic connections between the clusters and, therefore, the effective strength of the synaptic inhibition. It was shown above that the change of synaptic strength in this motif affects the period control through the variation of recovery time duration, see Fig. 6 and discussion in Sec. 4. Therefore, thanks to the redundancy on the neurons in each network node the diversity of their baselines provides gradual recruitment of active neurons with the corresponding synapses enhancing the control of timing through the overall excitation level of the network.
Figure 11.
Waveforms of mean field activity in the clusters (left panels) and the spiking activity of individual neurons (right panels) computed for cluster size n = 100, normalized synaptic strength g = 1.0, the diversity level σSD = 0.1 and three values of the excitation levels: σmean = 0f.2 (top), σmean = 0.1 (middle) and σmean = 0.03 (bottom).
We believe that such a mechanism could be observed in many neuronal subsystems since the level of depolarization in the brain can be regulated via neuropeptide and neuromodulator release (see Ref. 18). Some neuropeptides like hypocretin/orexin can depolarize neurons via a specific receptor for extended periods of time in the order of minutes.22
In summary, the brain is known to have a very large range of time scales during cognitive and behavioral tasks; the pending question of how to organize this broad range of time scales is unanswered. Thanks to the redundancy of neurons within each node the excitation level of neurons can affect the average synaptic strength of inhibition between the nodes and enhance timing control. Here, we propose a novel basic mechanism based on frequency-modulated inhibition using GABAB that is capable of modifying the switching period with a logarithmic dependence on the synaptic strength of the inhibitory network. Here we also assessed the role that diversity of the levels of excitability between neurons inside a cluster plays on the dependence of the switching period. These findings show that since it has a gradual effect, this is a suitable mechanism for control through the modulation of the mean excitation level.
ACKNOWLEDGMENTS
I.T. would like to acknowledge support by the UC-MEXUS-CONACYT Fellowship. N.R. was partially supported by Grant No. ONR N000141310672. M.I.R. acknowledges support by Grant No. ONR N00014310205. R.H. would like to acknowledge support by Grant No. NIDCD, R01DC011422-01.
References
- Buhusi C. V. and Meck W. H., Nature Rev. Neurosci. 6, 755 (2005). 10.1038/nrn1764 [DOI] [PubMed] [Google Scholar]
- Ponzi A. and Wickens J., J. Neurosci. 30, 5894 (2010). 10.1523/JNEUROSCI.5540-09.2010 [DOI] [PMC free article] [PubMed] [Google Scholar]
- Meck W. H., Penney T. B., and Pouthas V., Curr. Opin. Neurobiol. 18, 145 (2008). 10.1016/j.conb.2008.08.002 [DOI] [PubMed] [Google Scholar]
- Coull J. T., Cheng R.-K., and Meck W. H., Neuropsychopharmacology 36, 3 (2011). 10.1038/npp.2010.113 [DOI] [PMC free article] [PubMed] [Google Scholar]
- Humphries M. D., Wood R., and Gurney K., PLoS Comput. Biol. 6, e1001011 (2010). 10.1371/journal.pcbi.1001011 [DOI] [PMC free article] [PubMed] [Google Scholar]
- Principles of Brain Dynamics: Global State Interactions, edited by Rabinovich M. I., Friston K. J., and Varona P. (MIT Press, Cambridge, MA, 2012). [Google Scholar]
- Rabinovich M., Volkovskii A., Lecanda P., Huerta R., Abarbanel H. D. I., and Laurent G., Phys. Rev. Lett. 87, 068102 (2001). 10.1103/PhysRevLett.87.068102 [DOI] [PubMed] [Google Scholar]
- Rabinovich M., Huerta R., and Laurent G., Science 321, 48 (2008) 10.1126/science.1155564 [DOI] [PubMed] [Google Scholar]
- Rabinovich M. I., Huerta R., Varona P. and Afraimovich V. S., PLoS Comput. Biol. 4, e1000072 (2008). 10.1371/journal.pcbi.1000072 [DOI] [PMC free article] [PubMed] [Google Scholar]
- Carter M. E., Brill J., Bonnavion P., Huguenard J. R., Huerta R., and de Lecea L., Proc. Natl. Acad. Sci. USA 109, E2635 (2012). 10.1073/pnas.1210490109 [DOI] [PMC free article] [PubMed] [Google Scholar]
- Traub R. D. and Miles R., Neural Networks of the Hippocampus (Cambridge University Press, New York, 1991). [Google Scholar]
- Traub R. D., Wong R. K. S., Miles R., and Michelson H., J. Neurophysiol. 66, 635 (1991), see http://www.ncbi.nlm.nih.gov/pubmed/1663538. [DOI] [PubMed] [Google Scholar]
- Salas P. J. and Lopez E. M., Biochim. Biophys. Acta 691, 178 (1982). 10.1016/0005-2736(82)90227-9 [DOI] [PubMed] [Google Scholar]
- Bowman C. L. and Baglioni A., J. Theor. Biol. 108, 1 (1984). 10.1016/S0022-5193(84)80165-4 [DOI] [PubMed] [Google Scholar]
- Huerta R., Sánchez-Montañés M. A., Corbacho F., and Sigüenza J. A., Biol. Cybern. 82, 85 (2000). 10.1007/PL00007963 [DOI] [PubMed] [Google Scholar]
- Szucs A., Huerta R., Rabinovich M. I., and Selverston A. I., Neuron 61, 439 (2009). 10.1016/j.neuron.2008.12.032 [DOI] [PMC free article] [PubMed] [Google Scholar]
- Destexhe A., Bal T., McCormick D. A., and Sejnowski T. J., J. Neurophysiol. 76, 2049 (1996), see http://www.ncbi.nlm.nih.gov/pubmed/8890314. [DOI] [PubMed] [Google Scholar]
- van den Pol A. N., Neuron 76, 1, (2012). 10.1016/j.neuron.2012.09.010 [DOI] [PMC free article] [PubMed] [Google Scholar]
- Rulkov N. F., Phys. Rev. E 65, 041922 (2002). 10.1103/PhysRevE.65.041922 [DOI] [PubMed] [Google Scholar]
- Rulkov N. F. and Bazhenov M., J. Biol. Phys. 34, 279 (2008). 10.1007/s10867-008-9079-y [DOI] [PMC free article] [PubMed] [Google Scholar]
- Selverston A. I., Philos. Trans. R. Soc. London, Ser B 365, 2329 (2010). 10.1098/rstb.2009.0270 [DOI] [PMC free article] [PubMed] [Google Scholar]
- de Lecea L. and Huerta R., Front. Pharmacol. 5(16), 1 (2014). 10.3389/fphar.2014.00016 [DOI] [PMC free article] [PubMed] [Google Scholar]


