

Abstract
In humans, the ability to digest lactose, the sugar in milk, declines after weaning because of decreasing levels of the enzyme lactase-phlorizin hydrolase, encoded by LCT. However, some individuals maintain high enzyme amounts and are able to digest lactose into adulthood (i.e., they have the lactase-persistence [LP] trait). It is thought that selection has played a major role in maintaining this genetically determined phenotypic trait in different human populations that practice pastoralism. To identify variants associated with the LP trait and to study its evolutionary history in Africa, we sequenced MCM6 introns 9 and 13 and ∼2 kb of the LCT promoter region in 819 individuals from 63 African populations and in 154 non-Africans from nine populations. We also genotyped four microsatellites in an ∼198 kb region in a subset of 252 individuals to reconstruct the origin and spread of LP-associated variants in Africa. Additionally, we examined the association between LP and genetic variability at candidate regulatory regions in 513 individuals from eastern Africa. Our analyses confirmed the association between the LP trait and three common variants in intron 13 (C-14010, G-13907, and G-13915). Furthermore, we identified two additional LP-associated SNPs in intron 13 and the promoter region (G-12962 and T-956, respectively). Using neutrality tests based on the allele frequency spectrum and long-range linkage disequilibrium, we detected strong signatures of recent positive selection in eastern African populations and the Fulani from central Africa. In addition, haplotype analysis supported an eastern African origin of the C-14010 LP-associated mutation in southern Africa.
Introduction
Observations of problems associated with milk digestion have been documented for millennia. However, it was not until the 17th century AD that lactose, the sugar present in milk, was discovered and over a century ago that lactose intolerance was defined.1–6 Lactose is a disaccharide composed of two simple sugars, glucose and galactose, and is present in large quantities in mammalian milk, with the exception of Pinniped milk.1,7 The breakdown of this complex sugar into glucose and galactose, which are rapidly absorbed into the blood stream, is catalyzed by the enzyme lactase-phlorizin hydrolase (LPH), commonly referred to as lactase. This enzyme is encoded by LCT (MIM 603202) and is expressed exclusively in the brush border cells of the small intestine.7–9 Prior analyses have demonstrated that the activity of lactase declines postweaning in mammals, including humans;5,6 this condition is known as “hypolactasia” or “lactase nonpersistence” (LNP).10 However, several studies have shown that individuals from northern Europe (or with northern European ancestry) and pastoralist populations from Africa, the Arabian Peninsula, and central Asia with a tradition of fresh milk production and consumption retain high amounts of lactase as they grow into adulthood (i.e., they have the “lactase-persistence” [LP] trait), suggesting that LP represents a recent adaptive trait in humans.7,8,10–14
To date, several SNPs associated with the LP trait have been identified. For example, the G-22018 and T-13910 alleles located in introns 9 and 13, respectively, of MCM6 (MIM 601806; upstream of LCT) are significantly associated with the LP trait in European populations,8,11,14–22 although functional studies have indicated that the key variant regulating maintenance of LCT expression in adults is T-13910.23 However, the T-13910 variant is absent in most African and Middle Eastern populations that practice pastoralism and that have high consumption levels of dairy products as adults.11,14,15,17,19,21 More recently, additional variants (C-14010, G-14009, G-13907, and G-13915, located within 100 bp of T-13910) have been shown to be associated with the LP trait mainly in pastoralist populations from Africa and the Arabian Peninsula.14–17,19,24,25 Furthermore, in vitro studies have demonstrated that the genomic region containing the C-14010, G-14009, G-13915, T-13910, and G-13907 variants functions as an LCT enhancer element mediated by the nuclear transcription factor Oct-1, preventing the normal postweaning downregulation of LCT expression.14,15,19,23,25–28
Genetic analyses have also detected a strong signature of positive selection at the intron 13 region of MCM6, as indicated by long-range extended haplotype homozygosity (EHH) on chromosomes carrying the T-13910 and C-14010 variants, which span >1 Mb in northern Europeans21 and >2 Mb in eastern Africans,14 respectively. These studies suggested that the T-13910 and C-14010 LP-associated variants arose independently and spread very rapidly to high frequencies in populations from these geographic regions in response to strong selection pressure. However, the C-14010, G-14009, G-13915, T-13910, and G-13907 variants do not completely account for the total phenotypic variance of LP in Africa,13–15,19,25 suggesting that additional genetic and/or environmental factors might contribute to this trait.
In order to identify variants associated with the LP trait in African populations and to reconstruct the history of pastoralism within the continent, we completed a large-scale sequencing analysis of all of the candidate regulatory regions influencing LCT expression—namely, intron 9 (1,297 bp) and intron 13 (3,218 bp) of MCM6 and ∼2 kb of the LCT promoter region—in 819 individuals from 63 diverse African populations and in 154 non-Africans from nine different populations in Europe, the Middle East, and central and eastern Asia. We also genotyped four microsatellites found in a region spanning a distance of ∼198 kb in a subset of 252 individuals in order to determine fine-scale haplotype variation and to reconstruct the movement of pastoral communities through the continent. Additionally, we examined the association between the LP trait and genetic variability within candidate regulatory regions in 513 individuals from 50 different eastern African populations. Here, we report results from neutrality tests based on long-range linkage disequilibrium (LD) and the allele frequency spectrum, and these confirm a model of strong positive selection acting on several LP-associated variants in Africa. From haplotype analysis, we also observed strong geographic structuring of the common LP-associated SNPs (C-14010, G-13915, T-13910, and G-13907) and signatures of historic migration events. Additionally, we identified two other LP-associated SNPs in MCM6 intron 13 and the LCT promoter region (G-12962 and T-956, respectively). Overall, this study of nucleotide variation and association with the LP trait across geographically and ethnically diverse African populations sheds light on both the evolutionary history of this trait and the origins of pastoralism in Africa.
Material and Methods
Population Samples
We sequenced a total of 973 individuals originating from 72 populations from Africa (n = 819), Asia (n = 51), the Middle East (n = 69), and Europe (n = 34). African populations sharing genetic similarity and cultural and/or linguistic properties were pooled for analysis in the present study on the basis of an analysis of population structure in Africa29 (Table S1, available online). Detailed information about the populations used in the present study is given in Tables S1 and S2.
Institutional-review-board approval for DNA collection was obtained from the University of Maryland at College Park and the University of Pennsylvania. Research ethics approval and permits were also obtained from the following institutions prior to sample collection: the Commission for Science and Technology and National Institute for Medical Research in Dar es Salaam, the Kenya Medical Research Institute in Nairobi, the University of Khartoum in Sudan, the National Institute for Pharmaceutical Research and Development in Abuja, and the Ministry of Health and National Committee of Ethics in Cameroon. For the South African samples, ethical clearance was obtained, and a material-transfer agreement was signed with the University of Stellenbosch for use of the samples in the current study; approval was also obtained from Dr. Roger Chennels and the Working Group of Indigenous Minorities in Southern Africa. All subjects from whom DNA was collected were at least 18 years of age. In addition, written informed consent was obtained from each participant. Ethnic groups, sample sizes, language, and subsistence classifications are given in Table S1. Coordinates of the populations are listed in Table S2.
Lactose Tolerance Test
We measured levels of lactose tolerance in 322 individuals from the above sequenced samples originating from Tanzania (n = 85), Sudan (n = 30), and Kenya (n = 207) by using the lactose tolerance test (LTT).10 For the LTT, individuals were required to fast overnight, and then a baseline glucose level was recorded the next morning prior to the test; only individuals with a baseline glucose level between 60 and 100 mg/dl were eligible to participate further with the test (pregnant women and diabetic individuals were excluded). A 50 g lactose powder solution (QuinTron USA; equivalent to ∼1–2 liters of cow’s milk10), dissolved in 250 ml of water, was then given to each subject, and blood glucose levels were measured at 20 min intervals over a 1 hr period10 with the ACCU-CHEK Advantage glucose monitor and ACCU-CHEK Comfort Curve test strips (Roche). Each measurement (mmol/l) was adjusted according to the regression equation associated with the error of the test strips (i.e., y = 0.985x − 7.5, where x is the measured glucose value). The maximum rise in glucose level was determined by comparison of the observed glucose values against the baseline value.
On the basis of the maximum rise in glucose level, individuals were classified as (1) LP, defined by a rise in blood glucose level > 1.7 mmol/l, (2) LNP, defined by a rise in blood glucose level < 1.1 mmol/l, or (3) “lactase intermediate persistent” (LIP), defined by a rise in blood glucose level between 1.1 and 1.7 mmol/l.10
PCR Amplification and Sequencing
To identify mutations associated with the LP trait and to characterize the evolutionary history of the LCT regulatory regions, we amplified three different genomic regions by long-range PCR: (1) 1,353 bp encompassing intron 9 of MCM6, (2) 3,342 bp encompassing intron 13 of MCM6, and (3) 2,021 bp of the lactase promoter region of LCT. PCR was performed for 973 individuals from worldwide populations listed in Table S1. For the HGDP-CEPH samples (n = 100) and the southern African samples (n = 50) with low DNA concentration or degraded DNA, whole-genome amplification using the illustra GenomiPhi HY DNA Amplification Kit (GE Healthcare) was performed prior to PCR. Primers and PCR conditions used are given in Tables S3 and S4. All 973 samples were subsequently sequenced with overlapping primers that covered introns 9 (1,297 bp) and 13 (3,218 bp) of MCM6 and the 2,021 bp promoter region of LCT (Table S5) according to standard protocols and were run on the ABI 3730XL automated sequencer.
Microsatellite Analysis
In a subset of 252 individuals, we genotyped four fast-evolving microsatellites flanking MCM6: D2S3010, D2S3013, D2S3015, and D2S3016.22 Information regarding the size and repeat motifs of each of the microsatellites can be found in the Allele Frequency Database and Figure 1. Each microsatellite was amplified separately by a PCR reaction according to the protocol and conditions outlined in Coelho et al.22 (Table S6).
Figure 1.
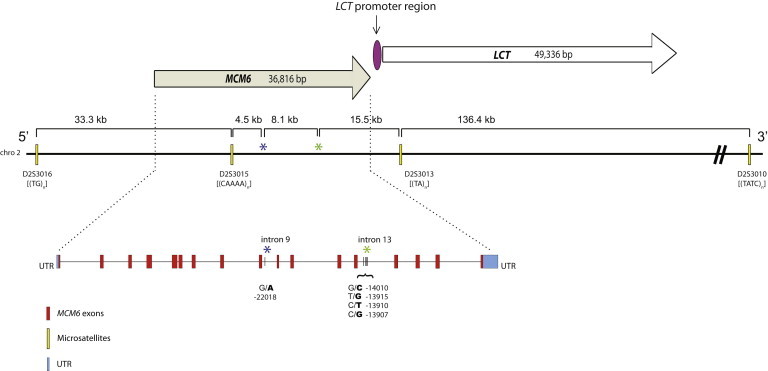
Enlarged Map of MCM6 and LCT, Located on Chromosome 2, and Locations of the Genomic Regions Sequenced and the Four Genotyped Microsatellites
LCT and MCM6 have both been mapped to the long arm of chromosome 2 at position q21. Intron 13 of MCM6, upstream of LCT, carries the primary variants associated with the LP trait in the current study (C-14010, G-13915, T-13910, and G-13907), whereas intron 9 contains the A-22018 variant, which is in strong LD with T-13910 in Europeans and Africans. Relative positions of the four linked microsatellites and their repeat motifs typed in the study are also shown.
Statistical Analyses
Identification of SNPs
The Phred-Phrap-PolyPhred-Consed software30–32 was used to assemble sequences into contigs and to identify nucleotide substitutions; every base call was visually confirmed. The populations, their relative geographic locations, and the frequency of each SNP identified in the present study are also given in Tables S1, S2, and S7–S15.
Haplotype Determination
The program fastPHASE v.1.133 was used to reconstruct haplotypes for the three regions sequenced (introns 9 and 13 of MCM6 and 2,021 bp of the LCT promoter region) for all individuals, who were classified into groups on the basis of their genetic, linguistic, and/or cultural similarities (Table S1) as described in Tishkoff et al.29 PHASE v.2.134–36 was used to reconstruct haplotypes on the basis of microsatellite and SNP sequencing data for the three regions sequenced in a subset of 252 samples.
Haplotype Network Analysis
We used the median-joining algorithm implemented in the Network v.4.5.0.0 program to infer haplotype relationships for a subset of 252 sequenced samples that contained at least one LP-associated variant (C-14010, G-13915, T-13910, or G-13907) and that were typed for the four fast-evolving linked microsatellites (Figures 1 and 4). Haplotype network analysis of a larger set of 509 sequenced samples was also performed and showed a similar topology (Figure S1). The final networks in Figure 4 were constructed with the same weighting for both SNPs and microsatellites and were drawn with the option “frequency > 1.” In addition, we constructed networks by assigning different weights for SNPs (i.e., transversions were given a weight of 20, whereas transitions were assigned a weight of 10) and microsatellite markers (microsatellites were given a weight of 5) to check for consistency in results obtained under different weightings. We observed consistency among all constructed networks.
Figure 4.
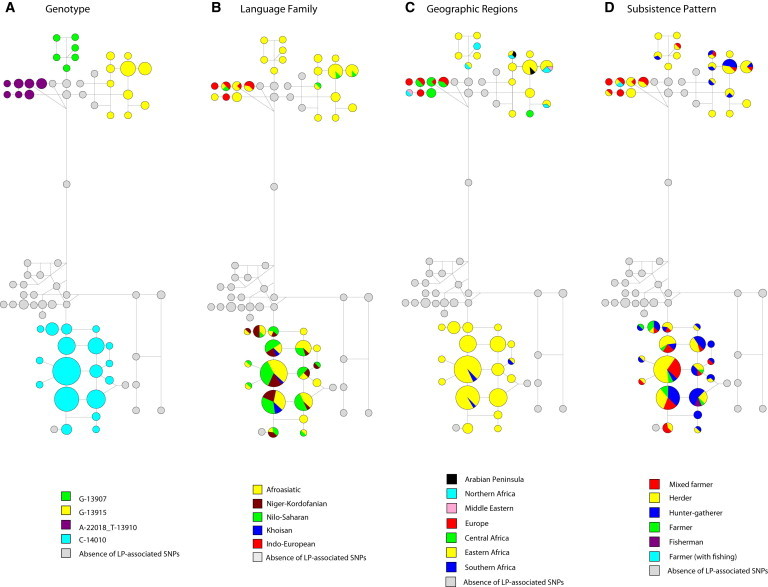
Haplotype Network Inferred from SNPs and STRs
Haplotype networks based on 56 SNPs identified in the sequenced regions and four fast-evolving linked microsatellites spanning a total of 197.8 kb for 252 individuals (Figure 1). Haplotypes are shown as circles, and the size of each circle is proportional to the number of individuals with a given haplotype. We assigned the same weight to SNPs and short tandem repeats, and the “frequency > 1” option was selected in the Network program (see Web Resources). Haplotypes are colored on the basis of genotype (A), linguistic family (B), geographic regions (C), and subsistence pattern (D).
Genotype-Phenotype Association Analysis
We performed Fisher’s exact test with the package SPSS v.19 (IBM) to assess genotype-phenotype relationships in our data set. LTT phenotype data were collected for 322 eastern African individuals for whom we also had sequence data. In order to perform this test, we categorized phenotype data into three groups on the basis of the maximum rise in blood glucose: (1) LP, (2) LNP, and (3) LIP (see “Lactose Tolerance Test” in the Material and Methods). Furthermore, to increase power to detect an association for the known LP-associated variants (C-14010, G-13915, and G-13907), we incorporated an additional 191 samples from a previously published data set14 for a final total of 513 individuals from 50 diverse eastern African populations. We also tested for a correlation between genotype and LTT phenotype by analyzing the maximum rise in blood glucose as a continuous trait by using least-squares linear regression. Statistical significance in Fisher’s exact test and linear regression was determined after application of a Bonferroni correction (Table S16).
Contour Map
To visualize the geographic distribution of the four variants associated with the LP trait in Africa, we merged our data with genotype data from African and Middle Eastern populations in the Global Lactase Persistance Association Database (GLAD; Table S2). The frequency distributions of the SNPs associated with the LP trait in African and Middle Eastern populations were then plotted as a contour map with the Kriging algorithm implemented in the program Surfer 8 (Golden Software) (Table S2; Figure 3).
Figure 3.
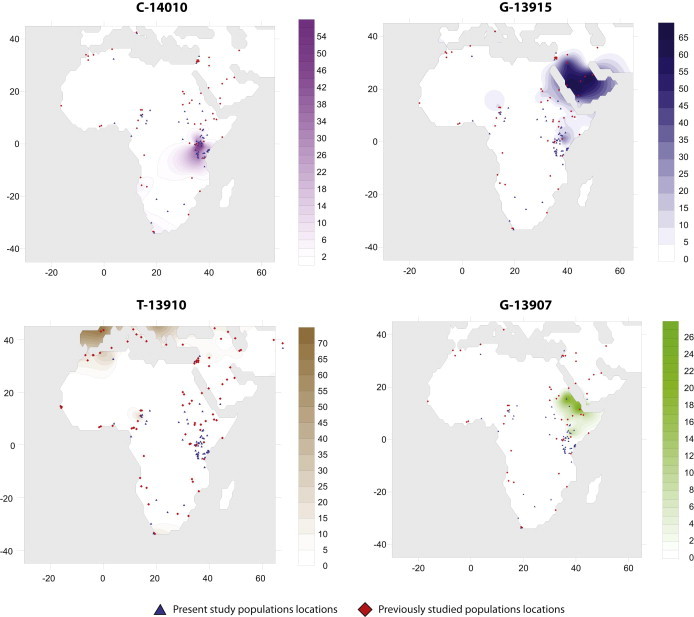
Contour Maps of Africa Show the Allele Frequency Distribution for the Four Primary SNPs Associated with the LP Trait in the Current Study
We visualized the frequency distribution of each of the SNPs (C-14010, G-13915, T-13910, and G-13907) associated with the LP trait in Africa as a contour map. The blue triangles represent locations of populations present in this study, whereas the red squares are the locations of populations in GLAD for Africa and Middle Eastern genotype data (Table S2).
LD
To visualize the extent of LD among SNPs in the regions sequenced, we constructed LD plots by using Haploview 3.1.1 software,37 and we only included SNPs with a frequency above 5% in the analysis. Plots of pairwise SNP LD were constructed for pooled and separate populations from northern, central, western, eastern, and southern Africa, in addition to the Middle Eastern and European populations (Figures S2–S7).29
Tests of Neutrality
We applied the EHH38 and integrated haplotype score (iHS) statistics39 to our data to identify signatures of recent positive selection on the basis of long-range LD patterns on chromosomes containing the LP-associated SNPs. We performed the EHH test in a subset of the sequenced African samples for which we also had Illumina Human 1M-Duo genotype data (218 individuals) (Table S17). We then integrated our sequencing SNP data set with ∼90,000 SNPs from the Illumina 1M data set, genotyped across the entire length of chromosome 2. SNPs were phased with fastPHASE (v.1.4).33 We then measured the decay of LD for a given core SNP by calculating EHH38 for the core SNP and the surrounding SNPs in the order of increasing distances by starting with the core SNP (EHH = 1) and following with the next closest neighboring SNPs to the core SNP at both proximal and distal sides. The estimated EHH values of the core and neighboring SNPs were plotted against their genetic distances for the derived and ancestral alleles for a given core site.38 An allele was determined to be ancestral or derived with the use of chimpanzee and gorilla sequences as outgroups. The African-specific genetic map used for calculating the iHS statistic was taken from Jarvis et al.40 The iHS test statistic, calculated for all SNPs with minor allele frequency > 5%, reflects the differences in the long-range LD patterns on chromosomes containing the ancestral versus derived alleles for LP-associated variants.39 We then compared the iHS estimate of the core SNP to the empirical distribution obtained from all chromosome 2 SNPs whose derived allele frequency matched the frequency at the core SNP of interest to identify outlier values as described by Voight et al.39 We also constructed Manhattan plots to visualize outlier iHS values. In addition, Tajima’s D (DT),41,42 which compares the estimate of 4Neu on the basis of the number of segregating sites (θW) and pairwise nucleotide divergence (θπ), was calculated for introns 9 and 13 with DNAsp v.5.10.43 Statistical significance of this test was computed under models of constant population size and population growth (2-fold, 4-fold, 6-fold, and 10-fold increase in population size starting at 70,000 years ago) by means of coalescent simulations.44
Results
Patterns of Nucleotide Diversity and Geographic Distribution of LP-Associated Variants
From our analysis of 3,218 bp from intron 13 of MCM6 (Figure 2; Table S1), we identified a total of 68 SNPs in 973 individuals from 72 global populations, and the majority of these variants occurred at low frequency (<5%) (Tables S7–S9). Our data also showed a restricted geographic distribution of the known LP-associated SNPs (Tables S1 and S9; Figures 2 and 3). For example, the C-14010 variant was found only in eastern and southern Africa and was most common among Afroasiatic-, Nilo-Saharan-, and Niger-Kordofanian-speaking populations (42.1%, 38.3%, and 25% frequency, respectively) from Tanzania and among Nilo-Saharan-speaking populations from Kenya (27.9% frequency) (Table S1; Figures 2 and 3). Interestingly, two Afroasiatic-speaking hunter-gatherer populations from Kenya, the Boni and the Yaaku, had a moderate to high frequency of the C-14010 variant (20.8% and 53.6%, respectively) (Table S1; Figures 2 and 3). Furthermore, among the two Khoisan-speaking hunter-gatherer populations from Tanzania, the C-14010 variant was present at a frequency of 14.5% in the Sandawe but was absent in the Hadza (Table S1; Figures 2 and 3). We also observed the C-14010 variant in southern African populations at a frequency of 3.1% in the San-Khoisan-speaking hunter-gatherers and 14.3% in the !Xhosa Bantu-speaking agropastoralists (Table S1; Figures 2 and 3).
Figure 2.
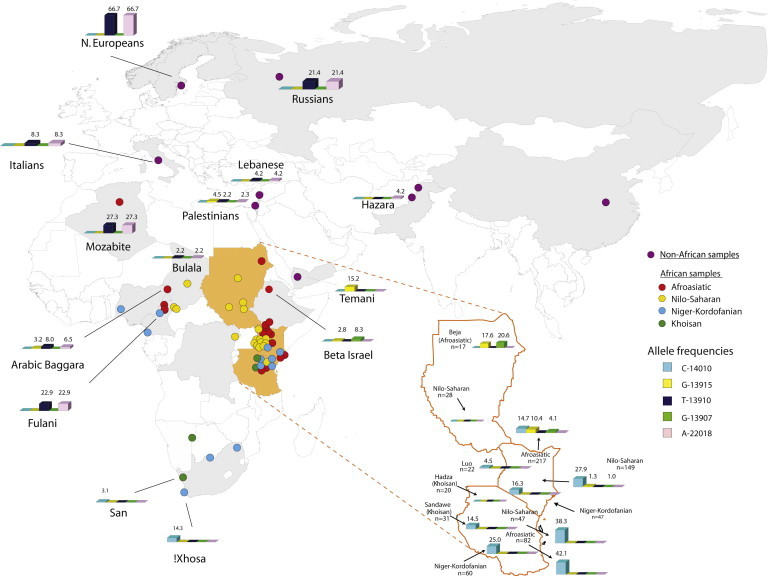
Map of the Allele Frequency Distribution of the LP-Associated SNPs in the Populations Analyzed in the Present Study
Each dot represents a population included in the present study and is plotted on the map on the basis of its respective population’s geographic coordinates (Table S2). African populations are color coded on the basis of language family: Afroasiatic, red; Nilo-Saharan, yellow; Niger-Kordofanian, light blue; and Khoisan, green. All non-African populations are colored purple. Countries for which LTT phenotype data are available (Sudan, Tanzania, and Kenya) are shaded in orange, whereas those with no LTT data are shaded in gray. We only show histograms and relative frequencies for those populations that carry at least one of the five SNPs associated with the LP trait in humans.
The LP-associated variant G-13915 was observed in populations from northern (at 9.4% frequency), central (<1%), and eastern (3.9%) Africa (except Tanzania, where it was absent) and in the Arabian Peninsula (4.0%), but it was absent from western and southern African populations (Tables S1 and S8; Figures 2 and 3). Additionally, the G-13907 variant was not present outside of Africa and had a very restricted geographic distribution in northern and eastern Africa (with the exception of Tanzania, where it was absent) (Tables S1 and S9; Figures 2 and 3). The highest frequency of the G-13907 variant in northern Africa was among the Beja Banuamir (25.0%) and Beja Hadandawa (18.2%), two Afroasiatic-speaking pastoralist populations from northern Sudan (Table S1). In the Kenyan Nilo-Saharan-speaking populations (Table S1), only three individuals carried the G-13907 variant, and two of them also carried the C-14010 variant, although it occurred on a different chromosome background than the G-13907 variant (Table S1; Figure 2).
Although the T-13910 variant was absent across most of Africa, we detected this polymorphism in the Mozabite from Algeria (northern Africa) at a frequency of 27.3% and in a few central African populations, namely the Arabic Baggara and Fulani from Cameroon (8% and 22.9% frequency, respectively) and the Bulala from Chad (2.2% frequency) (Tables S1 and S8; Figures 2 and 3). The highest frequency of the T-13910 variant outside of Africa was found in northern Europeans (66.7%), and the lowest frequency occurred in the Middle East (2.2%–4.2%) (Figure 2; Table S1).
In addition to identifying the four LP-associated SNPs described above, we found 64 other SNPs distributed heterogeneously across populations (Table S9). Although the majority of these polymorphisms were at low frequencies within geographic regions (<5%), a few occurred at moderate frequencies in some African populations (Tables S7–S9). For example, the G-12962 variant was present among Kenyan and Sudanese Afroasiatic-speaking populations at frequencies of 12.76% and 17.6%, respectively. Furthermore, we found an A-13031 derived variant at low frequency in the Nyimang from Sudan (5.2%), the Arabic Baggara from Cameroon (1.6%), and the Beja from northern Sudan (8.8%) (Table S9). Lastly, we observed that the G-14009 allele, recently identified as a functional LP variant in Somali, Sudanese, and Ethiopian populations,24,25 was at high frequency among the Beja (23.5%) and at low frequency in the Arabic Baggara (1.6%) and populations from the Middle East (1.0%) (Table S9).
In the 1,297 bp region of MCM6 intron 9, we identified a total of 27 SNPs (Tables S10–S12), the majority of which occurred at low frequency (<5%) in each of the geographic regions studied (Tables S10–S12). The variant A-22018 was the only polymorphism shared between African and non-African populations within intron 9. Our data also showed that A-22018 was in strong LD with the LP-associated T-13910 variant (Figure 2; Figures S2, S4, S6, and S7; Table S12), consistent with prior studies of European populations.20,21 However, in the Hazara from Pakistan, the A-22018 variant was not in LD with the T-13910 variant, which was absent from this population. Furthermore, contrary to what was previously reported in the literature, we did not observe the A-22018 variant in the Han from China.45
We also sequenced 2,021 bp of the promoter region of LCT in 940 individuals and found a total of 49 SNPs, mainly at frequencies below 5% within major geographic regions (Tables S13–S15). The majority of the identified SNPs occurred in the first kilobase of the LCT promoter region, in agreement with prior genetic analyses.46,47 Only 6 of the 49 SNPs, specifically C/A-1689, T/C-1578, C/T-1412, C/T-956, A/G-676, and G/A-173, had common derived alleles across all the geographic regions studied, although at varying frequencies (Table S15).
Network Analysis of SNP and Microsatellite Haplotype Data
To reconstruct relationships among inferred haplotypes, we built median-joining networks by using all nucleotide variants identified in the three sequenced regions and four fast-evolving linked microsatellites in 252 individuals carrying at least one of the variants associated with the LP trait in Africa. Our haplotype network showed two major distinct clusters separated by several mutational steps (Figure 4A). One cluster contained haplotypes carrying the C-14010 variant, associated with the LP trait in eastern and southern African populations (Figures 4A and 4B). !Xhosa individuals from southern Africa shared the same haplotype background with Kenyan and Tanzanian individuals, including the Khoisan-speaking Sandawe population from Tanzania (Figure 4C). Interestingly, the single C-14010 variant observed in a Khoisan-speaking San individual from South Africa was on a distinct haplotype background (Figure S8).
The second branch of the network contained haplotypes carrying the other three variants (T-13910, G-13907, and G-13915) associated with the LP trait in Africa, the Middle East, and Europe (Figure 4A). The T-13910 and A-22018 variants occurred on the same haplotype background, consistent with previous studies of European populations (Figures 2, 3, and 4A).8,20,22 Furthermore, some African populations with the T-13910 and A-22018 variants, such as the Bulala from Chad and the Fulani from Cameroon, shared the same haplotype background with Europeans. However, the Fulani also shared a distinct T-13910/A-22018 microsatellite haplotype with the Arabic Baggara from Cameroon (Figures 4A–4C). Further, we noted that the Mozabite from Algeria had the T-13910 and A-22018 variants on the same haplotype background as did the Palestinians from the Middle East (Figures 2, 3, and 4A–4C).
Our haplotype analysis indicated that the G-13907 variant was on similar haplotype backgrounds in the Kenyan, Sudanese, and Ethiopian Afroasiatic-speaking populations (Table S1; Figures 2, 3, 4B, and 4D). Finally, haplotypes containing the G-13915 variant, found mainly in Afroasiatic and a few Nilo-Saharan speakers from eastern and northern Africa (Table S1; Figures 2, 3, and 4), were also shared with Middle Eastern populations (Figures 4B and 4C). Interestingly, we did not observe multiple LP-associated variants on the same haplotype background.
Genotype-Phenotype Association Analyses
We tested for association between the LP trait and common SNPs (>5% frequency) in the three sequenced genomic regions in 322 individuals from 42 populations from Sudan, Kenya, and Tanzania by using Fisher’s exact tests and linear regression (see Material and Methods). For the common SNPs at positions T/G-13915, C/G-13907, and G/C-14010 in intron 13, we included an additional 191 previously genotyped samples with LTT phenotypic data from Tishkoff et al.14 for a final data set of 513 individuals (Table S1). These analyses revealed significant associations between the C-14010 variant and the LP trait in the Niger-Kordofanian, Nilo-Saharan, and Afroasiatic speakers from Kenya and Tanzania (Tables S16, S18, and S19). We also observed a significant correlation between the G-13915 variant and the LP trait in the Kenyan Afroasiatic- and Nilo-Saharan-speaking populations (Tables S16, S20, and S21). Similarly, our analyses revealed a significant association between the G-13907 variant and the LP trait in Afroasiatic speakers from Kenya and the Sudan (Tables S16, S22, and S23).
On the basis of our sequencing data for 322 individuals, we also observed a significant correlation between LP and the G-12962 variant in intron 13 in Kenyan Afroasiatic-speaking populations (Fisher’s exact test, p < 0.002; regression analysis, p < 0.002) (Tables S16 and S24). However, the G-12692 variant was found to be in strong LD (D′ = 1.0) with both the C-14010 and the G-13915 variants in Kenyan Afroasiatic speakers, which could account for the observed genetic association (Figure S3). Similarly, in the LCT promoter region, we detected a significant association between the T-956 variant and LP in Kenyan Afroasiatic speakers (Tables S16 and S25). However, the T-956 variant was in strong LD (D′ = 1.0) with the C-14010 variant in Kenyan Afroasiatic-speaking populations (Figure S3), which could account for the association results at this locus (Figures S2–S7). We did not observe a relationship between the LP trait and SNPs within intron 9 of MCM6.
Regression analyses indicated that C-14010, G-13915, and G-13907 (all associated with the LP trait), but not G-13907, which accounts for ∼45% of the phenotypic variation in the Beja Sudanese Afroasiatic-speaking population, independently explain no more than ∼21% of the variance observed in populations from eastern Africa (Tables S19, S21, and S23). For populations carrying multiple LP-associated variants (Kenyan and Sudanese Afroasiatic-speaking populations and Kenyan Nilo-Saharan-speaking populations), our data showed that the combined variants account for no more than 45% of the phenotypic variance (Table S26), suggesting that other genetic, epigenetic, and/or environmental factors most likely contribute to the phenotypic variance of LP in these populations.
EHH Analysis
Several studies have shown that the C-14010, G-13915, T-13910, and G-13907 variants in intron 13 of MCM6 are targets of recent positive selection in European, African, and Middle Eastern populations.14,16,19,21,48,49 In order to extend these analyses to additional diverse African populations, we applied both EHH38 and iHS39 analysis to study long-range haplotype homozygosity. We plotted the EHH values for SNPs across chromosome 2 with the common LP-associated variants serving as core SNPs, and we identified outliers of observed iHS scores for LP-associated SNPs by comparing them against the empirical distribution of unstandardized iHS values for all other SNPs on chromosome 2. Our analyses revealed large negative iHS scores for the C-14010 variant in eastern African populations (except in the Sandawe from Tanzania) and for the T-13910 variant in the Fulani pastoralists from Cameroon (falling outside of the 95% threshold cutoff of the empirical distribution), indicating unusually long haplotypes carrying these derived alleles (Figure 5; Figures S9 and S10). Indeed, we observed long-range EHH extending >2 Mb on chromosomes containing the C-14010 variant in eastern Africans, consistent with Tishkoff et al.,14 and extending >1 Mb on chromosomes containing the T-13910-derived allele in the Fulani (Figure 5; Figure S10). We also detected extensive EHH (>2 Mb) on chromosomes containing the C-14010 variant in the Kenyan and Tanzanian Niger-Kordofanian populations and in the Sandawe, although at a shorter distance (∼1.1 Mb) (Figure 5; Figure S9). For chromosomes containing the G-13915 and G-13907 variants, we observed haplotype homozygosity extending ∼1.2 Mb in the Kenyan Afroasiatic-speaking populations, whereas for the same two variants in the Beja Afroasiatic speakers from Sudan, we detected shorter haplotype homozygosity (∼0.2 Mb) (Figures S10 and S11). However, unstandardized iHS scores for both G-13915 and G-13907 were not unusual relative to the empirical distribution, except for the Beja Afroasiatic speakers from Sudan; this was most likely because of the small sample sizes and multiple LP-associated extended haplotypes in the same populations, resulting in reduced power to detect signatures of selection with this statistic (Figure S11).
Figure 5.
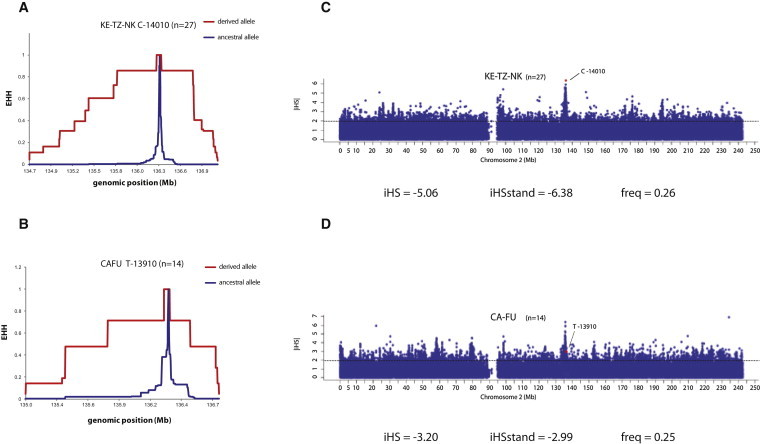
EHH and iHS Analyses for Chromosomes Carrying the C-14010 and T-13910 Variants
(A and B) EHH plots in Kenyan and Tanzanian Niger-Kordofanian speakers (KE-TZ-NK) (A) and in Fulani from Cameroon (CAFU) (B). Chromosomes containing the derived LP-associated alleles are colored in red, and those with the ancestral allele are colored in blue. Chromosomal positions are indicated on the x axes, and EHH values are indicated on the y axes.
(C and D) The absolute values of standardized iHS (|iHS|) estimates are plotted against the genomic positions (NCBI Genome browser build 36.1) of SNPs at MCM6 and LCT promoter regions and the neighboring genetic regions on chromosome 2 in Kenyan and Tanzanian Niger-Kordofanian speakers (KE-TZ-NK) (C) and in the Fulani from Cameroon (CAFU) (D). The dots colored in red are the |iHS| estimates for the SNPs associated with the LP trait. The 95% cutoff value (1.96) of the empirical distribution of standardized iHS is given in each plot (dashed line). “iHS” stands for unstandardized iHS, and “iHS stand” stands for standardized iHS, as described by Voight et al.39; “freq” indicates the frequency of the derived allele at the core SNP.
For the other two variants (G-12962 and T-956) associated with the LP trait in the Kenyan Afroasiatic speakers, we found no difference in the length of haplotype homozygosity on chromosomes with the derived T-956 variant and chromosomes with the ancestral allele, and the iHS value for this variant was not outside the 95% cutoff of the empirical distribution (Figure S12). However, for the G-12962 variant, we observed EHH extending ∼1.1 Mb, although the iHS score for this SNP did not fall within the top 5% of the empirical distribution (Figure S12). Consistent with the EHH and iHS analyses described above, we also observed significantly negative DT values in MCM6 intron 13, where these common LP-associated variants are located, in the majority of African pastoralist populations (Tables S27–S32).
Discussion
Genotype-Phenotype Associations
We have conducted a large-scale study of LTT phenotypic variation in 513 individuals originating from 50 diverse populations from eastern Africa, and we confirm significant associations between common variants (C-14010, G-13915, and G-13907) in MCM6 intron 13 and the LP trait in these populations.11,13–17,19,21,22,50,51 We also found significant genotype-phenotype correlations for two additional variants located in intron 13 of MCM6 (G-12962) and in the LCT promoter region (T-956), although these results can possibly be explained by the strong LD between these alleles and the common LP-associated variants. Alternatively, these findings raise the possibility that genetic variants in other regions of the genome, perhaps acting epistatically, might influence LP phenotypic variance.
Although we observed a number of common variants associated with the LP trait, these do not fully account for the measured phenotypic variation. Given our extensive sequencing analysis in all of the currently identified potential LCT regulatory regions, it is possible that additional variants or other biological and/or environmental factors play a role in the LP trait. For example, our data showed that 47% of the Hadza, a Tanzanian hunter-gatherer population with no history of dairy production and with no known LP-associated variants, were classified as having the LP trait on the basis of the LTT. It is known that LPH, in addition to having lactase activity, has a second enzymatic activity at a different position—phlorizin hydrolase, which uses phlorizin as a substrate.9,52 Phlorizin is a bitter natural product found in bark, roots, and the stems of pear, apple, cherry, and other fruit trees that belong to the Rosaceae family and is present worldwide, including Tanzania, the homeland of the Hadza.52–55 Phlorizin has also been used as traditional medicine to treat fever and infectious diseases, particularly malaria.55,56 Hence, it is possible that the LPH activity in the Hadza hunter-gatherers might have been selected for a broader and more complex role than simply digesting lactose. However, further investigation of this hypothesis is needed.
Also, for individuals who have the LP trait (as suggested by the LTT) but none of the identified variants associated with this trait, it is possible that some carry other LP-associated variants yet to be identified or that they have gut microflora composition that aids in lactose digestion.57,58 Although it is not possible to confirm or exclude the role of the gut microflora in lactose digestion in these individuals, future analyses of microbiome composition in Africans with distinct diets will be informative for distinguishing the role of the microflora in the extent of lactose tolerance. For individuals who are LNP but carry SNPs associated with the LP trait (n = 52), the discrepancy between genotype and phenotype could be related to intestinal infections or other pathologies that can cause temporary or permanent loss of LCT expression in the small intestinal tract in humans (i.e., celiac disease, enteritis, Crohn disease, bacterial or parasitic infections, and small-bowel syndrome).59
Signatures of Recent Selection
Although the LP trait has long been considered a classic example of an adaptive trait in humans,7 it was not until the past 10 years that genetic variants associated with this trait and signatures of natural selection acting at these loci were identified.11,14,16,17,19–21,25 In the present study, we compared LD surrounding the derived and ancestral state for each of the LP-associated SNPs in our study (G/C-14010, T/G-13915, C/T-13910, and C/G-13907) among different populations. We observed the longest EHH for the C-14010 allele in Kenyan and Tanzanian Niger-Kordofanian speakers (>2 Mb) and in Kenyan Afroasiatic and Nilo-Saharan speakers (>1.8 Mb) (Figure 5; Figure S9). (Note that we did not have sufficient sample sizes to perform the EHH test in the Tanzanian Afroasiatic and Nilo-Saharan samples.) However, the Niger-Kordofanian populations from eastern Africa showed extensive levels of admixture with neighboring pastoralist and agropastoralist groups, which could explain the high prevalence of LP-associated variants and the observed EHH in these populations.29 Additionally, the extreme iHS score for the C-14010 variant in several eastern African populations is consistent with recent strong selection acting on this allele.14
We also demonstrated evidence of significant EHH (extending ∼1.5 Mb) on chromosomes carrying the T-13910 allele in the Fulani pastoralists from Cameroon (Figure 5). Given that microsatellite and SNP analysis suggested that this variant is on a haplotype background similar to that for Europeans, it was most likely introduced into the Fulani population by migration and admixture with a non-African source population. However, we cannot distinguish whether the extensive EHH observed in the Fulani was due to strong selection after the mutation was introduced into that population and/or whether a recent selective sweep occurred in a non-African population that then admixed with the Fulani.
Previous studies have shown that the G-13915 and G-13907 derived alleles are involved in maintaining the expression of LCT.14–17,19,26 However, we observed multiple EHH blocks (∼1.2 Mb) and nonextreme iHS values for both the G-13915 and the G-13907 alleles in the Kenyan Afroasiatic populations, most likely because of low allele frequencies (0.03 and 0.06, respectively), which limit statistical power for this test (Figure S11).39 Furthermore, in northern Kenya, the Sudan, and Ethiopia, we found multiple variants influencing LCT expression within the same populations, consistent with “soft selective sweeps” of independent mutations at a single locus,60–62 which also reduces the power of EHH and iHS tests to detect selection.38,39 Thus, development of novel statistical approaches for detecting soft selective sweeps might be informative for identifying additional adaptive variants in the future.63,64 Similarly, our DT results indicated a significant departure from neutrality in intron 13 of MCM6 primarily in eastern African pastoralist populations. Overall, the above findings are consistent with a model of strong recent positive selection acting on this locus, most likely in response to the cultural development of pastoralism.7,14,16,19
Also of interest is the fact that in the Fulani, we observed a peak of standardized iHS values encompassing ZRANB (MIM 604347) and RAB3GAP1 (MIM 602536), located ∼250–600 kb downstream of LCT on chromosome 2; these values were outside of the 95% cutoff of the empirical distribution (Figure 5). These SNPs showed EHH extending up to ∼1.4 Mb. We observed similar peaks of standardized iHS values at these loci in eastern African pastoralist populations (Figure S10). A previous study identified RAB3GAP1 as a locus that contains SNPs with extreme iHS values in the Maasai population from Kenya.48 These observations in both eastern African and Fulani pastoralists (the latter of whom lack the C-14010, G-13915, and G-13907 LP-associated variants) warrant further exploration for identifying possible functional LP-associated SNPs located within this EHH region.
Origins of the T-13910 Variant in Northern and Central African Populations
Age estimates for the T-13910 variant range from 5,000 to 12,300 years ago14,18,19,21,22 and coincide with the origins of cattle domestication in northern Africa and the Levant ∼10,000 years ago.65 Although the T-13910 variant is present in central and northern African pastoralist populations, such as the Fulani and Arabic Baggara from Cameroon and the Mozabite from Algeria, it was not observed in other sub-Saharan African populations.11,14,18,19,21 This distribution of the T-13910 allele in Africa and the shared haplotype background of chromosomes containing this variant in Africans and non-Africans suggest that the T-13910 variant was introduced through gene flow from outside of Africa into northern and/or central Africa.21,29,66 In fact, the T-13910 variant in the Mozabite from Algeria occurred on the same haplotype background as observed in Middle Eastern populations, whereas the Fulani from Cameroon and the Bulala from Chad shared the same haplotype background with Europeans. The Fulani also shared a distinct T-13910 haplotype background with the Arabic Baggara. These patterns suggest that the distribution of observed haplotype variation might be due to gene flow that occurred over time from outside and within Africa possibly during key historical events, such as the settlement of the Roman Empire in parts of northern Africa and the expansion of the Arabs prior to and during the Ottoman empire within the last 2,000 years.67 These inferred migration events are also consistent with studies based on mtDNA, Y chromosome, and autosomal genetic variation.11,29,68–73
Complex History of LP in Eastern Africa
Eastern Africa has been a corridor for human migratory events within and outside Africa for the past 50,000 years.29,74–76 The presence of three of the African LP-associated alleles identified in the current study (G-13915, G-13907, and C-14010) reflects the complexity of the history of this region.
The G-13915 allele is most common in the Arabian Peninsula and the Middle East, suggesting an origin from that region.17,19,77 Its presence in populations from northern, central, and eastern Africa is consistent with historical gene flow from western Asia into those regions.14,15,17,18,77 Within eastern Africa, the G-13915 variant was present only in Kenyan Nilo-Saharan pastoralists and Afroasiatic-speaking agropastoralists mainly from northern Kenya (Table S1; Figures 2 and 3). This variant was also found in the Afroasiatic-speaking Beja pastoralists (∼17%) from northern Sudan and in two other Afroasiatic-speaking populations, namely the Beta Israel from Ethiopia and the Arabic Baggara from Cameroon, at lower frequency (<3%). In addition, we observed this variant outside of Africa in the Temani (from Yemen) and Palestinians at low to moderate frequency (Table S1; Figures 2 and 3). It has been estimated that the G-13915 variant originated ∼4,095 (±2,045) years ago in the Arabian Peninsula, possibly as a result of the domestication of the Arabian camel ∼6,000 years ago,19 and it might have been introduced into eastern Africa within the last 1,400 years as a result of the Arab expansion that accompanied the spread of Islam.15,78 Our observation of the G-13915 polymorphism in the Beja from northern Sudan and the Arabic Baggara from Cameroon, both pastoralist populations with some Arab ancestry, is in agreement with the suggested geographic origin of the G-13915 allele in the Arabian Peninsula and the inferred age of this variant.17,19,29,77,79,80 Although most haplotypes containing the G-13915 variant were present predominantly in the northern Kenyan populations, we found that several of these haplotypes were shared with other populations from Sudan and the Arabian Peninsula, consistent with a scenario of gene flow between populations from these geographic regions (Figures 4B and 4C).
We observed the G-13907 allele mainly in Afroasiatic-speaking populations from northern Sudan, northern Kenya, and Ethiopia (the highest frequency occurred in the Beja from northern Sudan) but did not observe this variant in any of the populations outside of these geographic regions, consistent with other studies.14–16,19 Given that the G-13907 variant has been identified mainly in Cushitic Afroasiatic-speaking populations from Kenya, Sudan, and Ethiopia and that it is absent in southern Cushitic speakers from Tanzania, the most likely origin of the G-13907 allele might be within eastern Ethiopian Cushitic-speaking populations who migrated into northern Kenya and the Sudan within the last ∼5,000 years.29,81,82 More extensive analysis of populations in northeastern Africa will be necessary for gaining further insight into the history of this variant.
The fact that we observed the presence of the C-14010 variant in Tanzania, Kenya, and southern Africa is in agreement with previous studies14,50,51 (Table S1; Figures 2 and 3). The estimated age of the C-14010 allele is ∼2,700–6,800 years old (95% confidence interval = ∼1,200–23,000 years),14 contemporaneous with the time of pastoralist migrations from northern Africa into eastern Africa: archeological data indicate that cattle domestication spread south from the Sahara into Sudan and northern Kenya ∼4,500 years ago and then into southern Kenya and northern Tanzania within the past ∼3,300 years.83,84
Given the inferred age estimate of the C-14010 mutation and the absence of this allele in southern Sudan, it is possible that this LP-associated mutation arose initially in Afroasiatic-speaking populations and was then introduced into Nilo-Saharan-speaking populations through gene flow.14,75,85 Indeed, prior analyses of genetic structure in these populations have indicated high levels of Afroasiatic admixture in eastern African Nilo-Saharan-speaking populations.29 Furthermore, together with previous data showing that the earliest pastoralists in Tanzania were southern Cushitic speakers who migrated from a southern Ethiopian homeland ∼3,500 years ago,29,83 our observation that the highest frequency of the C-14010 variant occurred in Tanzanian populations suggests that this variant might have been introduced by southern Cushitic speakers. Although the C-14010 allele was absent in the Hadza hunter-gatherers (consistent with low levels of gene flow with neighboring groups29), it was present at moderate frequency in the Sandawe hunter-gatherers, who have admixed considerably with neighboring pastoral and agropastoral groups, particularly with southern Cushitic-speaking populations.
The Spread of Pastoralism into Southern Africa
Although the C-14010 LP-associated variant appears to have originated in eastern Africa, we also observed this variant in southern Africa among the San hunter-gatherer population and the agropastoralist Bantu-speaking !Xhosa, who have high levels of San ancestry.29,86 The presence of the C-14010 variant in southern African populations is consistent with prior studies that observed the C-14010 variant in the Bantu-speaking populations from southwestern Angola and in the !Xhosa from South Africa.50,51 Our network analysis showed that the !Xhosa share the same haplotype background with Kenyan and Tanzanian populations, which suggests that the C-14010 variant arose in eastern Africa and was introduced more recently into southern Africa. However, the exact origin of the C-14010 variant in southern Africa is still unknown; the C-14010 variant could have been introduced ∼1,000 years ago by eastern African Bantu-speaking populations, who could have acquired the variant through admixture with neighboring pastoralist groups.81,84,87–91 Alternatively, the presence of the C-14010 variant in southern Africa could have been due to gene flow from eastern Africa prior to the Bantu expansion, corresponding with the archeological record that indicates the presence of cattle in southern Africa (Zambia) as early as 2,400 years ago,76,92 and subsequent introduction of the C-14010 mutation into South African pastoralist communities.92–94 Indeed, archeological and genetic data suggest that there could have been early admixture between “Khoe-Khoe” populations as far north as Zambia and pastoralist populations originating from eastern Africa and then subsequent admixture between the “Khoe-Khoe” and other populations in southern Africa.50,95,96 Interestingly, the one C-14010 variant observed in a San hunter-gatherer individual is on a unique haplotype background. Analyses of larger numbers of San individuals will be required for determining the evolutionary history of the variant in that population. Thus, further analysis of the presence and haplotype background of LP-associated variants in additional southern African populations together with archaeological, anthropological, linguistic, mtDNA, and Y chromosome data will be informative for understanding the history of pastoralism in this region.
Future Directions
Although we have learned a considerable amount about the evolution of LP, more research is needed for shedding further light on the genetic basis of this trait and the spread of pastoralism in Africa. In particular, the collection of additional phenotype data from additional geographic regions in Africa will be informative for understanding the distribution of LP across the continent. Furthermore, the combination of phenotypic data and the use of next-generation sequencing technology for sequencing large genomic regions and/or whole-genome sequences will be invaluable for discovering novel mutations associated with this trait across the genome, as well as identifying possible epistatic interactions among LP-associated mutations. Finally, the integration of these genome-wide studies with microbiome, anthropological, archeological, and paleobiological data will also help to elucidate the complex history of pastoralism within Africa, as well as the genetic and nongenetic factors contributing to the phenotypic variance of LP in human populations.
Acknowledgments
We thank Jacques Loiselet and Charles Wambebe for providing Lebanese and Nigerian samples, respectively. We thank Lilian A. Nyndodo, Eva Aluvalla, Daniel Kariuki, Godfrey Lema, Kweli Powell, Holly Mortensen, Maha Osman, Floyd A. Reed, Alex Tibwitta, George Ogutu, and Hussein Musa for assisting in sample collection. We thank Floyd A. Reed, Guido Barbujani, Dongbo Hu, Laura B. Scheinfeldt, and Karuna Panchapakesan for technical assistance and for valuable discussions. Most of all, we thank all of the African participants who generously donated DNA and phenotype information so that we might learn more about the genetic basis of lactase persistence and the spread of pastoralism in Africa. This research was funded by National Science Foundation grants BCS-0196183 and BCS-0827436 and National Institutes of Health grants 5-R01-GM076637-05 and 8DP1ES022577-04 to S.A.T.
Contributor Information
Alessia Ranciaro, Email: aissela19@yahoo.it.
Sarah A. Tishkoff, Email: tishkoff@mail.med.upenn.edu.
Supplemental Data
Web Resources
The URLs for data presented herein are as follows:
ALFRED (The Allele Frequency Database), http://alfred.med.yale.edu
GLAD (Global Lactase Persistence Association Database), http://www.ucl.ac.uk/mace-lab/resources/glad
Online Mendelian Inheritance in Man (OMIM), http://www.omim.org
UCSC Genome Browser, http://www.genome.ucsc.edu/
References
- 1.Campbell A.K., Waud J.P., Matthews S.B. The molecular basis of lactose intolerance. Sci. Prog. 2005;88:157–202. doi: 10.3184/003685005783238408. [DOI] [PMC free article] [PubMed] [Google Scholar]
- 2.Cook G. Hypolactasia: geographical distribution, diagnosis, and pratical significance. In: Chandra R.K., editor. Volume 2. Plenum Press; New York: 1984. pp. 117–139. (Critical Reviews in Tropical Medicine). [Google Scholar]
- 3.Holzel A., Schwarz V., Sutcliffe K.W. Defective lactose absorption causing malnutrition in infancy. Lancet. 1959;1:1126–1128. doi: 10.1016/s0140-6736(59)90710-x. [DOI] [PubMed] [Google Scholar]
- 4.Jacobi A. Milk-sugar in infant feeding. Transactions of the American Pediatric Society. 1901;13:150–160. [Google Scholar]
- 5.Kretchmer N. Lactose and lactase—a historical perspective. Gastroenterology. 1971;61:805–813. [PubMed] [Google Scholar]
- 6.Sahi T. Hypolactasia and lactase persistence. Historical review and the terminology. Scand. J. Gastroenterol. Suppl. 1994;202:1–6. doi: 10.3109/00365529409091739. [DOI] [PubMed] [Google Scholar]
- 7.Durham W. Coevolution Genes, Culture, and Human Diversity. Stanford University Press; Stanford: 1992. Cultural Mediation: The evolution of adult lactose absorption; pp. 226–285. [Google Scholar]
- 8.Swallow D.M. Genetics of lactase persistence and lactose intolerance. Annu. Rev. Genet. 2003;37:197–219. doi: 10.1146/annurev.genet.37.110801.143820. [DOI] [PubMed] [Google Scholar]
- 9.Troelsen J.T. Adult-type hypolactasia and regulation of lactase expression. Biochim. Biophys. Acta. 2005;1723:19–32. doi: 10.1016/j.bbagen.2005.02.003. [DOI] [PubMed] [Google Scholar]
- 10.Arola H. Diagnosis of hypolactasia and lactose malabsorption. Scand. J. Gastroenterol. Suppl. 1994;202:26–35. doi: 10.3109/00365529409091742. [DOI] [PubMed] [Google Scholar]
- 11.Mulcare C.A., Weale M.E., Jones A.L., Connell B., Zeitlyn D., Tarekegn A., Swallow D.M., Bradman N., Thomas M.G. The T allele of a single-nucleotide polymorphism 13.9 kb upstream of the lactase gene (LCT) (C-13.9kbT) does not predict or cause the lactase-persistence phenotype in Africans. Am. J. Hum. Genet. 2004;74:1102–1110. doi: 10.1086/421050. [DOI] [PMC free article] [PubMed] [Google Scholar]
- 12.Hollox E.J., Poulter M., Zvarik M., Ferak V., Krause A., Jenkins T., Saha N., Kozlov A.I., Swallow D.M. Lactase haplotype diversity in the Old World. Am. J. Hum. Genet. 2001;68:160–172. doi: 10.1086/316924. [DOI] [PMC free article] [PubMed] [Google Scholar]
- 13.Itan Y., Jones B.L., Ingram C.J., Swallow D.M., Thomas M.G. A worldwide correlation of lactase persistence phenotype and genotypes. BMC Evol. Biol. 2010;10:36. doi: 10.1186/1471-2148-10-36. [DOI] [PMC free article] [PubMed] [Google Scholar]
- 14.Tishkoff S.A., Reed F.A., Ranciaro A., Voight B.F., Babbitt C.C., Silverman J.S., Powell K., Mortensen H.M., Hirbo J.B., Osman M. Convergent adaptation of human lactase persistence in Africa and Europe. Nat. Genet. 2007;39:31–40. doi: 10.1038/ng1946. [DOI] [PMC free article] [PubMed] [Google Scholar]
- 15.Ingram C.J., Elamin M.F., Mulcare C.A., Weale M.E., Tarekegn A., Raga T.O., Bekele E., Elamin F.M., Thomas M.G., Bradman N., Swallow D.M. A novel polymorphism associated with lactose tolerance in Africa: multiple causes for lactase persistence? Hum. Genet. 2007;120:779–788. doi: 10.1007/s00439-006-0291-1. [DOI] [PubMed] [Google Scholar]
- 16.Ingram C.J., Mulcare C.A., Itan Y., Thomas M.G., Swallow D.M. Lactose digestion and the evolutionary genetics of lactase persistence. Hum. Genet. 2009;124:579–591. doi: 10.1007/s00439-008-0593-6. [DOI] [PubMed] [Google Scholar]
- 17.Imtiaz F., Savilahti E., Sarnesto A., Trabzuni D., Al-Kahtani K., Kagevi I., Rashed M.S., Meyer B.F., Järvelä I. The T/G 13915 variant upstream of the lactase gene (LCT) is the founder allele of lactase persistence in an urban Saudi population. J. Med. Genet. 2007;44:e89. doi: 10.1136/jmg.2007.051631. [DOI] [PMC free article] [PubMed] [Google Scholar]
- 18.Enattah N.S., Trudeau A., Pimenoff V., Maiuri L., Auricchio S., Greco L., Rossi M., Lentze M., Seo J.K., Rahgozar S. Evidence of still-ongoing convergence evolution of the lactase persistence T-13910 alleles in humans. Am. J. Hum. Genet. 2007;81:615–625. doi: 10.1086/520705. [DOI] [PMC free article] [PubMed] [Google Scholar]
- 19.Enattah N.S., Jensen T.G., Nielsen M., Lewinski R., Kuokkanen M., Rasinpera H., El-Shanti H., Seo J.K., Alifrangis M., Khalil I.F. Independent introduction of two lactase-persistence alleles into human populations reflects different history of adaptation to milk culture. Am. J. Hum. Genet. 2008;82:57–72. doi: 10.1016/j.ajhg.2007.09.012. [DOI] [PMC free article] [PubMed] [Google Scholar]
- 20.Enattah N.S., Sahi T., Savilahti E., Terwilliger J.D., Peltonen L., Järvelä I. Identification of a variant associated with adult-type hypolactasia. Nat. Genet. 2002;30:233–237. doi: 10.1038/ng826. [DOI] [PubMed] [Google Scholar]
- 21.Bersaglieri T., Sabeti P.C., Patterson N., Vanderploeg T., Schaffner S.F., Drake J.A., Rhodes M., Reich D.E., Hirschhorn J.N. Genetic signatures of strong recent positive selection at the lactase gene. Am. J. Hum. Genet. 2004;74:1111–1120. doi: 10.1086/421051. [DOI] [PMC free article] [PubMed] [Google Scholar]
- 22.Coelho M., Luiselli D., Bertorelle G., Lopes A.I., Seixas S., Destro-Bisol G., Rocha J. Microsatellite variation and evolution of human lactase persistence. Hum. Genet. 2005;117:329–339. doi: 10.1007/s00439-005-1322-z. [DOI] [PubMed] [Google Scholar]
- 23.Lewinsky R.H., Jensen T.G., Møller J., Stensballe A., Olsen J., Troelsen J.T. T-13910 DNA variant associated with lactase persistence interacts with Oct-1 and stimulates lactase promoter activity in vitro. Hum. Mol. Genet. 2005;14:3945–3953. doi: 10.1093/hmg/ddi418. [DOI] [PubMed] [Google Scholar]
- 24.Ingram C.J., Raga T.O., Tarekegn A., Browning S.L., Elamin M.F., Bekele E., Thomas M.G., Weale M.E., Bradman N., Swallow D.M. Multiple rare variants as a cause of a common phenotype: several different lactase persistence associated alleles in a single ethnic group. J. Mol. Evol. 2009;69:579–588. doi: 10.1007/s00239-009-9301-y. [DOI] [PubMed] [Google Scholar]
- 25.Jones B.L., Raga T.O., Liebert A., Zmarz P., Bekele E., Danielsen E.T., Olsen A.K., Bradman N., Troelsen J.T., Swallow D.M. Diversity of lactase persistence alleles in Ethiopia: signature of a soft selective sweep. Am. J. Hum. Genet. 2013;93:538–544. doi: 10.1016/j.ajhg.2013.07.008. [DOI] [PMC free article] [PubMed] [Google Scholar]
- 26.Olds L.C., Ahn J.K., Sibley E. 13915∗G DNA polymorphism associated with lactase persistence in Africa interacts with Oct-1. Hum. Genet. 2011;129:111–113. doi: 10.1007/s00439-010-0898-0. [DOI] [PMC free article] [PubMed] [Google Scholar]
- 27.Jensen T.G., Liebert A., Lewinsky R., Swallow D.M., Olsen J., Troelsen J.T. The -14010∗C variant associated with lactase persistence is located between an Oct-1 and HNF1α binding site and increases lactase promoter activity. Hum. Genet. 2011;130:483–493. doi: 10.1007/s00439-011-0966-0. [DOI] [PubMed] [Google Scholar]
- 28.Troelsen J.T., Olsen J., Møller J., Sjöström H. An upstream polymorphism associated with lactase persistence has increased enhancer activity. Gastroenterology. 2003;125:1686–1694. doi: 10.1053/j.gastro.2003.09.031. [DOI] [PubMed] [Google Scholar]
- 29.Tishkoff S.A., Reed F.A., Friedlaender F.R., Ehret C., Ranciaro A., Froment A., Hirbo J.B., Awomoyi A.A., Bodo J.-M., Doumbo O. The genetic structure and history of Africans and African Americans. Science. 2009;324:1035–1044. doi: 10.1126/science.1172257. [DOI] [PMC free article] [PubMed] [Google Scholar]
- 30.Ewing B., Green P. Base-calling of automated sequencer traces using phred. II. Error probabilities. Genome Res. 1998;8:186–194. [PubMed] [Google Scholar]
- 31.Gordon D., Abajian C., Green P. Consed: a graphical tool for sequence finishing. Genome Res. 1998;8:195–202. doi: 10.1101/gr.8.3.195. [DOI] [PubMed] [Google Scholar]
- 32.Nickerson D.A., Tobe V.O., Taylor S.L. PolyPhred: automating the detection and genotyping of single nucleotide substitutions using fluorescence-based resequencing. Nucleic Acids Res. 1997;25:2745–2751. doi: 10.1093/nar/25.14.2745. [DOI] [PMC free article] [PubMed] [Google Scholar]
- 33.Scheet P., Stephens M. A fast and flexible statistical model for large-scale population genotype data: applications to inferring missing genotypes and haplotypic phase. Am. J. Hum. Genet. 2006;78:629–644. doi: 10.1086/502802. [DOI] [PMC free article] [PubMed] [Google Scholar]
- 34.Stephens M., Smith N.J., Donnelly P. A new statistical method for haplotype reconstruction from population data. Am. J. Hum. Genet. 2001;68:978–989. doi: 10.1086/319501. [DOI] [PMC free article] [PubMed] [Google Scholar]
- 35.Stephens M., Donnelly P. A comparison of bayesian methods for haplotype reconstruction from population genotype data. Am. J. Hum. Genet. 2003;73:1162–1169. doi: 10.1086/379378. [DOI] [PMC free article] [PubMed] [Google Scholar]
- 36.Crawford D.C., Bhangale T., Li N., Hellenthal G., Rieder M.J., Nickerson D.A., Stephens M. Evidence for substantial fine-scale variation in recombination rates across the human genome. Nat. Genet. 2004;36:700–706. doi: 10.1038/ng1376. [DOI] [PubMed] [Google Scholar]
- 37.Barrett J.C., Fry B., Maller J., Daly M.J. Haploview: analysis and visualization of LD and haplotype maps. Bioinformatics. 2005;21:263–265. doi: 10.1093/bioinformatics/bth457. [DOI] [PubMed] [Google Scholar]
- 38.Sabeti P.C., Schaffner S.F., Fry B., Lohmueller J., Varilly P., Shamovsky O., Palma A., Mikkelsen T.S., Altshuler D., Lander E.S. Positive natural selection in the human lineage. Science. 2006;312:1614–1620. doi: 10.1126/science.1124309. [DOI] [PubMed] [Google Scholar]
- 39.Voight B.F., Kudaravalli S., Wen X., Pritchard J.K. A map of recent positive selection in the human genome. PLoS Biol. 2006;4:e72. doi: 10.1371/journal.pbio.0040072. [DOI] [PMC free article] [PubMed] [Google Scholar]
- 40.Jarvis J.P., Scheinfeldt L.B., Soi S., Lambert C., Omberg L., Ferwerda B., Froment A., Bodo J.M., Beggs W., Hoffman G. Patterns of ancestry, signatures of natural selection, and genetic association with stature in Western African pygmies. PLoS Genet. 2012;8:e1002641. doi: 10.1371/journal.pgen.1002641. [DOI] [PMC free article] [PubMed] [Google Scholar]
- 41.Tajima F. The effect of change in population size on DNA polymorphism. Genetics. 1989;123:597–601. doi: 10.1093/genetics/123.3.597. [DOI] [PMC free article] [PubMed] [Google Scholar]
- 42.Tajima F. Statistical method for testing the neutral mutation hypothesis by DNA polymorphism. Genetics. 1989;123:585–595. doi: 10.1093/genetics/123.3.585. [DOI] [PMC free article] [PubMed] [Google Scholar]
- 43.Librado P., Rozas J. DnaSP v5: a software for comprehensive analysis of DNA polymorphism data. Bioinformatics. 2009;25:1451–1452. doi: 10.1093/bioinformatics/btp187. [DOI] [PubMed] [Google Scholar]
- 44.Hudson R.R., Slatkin M., Maddison W.P. Estimation of levels of gene flow from DNA sequence data. Genetics. 1992;132:583–589. doi: 10.1093/genetics/132.2.583. [DOI] [PMC free article] [PubMed] [Google Scholar]
- 45.Sun H.M., Qiao Y.D., Chen F., Xu L.D., Bai J., Fu S.B. The lactase gene -13910T allele can not predict the lactase-persistence phenotype in north China. Asia Pac. J. Clin. Nutr. 2007;16:598–601. [PubMed] [Google Scholar]
- 46.Harvey C.B., Pratt W.S., Islam I., Whitehouse D.B., Swallow D.M. DNA polymorphisms in the lactase gene. Linkage disequilibrium across the 70-kb region. Eur. J. Hum. Genet. 1995;3:27–41. doi: 10.1159/000472271. [DOI] [PubMed] [Google Scholar]
- 47.Hollox E.J., Poulter M., Wang Y., Krause A., Swallow D.M. Common polymorphism in a highly variable region upstream of the human lactase gene affects DNA-protein interactions. Eur. J. Hum. Genet. 1999;7:791–800. doi: 10.1038/sj.ejhg.5200369. [DOI] [PubMed] [Google Scholar]
- 48.Wagh K., Bhatia A., Alexe G., Reddy A., Ravikumar V., Seiler M., Boemo M., Yao M., Cronk L., Naqvi A. Lactase persistence and lipid pathway selection in the Maasai. PLoS ONE. 2012;7:e44751. doi: 10.1371/journal.pone.0044751. [DOI] [PMC free article] [PubMed] [Google Scholar]
- 49.Schlebusch C.M., Sjödin P., Skoglund P., Jakobsson M. Stronger signal of recent selection for lactase persistence in Maasai than in Europeans. Eur. J. Hum. Genet. 2013;21:550–553. doi: 10.1038/ejhg.2012.199. [DOI] [PMC free article] [PubMed] [Google Scholar]
- 50.Coelho M., Sequeira F., Luiselli D., Beleza S., Rocha J. On the edge of Bantu expansions: mtDNA, Y chromosome and lactase persistence genetic variation in southwestern Angola. BMC Evol. Biol. 2009;9:80. doi: 10.1186/1471-2148-9-80. [DOI] [PMC free article] [PubMed] [Google Scholar]
- 51.Torniainen S., Parker M.I., Holmberg V., Lahtela E., Dandara C., Jarvela I. Screening of variants for lactase persistence/non-persistence in populations from South Africa and Ghana. BMC Genet. 2009;10:31. doi: 10.1186/1471-2156-10-31. [DOI] [PMC free article] [PubMed] [Google Scholar]
- 52.Wacker H., Keller P., Falchetto R., Legler G., Semenza G. Location of the two catalytic sites in intestinal lactase-phlorizin hydrolase. Comparison with sucrase-isomaltase and with other glycosidases, the membrane anchor of lactase-phlorizin hydrolase. J. Biol. Chem. 1992;267:18744–18752. [PubMed] [Google Scholar]
- 53.Freund J.N., Gossé F., Raul F. Derivatives of plant beta-glucans are hydrolyzed by intestinal lactase-phlorizin hydrolase of mammals. Enzyme. 1991;45:71–74. doi: 10.1159/000468868. [DOI] [PubMed] [Google Scholar]
- 54.Swallow D.M., Poulter M., Hollox E.J. Intolerance to lactose and other dietary sugars. Drug Metab. Dispos. 2001;29:513–516. [PubMed] [Google Scholar]
- 55.Mishra B.B., Tiwari V.K. Natural products: an evolving role in future drug discovery. Eur. J. Med. Chem. 2011;46:4769–4807. doi: 10.1016/j.ejmech.2011.07.057. [DOI] [PubMed] [Google Scholar]
- 56.Ehrenkranz J.R., Lewis N.G., Kahn C.R., Roth J. Phlorizin: a review. Diabetes Metab. Res. Rev. 2005;21:31–38. doi: 10.1002/dmrr.532. [DOI] [PubMed] [Google Scholar]
- 57.Kumari A., Catanzaro R., Marotta F. Clinical importance of lactic acid bacteria: a short review. Acta Biomed. 2011;82:177–180. [PubMed] [Google Scholar]
- 58.Saulnier D.M., Kolida S., Gibson G.R. Microbiology of the human intestinal tract and approaches for its dietary modulation. Curr. Pharm. Des. 2009;15:1403–1414. doi: 10.2174/138161209788168128. [DOI] [PubMed] [Google Scholar]
- 59.de Vrese M., Stegelmann A., Richter B., Fenselau S., Laue C., Schrezenmeir J. Probiotics—compensation for lactase insufficiency. Am. J. Clin. Nutr. 2001;73(Suppl):421S–429S. doi: 10.1093/ajcn/73.2.421s. [DOI] [PubMed] [Google Scholar]
- 60.Pritchard J.K., Pickrell J.K., Coop G. The genetics of human adaptation: hard sweeps, soft sweeps, and polygenic adaptation. Curr. Biol. 2010;20:R208–R215. doi: 10.1016/j.cub.2009.11.055. [DOI] [PMC free article] [PubMed] [Google Scholar]
- 61.Pennings P.S., Hermisson J. Soft sweeps II—molecular population genetics of adaptation from recurrent mutation or migration. Mol. Biol. Evol. 2006;23:1076–1084. doi: 10.1093/molbev/msj117. [DOI] [PubMed] [Google Scholar]
- 62.Przeworski M., Coop G., Wall J.D. The signature of positive selection on standing genetic variation. Evolution. 2005;59:2312–2323. [PubMed] [Google Scholar]
- 63.Scheinfeldt L.B., Tishkoff S.A. Recent human adaptation: genomic approaches, interpretation and insights. Nat. Rev. Genet. 2013;14:692–702. doi: 10.1038/nrg3604. [DOI] [PMC free article] [PubMed] [Google Scholar]
- 64.Cutter A.D., Payseur B.A. Genomic signatures of selection at linked sites: unifying the disparity among species. Nat. Rev. Genet. 2013;14:262–274. doi: 10.1038/nrg3425. [DOI] [PMC free article] [PubMed] [Google Scholar]
- 65.Hanotte O., Bradley D.G., Ochieng J.W., Verjee Y., Hill E.W., Rege J.E. African pastoralism: genetic imprints of origins and migrations. Science. 2002;296:336–339. doi: 10.1126/science.1069878. [DOI] [PubMed] [Google Scholar]
- 66.Henn B.M., Botigué L.R., Gravel S., Wang W., Brisbin A., Byrnes J.K., Fadhlaoui-Zid K., Zalloua P.A., Moreno-Estrada A., Bertranpetit J. Genomic ancestry of North Africans supports back-to-Africa migrations. PLoS Genet. 2012;8:e1002397. doi: 10.1371/journal.pgen.1002397. [DOI] [PMC free article] [PubMed] [Google Scholar]
- 67.Ehret C. University Press of Virginia; Charlottesville: 2002. The civilizations of Africa: a history to 1800. [Google Scholar]
- 68.Arredi B., Poloni E.S., Paracchini S., Zerjal T., Fathallah D.M., Makrelouf M., Pascali V.L., Novelletto A., Tyler-Smith C. A predominantly neolithic origin for Y-chromosomal DNA variation in North Africa. Am. J. Hum. Genet. 2004;75:338–345. doi: 10.1086/423147. [DOI] [PMC free article] [PubMed] [Google Scholar]
- 69.Bosch E., Calafell F., Comas D., Oefner P.J., Underhill P.A., Bertranpetit J. High-resolution analysis of human Y-chromosome variation shows a sharp discontinuity and limited gene flow between northwestern Africa and the Iberian Peninsula. Am. J. Hum. Genet. 2001;68:1019–1029. doi: 10.1086/319521. [DOI] [PMC free article] [PubMed] [Google Scholar]
- 70.Fadhlaoui-Zid K., Rodríguez-Botigué L., Naoui N., Benammar-Elgaaied A., Calafell F., Comas D. Mitochondrial DNA structure in North Africa reveals a genetic discontinuity in the Nile Valley. Am. J. Phys. Anthropol. 2011;145:107–117. doi: 10.1002/ajpa.21472. [DOI] [PubMed] [Google Scholar]
- 71.Maca-Meyer N., González A.M., Pestano J., Flores C., Larruga J.M., Cabrera V.M. Mitochondrial DNA transit between West Asia and North Africa inferred from U6 phylogeography. BMC Genet. 2003;4:15. doi: 10.1186/1471-2156-4-15. [DOI] [PMC free article] [PubMed] [Google Scholar]
- 72.Cerný V., Hájek M., Bromová M., Cmejla R., Diallo I., Brdicka R. MtDNA of Fulani nomads and their genetic relationships to neighboring sedentary populations. Hum. Biol. 2006;78:9–27. doi: 10.1353/hub.2006.0024. [DOI] [PubMed] [Google Scholar]
- 73.Hassan H.Y., Underhill P.A., Cavalli-Sforza L.L., Ibrahim M.E. Y-chromosome variation among Sudanese: restricted gene flow, concordance with language, geography, and history. Am. J. Phys. Anthropol. 2008;137:316–323. doi: 10.1002/ajpa.20876. [DOI] [PubMed] [Google Scholar]
- 74.Campbell M.C., Tishkoff S.A. African genetic diversity: implications for human demographic history, modern human origins, and complex disease mapping. Annu. Rev. Genomics Hum. Genet. 2008;9:403–433. doi: 10.1146/annurev.genom.9.081307.164258. [DOI] [PMC free article] [PubMed] [Google Scholar]
- 75.Hirbo J.B., Ranciaro A., Tishkoff S.A. Population structure and migration in Africa: correlations between archaeological, linguistic and genetic data. In: Crawford M.H., editor. Causes and consequences of human migration: An evolutionary perspective, C.B.C. Cambridge University Press; Cambridge: 2012. pp. 135–171. [Google Scholar]
- 76.Smith A. Origin and spread of pastoralism in Africa. Annu. Rev. Anthropol. 1992;21:121–141. [Google Scholar]
- 77.Cook G.C. Did Persistence of Intestinal Lactase Into Adult Life Originate on the Arabian Peninsula? Man. 1978;13:418–427. [Google Scholar]
- 78.Alexander J. Islam, Archaeology and Slavery in Africa. World Archaeol. 2001;33:44–60. [Google Scholar]
- 79.Levy T., Holl A. Migrations, ethnogenesis and settlement dynamics: Israelites in iron ages Canaan ans Shuaw-Arabs in the Tchad basin. Journal of Anthropological Archaeology. 2002;21:83–118. [Google Scholar]
- 80.Vanhove, M. (2006). The Beja language today in Sudan: the state of the art in linguistic. Proceedings of the 7th International Studies Conference.
- 81.Ehret C. University Press of Virginia; Charlottesville: 1998. An African classical age: eastern and southern Africa in world history, 1000 B.C. to A.D. 400. [Google Scholar]
- 82.Ehret C. Linguistic stratigraphies and Holocene history in Northeastern Africa. In: Kroeper K., Chlodnicki M., Kobusiewicz M., editors. Archaeology of Early Northeastern Africa. Poznan Archaeological Museum; Poznan: 2006. pp. 1019–1055. [Google Scholar]
- 83.Ambrose S.H. Chronology of the Later Stone Age and Food Production in East Africa. J. Archaeol. Sci. 1998;25:377–392. [Google Scholar]
- 84.Ehret C. Northwestern University Press; Evanston: 1971. Southern Nilotic history; linguistic approaches to the study of the past. [Google Scholar]
- 85.Pagani L., Kivisild T., Tarekegn A., Ekong R., Plaster C., Gallego Romero I., Ayub Q., Mehdi S.Q., Thomas M.G., Luiselli D. Ethiopian genetic diversity reveals linguistic stratification and complex influences on the Ethiopian gene pool. Am. J. Hum. Genet. 2012;91:83–96. doi: 10.1016/j.ajhg.2012.05.015. [DOI] [PMC free article] [PubMed] [Google Scholar]
- 86.Schlebusch C.M., Skoglund P., Sjödin P., Gattepaille L.M., Hernandez D., Jay F., Li S., De Jongh M., Singleton A., Blum M.G. Genomic variation in seven Khoe-San groups reveals adaptation and complex African history. Science. 2012;338:374–379. doi: 10.1126/science.1227721. [DOI] [PMC free article] [PubMed] [Google Scholar]
- 87.Denbow J. A New Look at the Later Prehistory of the Kalahari. J. Afr. Hist. 1986;27:3–28. [Google Scholar]
- 88.Robbins L.H., Campbell A.C., Murphy M.L., Brook G.A., Srivastava P., Badenhorst S. The Advent of Herding in Southern Africa: Early AMS Dates on Domestic Livestock from the Kalahari Desert. Curr. Anthropol. 2005;46:671–677. [Google Scholar]
- 89.Ehret C. Cattle-Keeping and Milking in Eastern and Southern African History: The Linguistic Evidence. J. Afr. Hist. 1967;8:1–17. [Google Scholar]
- 90.Hoogendijk C.F., Scholtz C.L., Pimstone S.M., Ehrenborg E., Kastelein J.J., Defesche J.C., Thiart R., du Plessis L., de Villiers J.N., Zaahl M.G. Allelic variation in the promoter region of the LDL receptor gene: analysis of an African-specific variant in the FP2 cis-acting regulatory element. Mol. Cell. Probes. 2003;17:175–181. doi: 10.1016/s0890-8508(03)00050-1. [DOI] [PubMed] [Google Scholar]
- 91.Fleming H.C. Asa and Aramanik: Cushitic Hunters in Maasai Land. Ethnology. 1969;8:1–36. [Google Scholar]
- 92.Phillipson D.W. Africana Pub. Co.; New York: 1977. The later prehistory of eastern and southern Africa. [Google Scholar]
- 93.Carvalho E.C.D. “Traditional” and “Modern” Patterns of Cattle Raising in Southwestern Angola: A Critical Evaluation of Change from Pastoralism to Ranching. J. Dev. Areas. 1974;8:199–226. [Google Scholar]
- 94.Roland O. The Nilotic Contribution to Bantu Africa. J. Afr. Hist. 1982;23:433–442. [Google Scholar]
- 95.Henn B.M., Gignoux C., Lin A.A., Oefner P.J., Shen P., Scozzari R., Cruciani F., Tishkoff S.A., Mountain J.L., Underhill P.A. Y-chromosomal evidence of a pastoralist migration through Tanzania to southern Africa. Proc. Natl. Acad. Sci. USA. 2008;105:10693–10698. doi: 10.1073/pnas.0801184105. [DOI] [PMC free article] [PubMed] [Google Scholar]
- 96.Newman J. Yale Univ. Press; New Haven, London: 1995. The Peopling of Africa. [Google Scholar]
Associated Data
This section collects any data citations, data availability statements, or supplementary materials included in this article.