

In planta accumulation of short chitin oligomers results in a strong conditional phenotype.
Abstract
To study the effect of short N-acetylglucosamine (GlcNAc) oligosaccharides on the physiology of plants, N-ACETYLGLUCOSAMINYLTRANSFERASE (NodC) of Azorhizobium caulinodans was expressed in Arabidopsis (Arabidopsis thaliana). The corresponding enzyme catalyzes the polymerization of GlcNAc and, accordingly, β-1,4-GlcNAc oligomers accumulated in the plant. A phenotype characterized by difficulties in developing an inflorescence stem was visible when plants were grown for several weeks under short-day conditions before transfer to long-day conditions. In addition, a positive correlation between the oligomer concentration and the penetrance of the phenotype was demonstrated. Although NodC overexpression lines produced less cell wall compared with wild-type plants under nonpermissive conditions, no indications were found for changes in the amount of the major cell wall polymers. The effect on the cell wall was reflected at the transcriptome level. In addition to genes encoding cell wall-modifying enzymes, a whole set of genes encoding membrane-coupled receptor-like kinases were differentially expressed upon GlcNAc accumulation, many of which encoded proteins with an extracellular Domain of Unknown Function26. Although stress-related genes were also differentially expressed, the observed response differed from that of a classical chitin response. This is in line with the fact that the produced chitin oligomers were too small to activate the chitin receptor-mediated signal cascade. Based on our observations, we propose a model in which the oligosaccharides modify the architecture of the cell wall by acting as competitors in carbohydrate-carbohydrate or carbohydrate-protein interactions, thereby affecting noncovalent interactions in the cell wall or at the interface between the cell wall and the plasma membrane.
The plant cell wall is a complex matrix with unique properties that protects and supports the cell and determines its architecture. After cell division, a primary cell wall composed of polysaccharides and glycoproteins is formed to separate and support both expanding daughter cells (Popper, 2008). Depending on the cell type and fate, a secondary cell wall containing hydrophobic lignin is deposited to further strengthen the cell wall and form a water-impermeable barrier (Boerjan et al., 2003). Cellulose is the major structural polysaccharide in most cell walls; it is a linear polymer composed of several hundred to over 10,000 β-1,4-linked d-Glc residues. Individual cellulose chains are interconnected by hydrogen bonds into microfibrils that give both strength and flexibility to the cell wall. Compared with cellulose, the other polysaccharides of the cell wall (hemicelluloses and pectins) are more complex, composed of various sugar monomers, and often branched. According to current knowledge, some hemicelluloses interact with cellulose microfibrils to form a network that resists tension stress. Pectins, on the other hand, form a matrix in which the other polymers are embedded to provide resistance against compression force. Because each polymer comes with unique physical and chemical properties, the specific characteristics of the cell wall are largely determined by its exact composition (Liepman et al., 2010).
Plants can be engineered to incorporate nonplant polymers into their cell walls, creating new materials with industrially relevant physicochemical properties. One of the interesting polysaccharides to produce in the plant cell wall is chitin, as its building block, N-acetylglucosamine (GlcNAc), is a structural analog of the cellulose monomer Glc, with a bulky acetylamino group replacing the hydroxyl group at the C2 position. Upon deacetylation, the positively charged amino functionality in the resulting chitosan can improve the reactivity of fibers with reactants such as flame retardants, softeners, antistatic agents, and dyes (Barker et al., 1975). Although the in vitro production of these exopolymers has been described (Shirai et al., 1997; Lee et al., 2001; Liu et al., 2001; He et al., 2009; de Mesquita et al., 2012), no experimental data have been provided on the production of chitin or chitosan in plants or on their incorporation into plant cell walls. Such in vivo production could have important benefits, as it would avoid the disadvantages related to the need in various applications for postisolation modification of cellulose fibers, such as low yield or quality, and the occurrence of undesirable side reactions, which are difficult to control. Besides these benefits, a chitin-related stress response is to be expected when these GlcNAc polysaccharides accumulate in the plant tissue. Chitin is a major component of the cell wall of plant pathogenic fungi and the exoskeleton of plant-feeding arthropods. To recognize these elicitors upon attack by such pathogens, plants are equipped with membrane-spanning receptors that activate a signaling cascade upon binding with GlcNAc oligosaccharides, resulting in the activation of defense responses (Miya et al., 2007; Wan et al., 2008). However, in order to activate this chitin-mediated defense response, oligosaccharides with a certain length are essential to stabilize homodimerization of the receptor (Liu et al., 2012). This suggests that shorter oligomers could be used to modify cellulose properties in the plant while avoiding the activation of stress responses.
To study the influence of short GlcNAc oligomers on plant growth and development, we expressed the N-ACETYLGLUCOSAMINYLTRANSFERASE (NodC) gene of the nitrogen-fixing bacterium Azorhizobium caulinodans in Arabidopsis (Arabidopsis thaliana) for in planta production of GlcNAc oligosaccharides from the available UDP-GlcNAc pool (Fig. 1A). We show that accumulating GlcNAc oligomers do not induce the classical chitin stress response in plants but cause a conditional phenotype, probably by competing with noncovalent interactions in the apoplast. This has a profound impact on the cell wall architecture and is reflected by the increase in expression of a set of receptor-like kinases (RLKs) that could play an important role in monitoring the integrity of the plant cell wall.
Figure 1.

Synthesis and accumulation of GlcNAc monomers and oligomers in NodC OE lines. A, NodC catalyzes the transfer of GlcNAc from UDP-GlcNAc to the growing GlcNAc oligomer. B, Retention times of the GlcNAc monomer as well as the different GlcNAc oligomers (DP = 2–6) as determined by authentic reference compounds. During derivatization, each compound is labeled with two 1-phenyl-3-methyl-5-pyrazolone molecules, causing a shift of 331 in positive mode compared with its nominal mass. C, MS spectrum of (GlcNAc)6 as a representative example. The degradation products corresponding to (GlcNAc)n compounds with different DP (n = 1–5) are indicated. D, Quantification of (GlcNAc)n compounds (n = 1–5) by ultra-performance liquid chromatography-MS in NodC OE lines (pTGK42-10 and pTGK42-28) and the wild type (WT). Values are means ± sd.
RESULTS
GlcNAc Oligomers Accumulate upon NodC Expression
The coding sequence of A. caulinodans ORS 571 NodC (AAB51164) was cloned into an overexpression (OE) vector under the control of the cauliflower mosaic virus 35S promoter to achieve constitutive expression in plants. Constructs were transformed in Arabidopsis plants by means of floral dip, and single-insertion homozygous lines were selected. The expression of the transgene was confirmed by northern blot, and two independent lines (pTGK42-10 and pTGK42-28) with similar high expression levels were selected for all subsequent experiments (data not shown). Transgenic lines were morphologically indistinguishable from wild-type controls when grown under long-day (LD) growth conditions. Leaf samples at late rosette stage of both NodC OE lines and wild-type plants were processed to detect GlcNAc monomers and oligomers by ultra-performance liquid chromatography-tandem mass spectrometry [MS; Fig. 1, B and C; we will use the abbreviation (GlcNAc)n, where n signifies the degree of polymerization (DP)]. In wild-type plants, GlcNAc monomers (mass-to-charge ratio [m/z] = 552.2) were abundant, but surprisingly, traces of dimers (m/z = 755.3) were also detected (Fig. 1D). These are most likely derived from N-glycans of glycoproteins, as these structures have a core (GlcNAc)2 that links the branched saccharide chain to the protein. They could be either intermediates of the dolichol-bound oligosaccharide biosynthesis pathway (synthesized by UDP-N-ACETYLGLUCOSAMINYLTRANSFERASE SUBUNIT13/14 orthologs; Gao et al., 2008) or degradation products formed by a currently unknown N-glycan degradation process. Trimers (m/z = 958.4) or longer oligomers were not detected in wild-type plants. Because wild-type Arabidopsis plants have no chitin synthase or NodC-related enzymes, the absence of GlcNAc oligomers (DP > 2) was as expected. Upon NodC expression, trimers, tetramers (m/z = 1,161.5), and pentamers (m/z = 1,364.6) were also detected, and the levels of monomers and dimers were higher compared with nontransformed plants (Fig. 1D). As the length of the oligomers correlated negatively with abundance and pentamers were on the limit of detection, we could not exclude the presence of even longer oligomers that could not be detected due to a lack of sensitivity. GlcNAc oligomer levels could be artificially increased in NodC OE lines with tunicamycin, an inhibitor of GlcNAc phosphotransferase, which catalyzes the first step in N-glycosylation, the transfer of GlcNAc phosphate from UDP-GlcNAc to dolichol phosphate (Koizumi et al., 1999). As both GlcNAc phosphotransferase and NodC compete for the same cytoplasmic pool of substrate, inhibition of GlcNAc phosphotransferase activity has a positive repercussion on the substrate pool and, consequently, on the GlcNAc polymerization by NodC. Despite the overall increase in the GlcNAc oligomers under these conditions (Supplemental Fig. S1), hexamers (m/z = 1,567.6) or longer oligomers were not detected, even in a more sensitive targeted screen, strongly indicating that NodC OE lines form no GlcNAc oligomers with a DP higher than 5.
GlcNAc Oligomers Accumulate in the Apoplast
Although NodC is anchored to the membrane in bacteria (Barny et al., 1996), expressing the corresponding gene in plants does not guarantee a similar subcellular localization of the protein. In silico predictions pointed toward the Golgi apparatus as the most likely subcellular region where the protein would accumulate in the plant (plant-mPLoc; Chou and Shen, 2010). To confirm this prediction, a NodC:EGFP (for enhanced GFP) construct was made. Once expressed in Arabidopsis, we found a clear colocalization between the fusion protein and a Golgi marker (Fig. 2A). Moreover, we were able to follow the movement of these EGFP-labeled vesicles over time (data not shown), revealing a fast and directional transport. The Golgi localization of NodC suggests that the GlcNAc oligomers could theoretically be synthesized in the Golgi stacks and vesicles. Many of these vesicles fuse with the plasma membrane and release their content in the apoplast. Hence, GlcNAc oligosaccharides are expected to follow a similar path as cell wall polysaccharides (i.e. hemicelluloses and pectins; Worden et al., 2012) and end up in the cell wall region.
Figure 2.

GlcNAc oligomer accumulation in the apoplast. A, NodC-EGFP (green) colocalizes with the Golgi marker BODIPY-TR (red) in Arabidopsis root hairs. The nucleus was counterstained with Hoechst 3342. B, Subcellular localization of GlcNAc monomers and oligomers in leaf trichomes of the wild type (left) or NodC OE line pTGK42-10 (middle and right) using fluorescence-labeled WGA. Longitudinal and transversal sections revealed that the signal is mainly in the extracellular region (right). C, An anti-(GlcNAc)n antibody interacts with epitopes in the cell wall region and colocalizes with the cellulose stain calcofluor white (CFW).
The subcellular localization of the GlcNAc oligomers was initially examined in leaf trichomes using fluorescently labeled wheat germ agglutinin (WGA), a lectin with affinity for GlcNAc oligomers. Whereas no specific fluorescence could be detected in wild-type plants, a bright fluorescence was detectable in NodC OE plants. Some signal was observed in the cytoplasm; however, most of the signal was traced back to the apoplast, mainly accumulating at the level of the papillae, where the cell wall is thickened (Fig. 2B). Since WGA is not able to distinguish between GlcNAc oligomers and N-glycosylated proteins, we could not exclude the possibility that glycoproteins, accumulating upon NodC expression, were visualized rather than GlcNAc oligomers. To clarify this issue and distinguish between chitin oligomers and glycoproteins, we repeated the immunolocalization using chitin-specific antibodies. This revealed a clear labeling of the cell wall region (Fig. 2C). In contrast to WGA, the antibody is too big to pass the cellular membrane, explaining why no intracellular signal was detected. Based on the different experiments, we concluded that GlcNAc oligomers accumulate in the extracellular space upon NodC expression.
The Conditional Phenotype of NodC OE Lines
As noted above, greenhouse-grown NodC OE lines were indistinguishable from wild-type plants when grown under LD conditions. Despite the lack of a clear developmental phenotype, both lines suffered in crossing experiments when used as a maternal parent, whereas no effect was seen when the NodC OE lines were used as pollinator. Although initial carpel elongation was observed after emasculation and pollination of NodC OE flowers, most inflorescence branches died after several days, indicating that fertilization was performed successfully but the stems were too fragile to recover from handling stress. Later, we found that it was not the emasculation itself but rather the additional weight of the thread tied around the pedicel to demark crosses that caused the premature arrest of stem development (Fig. 3A). Closer examination revealed that NodC OE lines, although not having a slender phenotype, were in general more sensitive to mechanical stress. For example, side branches or siliques were sensitive to mechanical friction when touching the plastic Aracon tube used to separate individual plants (Fig. 3B), and frequently, the main inflorescence died after passing the conical portion of the Aracon tube base (Fig. 3C). These observations were specific for NodC OE lines, indicating that the accumulating GlcNAc oligomers increase the plant’s sensitivity to mechanical stimuli. An additional conditional phenotype was obtained when NodC OE lines were grown under conditions used to allow the development of a single large inflorescence stem that is typically used for cell wall analysis (Vanholme et al., 2012). For this purpose, plants are first grown for 6 to 8 weeks under short-day (SD) conditions before a shift to LD conditions to trigger bolting. Under these conditions, NodC OE lines were consistently smaller than wild-type plants. Interestingly, the level of phenotypic penetrance could be modified by varying the time the lines were subjected to SD growth conditions before their shift to LD conditions. To analyze this in a structured way, plants were grown under SD conditions, and at different time points a subset of 51 plants (17 wild type, 17 pTGK42-10, and 17 pTGK42-28) was transferred to LD growth conditions until senescence (Fig. 4A). Grown under LD conditions, the phenotype of the vegetative stage of NodC OE plants was similar to that of wild-type plants. However, when grown for 4 or 6 weeks under SD conditions, NodC OE plants revealed a shade-avoidance response characterized by leaf hyponasty (Fig. 4B). In wild-type plants, a similar effect was only observed after growing the plants for 8 weeks under SD conditions, and this effect coincided with bolting. Interestingly, this hyponastic phenotype was not observed in most NodC OE plants that were grown for 8 weeks under SD conditions. These plants were either delayed in bolting compared with the wild type or never made the shift to the bolting stage. In addition to the shade-avoidance phenotype, rosettes of NodC OE plants grown for at least 6 weeks under SD conditions were significantly smaller compared with the rosettes of wild-type plants at the time of transfer from SD to LD conditions (Fig. 4C).
Figure 3.

NodC OE lines are hypersensitive to mechanical stress. A, pTGK42-10 used as the maternal parent in crossing experiments. Side branches have difficulties supporting the additional load of the threads used to mark the crosses. B, Necrosis of pTGK42-10 siliques and side branches due to mechanical friction against the Aracon tube (arrowheads). C, Young developing inflorescence stem and side branches of pTGK42-10 have died (arrowhead) after touching the inverted cone of the base of the Aracon tube.
Figure 4.

The conditional phenotype of NodC OE lines. A, Scheme of the experimental setup to assess the conditional phenotype. SD and LD growth conditions are depicted as black and white bars, respectively. Numbers on top correspond to weeks. Each bar represents a set of plants subjected to a specific growth condition, characterized by a specific number of weeks in SD and LD conditions. B, Top, representative images of leaf hyponasty in NodC OE lines compared with the wild type (WT) grown for 6 weeks under SD growth conditions. Bottom, quantification of leaf hyponasty. The y axis gives the petiole angle of the longest leaf at that moment above the horizontal plane. C, Rosette diameter in cm at the moment of transfer from SD to LD growth conditions. D, Length of the inflorescence stems of fully senescent plants. E, Closeups of the different phenotypes observed during stem development. Ea, NodC OE lines (right) and wild-type plants (left) transferred after 8 weeks under SD to LD conditions to induce bolting. The photograph was taken after 20 d under LD conditions. Eb, A cluster of flowers at the base of the inflorescence of a NodC OE plant. Ec and Ed, Internodes are reduced (arrowhead in c), forming in severe cases broomheads (d). Ee, Necrosis of the inflorescence shoot apices. F, Two-millimeter stem sections obtained from 12-cm stem fragments of plants grown under different light conditions. The longer wild-type plants were grown under SD conditions, the more biomass was produced. NodC OE plants grown under similar conditions produced less biomass upon senescence. B to D, Asterisks indicate statistical significance at P < 0.01 as determined by Student’s t test. Values are means ± sd from at least 14 plants per genotype for each batch, with the exception of plants of the 8wSD batch in D, where only five and three plants were used for the lines pTGK42-10 and pTGK42-28, respectively. White bars, Wild type; gray bars, pTGK42-10; black bars, pTGK42-28.
In contrast to the relatively mild phenotypes at the vegetative stage, more dramatic phenotypes were seen at the flowering stage. Stems of NodC OE plants grown for 4 weeks under SD conditions before transfer to LD conditions had a slightly reduced average height compared with stems of wild-type plants (Fig. 4D). Due to the large variation, this difference was only significant at the 0.05 level. The growth penalty was more pronounced when plants were kept for 6 weeks under SD conditions. Interestingly, for six out of the 36 NodC OE plants of this batch (three pTGK42-10 and three pTGK42-28), the apex of the main stem died during development, whereupon side branches appeared from the main stem and secondary stems appeared from the rosette, resulting in plants with a dwarfed and bushy phenotype. Transferring plants to LD conditions after 8 weeks in SD conditions resulted in even more severe phenotypes. Only 13 plants of the NodC OE lines (nine pTGK42-10 and four pTGK42-28) developed an inflorescence stem, of which eight (five pTGK42-10 and three pTGK42-28) died during development, and in two cases flowers rather than side branches appeared at the base of the rosette. Some of the stems had a reduction in internode length, which resulted, in severe cases, in plants with a broomhead phenotype (Fig. 4E). No such phenotypes were observed in wild-type plants in the same tray. Together with the growth penalty, stems of NodC OE plants subjected to SD growth conditions did not turn pale upon senescence but remained greenish brown (Fig. 4F), a phenotype that is indicative of incomplete senescence.
The Penetrance of the NodC Phenotype Is Correlated with (GlcNAc)n Concentrations
While generating crosses between NodC OE plants and different mutants or marker lines, we observed that homozygous plants were phenotypically different from wild-type plants, whereas hemizygous plants had a similar phenotype to the wild-type plants under the conditions tested. To analyze this in more detail, backcrosses with Columbia-0 (Col-0) were made to create pure hemizygous NodC OE lines. These plants were grown together with the parental lines under conditions that cause a mild phenotype in homozygous lines (4 weeks in SD conditions before a shift to LD conditions). Whereas homozygous plants revealed the hyponastic growth phenotype and had a reduced height (Fig. 5A), hemizygous lines were morphologically indistinguishable from untransformed plants independent of the growth condition tested (including the timing of the transition from SD toward LD growth conditions). GlcNAc measurements on rosette leaves revealed that the hemizygous lines had reduced levels of GlcNAc oligomers compared with homozygous lines that were grown in the same tray (Fig. 5B), suggesting that a certain (GlcNAc)n threshold is needed to cause a phenotype.
Figure 5.

Dose-response effect of GlcNAc oligomer concentration on the phenotype. A, Stem length of hemizygous (pTGK42-10-HE and pTGK42-28-HE) and homozygous (pTGK42-10 and pTGK42-28) NodC OE lines grown under similar conditions. B, Ratio of GlcNAc dimer and trimer concentrations in the hemizygote versus its corresponding homozygote. White bars, pTGK42-10; black bars, pTGK42-28. C, Metabolic pathway toward GlcNAc oligomers. The two enzymes expressed in the pTKL15-11 line are indicated: GFAT catalyzes the rate-limiting step toward UDP-GlcNAc and NodC catalyzes the polymerization of UDP-GlcNAc into GlcNAc oligomers. D, Ratio of GlcNAc dimer and trimer concentrations in pTKL15-11 versus pTGK42-28. E, Phenotype of Arabidopsis line pTKL15-11 in comparison with a wild-type plant of similar age grown under similar growth conditions (6 weeks under SD conditions and 3 weeks under LD conditions). The inset shows a detail of a representative broomhead phenotype. Asterisks indicate statistical significance from wild-type plants of the same batch at P < 0.01 as determined by Student’s t test. Values are means ± sd.
Besides the generation of plants with reduced (GlcNAc)n concentrations, we tried to increase the oligomer concentrations to investigate whether higher (GlcNAc)n concentrations would result in a more severe phenotype compared with the homozygous NodC OE lines. Although tunicamycin was previously used in vitro to increase GlcNAc oligomer concentrations, the morphological defects upon tunicamycin treatments (small plants with radially swollen roots) were the result of effects unrelated to GlcNAc (such as blocking the glycosylation pathway), as similar defects were obtained in treated wild-type plants (data not shown). In an attempt to increase the (GlcNAc)n concentrations without blocking specific metabolic pathways, a new construct was made in which the NodC gene was combined with the constitutive expression of GLUTAMINE-FRUCTOSE-6-PHOSPHATE AMINOTRANSFERASE (GFAT; NC_002655). GFAT is considered to be the rate-limiting enzyme in the production of UDP-GlcNAc (Fig. 5C), the substrate for NodC. OE of both GFAT and NodC enzymes resulted in plants with increased GlcNAc oligomer concentrations compared with previous NodC OE lines (Fig. 5D). When grown under SD conditions for 6 weeks before transfer to LD conditions, these plants revealed a dramatic phenotype, with none of the plants developing a normal inflorescence stem. In the best case, stunted broomheads developed (Fig. 5E).
In conclusion, these results indicate that, besides the threshold, a dose response exists, where the phenotype is correlated with the level of GlcNAc monomers and oligomers that accumulate in the plant.
Accumulating GlcNAc Oligomers Do Not Induce Classical Chitin, Endoplasmic Reticulum, or Oxidative Stress Reactions
As mentioned before, GlcNAc oligomers are well-known elicitors that activate a specific response in the plant. The response is mediated by the plasma membrane receptor kinase CERK1 (AT3G21630), which recognizes chitin oligomers and transmits the signal toward the cytoplasm (Miya et al., 2007). This receptor is essential for the response, as cerk1 lines completely lack the chitin-mediated stress response. Despite the accumulation of chitin fragments, no chitin response was expected, as the produced oligomers are most likely too short to activate the receptor. Indeed, overexpressing NodC in a cerk1 background did not restore the mutant phenotype to the wild type (Fig. 6A), indicating that the (GlcNAc)n-induced phenotype is not the result of a classical chitin response activated by the GlcNAc oligomers.
Figure 6.

The phenotype upon (GlcNAc)n accumulation is independent of the chitin receptor CERK1 and is unrelated to oxidative or ER stress. A, Left, stem length of NodC OE lines pTGK42-10 and pTGK42-28 in the wild-type (WT) and cerk1 background. Right, extreme stem phenotype of NodC OE line pTGK42-10 and pTGK42-10 × cerk1 compared with the wild type. B, Left, visualization of H2O2 production in 10-d-old Arabidopsis seedlings by incubating roots in DAB. Right, detail of the root tip. C, Glycosylation pattern of proteins of the wild type and NodC OE lines. Proteins were extracted from fully developed leaves of rosette-stage plants. Blotting was performed using WGA-peroxidase (left) or ConA-peroxidase (right). Marker was the PageRuler Plus Prestained Protein Ladder. The molecular masses are indicated in kD. Asterisks indicate statistical significance compared with the wild type at P < 0.01 as determined by Student’s t test. Values are means ± sd.
An oxidative stress response independent of CERK1 could nevertheless be expected upon (GlcNAc)n accumulation (de Jonge et al., 2010). To check for oxidative stress, young seedlings were treated with 3,3′-diaminobenzidine (DAB) for the detection of hydrogen peroxide (H2O2)-producing cells. No difference was observed between wild-type and NodC OE lines, indicating that no significant oxidative stress was induced upon (GlcNAc)n accumulation (Fig. 6B).
Alternatively, the ectopic lignification could be the result of endoplasmic reticulum (ER) stress, caused by distortion at the level of N-glycosylation in the NodC OE lines (Nozaki et al., 2012). Previous experiments with tunicamycin as inhibitor for N-glycosylation revealed that both N-glycosylation and GlcNAc oligomer production compete for the same cytoplasmic UDP-GlcNAc pool (Supplemental Fig. S1). The polymerization of GlcNAc could, in theory, deplete the substrate pool for N-glycan biosynthesis and affect N-glycosylation in general. However, neither concanavalin A (ConA) nor WGA-lectin blots revealed alteration in the glycosylation pattern in NodC OE lines compared with wild-type plants (Fig. 6C).
(GlcNAc)n Accumulation Alters Cell Wall Architecture
As the most dramatic phenotypes were observed in inflorescence stems, we studied the stem anatomy. The regions with reduced internode length or a broomhead phenotype were characterized by giant holes in the pith region (Fig. 7, A and B). Semithin and ultrathin sections revealed that these holes were the result of sheared cell walls, indicating a general loss of cell wall strength (Figs. 7, C and D, and 8). Although typical in plants with a defective cell wall, no irregular xylem phenotype (Turner and Somerville, 1997) could be observed in the transgenic lines. Wiesner staining revealed ectopic lignin accumulation in pith cells (mainly cell walls bordering the enlarged and ruptured cells; Fig. 8), and ectopic lignification started in cell corners and preceded the lignification of the interfascicular fibers. No anatomical differences compared with wild-type stems were observed in sections below the region with reduced internode length (Fig. 8).
Figure 7.

Microscopic analyses of transverse stem sections of the NodC OE line pTGK42-28 (right) compared with the wild type (WT; left). A, Scanning electron microscopy images of a 250-µm vibroslice stem section revealing syncytium-like structures in the pith region of NodC OE lines. Bars = 200 µm. B, Detail of A. Bars = 200 µm. C, Toluidine blue-stained semithin stem sections illustrating that ruptured cell walls are at the base of the observed modifications in the pith region. Arrowheads point to modified pith cells. Bars = 100 µm. D, Transmission electron microscopy cross sections confirming the presence of ruptured cell wall in pith cells of NodC OE lines. Bars = 10 µm. Similar defects were observed in pTGK42-10 lines.
Figure 8.

Ectopic lignification of the pith cells in NodC OE lines. A, Visualization by Wiesner staining of lignin in stem sections of the NodC OE line pTGK42-28 at two different positions along the stem. The apical region with reduced internode length is characterized by the accumulation of ectopic lignin in the pith region. The enlarged pith cells due to the sheared cell walls are clearly visible in this region. B, Sections within the internode with a normal phenotype have no ectopic lignification and no enlarged pith cells. Similar effects were observed in line pTGK42-10.
In order to determine whether an altered cell wall composition caused by the accumulating GlcNAc oligomers could be the origin of the observed phenotype, the stem material of the plants grown for phenotypic characterization was used for cell wall characterization. Due to the severe anatomical differences in the region with reduced internodes, the analysis was restricted to a 12-cm segment of the fully senescent main stem 1 cm above the rosette, and care was taken not to include regions with aberrant internode length. Stems derived from wild-type plants that were subjected to SD growth conditions were enriched in cell wall residue (CWR) compared with wild-type plants that were grown under LD conditions (Fig. 9B). This trend was not observed in NodC OE lines, which produced approximately 75% to 80% CWR irrespective of the time plants were grown under SD conditions (Fig. 9B). Consequently, NodC OE plants produced significantly less cell wall compared with wild-type plants when subjected for several weeks to SD conditions. To determine whether this was caused by a reduction of one of the cell wall polymers, the chemical composition of the cell wall was analyzed. Cellulose content was measured by the Updegraff reagent, and although the average values of NodC OE lines were slightly lower compared with those of wild-type plants, the differences were not significant (Fig. 9C). Similarly, the amount of acetyl bromide-soluble lignin was not different between NodC OE and wild-type plants (Fig. 9D). This observation is in line with the Wiesner staining performed on stem segments with an overall normal morphology, where no differences were seen between NodC OE plants and the wild type. Finally, the cell wall of NodC OE plants had a similar amount of trifluoacetic acid (TFA)-hydrolyzable carbohydrate content (Fig. 9E), which had a similar monosaccharide composition as in wild-type plants (Supplemental Fig. S2), indicating that the GlcNAc oligomers had no dramatic influence on the amount and composition of the hemicelluloses in the cell wall.
Figure 9.

Chemical composition of the cell walls of the bottom 12-cm stem section of NodC OE lines. A, Scheme of the experimental setup to assess the conditional phenotype (for details, see Fig. 4A). B, Percentage of CWR in dry stem tissue of NodC OE and wild-type plants. C, Cellulose content in percentage of CWR as determined by Updegraff extraction. D, Lignin content in percentage of CWR as determined by acetyl bromide extraction. E, Percentage of TFA-extractable carbohydrates from CWR. F, Total Glc released during saccharification of purified CWR. The y axis denotes the Glc release. Three different hydrolysis times were used: 4 h (top), 24 h (middle), and 48 h (bottom). Day/night conditions for the different batches are explained in Figure 4A. Asterisks indicate statistical significance from wild-type plants of the same batch at P < 0.01 as determined by Student’s t test. Values are means ± sd from at least eight plants per genotype for each batch, with the exception of the 8wSD set, where only four (pTGK42-10) or one (pTGK42-28) stems were available. White bars, Wild type; gray bars, pTGK42-10; black bars, pTGK42-28.
During cell wall extraction, GlcNAc monomers and oligomers were easily extracted by boiling dry stem segments in water, indicating that at least a fraction of the produced GlcNAc oligomers was not covalently linked to cell wall polymers. This was confirmed by whole cell wall NMR performed on purified cell wall material of NodC OE plants; GlcNAc or related compounds were not detected in the NMR spectra, which suggests that they are not covalently incorporated in the cell wall (Supplemental Fig. S3). Nevertheless, they could intercalate between the cell wall polysaccharides and, hence, alter the overall cell wall architecture. As this could have repercussions for the accessibility to enzymes, the efficiency of cellulose degradation was used as a tool to measure cell wall integrity. The CWR was incubated with cellulases, and aliquots were sampled after 4, 24, and 48 h of incubation to follow the release of Glc over time (Fig. 9F). Wild-type plants that were grown under LD conditions released more Glc compared with plants that were initially grown under SD conditions, and there was a negative correlation between the time plants spent under the SD conditions and the amount of Glc that was released from their cell wall. In NodC OE lines, the release of Glc was reduced compared with wild-type plants (Fig. 9F). This effect was most pronounced at the onset of saccharification (4 h) and diminished at later time points (24 and 48 h), an indication that the drop in saccharification yield most likely results from an increase in cell wall recalcitrance rather than a decrease in cellulose content, which is in line with the absence of difference in Updegraff cellulose concentrations (Fig. 9C).
In conclusion, the accumulating GlcNAc oligomers clearly influenced the overall cell wall architecture, as both the CWR amount per dry weight and the saccharification yields expressed per CWR were affected upon NodC expression.
Differential Expression of the Transcriptome upon (GlcNAc)n Accumulation
To obtain further insight into the effect of (GlcNAc)n accumulation on the overall plant physiology, the transcriptomes of developing stems of both NodC OE and wild-type lines grown for 2 weeks under SD conditions before a shift to LD conditions (2wSD plants in Fig. 4A) were analyzed using Agilent 60-mer oligonucleotide microarrays containing 37,484 probes corresponding to 24,696 genes (The Arabidopsis Information Resource10 [TAIR10] annotation; www.arabidopsis.org). After normalization and statistical analysis, 635 and 1,114 genes were considered differentially expressed (2-fold change; P < 0.05) in stems of pTGK42-10 and pTGK42-28, respectively. Most of these genes were up-regulated (75.1% in pTGK42-10 and 65% in pTGK42-28). The overlap between the data sets both for up- and down-regulated genes compared with the wild type is visualized in Figure 10A; 88.2% of the differentially expressed genes in pTGK42-10 were also differently expressed in pTGK42-28, and the top 30 genes with the highest differential expression in both lines (both up and down) are listed in Tables I and II. In addition to several genes with unknown function, the list includes genes involved in transport, stress response, cell wall modification, and signaling. The identification of the key biological processes affected by the accumulating GlcNAc oligomers was performed with MapMan, which projects expression changes of individual genes on biochemical pathways and functional classes (so-called BIN classes). The BINs representing signaling, secondary metabolism, and development (BINs 30, 16, and 33, respectively) were considered most highly affected (Fig. 10B). The latter could be an artifact, as both NodC OE lines were slightly smaller compared with the wild type at the moment of sampling (wild type, 28.3 ± 2.8 cm; pTGK42-10, 24.1 ± 3.3 cm; pTGK42-28, 24.5 ± 2.5 cm). Focusing on the signaling class revealed that, in particular, RLKs (BIN 30.2) were strongly affected by GlcNAc accumulation. This BIN class consists of 523 elements, of which 30 (5.7%) were at least 2-fold up-regulated in pTGK42-10 and 29 (5.5%) were at least 2-fold up-regulated in pTGK42-28 (Table III). Interestingly, in both cases, 14 of the up-regulated RLKs belong to the Domain of Unknown Function26 class (DUF26; BIN 30.2.17; Fig. 10C), which corresponds to 31.11% of the elements of this class (n = 44). In addition, three additional DUF26-containing proteins, not belonging to the RLKs but predicted to be secreted or trapped in the plasma membrane, were at least 2-fold up-regulated upon NodC expression (AT3G22060, AT4G23170, and AT5G37660). Although we cannot exclude the possibility that the overrepresentation of DUF26 genes is the consequence of the developmental shift between wild-type and NodC OE lines, this subset of genes is not differentially expressed in transcriptomic data sets derived from developing Arabidopsis stems (Ko and Han, 2004; Ehlting et al., 2005), indicating that these proteins play a role in the direct or indirect perception or signaling of accumulating GlcNAc oligomers. Similarly, one of the four genes coding for LysM-containing receptor-like kinase (LYK) proteins was highly induced upon NodC expression (LYK5; AT2G33580). Some members of this LYK family do interact with chitin, and LYK5 was predicted to have similar properties based on sequence homology (Wan et al., 2008, 2012).
Figure 10.

Gene expression in stem tissue of Arabidopsis upon NodC expression. A, Venn diagrams showing the number of significantly differentially expressed genes upon NodC expression with an expression ratio of at least 2 (P < 0.05). The Venn diagrams indicate the degree of overlap between the different NodC OE lines. Data are derived from microarray analysis using two different NodC OE lines (pTGK42-10 and pTGK42-28). B, Top five overrepresented BIN classes. Only genes at least 2-fold up- or down-regulated in both NodC OE lines (pTGK42-10 and pTGK42-28) compared with the wild type were included. C, Differentially expressed RLKs upon NodC OE in Arabidopsis. For each of the RLK families, the MapMan BIN code is given as well as the total number of genes in this family and the number of significantly differentially expressed family members in pTGK42-10 and pTGK42-28. DUF26 RLKs are overrepresented in the data set where stem tissue of pTGK42-28 or pTGK42-10 is compared with the wild-type. At left, the domain structure of the different RLKs as defined by MapMan is given.
Table I. Top 30 genes up-regulated upon NodC OE.
Values are ratios (NodC OE-wild type) of log2 values.
| No. | Arabidopsis Genome Initiative Code | Probe Identifier | pTGK42-10 | P | pTGK42-28 | P | Name/Putative Function |
|---|---|---|---|---|---|---|---|
| 1 | AT4G02330 | A_84_P21341 | 4.34 | 3.86E-08 | 4.23 | 3.80E-08 | Plant invertase/pectin methylesterase inhibitor superfamily |
| 2 | AT5G39720 | A_84_P23470 | 4.25 | 6.22E-05 | 4.09 | 6.74E-05 | Avirulence-induced gene2-like protein |
| 3 | AT1G65845 | A_84_P586318 | 3.99 | 6.48E-08 | 3.94 | 6.34E-08 | Unknown protein |
| 4 | AT3G54830 | A_84_P522715 | 3.92 | 1.23E-05 | 4.58 | 3.84E-06 | Transmembrane amino acid transporter family protein |
| 5 | AT1G65240 | A_84_P21818 | 3.91 | 1.06E-06 | 3.84 | 1.05E-06 | Eukaryotic aspartyl protease family protein |
| 6 | AT1G30720 | A_84_P18030 | 3.90 | 9.67E-05 | 4.08 | 6.11E-05 | FAD-binding Berberine family protein |
| 7 | AT5G64110 | A_84_P15996 | 3.90 | 4.48E-05 | 4.11 | 2.68E-05 | Peroxidase superfamily protein |
| 8 | AT2G34820 | A_84_P530502 | 3.86 | 9.10E-05 | 3.38 | 1.84E-04 | Basic helix-loop-helix DNA-binding superfamily protein |
| 9 | AT1G16530 | A_84_P506289 | 3.83 | 1.89E-07 | 4.09 | 1.13E-07 | ASYMMETRIC LEAVES2-like9 |
| 10 | AT1G65510 | A_84_P539238 | 3.78 | 4.98E-09 | 3.62 | 7.40E-09 | Unknown protein |
| 11 | AT4G23310 | A_84_P10997 | 3.77 | 3.08E-07 | 3.52 | 4.17E-07 | Cys-rich RLK23 |
| 12 | AT5G06300 | A_84_P22450 | 3.71 | 9.97E-06 | 3.45 | 1.38E-05 | Putative Lys decarboxylase family protein |
| 13 | AT2G29110 | A_84_P10728 | 3.68 | 1.32E-07 | 3.36 | 2.08E-07 | Glu receptor2.8 |
| 14 | AT1G58225 | A_84_P544532 | 3.62 | 2.34E-06 | 3.49 | 2.68E-06 | Unknown protein |
| 15 | AT1G51860 | A_84_P20996 | 3.48 | 4.20E-08 | 3.19 | 5.90E-08 | Leu-rich repeat protein kinase family protein |
| 16 | AT1G49500 | A_84_P53790 | 3.48 | 1.12E-06 | 4.56 | 1.99E-07 | Unknown protein |
| 17 | AT1G07610 | A_84_P148418 | 3.42 | 4.63E-09 | 3.70 | 4.61E-09 | Metallothionein 1C |
| 18 | AT1G66870 | A_84_P141619 | 3.40 | 6.43E-06 | 3.70 | 3.33E-06 | Carbohydrate-binding X8 domain superfamily protein |
| 19 | AT1G60970 | A_84_P20922 | 3.38 | 1.41E-07 | 3.32 | 1.48E-07 | SNARE-like superfamily protein |
| 20 | AT1G65490 | A_84_P57860 | 3.37 | 6.79E-07 | 3.28 | 7.06E-07 | Unknown protein |
| 21 | AT5G39580 | A_84_P16848 | 3.31 | 2.34E-07 | 3.26 | 2.33E-07 | Peroxidase superfamily protein |
| 22 | AT1G03020 | A_84_P19925 | 3.29 | 1.29E-05 | 3.86 | 3.99E-06 | Thioredoxin superfamily protein |
| 23 | AT5G64120 | A_84_P16942 | 3.29 | 2.78E-09 | 3.23 | 1.67E-09 | Peroxidase superfamily protein |
| 24 | AT1G66460 | A_84_P730499 | 3.20 | 1.38E-04 | 3.37 | 8.49E-05 | Protein kinase superfamily protein |
| 25 | AT2G05330 | A_84_P586382 | 3.20 | 4.73E-06 | 3.07 | 5.32E-06 | BTB/POZ domain-containing protein |
| 26 | AT2G25470 | A_84_P18293 | 3.19 | 3.12E-04 | 3.31 | 2.09E-04 | Receptor like protein21 |
| 27 | AT5G02760 | A_84_P17710 | 3.17 | 3.20E-08 | 2.81 | 5.00E-08 | Protein phosphatase2C family protein |
| 28 | AT4G18280 | A_84_P11922 | 3.16 | 1.07E-08 | 3.02 | 1.48E-08 | Gly-rich cell wall protein-related |
| 29 | AT5G50915 | A_84_P528334 | 3.15 | 5.45E-08 | 3.46 | 3.59E-08 | Basic helix-loop-helix DNA-binding superfamily protein |
| 30 | AT1G72060 | A_84_P51580 | 3.07 | 4.26E-05 | 3.41 | 1.803-05 | Ser-type endopeptidase inhibitors |
Table II. Top 30 genes down-regulated upon NodC OE.
Values are ratios (NodC OE-wild type) of log2 values.
| No. | Arabidopsis Genome Initiative Code | Probe Identifier | pTGK42-10 | P | pTGK42-28 | P | Name/Putative Function |
|---|---|---|---|---|---|---|---|
| 1 | AT4G15390 | A_84_P22420 | −4.31 | 5.55E-05 | −3.39 | 1.93E-04 | HXXXD-type acyltransferase family protein |
| 2 | AT1G52690 | A_84_P14274 | −3.55 | 5.91E-06 | −3.32 | 7.95E-06 | Late embryogenesis abundant protein family protein |
| 3 | AT1G43160 | A_84_P16121 | −3.35 | 2.17E-04 | −3.09 | 3.03E-04 | Related to AP2 6 |
| 4 | AT3G02480 | A_84_P18335 | −2.92 | 8.29E-07 | −2.77 | 1.02E-06 | Late embryogenesis abundant protein family protein |
| 5 | AT1G74080 | A_84_P20939 | −2.89 | 1.74E-05 | −3.53 | 4.13E-06 | Myb domain protein122 |
| 6 | AT1G59950 | A_84_P15199 | −2.86 | 2.90E-05 | −3.39 | 7.90E-06 | NAD(P)-linked oxidoreductase superfamily protein |
| 7 | AT3G50300 | A_84_P504952 | −2.83 | 7.52E-05 | −2.38 | 1.59E-04 | HXXXD-type acyltransferase family protein |
| 8 | AT1G15125 | A_84_P106016 | −2.81 | 3.45E-07 | −2.72 | 3.74E-07 | S-Adenosyl-l-Met-dependent methyltransferases |
| 9 | AT5G38910 | A_84_P17792 | −2.61 | 1.54E-03 | −1.16 | 4.96E-02 | RmlC-like cupins superfamily protein |
| 10 | AT3G04290 | A_84_P11715 | −2.54 | 1.50E-08 | −2.13 | 3.48E-08 | Li-tolerant lipase1 |
| 11 | AT4G06746 | A_84_P530732 | −2.41 | 8.94E-09 | −1.95 | 2.79E-08 | Related to AP2 9 |
| 12 | AT4G15270 | A_84_P12017 | −2.36 | 4.69E-07 | −2.16 | 6.89E-07 | Glucosyltransferase-related |
| 13 | AT4G11760 | A_84_P21368 | −2.34 | 4.46E-05 | −1.69 | 3.19E-04 | Low-molecular-weight Cys-rich17 |
| 14 | AT1G10990 | A_84_P291354 | −2.32 | 7.29E-05 | −2.18 | 9.30E-05 | Unknown protein |
| 15 | AT4G00910 | A_84_P94999 | −2.28 | 4.11E-05 | −2.33 | 3.00E-05 | Aluminum-activated malate transporter family protein |
| 16 | AT1G62760 | A_84_P18892 | −2.19 | 3.73E-07 | −2.49 | 1.56E-07 | Plant invertase/pectin methylesterase inhibitor |
| 17 | AT3G04720 | A_84_P23050 | −2.17 | 9.54E-07 | −1.16 | 4.72E-05 | Pathogenesis-related4 |
| 18 | AT5G13330 | A_84_P14906 | −2.16 | 5.01E-06 | −2.27 | 3.27E-06 | Related to AP2 6l |
| 19 | AT4G16260 | A_84_P17693 | −2.01 | 6.05E-08 | −1.55 | 2.45E-07 | Glycosyl hydrolase superfamily protein |
| 20 | AT3G56700 | A_84_P13765 | −1.99 | 3.54E-04 | −1.43 | 2.34E-03 | Fatty acid reductase6 |
| 21 | AT1G27020 | A_84_P10039 | −1.96 | 1.90E-08 | −1.82 | 2.82E-08 | Unknown protein |
| 22 | AT3G15270 | A_84_P167633 | −1.95 | 2.16E-07 | −1.84 | 2.78E-07 | Squamosa promoter-binding protein-like5 |
| 23 | AT2G45180 | A_84_P272390 | −1.95 | 8.77E-07 | −1.44 | 5.10E-06 | Lipid-transfer protein/seed storage2S albumin |
| 24 | AT2G26400 | A_84_P563250 | −1.93 | 5.36E-07 | −1.74 | 9.01E-07 | Acireductone dioxygenase3 |
| 25 | AT3G05690 | A_84_P20208 | −1.90 | 4.80E-06 | −1.87 | 4.63E-06 | Nuclear factor Y subunit A2 |
| 26 | AT5G25980 | A_84_P12100 | −1.88 | 1.14E-05 | −1.93 | 8.30E-06 | Glucoside glucohydrolase2 |
| 27 | AT2G14535 | A_84_P732168 | −1.87 | 1.02E-03 | −1.35 | 6.02E-03 | Transposable element gene |
| 28 | AT1G53700 | A_84_P10747 | −1.82 | 1.19E-06 | −1.62 | 2.23E-06 | WAG1 |
| 29 | AT1G06340 | A_84_P554127 | −1.80 | 2.22E-04 | −2.33 | 3.62E-05 | Plant Tudor-like protein |
| 30 | AT2G26560 | A_84_P21049 | −1.80 | 7.71E-07 | −1.84 | 5.82E-07 | Phospholipase A 2A |
Table III. Membrane-coupled receptor kinases at least 2-fold up-regulated in pTGK42-10 compared with the wild type.
Values are ratios (NodC OE-wild type) of log2 values. Genes coding for proteins belonging to the DUF26 family are indicated by asterisks.
| Name | Arabidopsis Genome Initiative Code | Probe Identifier | pTGK42-10 | P | pTGK42-28 | P |
|---|---|---|---|---|---|---|
| CRK23* | AT4G23310 | A_84_P10997 | 3.767 | 3.08E-07 | 3.159 | 4.17E-07 |
| LRR | AT1G51860 | A_84_P20996 | 3.479 | 4.20E-08 | 3.188 | 5.90E-08 |
| RLK41 | AT3G25010 | A_84_P99776 | 2.793 | 8.72E-09 | 2.72 | 1.19E-08 |
| CCR4 | AT5G47850 | A_84_P23501 | 2.75 | 3.02E-06 | 2.461 | 5.40E-06 |
| CRK7* | AT4G23150 | A_84_P13831 | 2.563 | 1.34E-08 | 2.327 | 2.13E-08 |
| CRK4* | AT3G45860 | A_84_P19361 | 2.521 | 3.25E-08 | 2.411 | 3.71E-08 |
| RLK37 | AT3G23110 | A_84_P14579 | 2.408 | 9.45E-08 | 2.393 | 8.78E-08 |
| RLK6* | AT4G23140 | A_84_P188254 | 2.406 | 5.40E-09 | 2.272 | 8.86E-09 |
| RLK23 | AT2G32680 | A_84_P20114 | 2.221 | 4.11E-08 | 2.177 | 3.84E-08 |
| CRK45 | AT4G11890 | A_84_P10967 | 2.210 | 5.40E-09 | 2.094 | 8.86E-09 |
| CRK14* | AT4G23220 | A_84_P288470 | 2.099 | 3.00E-07 | 1.937 | 4.24E-07 |
| LRR | AT1G51800 | A_84_P10528 | 1.952 | 4.06E-07 | 1.612 | 1.15E-06 |
| CRK8* | AT4G23160 | A_84_P560906 | 1.914 | 4.02E-06 | 1.594 | 1.17E-05 |
| CRK11* | AT4G23190 | A_84_P528136 | 1.736 | 6.25E-04 | 1.595 | 9.23E-04 |
| CRK36* | AT4G04490 | A_84_P18510 | 1.721 | 1.01E-07 | 1.844 | 6.19E-08 |
| NLOD | AT4G13900 | A_84_P16647 | 1.715 | 1.20E-07 | 1.561 | 1.91E-07 |
| LRR | AT5G59660 | A_84_P17868 | 1.562 | 5.85E-07 | 1.608 | 4.44E-07 |
| LRR | AT1G51850 | A_84_P21942 | 1.395 | 5.08E-08 | 1.118 | 1.60E-07 |
| CRK40* | AT4G04570 | A_84_P22294 | 1.388 | 1.52E-07 | 1.228 | 3.00E-07 |
| RLP20 | AT2G25440 | A_84_P16401 | 1.291 | 2.89E-05 | 1.35 | 1.83E-05 |
| CRK5* | AT4G23130 | A_84_P12886 | 1.264 | 2.34E-06 | 1.117 | 4.57E-06 |
| WAKL2 | AT1G16130 | A_84_P15224 | 1.227 | 3.78E-04 | 1.279 | 2.49E-04 |
| CRK37* | AT4G04500 | A_84_P19456 | 1.211 | 2.61E-06 | 1.318 | 1.42E-06 |
| LRR | AT4G13820 | A_84_P145309 | 1.19 | 9.40E-06 | 1.309 | 4.41E-06 |
| CRK15* | AT4G23230 | A_84_P312233 | 1.099 | 1.44E-06 | 0.967 | 2.97E-06 |
| LRR | AT4G08850 | A_84_P23248 | 1.054 | 1.36E-06 | 0.97 | 2.08E-06 |
| WAKL6 | AT1G16110 | A_84_P17200 | 1.047 | 9.03E-06 | 0.925 | 1.77E-05 |
| RLP24 | AT2G33020 | A_84_P22923 | 1.047 | 1.43E-04 | 1.219 | 4.54E-05 |
| RLP46 | AT4G04220 | A_84_P23239 | 1.035 | 1.65E-05 | 1.091 | 1.00E-05 |
| Protein kinase | AT2G33580 | A_84_P13462 | 1.02 | 4.00E-04 | 1.125 | 1.85E-04 |
| LRR | AT1G51820 | A_84_P13200 | 1.009 | 3.08E-05 | 0.692 | 3.04E-04 |
| RLP38 | AT3G23120 | A_84_P15524 | 1.008 | 5.06E-07 | 1.082 | 3.10E-07 |
As the MapMan analysis calculates significance values for different BIN classes based on the number of differentially expressed genes without considering the expression levels of these genes, the classification represents only part of the valuable information covered in the microarray data set. This is nicely illustrated by BIN class 10, representing cell wall-related genes. Despite the presence of genes encoding cell wall modification proteins in our top list of differentially expressed genes, MapMan analysis did not retain this class as significantly affected in NodC OE lines. Similarly, many of the top list genes are involved in stress responses, although BIN classes related to biotic and abiotic stress (classes 20.1 and 20.2, respectively) were not significantly responsive upon (GlcNAc)n accumulation. To avoid the loss of interesting information, we used the software for a targeted approach independent of the class-significant values. Although a set of stress-related genes was differentially expressed (including a set of chitinases; Table IV), the expression of markers for chitin response (i.e. AT1G51890 or AT4G20780; Gimenez-Ibanez et al., 2009) was not significantly changed upon GlcNAc oligomer accumulation, supporting previous observations that the observed stress response differs from a classical chitin response. Similarly, the expression of specific markers for the ER response (Liu et al., 2007) was not affected upon NodC expression, indicating that UDP-GlcNAc consumption to produce the oligomers does not interfere with proper protein glycosylation. Also, the expression levels of genes involved in the biosynthesis of UDP-GlcNAc or nucleotide sugar in general did not change significantly, and genes for nitrogen metabolism were only slightly increased, suggesting that the pool of nitrogen in the plant is sufficient to support the biosynthesis of the nitrogen-containing oligochitin.
Table IV. Differential expression of chitinases upon (GlcNAc)n accumulation; values are ratios (NodC OE-wild type) of log2 values.
| Name | Arabidopsis Genome Initiative Code | Probe Identifier | pTGK42-10 | P | pTGK42-28 | P |
|---|---|---|---|---|---|---|
| Chitinase | AT4G01700 | A_84_P18500 | – | – | – | – |
| EP3-3 | AT3G54420 | A_84_P13726 | 0.906 | 1.19E-05 | 0.844 | 1.63E-05 |
| Chitinase | AT3G47540 | A_84_P21261 | −0.470 | 1.56E-04 | – | – |
| CTL2 | AT3G16920 | A_84_P10794 | – | – | – | – |
| HCHIB | AT3G12500 | A_84_P20293 | – | – | 1.459 | 7.73E-04 |
| Chitinase | AT2G43620 | A_84_P15331 | 2.813 | 4.11E-08 | 2.958 | 3.43E-08 |
| Chitinase | AT2G43610 | A_84_P16277 | 2.044 | 1.05E-05 | 2.284 | 4.41E-06 |
| Chitinase | AT2G43600 | A_84_P17223 | – | – | – | – |
| Chitinase | AT2G43590 | A_84_P19115 | – | – | 1.317 | 4.89E-03 |
| Chitinase | AT2G43580 | A_84_P20061 | – | – | −1.553 | 7.32E-04 |
| Chitinase | AT2G43570 | A_84_P21007 | 1.592 | 6.45E-08 | 1.835 | 3.48E-08 |
| Chitinase | AT1G56680 | A_84_P14146 | – | – | – | – |
| CTL1 | AT1G05850 | A_84_P19433 | – | – | −0.299 | 2.47E-02 |
| Chitinase | AT1G02360 | A_84_P18907 | – | – | 1.008 | 4.96E-03 |
DISCUSSION
The expression of the A. caulinodans NodC gene in Arabidopsis resulted in the accumulation of GlcNAc monosaccharides and oligosaccharides in the apoplast. The maximum DP of the oligomers detected was 5 (Fig. 1), which is in agreement with the described function of this gene in the bacterial symbiont A. caulinodans (Geremia et al., 1994), where the GlcNAc pentamer forms the backbone for the lipooligosaccharide commonly known as the Nod factor. In contrast to observations in A. caulinodans (Geremia et al., 1994), we found a negative correlation between the DP and the abundance of the oligomer. Although this could be due to the extraction and detection methods used, microarray analyses revealed that the expression of several chitinases was induced upon GlcNAc accumulation in Arabidopsis (Table IV). Therefore, we cannot exclude the possibility that at least a fraction of the accumulating smaller oligomers is derived from partial degradation rather than incomplete polymerization.
The growth defects obtained upon GlcNAc accumulation in the apoplast turned out to be highly dependent on the environmental conditions: no significant differences were observed when plants were grown under LD conditions, whereas severe growth defects were obtained when NodC OE plants were initially grown under SD growth conditions before a shift to LD conditions (Figs. 4 and 9). Moreover, the penetrance of the phenotype was correlated with the time that plants were initially kept under SD conditions. Growing wild-type Arabidopsis under SD conditions prolongs its vegetative stage, and bolting is triggered upon transfer to LD conditions, whereupon the available energy stored in the rosettes is used to produce the inflorescence stem. Prolonging the initial SD growth period increases the rosette size of wild-type plants (Becker et al., 2006) and, accordingly, the final weight and height of the inflorescence stem. This increase in biomass comes with an increase in CWR (Fig. 9B), a feature that is most likely essential to support the bigger stem. As NodC OE lines are not able to increase their CWR to the same extent as wild-type plants, it is tempting to speculate that this results in weaker plants that cannot withstand mechanical stress or support their growing inflorescence stem. This could eventually result in the observed apical growth arrest or the broomhead phenotypes (Figs. 4, 7, and 8).
As GlcNAc oligomers accumulate in the extracellular space and are easily extracted with water, they likely intercalate noncovalently between the polysaccharides of the cell wall. Here, they will unavoidably compete in carbohydrate-carbohydrate or carbohydrate-protein interactions that are at the heart of the cell wall structure (Cosgrove, 2005). The fact that the penetrance of the phenotype is dose dependent is in agreement with this view and further suggests that GlcNAc oligomers act as competitors in the above interactions (Fig. 11). In addition, it could explain why no major differences in cell wall composition were found, despite the clear effect on saccharification yield. The suggested model is supported by several wet chemistry applications, such as competitive elution affinity chromatography (Bridonneau et al., 1999), or special agglutination assays, where GlcNAc oligomers are applied to block carbohydrate-protein interactions (Monsigny et al., 1980). A similar GlcNAc competitor approach was implemented previously in a lectin-binding assay to study the glycoproteome of Saccharomyces cerevisiae in a cell-free system (Kung et al., 2009), and Lefebvre et al. (2004) injected GlcNAc in Xenopus laevis oocytes to block O-glycosylated protein-lectin interactions. Comparable experiments revealed that the biological activity of the oligomers is related to their molecular size, with longer oligomers being more efficient competitors (Allen et al., 1973). Hence, although primarily monomers and shorter oligomers accumulate in NodC OE lines, the small fraction of longer oligomers can have an important contribution to the cell wall perturbation. We can speculate on the different interactions that will be blocked by (GlcNAc)n in the apoplast, and some can be deduced from the literature. For example, NodC OE plants phenocopy to some degree the elp mutant that is characterized by ectopic lignification of the pith cells (hence the name “elp”) and smaller inflorescence stems (Zhong et al., 2000, 2002). elp is mutated in CHITINASE-LIKE1 (AtCTL1; AT1G05850), a gene highly expressed in stem tissue and linked with cell wall formation. Despite its name, CTL1 lacks chitinase activity; however, it can interact with (oligo)chitin, and it was recently shown that this apoplastic protein also interacts with glucan-containing polymers such as cellulose and xyloglucan (Sánchez-Rodríguez et al., 2012). These data support our competitor model, as blocking the carbohydrate-CTL1 interaction using GlcNAc oligomers is expected to result in a similar phenotype as the absence of CTL1. Despite the emphasis on the cell wall region as a putative target site for GlcNAc oligomers it is important to mention that we cannot exclude the occurrence of competitive inhibition within the cells of NodC plants.
Figure 11.

Suggested competition model. Different lines with different (GlcNAc)n concentrations were generated in this study (bottom), and the penetrance of the phenotype is positively correlated with the (GlcNAc)n concentration. The molecular interaction blocked by (GlcNAc)n can be either a carbohydrate-carbohydrate interaction (A) or a carbohydrate-protein interaction (B). WT, Wild type.
The presented model could explain the influence of small oligosaccharides on plant growth and development. Such oligosaccharides can accumulate in the apoplast upon cell wall hydrolysis during pathogen attack or developmental processes such as lateral root development, germination, and fruit ripening (Goulao and Oliveira, 2008; Lagaert et al., 2009; Jamar et al., 2011; Kumpf et al., 2013). In the latter cases, the effect of the oligosaccharides is masked by defects caused by cell wall depolymerization, and the difficulty of uncoupling both processes makes it challenging to study their relative importance. By synthesizing oligosaccharides in the plant independently from cell wall hydrolysis, we have an excellent tool to study the influence of such short oligosaccharides on plant physiology. When focusing on the specific nature of the accumulating oligosaccharides, the described competition model is especially important for plant-pathogen interactions, as many pathogens (e.g. most fungi, arthropods, and nematodes) have both the enzymes and substrates to generate the described GlcNAc oligomers. In addition, plants release chitinases as a defense mechanism upon pathogen attack to degrade the cell wall or exoskeleton of the pathogen. Currently, only slightly longer chitin oligomers have been considered important in plant-pathogen interactions, as a certain DP (DP ∼ 8) is essential to activate the chitin signaling pathway (Wan et al., 2004; Libault et al., 2007; de Jonge et al., 2010). Although shorter oligomers (DP < 8) interact with similar affinity to CERK1, longer oligomers are essential to induce homodimerization of the chitin receptor and, hence, activate the cytoplasmic signaling cascade (Liu et al., 2012). Our current observations are in line with these results and explain why the observed phenotype was not restored when NodC (producing shorter oligosaccharides) was expressed in the cerk1 background and support the idea that the observed defects are not the result of a classical chitin response.
This absence of a clear chitin-related response is also reflected in our transcriptome data set. Although a clear induction of different stress-related genes was seen, only limited overlap was found with data sets describing chitin-triggered gene expression (Wan et al., 2004; Libault et al., 2007). The observed stress reactions (including the expression of chitinases) are likely secondary effects triggered by the altered cell wall and communicated across the plasma membrane via transmembrane RLKs, many of which are differentially expressed upon NodC expression. Here, the DUF26 class of RLKs is of particular interest, as almost one-third of the members of this class are at least 2-fold up-regulated. A comparable induction of similar RLKs (PRK1–PRK4) was observed in potato (Solanum tuberosum) upon treatments with oligogalacturonides (Montesano et al., 2001). These plasma membrane-localized proteins are composed of an extracellular region containing two plant-specific DUF26 domains (each characterized by a conserved C-X8-C-X2-C motif) linked to an intracellular Ser/Thr kinase domain by a single membrane-spanning domain (Thomas et al., 2008). Although the function of these RLKs is not known, the structure of a DUF26-containing protein supports the idea that the DUF26 domain can interact with apoplastic carbohydrates (Miyakawa et al., 2009). Moreover, the DUF26 RLK family is plant specific and expanded after the divergence of vascular plants, supporting the suggested link with the plant cell wall. If DUF26 RLKs interact with cell wall compounds, they could monitor cell wall perturbations caused by biotic or abiotic stresses and communicate signals across the cell membrane to switch on the appropriate reaction response. This function is similar to that of lectin RLKs and wall-associated kinases; transmembrane proteins of these families are characterized by a carbohydrate-binding extracellular domain and a cytoplasmic kinase domain (Humphrey et al., 2007; Wolf et al., 2012). A physical interaction with cell wall polysaccharides and oligosaccharides was already demonstrated for some of these proteins (Kohorn and Kohorn, 2012). This brings the DUF26 domain, or the RLKs in general, to the fore as another interesting target in our competition model (Fig. 11). The significant increase in expression level of these receptor genes upon (GlcNAc)n accumulation in the apoplast is in agreement with the proposed model, where blocking the interaction between receptor and cell wall polysaccharide may trigger a positive feedback to increase receptor abundance to outcompete the competitor. An attempt to determine the function of DUF26 RLKs revealed a transcriptional regulation of many similar members of this family by extracellular ozone, pathogens, or microbe-associated molecular patterns (Engelmann et al., 2008; Wrzaczek et al., 2010). It is well known that apoplastic ozone is quickly converted into reactive oxygen species that can modify the integrity of the cell wall (Ehlers and van Bel, 2010; Duan and Kasper, 2011). Also, pathogens modify cell walls in a direct or indirect way, supporting our hypothesis that the DUF26 transcript levels change upon cell wall perturbations.
In conclusion, we revealed how the accumulation of GlcNAc oligosaccharides in the plant cell wall causes a strong conditional phenotype. This response is not mediated by the CERK1 receptor but is most likely the result of competitive inhibition with noncovalent interactions between cell wall polymers. In addition, a set of genes coding for DUF26 transmembrane receptors was up-regulated upon GlcNAc oligosaccharide accumulation, pointing toward an unexplored function for these proteins in monitoring cell wall integrity.
MATERIALS AND METHODS
Plant Material and Growth Conditions
Arabidopsis (Arabidopsis thaliana) ecotype Col-0 seeds were vapor phase sterilized overnight (150 mL of bleach with 4.5 mL of HCl) prior to being sown on 0.5× Murashige and Skoog medium (2.15 g L−1 Murashige and Skoog basal salt mixture [Duchefa], 0.05% [w/v] MES buffer, 2% [w/v] Glc, and 0.8% [w/v] plant agar, pH 5.7). Plates were incubated at 4°C for at least 2 d, whereupon they were oriented vertically in the growth chamber under LD conditions (16 h of light, 8 h of dark, 21°C). For in vivo growth experiments, young seedlings (5 d after germination unless otherwise stated) were transferred to Jiffy 7 pellets (AS Jiffy Products) and grown in a growth chamber under LD conditions. Alternatively, plants were first grown under SD conditions (8 h of light, 16 h of dark, 21°C [day], 18°C [night]) before being transferred to LD conditions. The exact time point whereupon plants were transferred to LD conditions is mentioned in “Results.”
Cloning
A DNA fragment coding for NodC of Azorhizobium caulinodans (locus tag AZC_3816) was introduced between transfer DNA (T-DNA) borders of a pGSC1700 binary vector in combination with a chimeric bar gene providing resistance to phosphinothricin. For GFAT, a dicot codon-optimized sequence based on the Escherichia coli gene NC_002655 was cloned into the T-DNA vector. Expression of the different genes was controlled by the cauliflower mosaic virus 35S promoter. The resulting T-DNA vectors, named pTGK42 (NodC expression) and pTKL15 (both NodC and GFAT expression), were introduced into the Agrobacterium tumefaciens strain C58ClRIF(pEHA101) (Hood et al., 1986), which was used to transform Arabidopsis by means of the floral dip method (Clough and Bent, 1998). Homozygous single-insert mutants were selected on 0.5× Murashige and Skoog medium containing phosphinothricin. For the subcellular localization, a C-terminal EGFP fusion construct (pTGK44) was introduced in Agrobacterium rhizogenes ATCC15834, which was used for generating Arabidopsis hairy roots.
Cell Wall Compositional Analysis
All analyses were performed on a 12-cm fragment of a dried stem, taken 1 cm above the base of the stem. The collected section was subsequently fragmented into 2-mm fragments and subjected to sequential extractions, each time for 30 min in water (98°C), ethanol (76°C), chloroform (59°C), and acetone (54°C). The remaining CWR was dried under vacuum and weighed again. Three milligrams of CWR was incubated with 2 m TFA and 20 µL of inositol (5 mg mL−1) during 2 h at 99°C while shaking (750 rpm) in an Eppendorf Thermomixer. The TFA extract was removed, and the remaining pellet was washed three times with water, twice with acetone, and subsequently dried under vacuum. After drying, the pellet was weighed to determine the fraction of TFA-extractable carbohydrates. The dry pellet was subsequently incubated with 1 mL of Updegraff reagent (acetic acid:nitric acid:water, 8:1:2, v/v) for 30 min at 99°C. After removing the supernatant, the pellet was washed once with water and three times with acetone, whereupon the pellet was air dried overnight. The next day, 175 µL of 72% (v/v) sulfuric acid was added to the pellet, whereupon the mixture was incubated for 45 min at room temperature. Finally, 825 µL of water was added and 10 µL was transferred to a 96-well microplate, to which 90 µL of water and 200 µL of freshly prepared anthrone reagent was added (2 mg of anthrone in 1 mL of sulfuric acid). The microplate was heated for 30 min in an incubator at 80°C. Absorbance was read at 625 nm using a SpectraMax 250 microplate reader (Sopachem). The amount of cellulose was calculated back from a standard curve of Glc. The residual pellet was incubated in 250 µL of 25% acetyl bromide (v/v; in acetic acid) for 2 h at 50°C without shaking and for an additional 1 h at the same temperature but with vortexing every 15 min. Samples were subsequently cooled on ice and centrifuged for 15 min at 10,000 rpm. One hundred microliters of the supernatant was transferred to a 2-mL Eppendorf tube to which 400 µL of 2 m NaOH and 75 µL of 0.5 m hydroxylamine hydrochloride was added. Acetic acid was added to a total volume of 2 mL, and the mixture was inverted several times. The absorbance (A) of the solution was measured at 280 nm using a NanoDrop ND-1000 spectrophotometer (NanoDrop Technologies). The lignin concentrations (c) were calculated using the law of Bouguer-Lambert-Beer (A = ε × l × c, where ε = 23.35 mL mg−1 cm−1 [Chang et al., 2008] and l = 0.1 cm).
Whole Cell Wall NMR
For whole cell wall NMR analysis, approximately 250 mg of dried Arabidopsis stem (12-cm fragments, harvested 1 cm above the rosette) was preground for 1 min in a Retsch MM400 mixer mill at 30 Hz, using zirconium dioxide vessels (10 mL) containing zirconium dioxide ball bearings (2 × 12 mm). The preground cell walls were extracted three times with distilled water and subsequently three times with 80% (v/v) ethanol by sonicating in an ultrasonic bath for 30 min each time. The freeze-dried extractive-free Arabidopsis samples were ball milled using a Retsch PM100 planetary ball mill at 600 rpm, using zirconium dioxide vessels (50 mL) containing zirconium dioxide ball bearings (10 × 10 mm). Each sample (100 mg) was ground for 25 min (interval, 5 min; break, 5 min, to avoid sample heating). The ball-milled cell walls were collected directly into the NMR tubes and gels formed using dimethyl sulfoxide (DMSO)-d6:pyridine-d5 (4:1). NMR experiments for the whole cell wall gel-state samples were also performed as described previously (Kim and Ralph, 2010; Mansfield et al., 2012). NMR spectra were acquired on a Bruker Biospin Avance 500-MHz spectrometer fitted with a cryogenically cooled 5-mm Triple Resonance Inverse gradient probe with inverse geometry (proton coils closest to the sample). The central DMSO solvent peak was used as an internal reference (δC 39.5 ppm, δH 2.49 ppm). The 1H-13C correlation experiment was an adiabatic Heteronuclear Single Quantum Coherence (HSQC) experiment (Bruker standard pulse sequence hsqcetgpsisp.2; phase-sensitive gradient-edited-2D HSQC using adiabatic pulses for inversion and refocusing). HSQC experiments were carried out using the following parameters: acquired from 10 to 0 ppm in F2 (1H) with 1,000 data points (acquisition time, 100 ms) and 200 to 0 ppm in F1 (13C) with 400 increments (F1 acquisition time, 8 ms) of 80 scans with an interscan delay (D1) of 500 ms; the D24 delay was set to 0.89 ms (1/8J, J = 145 Hz). The total acquisition time was 5 h and 35 min. Processing used typical matched Gaussian apodization (Gaussian broadening factor = 0.001, line broadening factor = −0.1) in F2 and squared cosine-bell and one level of linear prediction (32 coefficients) in F1. The volume integration of contours in HSQC plots used Bruker’s TopSpin 3 (Mac version) software and was carried out on spectra in which linear prediction was turned off.
Saccharification
Saccharification was performed as described by Van Acker et al. (2013). Briefly, aliquots of 5 mg of CWR were dissolved in 1 mL of acetic acid buffer solution (pH 4.8) and incubated at 50°C. The enzyme mix (0.06 filter paper units, measured with a filter paper assay; Xiao et al., 2004) added to the dissolved material contained desalted cellulase from Trichoderma reesei ATCC 26921 and β-glucosidase (Novozyme 188) in a 5:3 ratio. Aliquots of 20 µL were taken after 4, 24, and 48 h of incubation, and the Glc concentration was measured indirectly via a spectrophotometrical color reaction. The reaction mixture (100 mL) contained 50 mg of 2,2′-azino-bis(3-ethylbenzothiazoline-6-sulfonic acid), 44.83 mg of Glc oxidase, and 4% (w/v) peroxidase (Roche) in acetic acid buffer solution (pH 4.5). To measure the concentration of Glc, 50 µL of the diluted samples was added to 150 µL of Glc oxidase-peroxidase reaction mixture and incubated for 30 min at 37°C. Absorbance was measured spectrophotometrically at a wavelength of 405 nm using a SpectraMax 250 microplate reader (Sopachem). The exact Glc concentration was calculated from a standard curve obtained by measuring the absorbance of a set of different d-Glc concentrations.
GlcNAc Detection
The GlcNAc oligomers were analyzed using a combination of derivatization, HPLC, and MS as described by Rozaklis et al. (2002). Briefly, leaf samples (20–150 mg) were snap frozen in liquid nitrogen and ground in 2-mL Eppendorf tubes using an M300 mixer mill (Retsch). Methanol (80%[v/v], 0.5 mL) was added, and the tubes were vortexed and centrifuged in a precooled tabletop centrifuge (5 min, 14,000 rpm). Supernatant was transferred to a fresh 2-mL tube and lyophilized in a SpeedVac. The pellet was resuspended in 100 μL of methanol containing 0.5 m 1-phenyl-3-methyl-5-pyrazolone and 100 μL of 800 mm NH3. The reaction mixture was incubated at 70°C in a thermomixer (Eppendorf) for 90 min at 850 rpm. After this incubation step, the reaction mixture was neutralized by adding 200 μL of 400 mm formic acid and water up to 500 μL. After three subsequent chloroform extractions using 0.5 mL of chloroform, samples were freeze dried and resuspended in 200 μL of water. Samples were injected on an ultra-HPLC system (Acquity UPLC; Waters) equipped with a BEH C18 column (2.1 × 150 mm, 1.7 µm; Waters) and hyphenated to a Thermo LCQ mass spectrometer. Mobile phases were composed of water containing 1% (v/v) acetonitrile and 0.1% (v/v) ammonium acetate (A) and acetonitrile containing 1% (v/v) water and 0.1% (v/v) ammonium acetate (B). Column temperature was maintained at 55°C and the autosampler temperature at 10°C. The following linear gradient elution was used with a rate of 300 μL min−1: at 0 min, 20% (v/v) B; 10 min, 25% (v/v) B; and 14 min, 100% (v/v) B. Full MS and tandem MS spectra of the eluting compounds were obtained with electrospray ionization operated in positive-ion mode. Derivatized GlcNAc has an m/z value of 552.2 in positive mode, and the m/z values of the (GlcNAc)n oligomers were 755.3 (n = 2), 958.4 (n = 3), 1,161.5 (n = 4), and 1,364.6 (n = 5). Quantification of the compounds was based on total peak area. For the targeted screen, single-ion monitoring was used with a window of 4 D.
Accurate mass was obtained via hyphenating the ultra-HPLC system to a time-of-flight mass spectrometer (Synapt Q-Tof; Waters). The flow was diverted to the mass spectrometer equipped with an electrospray ionization source and lockspray interface for accurate mass measurements. The MS source parameters were as follows: capillary voltage, 2.8 kV; sampling cone, 41 V; extraction cone, 3 V; source temperature, 120°C; desolvation temperature, 350°C; cone gas flow, 50 L h−1; and desolvation gas flow, 550 L h−1. The collision energy for the trap and transfer cells was 6 and 4 V, respectively. For data acquisition, the dynamic range enhancement mode was activated. Full-scan data were recorded in positive centroid V-mode; the mass range between m/z 100 and 1,700, with a scan speed of 0.2 s scan−1, was recorded with Masslynx software (Waters). Leucin-enkephalin (250 pg μL−1; solubilized in water:acetonitrile 1:1 [v/v] with 0.1% [v/v] formic acid) was used for the lock mass calibration, with scanning every 10 s with a scan time of 0.5 s.
Subcellular Localization
Fully developed leaves of 3-week-old Arabidopsis plants were harvested and submerged in 10% (v/v) formalin-0.25% (v/v) glutaraldehyde (in phosphate-buffered saline [PBS]) for 30 min using vacuum infiltration. The fixative was refreshed twice, and the fixation was repeated using slightly longer incubation times (1 and 2 h). Leaves were subsequently incubated twice in PBS and once in PBS + 0.1% (v/v) Tween 20 for 1 h. Thereafter, the buffer was replaced by the same buffer containing WGA-Alexa Fluor 555 (3 µg mL−1) and incubated for 4 h, whereupon the samples were washed twice in PBS + 0.1% (v/v) Tween 20 and once with PBS (1 h each). The stained tissue was mounted on a microscope slide and evaluated by means of three-dimensional fluorescence microscopy (Apoptome; Zeiss) for optical sections. Alternatively, IgM monoclonal antibodies to GlcNAc (Biodesign) were used in combination with Alexa Fluor 488-labeled goat anti-mouse IgM antibodies (Molecular Probes) to visualize the presence of GlcNAc oligomers in Arabidopsis root hairs.
Western Blotting to Detect Glycoproteins
Leaf samples (24–26 mg) were snap frozen in liquid nitrogen and ground in 2-mL Eppendorf tubes using a Retsch MM301 ball mill. To obtain a crude protein extract, 0.5 mL of extraction buffer (50 mm NaP2O4, pH 7, 1 mm EDTA, 0.1% Triton X-100, and 10 mm β-mercaptoethanol) was added, and the tubes were incubated on ice for 10 min. During incubation, the tubes were inverted several times. Samples were centrifuged in a precooled tabletop centrifuge (5 min, 14,000 rpm). Supernatant (100 µL) was transferred to a 1.5-mL Eppendorf tube, and an equal amount of loading buffer was added. Samples were heated (5 min, 95°C), and 40-µL aliquots were run on a 10% (v/v) or 12% (v/v) SDS-PAGE gel. After separation, proteins were transferred to a polyvinylidene difluoride membrane (1 h at 100 V) using a Mini Trans-Blot cell (Bio-Rad). Membranes were blocked in blocking buffer (100 mm Tris, pH 7.5, 0.5% [v/v] Tween 20, and 1% [v/v] bovine serum albumin) for 1 h at room temperature and then incubated overnight with peroxidase-conjugated ConA and WGA diluted in 0.5× blocking buffer. The membranes were subsequently washed five times in PBS + 0.1% (v/v) Tween 20 for 10 min at room temperature. Visualization was performed with the chromogenic peroxidase substrate DAB.
Light and Electron Microscopy Analyses
For light microscopy, stem segments were embedded in 7% (w/v) agar, and sections (100–150 μm) were made using a vibratome. To assess changes in lignin deposition, sections were stained with Wiesner stain (phloroglucinol-HCl). For scanning electron microscopy, slightly thicker sections (250–500 µm) were made from the embedded stem segments, using a tabletop scanning electron microscope (Hitachi). For transmission electron microscopy, samples were excised and immersed in a fixative solution of 2% paraformaldehyde and 2.5% glutaraldehyde and postfixed in 1% OsO4 with 1.5% K3Fe(CN)6 in 0.1 m sodium cacodylate buffer, pH 7.2, for 1 h under vacuum infiltration at room temperature and 4 h at room temperature rotating followed by fixation overnight at 4°C. After washing three times for 20 min in buffer, samples were dehydrated through a graded ethanol series, including a bulk staining with 2% uranyl acetate at the 50% ethanol step, followed by embedding in Spurr’s resin. Semithin sections were made and stained with toluidine blue. Ultrathin sections of a gold interference color were cut using an ultramicrotome (Leica EM UC6), followed by poststaining with uranyl acetate and lead citrate in the Leica EM AC20, and collected on formvar-coated copper slot grids. They were viewed with a transmission electron microscope (JEOL 1010; JEOL).
Visualization of H2O2 with DAB Staining
The accumulation of H2O2 was detected by in situ histochemical staining using DAB. In vitro-grown seedlings (5 d post germination) were transferred to a six-well plate, briefly rinsed with PBS, and subsequently incubated in a solution containing 1 mg mL−1 DAB (pH 5.5) for 1.5 h.
Transcript Profiling
Sterile Arabidopsis ecotype Col-0 seeds were germinated in vitro under LD conditions. Ten days after germination, seedlings were transferred to Jiffy 7 pellets and grown in a growth chamber under SD conditions for 2 weeks before being shifted toward LD conditions. Twelve-centimeter sections of developing stems (24- to 28-cm stage), harvested 1 cm above the rosette, were snap frozen and ground in liquid nitrogen, and total RNA of a pool of five stems was isolated with mirRVana (Ambion). The protocol was followed according to the manufacturer’s instructions until the step where total RNA was purified from the pooled sample. The quality checks as well as the microarray hybridization were performed by the MicroArray Facility of the Flanders Interuniversity Institute for Biotechnology (www.microarrays.be), and differentially expressed genes were identified with the R/Bioconductor package Limma using linear models and by taking into account technical and biological replicates.
Sequence data from this article can be found in the GenBank/EMBL data libraries under accession numbers NodC, AAB51164; and GFAT, NC_002655.
Supplemental Data
The following materials are available in the online version of this article.
Supplemental Figure S1. Increase of GlcNAc monomer and oligomers upon treatment with tunicamycin.
Supplemental Figure S2. Monosaccharide composition of TFA-extractable carbohydrates of cell walls from NodC OE lines and wild-type plants.
Supplemental Figure S3. Overlay of partial short-range 1H-13C (HSQC) spectra of acetylated cell wall gels (blue) and chitin (red) dissolved in 4:1 DMSO-d6:pyridine-d5.
Supplementary Material
Acknowledgments
We thank Véronique Storme for assistance in designing and processing the microarray experiment.
Glossary
- RLK
receptor-like kinase
- LD
long-day
- OE
overexpression
- MS
mass spectrometry
- DP
degree of polymerization
- m/z
mass-to-charge ratio
- WGA
wheat germ agglutinin
- SD
short-day
- Col-0
Columbia-0
- ER
endoplasmic reticulum
- DAB
3,3′-diaminobenzidine
- H2O2
hydrogen peroxide
- ConA
concanavalin A
- CWR
cell wall residue
- TFA
trifluoacetic acid
- T-DNA
transfer DNA
- DMSO
dimethyl sulfoxide
- PBS
phosphate-buffered saline
Footnotes
This work was supported by the Bijzonder Onderzoeksfonds-Zware Apparatuur of Ghent University (grant no. 174PZA05), the Hercules Foundation (grant no. AUGE/014), the U.S. Department of Energy’s Great Lakes Bioenergy Research Center (grant no. BER DE–FC02–07ER64494), the Multidisciplinary Research Partnership Biotechnology for a Sustainable Economy of Ghent University (grant no. 01MRB510W), and the Research Foundation-Flanders (postdoctoral fellowship to R.V.).
The online version of this article contains Web-only data.
Articles can be viewed online without a subscription.
References
- Allen AK, Neuberger A, Sharon N. (1973) The purification, composition and specificity of wheat-germ agglutinin. Biochem J 131: 155–162 [DOI] [PMC free article] [PubMed] [Google Scholar]
- Barker D, Bessou P, Jankowska E, Pages B, Stacey MJ. (1975) Distribution of static and dynamic gamma axons to cat intrafusal muscle-fibers. J Anat 119: 199–200 [Google Scholar]
- Barny MA, Schoonejans E, Economou A, Johnston AWB, Downie JA. (1996) The C-terminal domain of the Rhizobium leguminosarum chitin synthase NodC is important for function and determines the orientation of the N-terminal region in the inner membrane. Mol Microbiol 19: 443–453 [DOI] [PubMed] [Google Scholar]
- Becker B, Holtgrefe S, Jung S, Wunrau C, Kandlbinder A, Baier M, Dietz KJ, Backhausen JE, Scheibe R. (2006) Influence of the photoperiod on redox regulation and stress responses in Arabidopsis thaliana L. (Heynh.) plants under long- and short-day conditions. Planta 224: 380–393 [DOI] [PubMed] [Google Scholar]
- Boerjan W, Ralph J, Baucher M. (2003) Lignin biosynthesis. Annu Rev Plant Biol 54: 519–546 [DOI] [PubMed] [Google Scholar]
- Bridonneau P, Chang YF, Buvoli AV, O’Connell D, Parma D. (1999) Site-directed selection of oligonucleotide antagonists by competitive elution. Antisense Nucleic Acid Drug Dev 9: 1–11 [DOI] [PubMed] [Google Scholar]
- Chang XF, Chandra R, Berleth T, Beatson RP. (2008) Rapid, microscale, acetyl bromide-based method for high-throughput determination of lignin content in Arabidopsis thaliana. J Agric Food Chem 56: 6825–6834 [DOI] [PubMed] [Google Scholar]
- Chou KC, Shen HB. (2010) Plant-mPLoc: a top-down strategy to augment the power for predicting plant protein subcellular localization. PLoS ONE 5: e11335. [DOI] [PMC free article] [PubMed] [Google Scholar]
- Clough SJ, Bent AF. (1998) Floral dip: a simplified method for Agrobacterium-mediated transformation of Arabidopsis thaliana. Plant J 16: 735–743 [DOI] [PubMed] [Google Scholar]
- Cosgrove DJ. (2005) Growth of the plant cell wall. Nat Rev Mol Cell Biol 6: 850–861 [DOI] [PubMed] [Google Scholar]
- de Jonge R, van Esse HP, Kombrink A, Shinya T, Desaki Y, Bours R, van der Krol S, Shibuya N, Joosten MH, Thomma BP. (2010) Conserved fungal LysM effector Ecp6 prevents chitin-triggered immunity in plants. Science 329: 953–955 [DOI] [PubMed] [Google Scholar]
- de Mesquita JP, Donnici CL, Teixeira IF, Pereira FV. (2012) Bio-based nanocomposites obtained through covalent linkage between chitosan and cellulose nanocrystals. Carbohydr Polym 90: 210–217 [DOI] [PubMed] [Google Scholar]
- Duan JY, Kasper DL. (2011) Oxidative depolymerization of polysaccharides by reactive oxygen/nitrogen species. Glycobiology 21: 401–409 [DOI] [PMC free article] [PubMed] [Google Scholar]
- Ehlers K, van Bel AJE. (2010) Dynamics of plasmodesmal connectivity in successive interfaces of the cambial zone. Planta 231: 371–385 [DOI] [PubMed] [Google Scholar]
- Ehlting J, Mattheus N, Aeschliman DS, Li E, Hamberger B, Cullis IF, Zhuang J, Kaneda M, Mansfield SD, Samuels L, et al. (2005) Global transcript profiling of primary stems from Arabidopsis thaliana identifies candidate genes for missing links in lignin biosynthesis and transcriptional regulators of fiber differentiation. Plant J 42: 618–640 [DOI] [PubMed] [Google Scholar]
- Engelmann JC, Schwarz R, Blenk S, Friedrich T, Seibel PN, Dandekar T, Müller T. (2008) Unsupervised meta-analysis on diverse gene expression datasets allows insight into gene function and regulation. Bioinform Biol Insights 2: 265–280 [DOI] [PMC free article] [PubMed] [Google Scholar]
- Gao XD, Moriyama S, Miura N, Dean N, Nishimura SI. (2008) Interaction between the C termini of Alg13 and Alg14 mediates formation of the active UDP-N-acetylglucosamine transferase complex. J Biol Chem 283: 32534–32541 [DOI] [PMC free article] [PubMed] [Google Scholar]
- Geremia RA, Mergaert P, Geelen D, Van Montagu M, Holsters M. (1994) The NodC protein of Azorhizobium caulinodans is an N-acetylglucosaminyltransferase. Proc Natl Acad Sci USA 91: 2669–2673 [DOI] [PMC free article] [PubMed] [Google Scholar]
- Gimenez-Ibanez S, Hann DR, Ntoukakis V, Petutschnig E, Lipka V, Rathjen JP. (2009) AvrPtoB targets the LysM receptor kinase CERK1 to promote bacterial virulence on plants. Curr Biol 19: 423–429 [DOI] [PubMed] [Google Scholar]
- Goulao LF, Oliveira CM. (2008) Cell wall modifications during fruit ripening: when a fruit is not the fruit. Trends Food Sci Technol 19: 4–25 [Google Scholar]
- He CJ, Ma BM, Sun JF. (2009) The preparation and properties of cellulose/chitin blend filaments. J Appl Polym Sci 113: 2777–2784 [Google Scholar]
- Hood EE, Helmer GL, Fraley RT, Chilton MD. (1986) The hypervirulence of Agrobacterium tumefaciens A281 is encoded in a region of pTiBo542 outside of T-DNA. J Bacteriol 168: 1291–1301 [DOI] [PMC free article] [PubMed] [Google Scholar]
- Humphrey TV, Bonetta DT, Goring DR. (2007) Sentinels at the wall: cell wall receptors and sensors. New Phytol 176: 7–21 [DOI] [PubMed] [Google Scholar]
- Jamar C, du Jardin P, Fauconnier ML. (2011) Cell wall polysaccharides hydrolysis of malting barley (Hordeum vulgare L.): a review. Biotechnol Agron Soc 15: 301–313 [Google Scholar]
- Kim H, Ralph J. (2010) Solution-state 2D NMR of ball-milled plant cell wall gels in DMSO-d6/pyridine-d5. Org Biomol Chem 8: 576–591 [DOI] [PMC free article] [PubMed] [Google Scholar]
- Ko JH, Han KH. (2004) Arabidopsis whole-transcriptome profiling defines the features of coordinated regulations that occur during secondary growth. Plant Mol Biol 55: 433–453 [DOI] [PubMed] [Google Scholar]
- Kohorn BD, Kohorn SL. (2012) The cell wall-associated kinases, WAKs, as pectin receptors. Front Plant Sci 3: 88. [DOI] [PMC free article] [PubMed] [Google Scholar]
- Koizumi N, Ujino T, Sano H, Chrispeels MJ. (1999) Overexpression of a gene that encodes the first enzyme in the biosynthesis of asparagine-linked glycans makes plants resistant to tunicamycin and obviates the tunicamycin-induced unfolded protein response. Plant Physiol 121: 353–361 [DOI] [PMC free article] [PubMed] [Google Scholar]
- Kumpf RP, Shi CL, Larrieu A, Stø IM, Butenko MA, Péret B, Riiser ES, Bennett MJ, Aalen RB. (2013) Floral organ abscission peptide IDA and its HAE/HSL2 receptors control cell separation during lateral root emergence. Proc Natl Acad Sci USA 110: 5235–5240 [DOI] [PMC free article] [PubMed] [Google Scholar]
- Kung LA, Tao SC, Qian J, Smith MG, Snyder M, Zhu H. (2009) Global analysis of the glycoproteome in Saccharomyces cerevisiae reveals new roles for protein glycosylation in eukaryotes. Mol Syst Biol 5: 308. [DOI] [PMC free article] [PubMed] [Google Scholar]
- Lagaert S, Beliën T, Volckaert G. (2009) Plant cell walls: protecting the barrier from degradation by microbial enzymes. Semin Cell Dev Biol 20: 1064–1073 [DOI] [PubMed] [Google Scholar]
- Lee JW, Deng F, Yeomans WG, Allen AL, Gross RA, Kaplan DL. (2001) Direct incorporation of glucosamine and N-acetylglucosamine into exopolymers by Gluconacetobacter xylinus (=Acetobacter xylinum) ATCC 10245: production of chitosan-cellulose and chitin-cellulose exopolymers. Appl Environ Microbiol 67: 3970–3975 [DOI] [PMC free article] [PubMed] [Google Scholar]
- Lefebvre T, Baert F, Bodart JF, Flament S, Michalski JC, Vilain JP. (2004) Modulation of O-GlcNAc glycosylation during Xenopus oocyte maturation. J Cell Biochem 93: 999–1010 [DOI] [PubMed] [Google Scholar]
- Libault M, Wan JR, Czechowski T, Udvardi M, Stacey G. (2007) Identification of 118 Arabidopsis transcription factor and 30 ubiquitin-ligase genes responding to chitin, a plant-defense elicitor. Mol Plant Microbe Interact 20: 900–911 [DOI] [PubMed] [Google Scholar]
- Liepman AH, Wightman R, Geshi N, Turner SR, Scheller HV. (2010) Arabidopsis: a powerful model system for plant cell wall research. Plant J 61: 1107–1121 [DOI] [PubMed] [Google Scholar]
- Liu JX, Srivastava R, Che P, Howell SH. (2007) An endoplasmic reticulum stress response in Arabidopsis is mediated by proteolytic processing and nuclear relocation of a membrane-associated transcription factor, bZIP28. Plant Cell 19: 4111–4119 [DOI] [PMC free article] [PubMed] [Google Scholar]
- Liu TT, Liu ZX, Song CJ, Hu YF, Han ZF, She J, Fan FF, Wang JW, Jin CW, Chang JB, et al. (2012) Chitin-induced dimerization activates a plant immune receptor. Science 336: 1160–1164 [DOI] [PubMed] [Google Scholar]
- Liu XD, Nishi N, Tokura S, Sakairi N. (2001) Chitosan coated cotton fiber: preparation and physical properties. Carbohydr Polym 44: 233–238 [Google Scholar]
- Mansfield SD, Kim H, Lu FC, Ralph J. (2012) Whole plant cell wall characterization using solution-state 2D NMR. Nat Protoc 7: 1579–1589 [DOI] [PubMed] [Google Scholar]
- Miya A, Albert P, Shinya T, Desaki Y, Ichimura K, Shirasu K, Narusaka Y, Kawakami N, Kaku H, Shibuya N. (2007) CERK1, a LysM receptor kinase, is essential for chitin elicitor signaling in Arabidopsis. Proc Natl Acad Sci USA 104: 19613–19618 [DOI] [PMC free article] [PubMed] [Google Scholar]
- Miyakawa T, Miyazono K, Sawano Y, Hatano K, Tanokura M. (2009) Crystal structure of ginkbilobin-2 with homology to the extracellular domain of plant cysteine-rich receptor-like kinases. Proteins 77: 247–251 [DOI] [PubMed] [Google Scholar]
- Monsigny M, Roche AC, Sene C, Maget-Dana R, Delmotte F. (1980) Sugar-lectin interactions: how does wheat-germ agglutinin bind sialoglycoconjugates? Eur J Biochem 104: 147–153 [DOI] [PubMed] [Google Scholar]
- Montesano M, Kõiv V, Mäe A, Palva ET. (2001) Novel receptor-like protein kinases induced by Erwinia carotovora and short oligogalacturonides in potato. Mol Plant Pathol 2: 339–346 [DOI] [PubMed] [Google Scholar]
- Nozaki M, Sugiyama M, Duan J, Uematsu H, Genda T, Sato Y. (2012) A missense mutation in the glucosamine-6-phosphate N-acetyltransferase-encoding gene causes temperature-dependent growth defects and ectopic lignin deposition in Arabidopsis. Plant Cell 24: 3366–3379 [DOI] [PMC free article] [PubMed] [Google Scholar]
- Popper ZA. (2008) Evolution and diversity of green plant cell walls. Curr Opin Plant Biol 11: 286–292 [DOI] [PubMed] [Google Scholar]
- Rozaklis T, Ramsay SL, Whitfield PD, Ranieri E, Hopwood JJ, Meikle PJ. (2002) Determination of oligosaccharides in Pompe disease by electrospray ionization tandem mass spectrometry. Clin Chem 48: 131–139 [PubMed] [Google Scholar]
- Sánchez-Rodríguez C, Bauer S, Hématy K, Saxe F, Ibáñez AB, Vodermaier V, Konlechner C, Sampathkumar A, Rüggeberg M, Aichinger E, et al. (2012) CHITINASE-LIKE1/POMPOM1 and its homolog CTL2 are glucan-interacting proteins important for cellulose biosynthesis in Arabidopsis. Plant Cell 24: 589–607 [DOI] [PMC free article] [PubMed] [Google Scholar]
- Shirai A, Sakairi N, Nishi N, Tokura S. (1997) Preparation of a novel (1→4)-beta-D-glycan by Acetobacter xylinum: a proposed mechanism for incorporation of a N-acetylglucosamine residue into bacterial cellulose. Carbohydr Polym 32: 223–227 [Google Scholar]
- Thomas CL, Bayer EM, Ritzenthaler C, Fernandez-Calvino L, Maule AJ. (2008) Specific targeting of a plasmodesmal protein affecting cell-to-cell communication. PLoS Biol 6: e7. [DOI] [PMC free article] [PubMed] [Google Scholar]
- Turner SR, Somerville CR. (1997) Collapsed xylem phenotype of Arabidopsis identifies mutants deficient in cellulose deposition in the secondary cell wall. Plant Cell 9: 689–701 [DOI] [PMC free article] [PubMed] [Google Scholar]
- Van Acker R, Vanholme R, Storme V, Mortimer JC, Dupree P, Boerjan W. (2013) Lignin biosynthesis perturbations affect secondary cell wall composition and saccharification yield in Arabidopsis thaliana. Biotechnol Biofuels 6: 46. [DOI] [PMC free article] [PubMed] [Google Scholar]
- Vanholme R, Storme V, Vanholme B, Sundin L, Christensen JH, Goeminne G, Halpin C, Rohde A, Morreel K, Boerjan W. (2012) A systems biology view of responses to lignin biosynthesis perturbations in Arabidopsis. Plant Cell 24: 3506–3529 [DOI] [PMC free article] [PubMed] [Google Scholar]
- Wan JR, Tanaka K, Zhang XC, Son GH, Brechenmacher L, Nguyen TH, Stacey G. (2012) LYK4, a lysin motif receptor-like kinase, is important for chitin signaling and plant innate immunity in Arabidopsis. Plant Physiol 160: 396–406 [DOI] [PMC free article] [PubMed] [Google Scholar]
- Wan JR, Zhang SQ, Stacey G. (2004) Activation of a mitogen-activated protein kinase pathway in Arabidopsis by chitin. Mol Plant Pathol 5: 125–135 [DOI] [PubMed] [Google Scholar]
- Wan JR, Zhang XC, Neece D, Ramonell KM, Clough S, Kim SY, Stacey MG, Stacey G. (2008) A LysM receptor-like kinase plays a critical role in chitin signaling and fungal resistance in Arabidopsis. Plant Cell 20: 471–481 [DOI] [PMC free article] [PubMed] [Google Scholar]
- Wolf S, Hématy K, Höfte H. (2012) Growth control and cell wall signaling in plants. Annu Rev Plant Biol 63: 381–407 [DOI] [PubMed] [Google Scholar]
- Worden N, Park E, Drakakaki G. (2012) Trans-Golgi network: an intersection of trafficking cell wall components. J Integr Plant Biol 54: 875–886 [DOI] [PubMed] [Google Scholar]
- Wrzaczek M, Brosché M, Salojärvi J, Kangasjärvi S, Idänheimo N, Mersmann S, Robatzek S, Karpiński S, Karpińska B, Kangasjärvi J. (2010) Transcriptional regulation of the CRK/DUF26 group of receptor-like protein kinases by ozone and plant hormones in Arabidopsis. BMC Plant Biol 10: 95. [DOI] [PMC free article] [PubMed] [Google Scholar]
- Xiao Z, Storms R, Tsang A. (2004) Microplate-based filter paper assay to measure total cellulase activity. Biotechnol Bioeng 88: 832–837 [DOI] [PubMed] [Google Scholar]
- Zhong RQ, Kays SJ, Schroeder BP, Ye ZH. (2002) Mutation of a chitinase-like gene causes ectopic deposition of lignin, aberrant cell shapes, and overproduction of ethylene. Plant Cell 14: 165–179 [DOI] [PMC free article] [PubMed] [Google Scholar]
- Zhong RQ, Ripperger A, Ye ZH. (2000) Ectopic deposition of lignin in the pith of stems of two Arabidopsis mutants. Plant Physiol 123: 59–70 [DOI] [PMC free article] [PubMed] [Google Scholar]
Associated Data
This section collects any data citations, data availability statements, or supplementary materials included in this article.
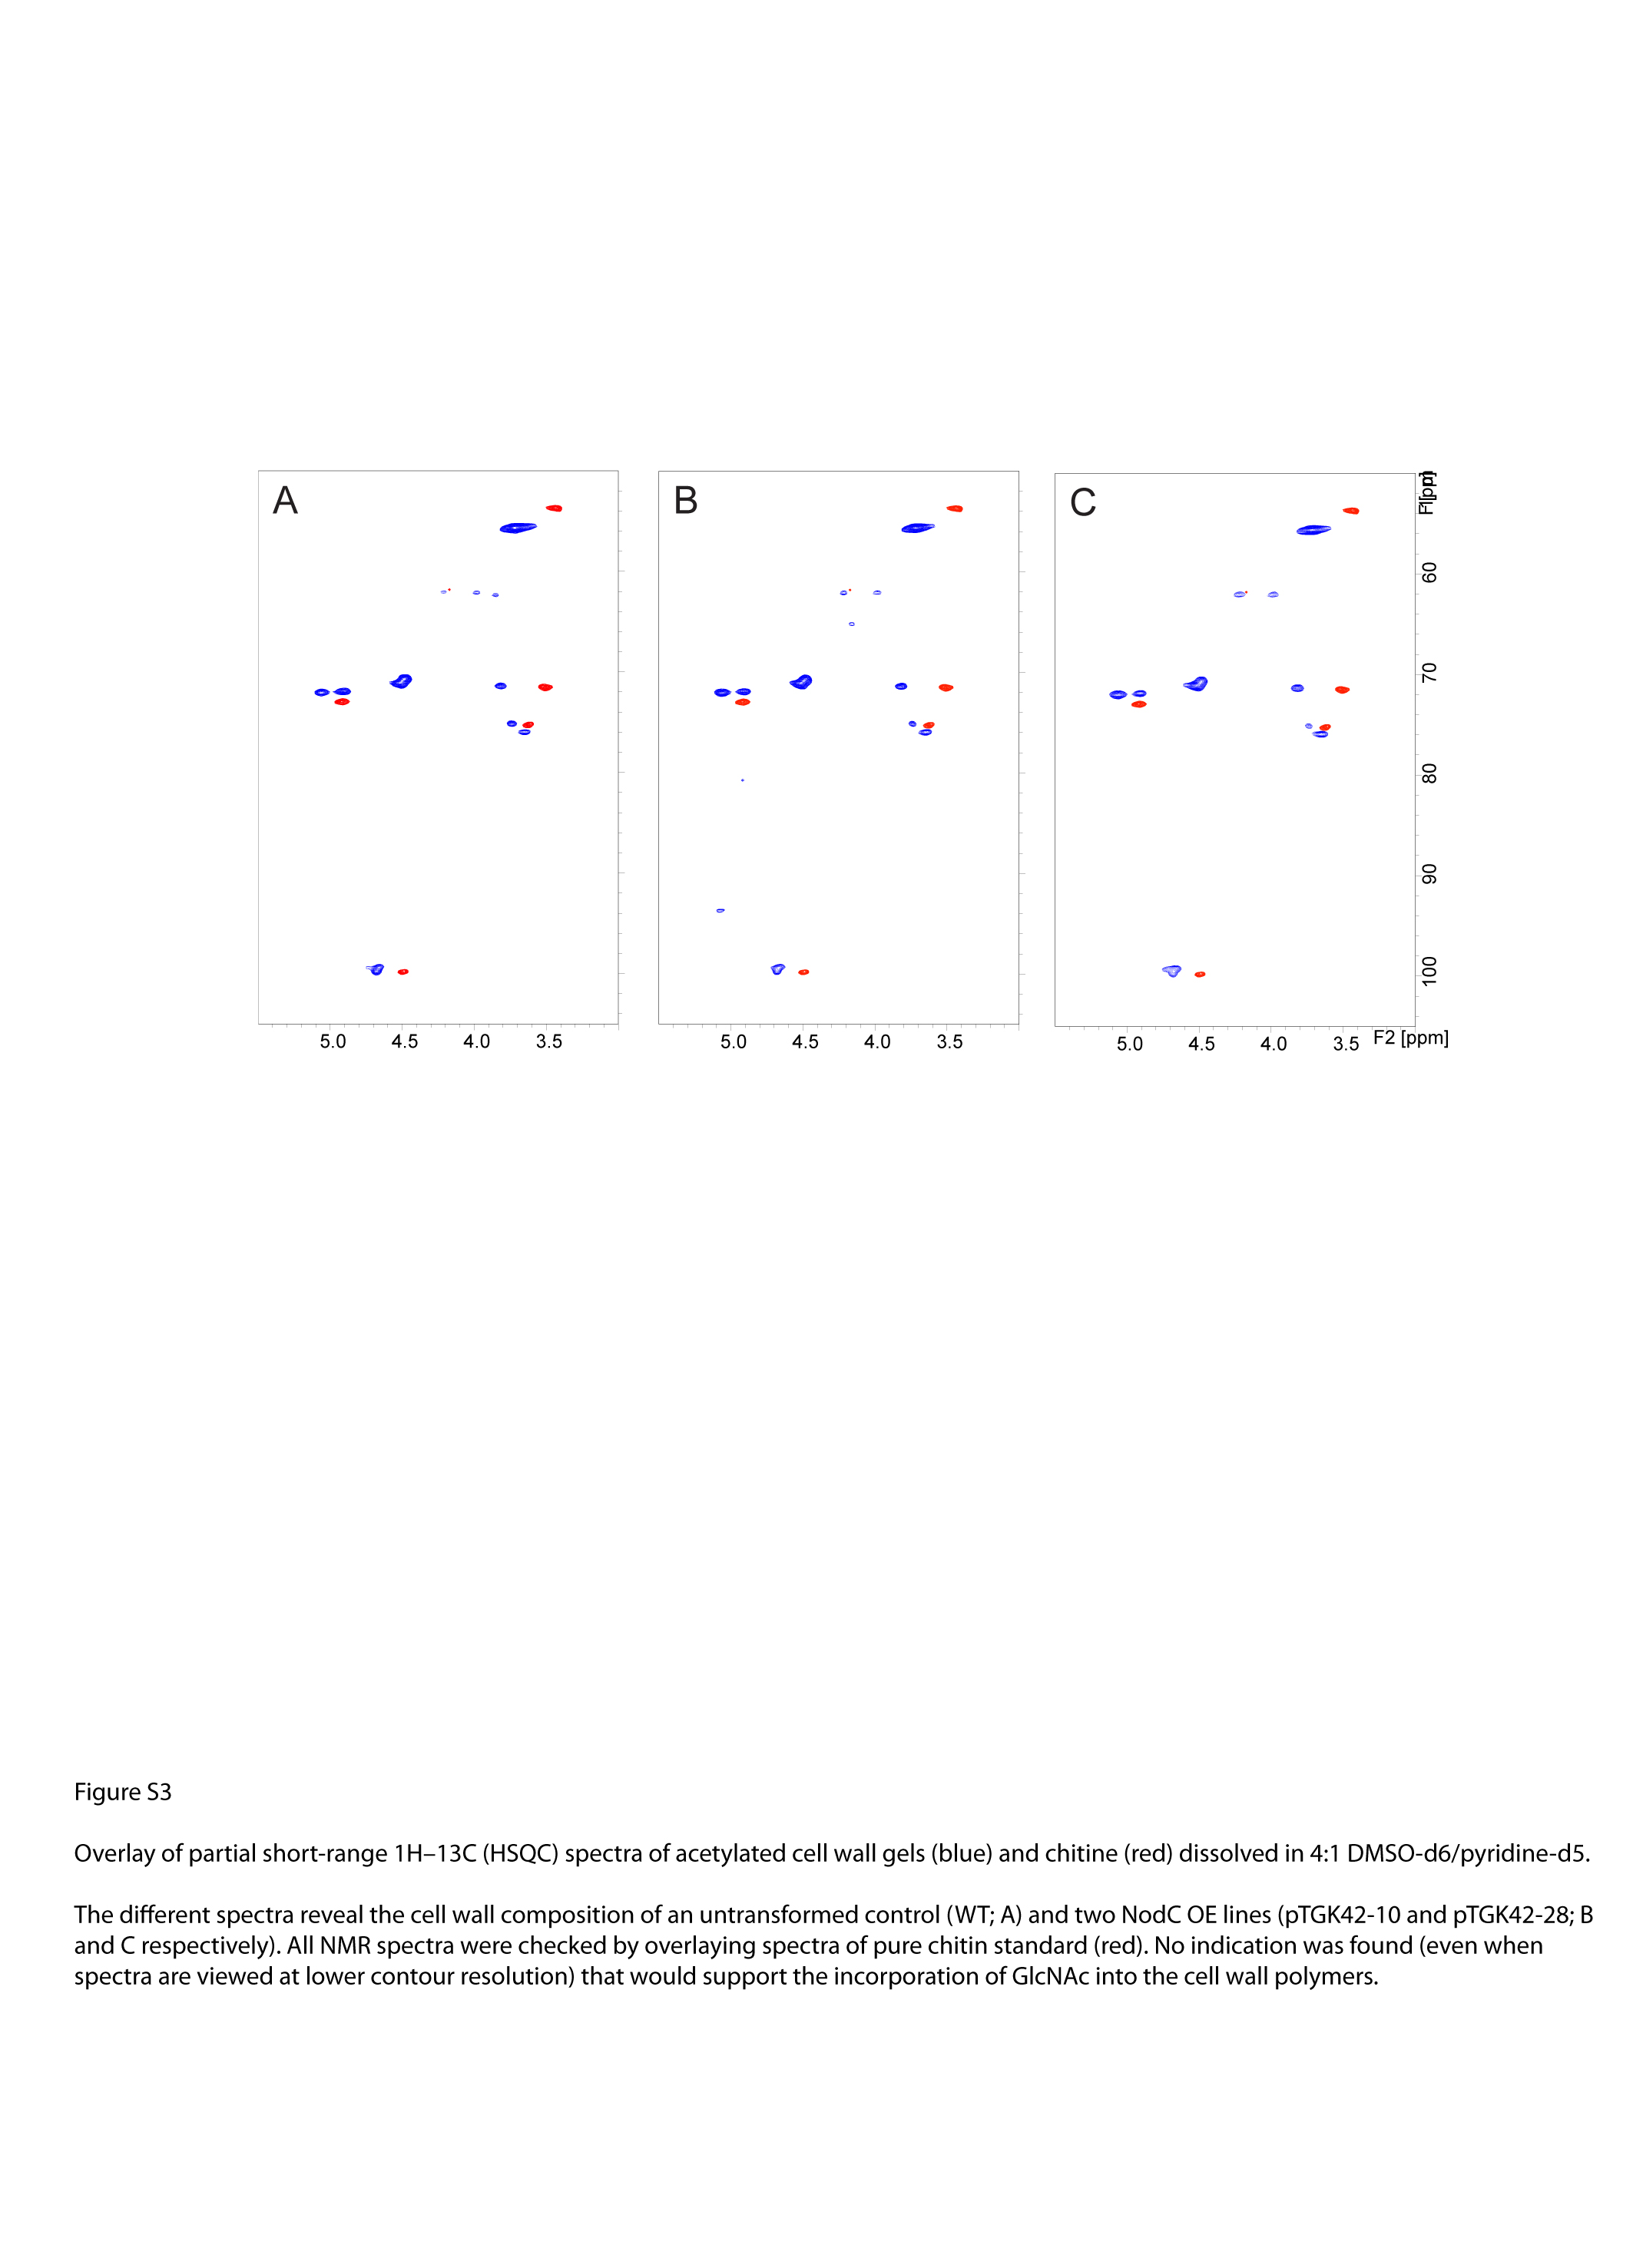
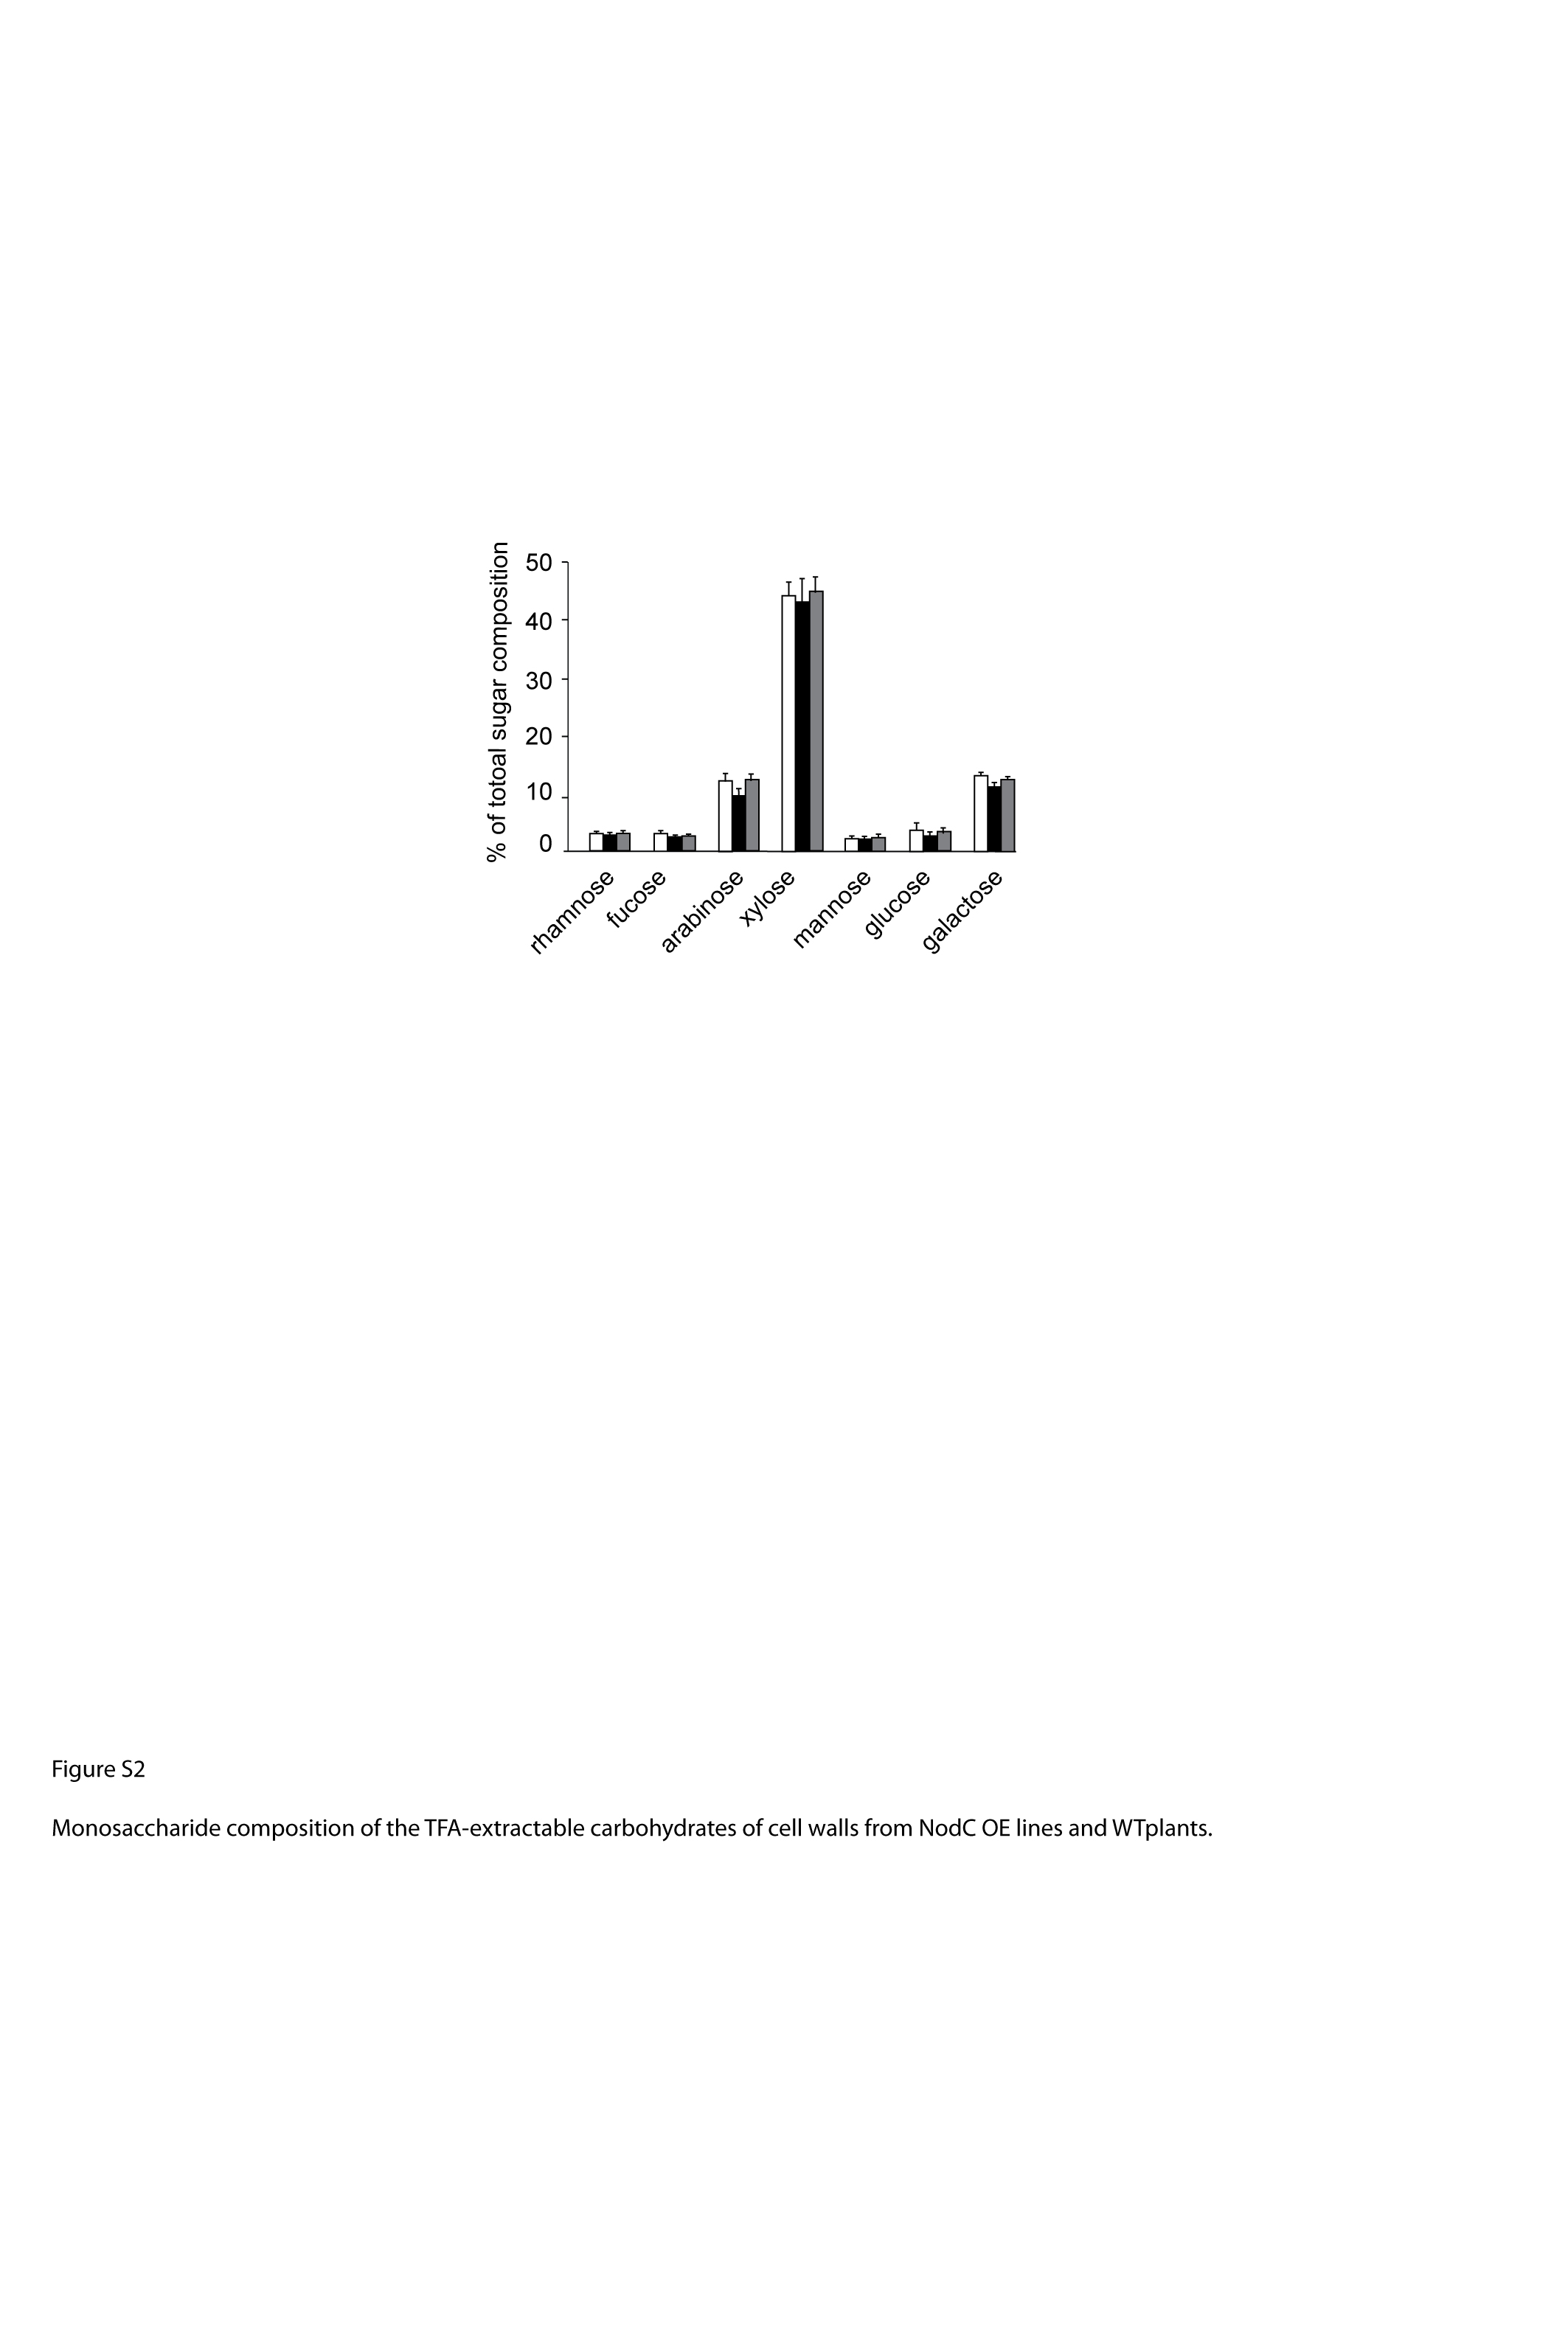