

1. Introduction
Based on its generally accessible I/II redox couple and bioavailability, copper plays a wide variety of roles in nature that mostly involve electron transfer (ET), O2 binding, activation and reduction, NO2− and N2O reduction and substrate activation. Copper sites that perform ET are the mononuclear blue Cu site that has a highly covalent CuII-S(Cys) bond and the binuclear CuA site that has a Cu2S(Cys)2 core with a Cu-Cu bond that keeps the site delocalized (Cu(1.5)2) in its oxidized state. In contrast to inorganic Cu complexes, these metalloprotein sites transfer electrons rapidly often over long distances, as has been previously reviewed.1–4 Blue Cu and CuA sites will only be considered here in their relation to intramolecular ET in multi-center enzymes. The focus of this review is on the Cu enzymes (Figure 1). Many are involved in O2 activation and reduction, which has mostly been thought to involve at least two electrons to overcome spin forbiddenness and the low potential of the one electron reduction to superoxide (Figure 2).5,6 Since the Cu(III) redox state has not been observed in biology, this requires either more than one Cu center or one copper and an additional redox active organic cofactor. The latter is formed in a biogenesis reaction of a residue (Tyr) that is also Cu catalyzed in the first turnover of the protein. Recently, however, there have been a number of enzymes suggested to utilize one Cu to activate O2 by 1e− reduction to form a Cu(II)-O2•− intermediate (an innersphere redox process) and it is important to understand the active site requirements to drive this reaction. The oxidases that catalyze the 4e−reduction of O2 to H2O are unique in that they effectively perform this reaction in one step indicating that the free energy barrier for the second two-electron reduction of the peroxide product of the first two-electron step is very low. In nature this requires either a trinuclear Cu cluster (in the multicopper oxidases) or a Cu/Tyr/Heme Fe cluster (in the cytochrome oxidases). The former accomplishes this with almost no overpotential maximizing its ability to oxidize substrates and its utility in biofuel cells, while the latter class of enzymes uses the excess energy to pump protons for ATP synthesis. In bacterial denitrification, a mononuclear Cu center catalyzes the 1e- reduction of nitrite to NO while a unique µ4S2−Cu4 cluster catalyzes the reduction of N2O to N2 and H2O, a 2e− process yet requiring 4Cu’s. Finally there are now several classes of enzymes that utilize an oxidized Cu(II) center to activate a covalently bound substrate to react with O2.
Figure 1.

Copper active sites in biology.
Figure 2.

Latimer Diagram for Oxygen Reduction at pH = 7.0 Adapted from References 5 and 6.
This review presents in depth discussions of all these classes of Cu enzymes and the correlations within and among these classes. For each class we review our present understanding of the enzymology, kinetics, geometric structures, electronic structures and the reaction mechanisms these have elucidated. While the emphasis here is on the enzymology, model studies have significantly contributed to our understanding of O2 activation by a number of Cu enzymes and are included in appropriate subsections of this review. In general we will consider how the covalency of a Cu(II)–substrate bond can activate the substrate for its spin forbidden reaction with O2, how in binuclear Cu enzymes the exchange coupling between Cu’s overcomes the spin forbiddenness of O2 binding and controls electron transfer to O2 to direct catalysis either to perform two e− electrophilic aromatic substitution or 1e− H-atom abstraction, the type of oxygen intermediate that is required for H-atom abstraction from the strong C-H bond of methane (104 kcal/mol) and how the trinuclear Cu cluster and the Cu/Tyr/Heme Fe cluster achieve their very low barriers for the reductive cleavage of the O-O bond.
Much of the insight available into these mechanisms in Cu biochemistry has come from the application of a wide range of spectroscopies and the correlation of spectroscopic results to electronic structure calculations. Thus we start with a tutorial on the different spectroscopic methods utilized to study mononuclear and multinuclear Cu enzymes and their correlations to different levels of electronic structure calculations.
2. Electronic Structure and Spectroscopy
2.1 Cu(I) sites
Cuprous complexes have a closed shell, 3d10, configuration and thus must be studied by methods involving either electron ionization or transitions into higher energy unoccupied valence orbitals. The former methods include photoelectron spectroscopy where a valence or core electron is ionized with a photon of known energy and the electron flux at a given kinetic energy is directly recorded7 (not useful for metalloproteins due to the approximately 10 Å escape depth of the emitted electron) and K-β emission where a core 1s electron is ionized and photon emission to fill the core hole is measured (see section 2.1.2). The latter method is X-ray absorption spectroscopy (XAS) at the Cu(I) K-edge where a 1s electron is excited into the Cu 4p levels. Since s→p transitions are electric dipole allowed, these produce intense absorption features that are sensitive to the Cu(I) ligand environment. XAS is commonly performed using synchrotron radiation emitted by electrons moving in an orbit at relativistic speeds. This has a continuous range of energies, providing wavelengths in the UV, soft X-ray, and hard X-ray regions and is polarized in the plane of the ring. Third generation synchrotron sources produce extremely intense beams (many orders of magnitude higher than conventional X-ray tubes, which only produce discrete energies). This has made it possible to perform XAS on samples as dilute as ~0.1 mM.
2.1.1 Cu(I) K-edge X-Ray Absorption Spectroscopy (XAS)
The Cu 1s→4p transition at approximately 8984 eV constitutes the lowest energy pre-edge region of the Cu(I) K-edge with reasonable intensity. From spectroscopic studies on structurally defined model complexes these transitions are sensitive to the coordination environment of the Cu(I) center.8 As shown in (Figure 3 left) a linear two coordinate (2C) ligand environment raises the energy of the Cu 4pz orbital resulting in a low energy 1s→4px,y set of transitions at 8984 eV. Addition of a third ligand splits this degeneracy resulting in the double peaked spectrum in (Figure 3 green). Thus both 2C and 3C Cu(I) sites have a low energy feature at 8984 eV but the intensity in this lower energy feature is greatly decreased in 3C sites. For a four coordinate approximately tetrahedral Cu(I) site, all three 4p levels interact with the ligand field (LF) and are destabilized to higher energy. Thus a feature at ~8984 eV in Cu K-edge XAS is characteristic of reduced Cu, its shape defines the coordination environment at the Cu(I) site and its intensity can be used to quantify the amount of reduced copper in a metalloprotein sample.
Figure 3.

(Left) Ligand field splitting of Cu(I) 4p orbitals as a function of site geometry. (Right) K-edge XAS of two-coordinate Cu(I) [Cu2(EDTB)](ClO4)2 (red), three-coordinate Cu(I) [Cu(L1-pr)](BF4) (green), and four-coordinate Cu(I) [Cu(py)4]ClO4 (blue). (Reprinted with permission from Ref. 8. Copyright 1987 American Chemical Society.)
2.1.2 K-β emission
X-ray emission spectroscopy at the K-edge involves using the synchrotron radiation to ionize a Cu 1s core electron and measuring the photon emission associated with an electron filling the hole. The K-α region between 8030–8050 eV involves a 2p→1s transition and is the most intense emission observed (dipole allowed) but it is not very sensitive to the chemical environment of the Cu. Alternatively, K-β emission is sensitive to oxidation state, spin state, ligand character, and coordination number. The K-β region (Figure 4 left) consists of the main peaks (K-β1,3 and K-β') between 8900–8910 eV involving a Cu 3p→1s transition and valence peaks (K-β" and K-β2,5) between 8960–8990 eV involving valence/ligand→1s transitions. Figure 4 right shows the K-β region of a 3d10 transition metal, Zn(II) (qualitatively similar to Cu(I) but at higher energy). The K-β' peak is missing in the spectra of d10 systems but is present for Cu(II) complexes at ~10 eV lower energy than the K-β1,3 emission and with less intensity.
Figure 4.

(Left) Schematic of Cu K-β emission. The ligand ns and np (where n=2,3 depending on ligand type) to metal 1s transitions occur via LMCT. L(np) and L(ns) = ligand p and s hole, respectively. (Right) XES of ZnO (a d10 system).
The K-β1,3 is the second strongest feature observed in an emission spectrum and is roughly 1/8th as intense as the K-α peak. It is an electric dipole allowed 3p→1s transition where the 1,3 refers to the spin-orbit splitting of the 3p, which is not resolved in the lineshape. In contrast to Cu(I) complexes, for Cu(II) complexes the hole in the 3d will exchange couple with the hole in the 3p resulting in the K-β' feature when both holes have the same spin.9 The final state with opposite spins in the 3p and 3d orbitals gives rise to the main K-β1,3 peak. In Cu(II) there can also be a ligand to metal charge transfer (LMCT) process that occurs due to the 3d relaxation associated with the increase in Zeff caused by the 1s core hole, resulting in the transfer of a ligand electron in to the 3d orbital. This new 1sd10L excited state is lower in energy than the 1sd9 excited state (the 1s and L are holes in the orbitals indicated). The 3p→1s transition associated with this final state can also lead to a K-β' feature, whereas the 3p→1s transition associated with the 1sd9 state leads to the main K-β1,3 peak. In Cu(II) complexes, weaker final states can also arise on the lower energy side of the K-β1,3 feature due to d electron excitations into the dx2-y2 hole (in the ground state). K-β valence peaks lie higher in energy at 8960–8990 eV (Figure 5) than the main β1,3 peaks at 8900–8910 eV and are ~100 times weaker than the main peaks. These transitions involve electrons from valence/ligand orbitals filling the metal 1s hole. The K-β valence region is divided into the K-β" (the so called crossover peak) and the K-β2,5 lines. The crossover peak is less intense and ~10–20 eV lower in energy than the K-β2,5 peak. The nomenclature of the K-β region originated from the spectroscopy of high Z materials, such as uranium. K-β2 was originally assigned to 4p→1s transitions and K-β5 to 3d→1s transitions. This nomenclature has been transferred to transition metals where an understanding of the dominant interactions and transitions in this energy region has made the nomenclature lose its original physical meaning. The K-β2,5 transitions are now known to originate from ligand np states (where n=2, 3, etc. depending on ligand type) mixing with metal p character giving these metal p→s electric dipole intensity. 9 The valence 3d→1s quadrupole allowed transitions are also in the same energy range but carry very little intensity. The K-β" peak at 8955–8970 eV are assigned as ligand ns (n=2, 3, etc.) to metal 1s transitions. The intensity of these transitions is also thought to originate from mixing of metal p character into the ligand ns orbital. The energies of these peaks correspond mainly to the ligand ns binding energies. The absolute and relative energies of the K-β" peak shifts to lower energies relative to the K-β2,5 peak with increase in ligand Zeff (from C to F) as shown for Zn complexes in Figure 6A.10 The intensity of these transitions depends on the number of ligands and the metal-ligand distance 11, thus providing complementary information to EXAFS (extended X-ray absorption fine structure). The K-β" crossover peaks are also sensitive to different protonation states and can be used to distinguish H2O from a OH− ligation as shown again for Zn complexes in Figure 6B.10 The energy positions of the crossover peak can thus give valuable information about the ligand environment.
Figure 5.

XES spectra showing the satellite region of d9 Cu(II) complexes.
Figure 6.

XES spectra showing the valence region of different d10 Zn2+ complexes. (A) Ligation to Zn is varied from C, O, to F. (B) Ligation to Zn is changed from H2O to OH−. (Used with permission from Ref. 10.)
2.2 Mononuclear Cu(II) sites
2.2.1 Ligand Field Theory (LFT)
While there is now much interest in Density Functional Theory (DFT) in modern physical-inorganic chemistry (see section 2.5) it must be emphasized that LFT still provides the most accurate correlation to spectroscopic data involving transitions of electrons between d-orbitals. In an octahedral LF, the five 3d orbitals split into a three fold degenerate t2g and a two fold degenerate eg set at higher energy. This splitting is given by 10Dq, the spectroscopic parameter of LFT (D relates to the ligand electrostatic charge distribution and q the radial integral over the d-orbitals). Cu(II) has a 3d9 configuration that results in a 2Eg ground state Figure 7A. This is orbitally degenerate leading to a Jahn-Teller distortion that lowers the symmetry of the complex, splits the orbital degeneracy and lowers the total energy of the system. Generally this leads to a tetragonal distortion, i.e. elongation along z and contraction in the x,y plane, and a limiting square planar structure. A key feature of LFT is that the energy splitting of the d-orbitals is sensitive to the ligand environment at the metal center. For the square planar limit this leads to the splitting pattern of Figure 7A center, where the highest energy half occupied orbital is dx2-y2 as its lobes are oriented along the ligand-metal bonds and thus has the largest repulsion (i.e. antibonding) interaction with the ligands. A structural coordinate that has been important in Cu(II) (bio)inorganic chemistry is the distortion from square planar to a D2d distorted tetrahedral structure.12 This involves raising two trans ligands above and two trans ligands below the molecular plane. Note that in the tetrahedral limit (Figure 7A right) the complex would have a 2T2 ground state which is again degenerate and unstable to a Jahn-Teller distortion to the D2d structure. In the D2d distorted tetrahedral site the ground state is still the half occupied dx2-y2 orbital (often referred to as dxy when the coordinate system is oriented such that the x,y axes are along the perpendicular C2’s of the D2d structure). Note from Figure 7A that the energy splitting of the d orbitals in the D2d structure is much reduced relative to that of the square planar structure. This reflects the fact that 10Dq of an approximately tetrahedral structure is −4/9 the 10Dq of an octahedral (or related square planar) structure. We finally note that in square planar structures the dz2 level is often lower in energy than predicted by LFT.13 This reflects the fact that the metal 4s mixes with the 3dz2 level in planar structures, an interaction not directly included in LFT but present in molecular orbital theory (section 2.5)
Figure 7.

Ligand Field Splitting of the d manifold. A. Octahedral to square planar to tetrahedral. B. Square pyramidal to trigonal byparimidal. Rearrangements through Berry pseudorotation (C2v) and associated ligand displacement (Cs) coordinates.
A second coordinate in Cu(II) (bio)inorganic chemistry should also be considered. Five coordinate (5C) sites can be described as located along the square pyramidal to trigonal bipyramidal coordinate in Figure 7B. This idealized C4v to D3h correlation can be achieved either through a C2v distortion (top; i.e. the Berry pseudo-rotation) or a Cs distortion (Figure 7B bottom), the latter being relevant to square planar associative ligand displacement reactions where a ligand binds axially and rotates into the plane to displace an equatorial ligand.14 Note that the square pyramidal structure has a half occupied dx2-y2 orbital and similar d orbital splittings as in the square planar structure but the fifth, axial ligand shifts the Cu out of the equatorial plane. This increases the LF along the z axis (and decreases the dz2/4s mixing) and decreases the LF in the equatorial plane. The net effect is that dz2 is no longer the lowest energy level in the square pyramidal structure. Distortion to a trigonal byparamidal structure changes the d orbital splitting and results in a new half occupied dz2 ground state. Note that this involves a change of coordinate system where the C3 z axis is now perpendicular to the C4 z axis of the square pyramidal structure. (In the original coordinate system the ground state is 3/4 dx2-y2 + 1/4 dz2). These ligand field energy splittings of the d-orbitals determine the ground state and low lying LF excited state spectral features of Cu(II) sites.
2.2.2 Cu(II) Ground States
2.2.2.1 Electron Paramagnetic Resonance (EPR) g and AM values
The unpaired electron in the half occupied d orbital has STOT = ½, MS = ±1/2, thus a doublet ground state. This MS = ±1/2 spin degeneracy splits in a magnetic field (H) by gβH (the Zeeman effect, β is the Bohr magneton that converts an angular momentum into a magnetic moment), leading to the EPR spectrum that gives the g value characteristic of the ground state.
In the EPR experiment (Figure 8) a fixed energy microwave source is used (X band ~ 9GHz) and the magnetic field is varied until the resonance condition, gβH = hν (the microwave energy), is satisfied and microwave photons are absorbed. Thus for a known source energy, the magnetic field at which the microwaves are absorbed gives the experimental g value (g = hν/βH = 0.71448hν(MHz)/H(Gauss)). The g values of a Cu(II) complex are generally anisotropic, i.e. dependent on the orientation of the z axis of the complex relative to the applied magnetic field. A frozen solution of a Cu(II) complex will have all orientations relative to the fixed magnetic field direction, and the microwave absorption will spread from H1 (Figure 9 top) for complexes with H parallel z to H2 (for H perpendicular z). Thus the EPR absorption signal can spread over hundreds of Gauss with intensity increasing towards H2 due to the greater number of molecules with z perpendicular to H. The EPR signal is modulated to increase sensitivity leading to a first derivative spectrum (Figure 9 middle) with features at the turning points, i.e. a peak at the magnetic field associated with g∥ (i.e. the z axis of the complex parallel to H) and an intense derivative shaped feature at g⊥ (i.e. the g value for the Zeeman splitting of the ground doublet with the z axis of the complex perpendicular to the magnetic field). Finally, Cu has a nuclear spin (I) of 3/2 which couples to the electron spin to produce a hyperfine splitting of the spectrum into 2I+1 = 4 hyperfine lines split by the metal hyperfine coupling constant AM, which can also be anisotropic (AM∥ for the z axis of the complex parallel to the magnetic field, AM⊥ for the z axis perpendicular to the field). From Figure 9 bottom | AM∥| > | AM⊥| and the latter is often not resolved in the EPR spectrum. Note that only the magnitude of AM is measured in the EPR spectrum; generally A∥ is negative due to the physical origin of the hyperfine coupling (see below). Thus we experimentally derive gi and of a metal site by EPR spectroscopy and interpret these experimental parameters in terms of LFT.
Figure 8.

Zeeman effect on an S=1/2, MS =±1/2 system. The degenerate MS values split in a magnetic field by gβHMS. This splitting equals the microwave energy hν, at a magnetic field where microwave absorption occurs.
Figure 9.

(top) A frozen solution EPR spectrum gives a powder pattern with all orientations (g||(H1)→g⊥(H2)) weighted by the number of molecules with specific orientations. Thus the intensity increases towards the field associated with the perpendicular direction. (middle) The EPR spectrum is taken as the first derivative to enhance sensitivity. (bottom) Anisotropic hyperfine coupling of the electron spin to the Cu nucleus spin I=3/2.
In contrast to organic radicals, metal complexes often have g values that deviate greatly from the free electron value of 2.0023. This derives from the fact that transition metal ions have large spin orbit coupling (SOC) constants; for Cu(II) λ3d = −830cm−1 while for N and O radicals this value is approximately −70cm−1. This large SOC mixes the LF excited states described in section 2.2.1 into the ground state and leads to the large deviations of the g values from 2.00 observed experimentally. The expression describing the SO contribution to the g values is15:
| [1] |
where ψ0 is the ground state, ψn’s the excited states at LF energies, En-E0, above the ground state (section 2.2.1) and the values for the effects of the orbital angular momentum operator Li (i = x,y,z directions of the molecule relative to the magnetic field) on electrons in the d-orbitals are given in table 1. The in equation 1 are the Steven’s orbital reduction factors16 that account for the fact that the d-orbitals have ligand character due to covalent bonding and this decreases the magnitude of the orbital angular momentum (and SOC) over electrons in the d-orbitals. Thus k2 < 1 due to covalency and can be calculated from the coefficients of molecular orbitals as described in reference 17. Note from equation 1, the observed g values directly reflect the nature of the ground state thus ligand environment. For a dx2-y2/dxy ground state (Figure 7B left) g∥>g⊥> 2.00 while for a dz2 ground state (Figure 7B right) g⊥>g∥=2.00.
Table 1.
Effect of the Li (i =x,y,z) operator on the real d functions
| L̂xdxy = −idxy | L̂zdxz = idyz | |||
| L̂ydyz = idxy | L̂zdyz = idxz | |||
| L̂xdxy = idxz | L̂ydxy = −idyz | L̂zdxy = −2idx2−y2 | ||
| L̂xdx2−y2 = −idyz | L̂ydx2−y2 = −idxz | L̂zdx2−y2 = 2idxy | ||
| L̂zdz2 = 0 |
The metal hyperfine couplings are also dependent on the nature of the ground state and its covalency. Those for a dx2-y2/dxy ground state are given in equation 2.18,19
| [2] |
The first term in equation 2 is the Fermi Contact interaction of the electron spin with the nuclear spin at the nucleus. As only s orbitals can have electron spin density at the nucleus, for electrons in d-orbitals this involves their spin polarization of electron pairs in the ns, n = 1,2,3 orbitals such that there is a net negative spin density at the nucleus. The Fermi Contact term is isotropic, thus contributes equally in all directions. The second, spin dipolar, term involves the dipole interaction of the electron spin, averaged over the shape of the half occupied d orbital, with the nucleus spin on the metal. For an electron spin in a dx2-y2 orbital, the A∥ spin dipolar term is also negative and large. It is purely anisotropic thus sums to zero over the three molecular directions, (i.e. A⊥ = −1/2A∥). The third term involves the magnetic dipole interaction of the orbital angular momentum, obtained from SOC to LF excited states as described above, with the Cu nuclear spin and thus can be estimated from the g value deviations from 2.00. Finally as the electron spin is delocalized onto the ligands due to covalency, its interaction with the nuclear spin on the Cu decreases. In equation 2 this is given by , the amount of metal character in the half occupied dx2-y2/dxy orbital which decreases from 1.0 as the covalency increases, and the fact that experimental g values are used in equation 2 which have in equation 1 to account for covalency.
2.2.2.2 Superhyperfine coupling
As covalency delocalizes the electron spin onto the ligands it can couple to the ligand nuclear spin IL and further split each hyperfine line in Figure 9 bottom into 2IL+1 components. This superhyperfine splitting AiLi = x,y,z is anisotropic and a direct measure of the amount of that ligand valence orbital contained in the half occupied “d” orbital, i.e. the covalency of this bond. As shown in Figure 10 the covalent mixing of ligand i character into a half occupied d orbital delocalizes the electron spin into a hybrid valence orbital on that ligand, where the hybrid has n s and ligand orbital character. The s character gives an isotropic Fermi contact contribution to the superhyperfine coupling of the nuclear spin ILi to the electron spin, while the ligand p character in the hybrid produces an anisotropic spin-dipolar contribution. The net effect of these considerations gives the superhyperfine coupling in equation 3,
| [3] |
where the values for the Fermi contact and spin dipolar interactions of one electron spin in a biologically relevant ligand valence orbital with the nuclear spin on that ligand is given in table 2.20 Thus by experimentally measuring the superhyperfine coupling constants AiLi (i = x,y,z) one can obtain the covalency of that ligand and its hybridization (n2) involved in bonding to the metal ion.
Figure 10.

Delocalization of the electron spin onto the ligand Li by an amount . The ligand valence orbital is a hybrid with s and pz character.
Table 2.
Biologically relevant nuclear spins, g values and hyperfine interactions with electron spin20
| Ligand | Ia | Natural Abundance(%) | gNb | ALi(iso)(gauss) | A‖ (aniso)Li(gauss) |
|---|---|---|---|---|---|
| 1H | ½ | 99.9844 | 5.58536 | 508 | - |
| 2H | 1 | 0.0156 | 0.857386 | 78 | - |
| 13C | ½ | 1.108 | 1.40440 | 1119 | 63.8 |
| 14N | 1 | 99.635 | 0.40358 | 557 | 33.5 |
| 15N | ½ | 0.365 | −0.56608 | −781 | −46.6 |
| 17O | 5/2 | 0.037 | −0.75720 | −1659 | −102 |
| 33S | 3/2 | 0.74 | 0.42849 | 975 | 56.6 |
| 35Cl | 3/2 | 75.4 | 0.54727 | 1672 | 102 |
| 37Cl | 3/2 | 24.6 | 0.45553 | 1391 | 84.8 |
Nuclear spin is in multiples of h/2π
gN is in multiples of (e/2Mc)
This superhyperfine coupling is generally very small and often not resolvable in the standard EPR experiment at X-band. However it can be obtained by double resonance and pulsed EPR experiments. In electron-nuclear double resonance (ENDOR) the EPR signal is used to probe NMR transitions on directly coordinated ligand nuclei.21–23 Thus in addition to the electron Zeeman effect, the ENDOR spectrum also involves the nuclear Zeeman effect (gNβNH), the ligand hyperfine coupling to the electron spin and a quadrupole term if the ligand nuclear spin is greater than or equal to 1. For protons, where the nuclear Zeeman is large relative to the hyperfine coupling, as shown in Figure 11 left, two ENDOR peaks are observed centered at the proton Larmor frequency (~14MHz in X band) split by the hyperfine coupling; while for other nuclei (e.g. N) where the nuclear Zeeman is small, transitions are centered at A/2 and split by twice the nuclear Zeeman effect (~1MHz for N at X band) with a small additional splitting due to the quadrupole coupling (2P in Figure 11 right). Note that the ENDOR spectrum can be taken at different fields associated with different EPR g values, thus providing the anisotropic components of the ligand superhyperfine coupling. Note also that the z axis of the superhyperfine is often not along the molecular z axis but rather the z axis of the ligand p orbital involved in covalent bonding to the half occupied d orbital in Figure 10.
Figure 11.

ENDOR experiment for an S=1/2, MS = ±1/2 metal site. Left, Levels for protons (I =1/2, nuclear Zeeman large related to metal-ligand hyperfine) and Right, levels for other nuclei (in particular N, I = 1, nuclear Zeeman smaller than metal-ligand hyperfine coupling).
Finally for very small superhyperfine couplings (as, for example, the non-coordinated N of a Histidine ligand), electron spin echo envelope modulation (ESSEM) spectroscopy is used.24–29 An intense microwave pulse sequence is applied to obtain an electron spin echo whose decay is modulated by weak electron spin coupling to remote nuclear spins. The Fourier Transformation (FT) of the modulation in Figure 12 top produces an ENDOR like spectrum in the 0–5 MHz region in Figure 12 bottom. As shown in Figure 12 bottom for the remote N of a His ligand to a Cu(II) site, two dominant features are observed in the FT of the ESEEM spectrum (ν− and ν+). For the remote N of a His ligand, the hyperfine coupling is small enough that it just cancels the nuclear Zeeman splitting and the resultant signal observed directly reflects the quadrupole splitting of the remote N nuclear spin (IN = 1) caused by the electric field gradient of its chemical environment (equation. 4),
| [4] |
where e2Qq is the quadrupole coupling constant (Q the nuclear quadrupole moment, q the electric field gradient) and η is the asymmetry parameter (i.e.for x≠y). Thus ESSEM spectroscopy can provide chemical insight into weak interactions such as H-bonding or deprotonation of a coordinated His ligand.
Figure 12.

The ESEEM spectrum: (top) Modulated decay of the spin echo and (bottom) The Fourier Transform of the modulation.25,26
2.2.3 Ligand Field Excited States
Near IR/Visible photons excite d electrons into the half occupied d orbital in the LF energy level diagrams in section 2.2.1 and Figure 7. These transitions thus directly probe the ligand environment around the Cu(II) site. However these d→d or LF transitions are parity forbidden, therefore weak in the absorption spectrum. This intensity is given by the oscillator strength, f, associated with the electric dipole transition moment between the ground and excited state (g and e, respectively in equation 5)
| [5] |
LF transitions generally have molar extinction coefficients ε < 100 M−1 cm−1 and can be difficult to observe in metalloprotein absorption spectra. Alternatively due to different selection rules, d→d transitions can be intense in Circular Dichroism (CD) and Low Temperature Magnetic Circular Dichroism (MCD) spectra. The intensity in a CD spectrum is given by the rotational strength, R, which is proportional to the projection of the electric dipole transition moment between the ground and excited state into the magnetic dipole moment (Mi, i = x,y,z) for this transition (equation 6).30
| [6] |
Comparing equations 5 and 6, transitions that are intense in the CD spectrum relative to the corresponding absorption spectrum are generally magnetic dipole allowed (and have a nonzero projection into the electric dipole transition moment which can only occur in a chiral environment). The magnetic dipole operator corresponds to a rotation of an electron from one orbital to another, thus d→d transitions are generally magnetic dipole allowed and relatively intense in CD spectra.
The “C-term” selection rule for low temperature MCD intensity of paramagnetic systems is given by equation 7.31–35
| [7] |
Thus, two perpendicular electric dipole transition moments are required for a transition to a given excited state to absorb circular polarized light in a longitudinal magnetic field. Active sites in Cu(II) proteins are generally of low symmetry thus all electronic states are nondegenerate and electronic transitions are uni-directional. Low temperature MCD intensity thus requires SOC between excited states that are perpendicular in polarization. As indicated above, the SOC of a transition metal ion is much larger than that of a ligand. Therefore bands that are intense in the MCD relative to the corresponding absorption spectrum (known as the C/D ratio) are metal centered LF transitions.36 As a rule for Cu(II) sites, LF transitions have C/D > 0.1. It should be noted that SOC over all excited states leads to the sum rule where the MCD intensity in left and right circular polarization tend to be equal and sum to zero over spin orbit coupled excited states.37 Deviations from the sum rule (i.e. dominant intensity in one circular polarization) reflects spin orbit coupling of a low lying LF excited state into the ground state.
2.2.4 Charge Transfer Excited States
At higher energy than the LF transitions are the LMCT transitions. These involve excitation of electrons from filled ligand valence orbitals into the d hole on the Cu(II). Thus these transitions involve a large change in electron density. These are electric dipole allowed and can be intense in the absorption spectrum and provide a direct probe of the ligand valence orbitals involved in bonding. In bioinorganic chemistry we are mostly interested in donor bonding interactions. All ligands will have a lone pair available for σ donor bonding to the metal, and those that have additional electron pairs available can also π donor bond to the metal center. Since σ donor bonding is stronger than π donor bonding due to better directional overlap, the σ valence orbital on the ligand will be at more negative energy than the π donor orbitals (Figure 13, HM-L is the resonance integral of the molecular Hamiltonian over the metal and ligand valence orbitals and thus proportional to their overlap). The intensity of a charge transfer (CT) transition is proportional to the overlap of the donor and acceptor orbitals involved in the CT excitation. Thus from Figure 13 the π CT will be at lower energy and relatively weak in absorption, while the σ CT transition will produce a higher energy, intense feature in the absorption spectrum. The stronger the donor bonding interaction of the ligand with the metal the more intense the CT transition.
Figure 13.

The differences in σ and π overlap between the ligand and the copper valence orbitals leads to low energy weak π and higher energy intense σ charge transfer transitions.
From molecular orbital theory bonding is dominated by ligand and metal valence orbitals that are close in energy and have good overlap. Thus ligands that produce low energy intense CT absorption features form highly covalent bonds with the metal center.38 In copper bioinorganic chemistry these are generally the oxygen intermediates, where as described in section 3 their highly covalent bonding activates selective reactivity in biological function. Other highly covalent L-M bonds in Cu biochemistry (i.e. active sites that exhibit low energy, intense CT absorption features) are the sulfide bridge in nitrous oxide reductase (N2OR) (Section 5.0), the cysteine crosslinked phenolate ligand radical in Galactose Oxidase (Section 3.4), the phenolate ligand in pre-processed amine oxidase and the thiolate ligand in blue Cu, CuA and in preprocessed Cu(II) Galactose Oxidase.
In Resonance Raman (rR) spectroscopy a Laser is tuned into an intense absorption band (i.e. a CT transition) and vibrations associated with the chromophore (i.e. the active site in the protein and the specific L-M bond associated with the charge transfer) become greatly enhanced in Raman scattering intensity as illustrated from by the data in Figure 1439. In Cu bioinorganic chemistry this generally involves an “Albright” A-term intensity enhancement mechanism.40 A-term rR intensity reflects excited state distortions. The CT transition of ligand L involves excitation of an electron from a L-M bonding donor orbital mostly on the ligand into an L-M antibonding acceptor orbital mostly on the metal. Therefore the L-M bond associated with the CT transition probed by rR spectroscopy will elongate and its associated L-M stretching vibration will be greatly resonance enhanced. Other active site L-M bonds can also be enhanced (but with less intensity) as the Cu d acceptor orbital is generally antibonding to all equatorial ligands. Other intraligand and bending modes may also be observed in rR spectroscopy dependent on how the bonding changes in the CT excited state being probed by rR relative to the ground state.
Figure 14.

Resonance Raman spectroscopy: Excitation energy dependence of resonance intensity gives the excitation profile. (Reprinted with permission from Ref. 39)
2.2.5. XAS K-edge
An open shell Cu K-edge typically consists of two distinct spectroscopic features—the pre-edge and the shakedown as shown in Figure 15. The lowest energy pre-edge transition is the 1s→3d transition that can be used to distinguish between Cu(II) and Cu(III) higher redox states. The Cu(II) pre-edge is around 8979 eV (Figure 15 inset). Cu(III) has a Zeff and contracted ligand field that results in a higher pre-edge energy of approximately 8981 eV (Figure 15 inset). The edge is also shifted to higher energies in Cu(III) compared to Cu(II). Thus the pre-edge position can be used to differentiate between Cu(II)2 side-on peroxo and Cu(III)2 bis-µ-oxo complexes and quantitate the amount of each component present.41,42
Figure 15.

Cu K-edge spectra of CuII (black line) and CuIII (blue line) model complexes. The inset amplifies the pre-edge region.
2.2.5.1 Pre-edge transition
The K-pre-edge 1s→3d transition has low intensity because it is electric dipole forbidden. In centrosymmetric complexes, such as in D4h [CuCl4]2− that have no 3d/4p mixing, the pre-edge transition (at 8979 eV) gains intensity mostly through the electric quadrupole operator (Figure 16 left black).43 Blue Cu on the other hand has a tetrahedrally distorted site, and a higher pre-edge intensity owing to some 4p mixing into the 3d orbital (Figure 16 left inset red). This 4p mixing into the 3d orbital while small has a substantial impact on the intensity of the preedge because an electric dipole transition is ~2 orders of magnitude stronger than an electric quadrupole transition in this energy region. From polarized single crystal XAS the origin of the pre-edge intensity in blue Cu has been shown to be from Cu 4px,y mixing into the 3dx2-y2 ground state as seen in the xy-polarized K-edge (Figure 16 right).43 No pre-edge intensity is observed in the z-polarized spectrum showing that the 4pz orbital does not mix into the 3dx2-y2 ground state in blue Cu. Thus, the pre-edge intensity in an important spectroscopic probe of 3d-4p mixing that is allowed by ligand field theory.
Figure 16.

(Left) Orientation averaged Cu K-edge spectra of D4h CuCl42− and plastocyanin. Insets show the expanded pre-edge region.(Right) Polarized Cu K-edge spectra of plastocyanin. Inset shows the expanded pre-edge region. (Reprinted with permission from Ref. 43. Copyright 1993 American Chemical Society.)
The 3d/4p mixing is indirect and occurs by overlap of both the 3d and 4p metal orbitals with the same ligand based valence orbital.44 This mechanism of mixing can be described using the configuration interaction (CI) model given below (equation 8):
| [8] |
The T1 and T2 terms give the bonding interaction between the ligand p and metal d and between ligand p and metal p orbitals, respectively. Δ1 and Δ2 are the energy difference between the ligand 3p and metal 3d configuration and between ligand 3p and metal 4p configuration, respectively. Solving this determinant shows that there is some metal p mixing into the ground state d wavefunction as both overlap the same ligand p orbital. The K-pre-edge intensity thus provides a direct probe of the metal 3d-4p mixing and an indirect probe of the metal-ligand bonding.
2.2.5.2 Shakedown transition
The K-edges of Cu(II) and Cu(III) systems commonly contain a transition between 8986–8988 eV that is described as a shakedown transition (Figure 15). In systems with more covalent interactions with the ligands, this feature appears to the lower end of this range. The shakedown transition is a two electron process that results from a 1s→4p electric dipole-allowed transition. The 1s core hole created results in relaxation of the Cu valence orbitals to lower binding energies. For Cu this relaxation of the 3d orbitals is large enough to cause a transfer of a second electron from the ligand valence to the metal 3d orbital (an LMCT process). The sudden approximation formalism can be used to quantify the intensity of this shakedown (1s→4p + LMCT) feature as a percentage of the total 1s→4p transition intensity.43 The main-to-shakedown peak intensity ratio (Im/Is) is given by equation 9:
| [9] |
with tan 2θ′ = 2T/(Δ-Q) and tan 2θ = 2T/Δ, where T = <Ψ (3d9)|H|Ψ(3d10L)> is the interaction matrix element between the configurations contributing to the ground state wave functions, and Δ is the energy difference between the two configurations in the ground state as shown in Figure 17A. Q accounts for the increase in the effective nuclear charge (Zeff) felt by the 3d9 configuration upon creation of the c3d9 configuration (where c denotes a core orbital hole) (Figure 17B). Thus, the change in wavefunction θ′ - θ upon creation of the 1s core hole determines the main-to-shakedown peak intensity ratio. Using this configuration interaction formalism, the shakedown transition intensity in a D2d [CuCl4]2− system was calculated to be 59% of the total 1s→4p transition intensity, similar to that obtained from fitting the z-polarized XAS spectrum (~60%) (Figure 18).
Figure 17.

Configuration interaction formalism for the Cu K-edge near-edge analysis. A) Ground-state wave functions determined by T and Δ parameters. B) Final-state wave functions with the 1s→4p + LMCT shakedown final-state (Ψs) separated from the main 1s→4p final-state (Ψm) by the splitting W.
Figure 18.

Z-polarized Cu K-edge spectra of D2d CuCl42−. Data (—) and fit (····). The intensity of the main transition is not well established due to the rising-edge background. (Reprinted with permission from Ref. 43. Copyright 1993 American Chemical Society.)
2.2.6. XAS L-edge
The Cu L-edge spectrum results from a metal 2p→3d electric dipole-allowed transition and consists of the L3 (2p3/2→3d) and L2 (2p1/2→3d) edges separated by ~20 eV due to 2p spin-orbit coupling. The L3 to L2 intensity ratio is ~2:1 due to the 4:2 degeneracy of the 2p3/2 and 2p1/2 states. For typical Cu(II) complexes, the L3-edge occurs at ~930 eV, whereas the L2-edge occurs at ~950 eV and is ~1.5 times broader from an additional Coster-Kronig auger decay channel of this excited state. For Cu(III) complexes, the L3- and the L2-edges are ~1.5–3 eV higher compared to those observed for Cu(II). The 2p→4s transition is Δl = −1 and is thus, ~20–30 times lower in intensity than the Δl = +1 (p→d) transition. Multiplet and shakeup effects, which usually lead to a redistribution of the intensity of the L3 and L2 peaks do not contribute to the L-edge spectra of 3d9 complexes.
The total area under the L3- and L2-peaks reflects the extent of metal-ligand covalency. As the unoccupied Cu 3d orbital mixes with filled ligand orbitals, the intensity of the L-edge transition decreases because of the metal localized nature of the Cu 2p→ψ*β-LUMO transition. The ground state wavefunction (ψ*β-LUMO) of a d9 Cu complex can be expressed as equation 10:
| [10] |
where, 1 – β2 and β2 correspond to the Cu 3d and ligand np character, respectively. By comparing the total area under the L-edge spectra to that of D4h [CuCl4]2− (a system that has been studied by a wide energy range of spectroscopies, and found to have 61 ± 4% Cu character in the ψ*β-LUMO), we can get a quantitative estimate of the amount of Cu character in the ground state wavefunction of other Cu complexes.45 An important example of the use of L-edge intensity to quantify covalency is for the blue Cu site in Figure 19. Its L3-edge has 0.67 times the intensity of square planar CuCl42−. D4h [CuCl4]2− has 61% Cu dx2-y2 character in its ground state. Thus, the blue Cu site in plastocyanin has only 41% Cu d character reflecting a highly covalent ground state wavefunction, which is important in its function of long-range electron transfer.
Figure 19.

Cu L3-edge XAS spectra for D4h-CuCl42− and plastocyanin. Values listed are the amount of Cu d character in the half occupied HOMO. (Reprinted with permission from Ref. 45. Copyright 1993 American Chemical Society.)
2.2.7. XMCD
X-ray magnetic circular dichroism (XMCD) combines L-edge XAS with MCD. The XMCD signal is the difference in the L-edge spectra obtained with right and left circularly polarized light in the presence of an external magnetic field. The low temperature (<1 K) XMCD signal at the L-edge of plastocyanin (S = 1/2 mononuclear blue Cu center) is shown in Figure 20A.46 The XMCD intensity at the L3 edge is seen to be negative. It is interesting to compare the negative XMCD L3 intensity for the mononuclear blue Cu site with the signal for the Cu in [(F8TPP)FeIII-O-CuII(TMPA)](ClO4) which is positive (Figure 20B).47 The binuclear complex (shown in Figure 20 C) has an Fe(III) (S = 5/2) antiferromagnetically coupled to the Cu(II) (S = 1/2) to produce an S = 2 ground-state. This S = 2 spin vector aligns with the magnetic field and thus produces a field of opposite sign at the Cu due to the Cu(II) S = 1/2 antiferromagnetic coupling to the high spin S = 5/2 Fe(III). The opposite sign of the XMCD signal confirms the antiferromagnetic coupling of the Cu to the Fe and thus a powerful use of XMCD lies in studying ferro- and antiferromagnetic coupling of Cu to other paramagnetic centers.
Figure 20.

Cu L-edge XMCD spectra for A) mononuclear blue Cu site in plastocyanin measured at ~0.3 K, and B) Cu center in [(F8TPP)FeIII-O-CuII(TMPA)](ClO4) heme-Cu dimer measured at 2.2 K. C) Structure of [(F8TPP)FeIII-O-CuII(TMPA)](ClO4) heme-Cu dimer. (Reprinted with permission from Ref. 47. Copyright 2004, American Institute of Physics.)
2.3 Binuclear Copper Sites
2.3.1 Two Copper(II): Magnetic Coupling
2.3.1.1 Ground state Zero Field Splitting (ZFS) and Antiferromagnetic coupling
If two Cu(II), each with S=1/2, are closer than ~ 6 Å apart their electron spins will dipole-dipole couple. This produces an S=1 triplet EPR signal that has characteristic spectral features (Figure 21). First there is a half field (or ΔMS = 2) transition at ~1500 Gauss (twice the g value) in X-band. This however must be distinguished from “junk” Fe(III) generally present in biological systems, and the ΔMS= 2 transition is often only observed at very low temperature. Further the g ≈ 2.0 (ΔMS= 1) region will broaden or split into two dominant spectral features (called fine structure). The splitting between these spectral features derives from the Zero Field Splitting (ZFS) of the triplet. As shown in Figure 21 the magnetic field splitting between these transitions (or better from simulation of the spectrum) gives the ZFS parameter D which in turn gives the distance between the two Cu(II) centers (r in equation 11).48
| [11] |
Figure 21.

EPR spectrum of an S=1 system including the characteristic ΔMS =2 transition and the Zero Field Splitting D of the ΔMS =1 transition which are anisotropic.
If the two Cu(II)’s have a bridging ligand this can provide a superexchange pathway for antiferromagnetic coupling between the two S=1/2’s to produce an STOT = 0 ground state. The origin of this coupling is illustrated in Figure 22A left. The half occupied d orbital on CuA overlaps a filled bridging ligand valence orbital. The electron pair in this ligand orbital polarizes such that one electron spin dominantly pairs with the spin on CuA and the second electron on the ligand polarizes towards the remote side of the filled ligand orbital. If CuB(II) overlaps the same ligand orbital its electron pairs with this remote polarized spin and the net effect is the antiferromagnetic coupling of the electron spins on the two Cu(II) though the bridging ligand superexchange pathway. Note from Figure 22A right that if the two Cu(II) overlap orthogonal orbitals on the bridging ligand, the two electron exchange interaction between the second electron in each of the two orthogonal ligand orbitals will lead to a parallel, ferromagnetic alignment of the electron spins on the two Cu(II) with an STOT = 1 ground state. The molecular orbital version of this valence bond description is shown in Figure 22B. From group theory one takes symmetric and antisymmetric combinations of the half occupied d orbitals on the two coppers and allows for their bonding interaction with the valence orbital on the bridging ligand. From Figure 22B, only the antisymmetric combination (ϕ2) can have a non-zero overlap with the occupied pz orbital on the bridging ligand. Thus, ϕ1 and ϕ2 split in energy and this leads to the spin paired antiferromagnetic ground state.
Figure 22.

A) Magnetic couplings due to superexchange pathways (magnetic orbital overlap (left), orthogonal magnetic orbitals (right)) and B) molecular orbital origin of antiferromagnetism.
This coupling of the spins on the two Cu(II) is described by the Heisenberg-Dirac-Van Vleck Hamiltonian (equation 12)49:
| [12] |
which leads to an energy dependence on the total spin, STOT = SA +SB, SA + SB −1,....,SA−SB = 1, 0 for 2 Cu(II) with S = ½. Thus, antiferromagnetic coupling (J negative) leads to an STOT = 0 ground state with the STOT = 1 at 2J, where J quantifies the exchange coupling. An antiferromagnetic coupled Cu(II) dimer has an S = 0 ground state with no EPR signal but can show a contribution to EPR, MCD and magnetic susceptibility if the STOT = 1 level becomes thermally populated.
In an exchange coupled dimer there is an additional contribution to the ZFS of the triplet considered above (D in Figure 21). This is the pseudo-dipolar or anisotropic exchange contribution.50–52 This derives from the second order SOC of a LF excited state into the ground state of one Cu and the exchange interaction of this component with the ground state of the second Cu(II). Since SOC is also responsible for the g values deviating from 2.00, the anisotropic exchange contribution to the ZFS parameter D, Figure 21, for an exchange coupled Cu(II) dimer can be related to the ground state g values as given in equation 13, for a dx2-y2 ground state:
| [13] |
The problem with using this expression is that in addition to the ground state g values which are obtained by EPR, it requires values from the magnetic exchange interaction between the ground state on one Cu and the ligand field excited state on the second Cu(II) (Jx2-y2,xy and Jx2-y2,xz,yz). These ground/excited state exchange couplings can, in principle, be observed in LF excited states. However, this has only been investigated in one case (see ref 53). Alternatively, if the sign and magnitude of D is measured experimentally, the electron spin dipolar contribution to D is subtracted off using equation 11, and the first term in equation 13 is assumed to dominate, then Jx2-y2,xy can be obtained from the EPR experiment.
2.3.1.2 Excited States
Exchange coupling in bridged binuclear Cu(II) dimers can affect both the LF and CT excited states. The effect on the d→d transitions is to split each into four states where the splitting can provide the different ground to excited state and excited to excited state exchange pathways associated with the bridging ligand. In practice this requires very detailed spectroscopy on single crystals to resolve these effects (see ref 53) and generally will not produce significant features in the LF region of low resolution spectra of binuclear Cu(II) model complexes or protein sites. Alternatively, the CT transitions of a bridging ligand can show large deviations relative to the CT transitions on Cu(II) monomers (these are the “dimer bands” in the absorption spectra of binuclear model complexes), and these deviations directly probe the superexchange pathway for the ground state antiferromagnetic coupling.54
As shown in Figure 23, starting from the AF coupled ground state discussed above, the CT transition of a bridging ligand to CuA leads to an unpaired electron directly on the ligand which will have strong overlap thus AF coupling with the unpaired electron on CuB. This produces a large excited state AF coupling, which greatly lowers the energy of the singlet relative to the triplet CT excited state. Thus while bridging a ligand between two metal centers will tend to stabilize the energy of the L donor orbital and increase the CT transition energy of both the singlet and triplet, the large CT excited state AF coupling will greatly lower the energy of the singlet CT relative to the triplet. The observed shift of the CT energy in a dimer relative to the corresponding monomer is then the net effect of these competing contributions.
Figure 23.

Charge transfer transitions of bridging ligands: Large charge transfer excited state antiferromagnetically coupling. This mixing into the ground state through covalency leads to the antiferromagnetic coupling in the ground state.
This excited state AF coupling in the LMCT transition of a bridging ligand propagates into the ground state trough the covalency of the bridging ligand-metal bond. In valence bond theory, covalency is introduced by the configuration interaction mixing of the CT excited state into the ground state, which is known as the valence bond configuration interaction (VBCI) model. Since the singlet and triplet CT states are greatly split in energy (due to the excited state AF coupling in Figure 23 bottom) their configuration interaction with the ground state splits the singlet and triplet ground state energies leading to the AF coupling observed in the ground state of Cu(II) dimers. Thus the ground state AF coupling is given by equation 14:
| [14] |
where c2 is the amount of bridging ligand character that is covalently mixed into the ground state and JCT is the singlet/triplet splitting of the bridging ligand CT transition. Further details of the VBCI model are given in reference 55, and it has been used in reference 54 to estimate the ground state AF coupling in oxy hemocyanin which is too large to measure experimentally using ground state methods (see Section 3.1.4).
2.3.2 Copper(II)Copper(I)
Mixed valent (MV) copper sites have been important in biology in CuZ in N2OR56 and in the half Met derivatives57 of the coupled binuclear copper proteins (also in the electron transfer site CuA 58,59). In a MV system, specifically a binuclear site labeled CuA and CuB, the extra electron can be on CuA (ψ[CuA(I)CuB(II)]) or on CuB (ψ[CuA(II)CuB(I)]) or partially to fully delocalized over the two coppers as given by equation 15.
| [15] |
In the Robin and Day classification scheme,60 when α2 = 0, the system is a class I MV complex, with the extra electron (or hole) localized on one Cu. For 0 < α2 < 0.5 the system is class II MV and shows perturbed spectral features associated with interactions with the second copper. In EPR there will be more than four copper hyperfine lines (four hyperfine lines from CuB split by the hyperfine coupling constant of ACuB CuB that reflects the amount of electron spin density on this copper, each again split into four hyperfine lines with a hyperfine coupling, ACuA, reflecting the amount of electron spin density on CuA; this has had a powerful application in multifrequencey EPR, particularly using S-band to resolve overlapping hyperfine contributions)58 and in the absorption spectrum there will be an intervalent transfer transition (IV) (vide infra). For α2 = 0.5 the system is a class III, completely delocalized, MV site. This will exhibit 2NI+1=7 copper (N=2 equivalent Cu with I=3/2) hyperfine lines split by a hyperfine coupling constant that is about half that of an equivalent Cu(II) monomer, and a ψ→ψ* transition in its absorption spectrum (vide infra).
The origin of the electron delocalization between the two copper centers is the electronic coupling matrix element, HAB, that, as shown in Figure 24 can reflect both direct d orbital overlap between the Cu’s and the effects of a superexchange pathway associated with bridging ligands.
Figure 24.

Delocalization in mixed-valent systems is due to the electronic coupling matrix element HAB associated with the direct bonding interaction between two metal ions and their superexchange interaction through bridging ligand orbitals.
For two equivalent Cu’s this would lead to delocalization, however this electronic coupling is opposed by vibronic trapping. As shown in Figure 25A, when the hole is on CuA the ligands will contract to stabilize the hole on this Cu, while the opposite is the case for the hole localized in CuB. This antisymmetric combination of these ligand breathing modes on the two Cu’s is know as the Q− vibrational mode in MV theory.61
Figure 25.

Mixed valence interactions. A) Two non-interacting potential energy surfaces, (left hole on CuA, right for hole on CuB) and their associated distortions in the Q- mode. B), inclusion of electronic coupling between the two Cu’s (HAB(i)) solid lines << HAB(ii) dashed lines).38
Adding HAB to the vibronic trapping term leads to an interaction between the potential energy surfaces as shown in Figure 24B. When HAB is small (HAB(i)) the two surfaces split at the crossing point (Q− = 0) but the minima are still localized (with some mixing into the ground state from the second copper). This is the class II MV situation with some hyperfine coupling from the second copper. As illustrated in Figure 24A, excitation from the ground into the excited state transfers an electron from one Cu to the second Cu and is called an intervalence (IV) transfer transition (at an energy λ). From the potential energy surfaces for HAB(i) in Figure 25B the excited state distorts along the Q− mode and the rR spectrum will exhibit resonance enhancement in this vibration. For the class III case (HAB(ii) in Figure 25B) the ground state minimum is at Q− = 0, the complex is symmetric and both coppers contribute equally to the ground state wavefunction. Thus seven hyperfine lines will be observed in EPR, and excitation from the ground to the excited state involves a ψ→ψ* transition in that an electron transfered from a bonding to an antibonding molecular orbital between the coppers. From Figure 25B HAB(ii), this produces no distortion in the Q− mode (the ψ and ψ* minima are both at Q− = 0) but does lead to elongation and thus rR enhancement in the Cu-Cu and bridging ligand vibrational modes, since it is a metal-metal bonding to antibonding transition.62
It should finally be noted that HAB in MV systems can, through the VBCI model, be related to the AF coupling between two Cu(II) described in section 2.3.1.1.55,63 This is given by equation 16:
| [16] |
where U is the Coulomb repulsion between two electrons on the same copper (i.e. 2Cu(II) →Cu(III)Cu(I)). This is important because the electronic coupling matrix element also plays a key role in Marcus Theory of ET.64 Thus differences in J reflect differences in the rate of electron transfer that can control the nature of intermediates required for different biological functions65 (see Section 3.3.6)
2.4 Higher Nuclearity Sites: Spin Frustration and Antisymmetric exchange
The trinuclear copper cluster (TNC) active site in the multicopper oxidases (section 3.7.1) requires additional consideration of the interactions among three Cu(II) S=1/2 centers. As shown in Figure 26, the resting TNC site has a pair of Cu(II)’s (called Type 3, vide infra) that can antiferromagnetically couple leading to an S’=1 triplet state at 2J above the S’=0 singlet ground state. Allowing for the presence of the third (Type 2) non-bridged S = ½ Cu(II), the S’=0 couples to form an STOT = ½ ground state and the S’=1 couples to form an STOT = ½ and 3/2 states, still at 2J, since there is no bridging interaction of the Type 2 Cu(II) with the Type 3 Cu(II) pair. The wavefunction for the S’=0 STOT =1/2 ground state thus has the spin localized on the Type 2 Cu(II) and only exhibits paramagnetic properties of this Cu(II) center. If all three Cu(II)’s are now allowed to have equivalent bridging, therefore exchange interactions, the S’=1 STOT =1/2,3/2 split in energy leading to the diagram in Figure 26 top right, with the quartet at 3J above the now orbitally degenerate 2E ground state, where this degeneracy is associated with the S’=0 STOT =1/2 and S’=1 STOT=1/2 sublevels. The spin topology with three equivalent, exchange coupled S=1/2 Cu(II)’s is a spin frustrated system as all three pairs of S=1/2 Cu(II)’s cannot be simultaneously AF coupled in a triangular bridged system.66
Figure 26.

(top) Energy diagram of an antiferromagnetically coupled Cu(II) trimer (all J<0) with zero, one and three equivalent bridging ligands. (bottom) The ZFS of the spin frustrated 2E ground state due to antisymmetric exchange and the effects of a magnetic field on these ground state sublevels. (Reprinted from Ref. 66, with permission from Elsevier.)
The spin frustrated 2E ground state will undergo a large ZFS (by amount G in Figure 26 bottom) due to a phenomenon known as antisymmetric exchange. This derives from in state SOC which can be large and mixes the S’=1,0 STOT=1/2 wavefunctions leading to an equivalent spin distribution over the three Cu(II)’s. It also has a major effect on the Zeeman splitting of the spin sublevels therefore the EPR spectrum of a spin frustrated system. In particular, as shown in Figure 26 bottom, when the magnetic field is applied perpendicular to the z (C3) axis of the Cu(II) trimer, there is a Zeeman interaction between the two ZFS levels of the 2E. This leads to a non-linear dependence of the Zeeman splitting with increasing magnetic field. Therefore higher fields, corresponding to very low g values, are required to satisfy the resonance condition of the EPR experiment.
As with anisotropic exchange, this antisymmetric exchange derived ZFS is due to SOC of a LF excited state into the ground state and thus can again be related to the ground state g value deviation from 2.0050–52 (equation 17).
| [17] |
involves both the ground state exchange interaction between dx2-y2 orbitals on pairs of Cu(II)’s and the exchange coupling of the dxy LF excited state on one Cu(II) with the dx2-y2 ground state on the second Cu(II). Therefore spin frustrated trinuclear Cu(II) states with large antisymmetric exchange hence low g values (< 2.00, i.e. the native intermediate in the multicopper oxidases (MCOs), see Section 3.7.1) require bridging ligands between the three Cu(II)’s that provide good superexchange pathways for coupling both the ground and excited state of each Cu(II) to the ground state of the adjacent Cu(II). From model studies this can be accomplished both by a µ3 oxo and by three µ2-OH bridges.66
2.5 Electronic Structure Calculations
Spectroscopy experimentally determines electronic structure and, therefore, it is important to correlate spectroscopic data to the results of electronic structure calculations. New developments in theoretical methods combined with the unprecedented computational resources available have provided chemists with powerful new tools for the study of electronic structure and reactivity of chemical systems. Thanks to the new advances in supercomputing, is now possible to study with Quantum Mechanics relatively large systems with multiple open shell metal centers and to further include, with the help of Molecular Mechanics, the whole protein and the solvent molecules. The popularity of these methods is reflected in the increasing number of electronic structure calculation software packages available and their impact on research. It is not the aim of this section to provide a detailed description of each theoretical method, but to present key essentials of the most popular methods in the study of transition metal complexes, in general, and copper sites in particular. We emphasize that different methods and basis sets give different results and it is critical to evaluate calculations with spectroscopic data. Calculations validated by data can then be used for insight into the transition states and frontier molecular orbitals, that are key to reactivity.
2.5.1 Ab Initio Wave Function Methods
Hartree-Fock (HF) theory describes a many-electron wave function Ψ as a linear combination of the products of independent one-electron wavefunctions, χ molecular orbitals (MOs), which are linear combinations of atomic orbitals ϕi and these, in turn, are linear combinations of the basis functions φa.67 The time independent Schrödinger equation can then be solved using the Hartree-Fock Self Consistent Field (HF-SCF) scheme
| [18] |
where the hamiltonian that operates over the trial wavefunction usually has the following form,
| [19] |
The terms in the hamiltonian are the kinetic energy of the electrons i, the kinetic energy of the nuclei k, the potential energy attraction between electrons and nuclei, the interelectronic repulsion i,k and the internuclear repulsion k,l. This expression is solved through the Hartree-Fock Self-Consistent Field approach, which is an iterative process to calculate the best single-determinant solution for the time-independent Schrödinger equation.67 Fock extended Hartree’s iterative process to Slater Determinant wave functions. The Fock operator is defined for each electron i as:
| [20] |
where the first part of the operator is the one-electron core Hamiltonian, Ji is Coulomb operator and Ki the exchange operator. It is the last part of the operator that leads to “four center integrals”, which are the two electronic exchange and Coulomb interactions of the form
| [21] |
where ϕp,q,r,s are analytic functions on four different centers. Those integrals scale as N4 where N is the number of electrons of the system.
Basis functions are the set of mathematical functions from which the wavefunctions are constructed. There are several mathematical functions that can be chosen to build the wavefunction. Given the shape of the atomic orbitals, one must think in terms of Slater-type functions are a logical choice, but the fact that the four center integrals corresponding to the interelectronic repulsion in the hamiltonian have to be solved by numerical methods limits their utility in medium to large size molecular systems. However, high quality Slater-type orbital (STO) basis sets have been developed.68 Gaussian basis sets are the most widely used, given that these functions solve the four index integrals in an analytical way. Moreover, Gaussian basis sets can turn four center integrals into a finite sum of two center integrals, and in the next step, to finite sums of one-center integrals, speeding up the calculations by a factor of 4 to 5. The general functional form of a normalized Gaussian-Type orbital (GTO) in atom-centered Cartesian coordinates is:
| [22] |
where α is an exponent controlling the width of GTO, and i, j, and k are non-negative integers that dictate the nature of the orbital in the Cartesian notation.
There are a number of options in choosing a Gaussian basis set, depending on the balance between accuracy and computing time. Ideally, the basis set should be as large as possible, so the Hartree-Fock limit is achieved based on the Variational Principle. This can however involve excessive computational cost. For systems that have transition metal centers, the most common basis sets used in calculations are triple-ζ, which means three Gaussian functions are used for each atomic orbital. Among the most popular basis sets of this type are the split-valence basis set of Pople and coworkers, .69,70 the correlation-consistent polarized core basis set from Dunning,71 and the triple-ζ basis set from Ahlrichs and coworkers.72 In many cases it is necessary to include polarization functions on the metal center as well as the donor atoms to improve the description of the bonding interaction and add flexibility to the Gaussian basis set. Also diffuse functions often need to be included, which are shallow Gaussian functions that allow for a better description of the “tail” of the atomic orbital. The notation from the Pople group for a split valence basis set is usually of the type X-YZW for a triple-ζ basis set, where X denotes the number of primitive Gaussians (i.e., each of the Gaussian functions used to build up the orbital function) for each atomic core orbital, and YZW indicate that the valence orbitals are made of three Gaussian functions, the first a linear combination of Y primitive Gaussians, the second a linear combination of Z primitive Gaussians, and so on. Polarization functions are usually denoted by the symbol “*” and diffuse functions by the symbol “+”
Aside from the Gaussian basis sets, the other two main approaches are the use of Effective Core Potentials (ECP, or pseudopotentials) and the use of plane waves. ECPs replace the core electrons and the nucleus with an effective potential, allowing for a large reduction in the size of the basis set and the number of electrons, speeding up the calculation. These also allow inclusion of relativistic effects in the calculation when dealing with heavy elements. Plane waves are particularly useful in solid state calculations as these have translational symmetry.
The HF-SCF wavefunction for the electronic ground state is then a single Slater determinant build from occupied MOs.67 However, for a many electron system, the premise that the motion of each electron can be described by assuming that it moves in a static field provided by the nuclei and all the other electrons is an approximation. Electrons repel each other, therefore, they will adjust to minimize their mutual repulsion, thus the electron motion is correlated. As a result, HF theory overestimates the electron repulsion energy by an amount called the correlation energy, which becomes important in describing the covalency and calculating reaction energies and barriers. Thus the need for correlated ab initio methods. Electron correlation is usually divided into dynamic and static correlation. The dynamic correlation is the correlation of the movement of the electrons while the static correlation is important for molecules in which the ground state cannot be described by a single determinant. To improve the wave function use is made of the fact that after the SCF optimization of the MO coefficients for all the occupied orbitals, the coefficients for the virtual (i.e unoccupied) orbitals are also obtained. This allows one to construct additional Slater determinants that account for different electronic excited configurations (single, double, triple, etc, electron excitations into virtual orbitals).67 Mixing these additional determinants with the ground state gives a more flexible wavefunction that includes static electron correlation. When all the coefficients are optimized variationally for all possible configurations within a set of occupied and unoccupied MOs, the method is called Full Configuration Interaction (FCI). For biologically relevant systems, FCI is unaccessible, so a truncation of the wavefunction is necessary. However, the truncation of the CI space leads to the lost of size consistency (i.e., the energy of two noninteracting entities is different from the sum of their individual energies). Given that the FCI is not accessible for large systems other ways to achieve the inclusion of electron correlation in the wave function have been developed.
2.5.1.1 Many Body Perturbation Theory
In a single configurational approach, the electron correlation energy can be included using manybody perturbation theory (MBPT). Møller and Plesset proposed operator expressions for these energy corrections. 73 The most popular MBPT level calculation is Møller-Plesset second order perturbation theory (MP2) with a HF determinant as the reference function. This allows an estimate of dynamic electron correlation for species with an electronic ground state well represented by a single Slater determinant. The increasing computational power available today allows for higher order interactions, typically MP3,74,75 MP476 and MP5, 77 within this formalism.
2.5.1.2 Multiconfigurational Self-Consistent Field Method
As indicated above, a way to improve the quality of the wave function is include additional possible determinants for excited electron configurations in the ground state. By selecting only a limited number of determinants from all possible, we can construct a multi-configurational wavefunction (ϕn are many electron single determinants),
| [23] |
for which the lowest energy its found by optimizing both the MO coefficients and the cn configuration interaction coefficients. This MC-SCF wave function is able to retrieve the static electron correlation energy for systems that can only be described with more than one (nearly)-degenerate determinant. The most popular way to implement this is the Complete Active Space (CAS) SCF method. For a given electronic state, the configurations with large cn use only a limited set of molecular orbitals. Therefore, for an n-electron system, the MO space can be split in three blocks. The inactive orbitals (those that are doubly occupied in all the configurations, containing m electrons), the external orbitals (those that have zero occupancy in all the configurations) and the active orbitals, which contain the active electrons (n-2m). The wavefunction is defined as the Full Configuration Interaction of all the possible configuration state functions (CSF) having the spatial and spin symmetry imposed by the active electrons in the active orbitals.78,79 This method is convenient and overcomes many problems of Hartree-Fock calculations on open shell systems. However, it is difficult to recover a large portion of the dynamic correlation energy by expanding the active space. A better way to include the dynamic correlation energy is using MP2 with a CASSCF reference wavefunction (CASSCF/CASPT2).80
The obvious limitation of this method in biological relevant systems is the size of the active space. To account for large systems, the Restricted Active Space (RAS) SCF method was developed.81 In this method, the active space is further divided into three subspaces. In parallel with CAS, RAS can account for dynamic correlation via MP2 in the RASSCF/RASPT2 scheme.82
2.5.1.3 Coupled Cluster Methods
Coupled Cluster Methods (CC)83 are based on rewriting the Full Configuration Interaction wave function as:
| [24] |
where the cluster operator Ti operates over all the n electrons and generates all the possible determinants having i excitations from the reference wave function (ΨHF). In a sense, this method is a full CI, but the advantage relies on the truncation of the T operator. Usually, the T operator is approximated as T=T1+T2, defining the Coupled Cluster Singles and Doubles (CCSD), and a Taylor expansion of this operator shows that the method accounts for size consistency. This method is very computationally demanding, and inclusion of triple excitations is non accessible for large molecules. Triple excitations are therefore included via perturbation theory.84
2.5.2. Density Functional Methods
While CAS and CC wavefunction methods are good when it comes to the inclusion of electron correlation, they are also very computationally demanding, and have a problem of size limitation. Bioinorganic systems usually involve large molecules that are often not accessible with these wavefunction methods. An alternative approach to this problem is the use of Density Functional Theory (DFT). Theoretically supported by the Hohenberg-Kohn85 theorems and within the Kohn-Sham (KS) DFT framework,86 the intractable many body problem of interacting electrons in a static external potential is reduced to a tractable problem of non-interacting electrons moving in an effective potential. This effective potential includes the external potential and the effects of the Coulomb interactions between the electrons, therefore the exchange and correlation interactions.
In many body electronic structure calculations, the nuclei of the molecules are assumed to be fixed (the Born-Oppenheimer approximation), generating a static external potential V in which the electrons move. A stationary electronic state can be described by a wavefunction that satisfies the time independent Schrödinger equation for an n-electron system:
| [25] |
where H is the hamiltonian, T the kinetic energy, V the potential energy from the external field due to the positive charges of the nuclei, and U is the electron-electron interaction energy. While T and U are universal, V depends on the system, and this equation is not separable into simpler single-particle equations because of U. This equation can be solved as described above by expanding the wave function into Slater determinants, but DFT provides an alternative method to deal with the electron-electron interaction. In DFT the key variable is the particle density ρ(r⃗), which for a normalized wave function is given by
| [26] |
where n is the number of electrons.
This relation can be reversed, this is, for a given ρ0(r⃗) it is possible to calculate the corresponding ground state wavefunction Ψ0 (r⃗1, r⃗2,...., r⃗n. Ψ0 is a unique functional of ρ0, and any ground-state expectation value of an observable is also a functional of ρ0. In particular, the ground state energy is a functional of ρ0 as well as T, U and V. The electronic density determines the potential and thus the Hamiltonian, which determines the wave function.
| [27] |
In principle, this approach is exact, and minimization of the E(ρ) will give the exact E(ρ0) and therefore all the other ground state properties.85 In practice, the exact functional is not known and one still needs to approximate the small but important contribution to the single particle potential energy term, called the exchange-correlation (XC) energy. Depending on this approximation, the calculation will be more or less accurate. The present exchange-correlation functionals are itemized below.87
2.5.2.1 Local Density Approximation (LDA)
This is the simplest density functional,86 and has been widely used by the solid state community. In the LDA, the XC energy depends only on the density at a point and is that of a uniform electron gas of that density. While the exchange energy can be computed exactly, no analytical derivation of the correlation energy density has proven possible. Highly numerically accurate calculations of several different densities allowed Vosko, Wilk and Nusair to design local functionals by subtracting the analytical exchange density from the total calculated density in order to include the correlation part. The authors proposed several fitting schemes for the correlation density, the most popular being the VWN and VWN5 local exchange-correlation functionals.88 Unfortunately, LDA methods are not very accurate for molecular properties as the electron density is not uniform.
2.5.2.2 Generalized Gradient Approximations (GGA)
A way to improve the correlation functional is to make it depend not only on the local value but on the gradient of the density. Inclusion of the gradient correction defines the Generalized Gradient Approximation (GGA) functionals. Originally labeled as “non local functionals”, GGAs correct the functional by adding the gradient correction to the LDA functional, this is,
| [28] |
One of the most popular GGA exchange functionals was developed by Becke,89 which includes a single empirical parameter, but other popular exchange functionals without empirical parameters are BP86 and PBE. 89–91 For the correlation part, one of the most popular correlation functionals, LYP, does not correct the LDA expression using the above equation, but instead computes the total correlation energy.92 The GGA functionals are more accurate than the LDAs, and reduce the error in bond dissociation energies and transition-state barriers.
2.5.2.3 Meta-Generalized Gradient Approximations (MGGA)
After the inclusion of the gradient, the next step is to include the dependence of the electron density on the second derivative, i.e. the Laplacian. This approach leads to the meta-GGA functionals, which in addition to the gradient at each point also include the dependence of the KS kinetic energy density. TPSS is an example of this kind of functional.93 Meta-GGA calculations are usually as computationally expensive as the GGA and more accurate for pure functionals.
2.5.2.4 Hybrid Functionals
A hybrid functional includes a certain amount of the exact Hartree-Fock exchange. By adding a fraction of exact exchange, one can often better reproduce the effects of static correlation. Mixing exact exchange however is not free of cost, because it is non-local, and depends both on the electron density and also the density matrix. The most popular hybrid functional is the B3LYP, which includes an empirically adjusted 20% of exact HF in the exchange part of the functional.94,95 Following this approach, any functional can be turned into a hybrid functional by mixing some amount of HF exchange.
2.5.2.5 Fully nonlocal functionals
These functionals require input from both the occupied and unoccupied KS orbitals. These are the equivalent of including post HF methods in DFT. Development of these functionals is still in progress and they are, in general, computationally expensive.
Due to the success of Density Functional methods, chemists have been trying to apply DFT to problems with increasing complexity. This has resulted in the development of new Density Functional methodologies aimed at overcoming the inherent limitations of “classic” DFT methods. The double hybrid functionals96,97 include a certain amount of HF exchange and a perturbational correlation correction. These functionals improve the calculation of kinetic barriers and dispersion forces due to the inclusion of the perturbational term, and have shown some success in the calculation of energy gaps between different spin states.98 However, the construction of the functional makes it more expensive than the usual DFT methods. Constrained DFT methods have successfully been applied to systems with long-range charge transfer states, which is of special interest when studying systems that involve proton-coupled electron transfer processes.99,100 Also, major advances have been recently made in the calculation of non-bonded interactions using dispersion corrected functionals, that provides an accurate energy calculation for van der Waals interactions, a key factor for the correct prediction of inter- and intramolecular noncovalent interactions.101,102
2.5.3. Quantum Mechanics-Molecular Mechanics (QM-MM) Methods
In order to study chemical reactions at the active sites of enzymes, chemists usually simplify the system by focusing on the metal center and its surrounding residues. To mimic the effects of the enzyme and solvent, a dielectric continuum model (typically Polarized Continuum Model (PCM) or COSMO (Conductor like screening model)) is usually used. The alternative is to use a simplified model of the protein and solvent in the Quantum Mechanics-Molecular Mechanics (QM-MM) method.103 This approach treats the active site at a high level of theory (usually DFT, but wavefunction methods can also be used), and the protein surroundings at a lower level, usually Molecular Mechanics. This allows the inclusion of steric and electrostatic effects on the active site. In order to combine QM and MM one needs a proper treatment of the boundary region. There are two basic groups of coupling schemes, based on the treatment of electrostatic interactions.104
2.5.3.1 Electrostatic Embedding (EE)
In this method, the QM calculation is performed in the presence of the MM system by properly including terms that describe the electrostatic interaction between the QM and the MM regions. This method accounts for the polarization effect of the charge distribution of the MM region on the active site, which is key to the electronic structure of the active site.
2.5.3.2 Mechanical Embedding (ME)
Here, the QM calculation is performed in the absence of the MM part, and all the interactions are treated at the MM level. The original ONIOM (our own n-layered integrated Molecular Orbital and Molecular Mechanics)105 coupling scheme belongs to this group, although the most updated version of this coupling scheme also allows for EE.
The connection of the QM and the MM region is a challenging problem. The two approaches to do this are the link atom and the local orbital schemes. The first introduces an extra hydrogen atom in order to saturate the QM-MM regions.106 The later uses localized bond orbitals to connect the two regions. The treatment of the boundary region is still a work in progress, where numerous and significant advances have been made in order to improve the quality of QM-MM calculations.107
2.5.4 Application to Cu sites
As presented above, there are a wide range of methods to calculate electronic structures. Although the choice of method is highly influenced by the size of the system and the goal of the calculation (i.e., geometry optimization, physical properties, reaction profiles, etc), it is important to evaluate the predictive properties of these methods as well as their ability to provide insight into the electronic structure of the studied system. In order to do this, benchmark calculations and calibration protocols are required. In the following sections, we present well-studied copper systems where spectroscopic data, which provide the experimental electronic structure of the molecule, are used to evaluate Density Functional Theory methods. Spectroscopically calibrated methods that reproduce the experimental data provide insight into the frontier molecular orbitals that are key to reactivity and a solid methodology to evaluate reaction coordinates.
2.5.4.1 Calibration of DFT methods using [CuCl4]2−
One of the early applications of DFT in bioinorganic chemistry was the blue Cu site. However, this method had to first be evaluated experimentally. This was done on the [CuCl4]2− complex, which has been studied with spectroscopic methods extensively over ten orders of magnitude in photon energy.108–110 The bridge between experimental data and theoretical calculations was done within one of the earliest DFT methods, the Xα scattered wave (Xα-SW) code.86,111 The results from these calculations were found to be too covalent relative to experiment,36,112 thus the atomic sphere radii were adjusted to fit the [CuCl4]2− experimental data. With adjusted parameters, the ground-state description was in good agreement both for [CuCl4]2− and for the blue Cu active site. Following this approach modern GGA functionals have been evaluated using the [CuCl4]2− complex as a benchmark.113 A considerable amount of ground and excited state data are available for both tetragonal (D4h) and flatted-tetrahedral (D2d) [CuCl4]2− complexes.114,115 The spectroscopic data define the ground state spin density of the Cu(II) ion in the D4h structure as 0.62 ± 0.02, which can be directly compared with the results from electronic structure calculations, thus allowing experimental calibration of GGA functionals. Spin density is a parameter directly related to the electronic structure of the molecule, making it a better calibration guideline than bond distances or thermochemical data.
Before discussing functional effects, it is important to consider the effect of the size of the basis set on the calculated spin density. Both all electron and effective core potential basis sets were tested with BP86 (GGA pure functional), B3LYP (hybrid with 20% HF) and BHandHLYP (hybrid with 50% HF). The calculated spin density was found to be dependent on the size of the basis set. From these calculations is was concluded that at least a triple-ζ basis set with diffuse functions on the metal is required in order to achieve effective basis set saturation. Lower quality basis sets give an incorrect spin density on the copper atom; larger basis sets do not significantly improve the calculated spin density.
When the pure BP86 functional with a saturated basis set was used to calculate the electronic structure of the [CuCl4]2− anion in a square planar geometry, the spin density on the Cu atom was calculated to be 0.43 (± 0.02).113 This value indicated the presence of excessive LMCT mixing into the ground state. In other words, the bonding description for the ground state of [CuCl4]2− in D4h geometry with this functional is too covalent (Figure 27 left), and includes too much ligand character in the singly occupied HOMO (SOMO, the β-LUMO in spin unrestricted calculations). As a consequence of this, the ligand field transitions are shifted too high energy while the LMCT transitions are found to be too low in energy. Thus, a less covalent bonding description is required to increase the metal character in the β-LUMO. This increases the spin density on the Cu center and shifts the ligand field and charge transfer transitions to their correct range of energies based on experiment. This requires destabilizing the copper d-manifold with respect to the ligand orbitals (Figure 27 right), through a more ionic description of the Cu-Cl bond.
Figure 27.

Molecular Orbital diagram of the CuII-Cl− bond. Left, too covalent description of the pure BP86 functional. Right, d-manifold destabilized through a more ionic bond description. Cl SALC abbreviates the Chloride symmetry adapted molecular orbitals.
This can be accomplished within the Density Functional Theory by adding exact Hartree-Fock exchange into the exchange part of the functional by means of a hybrid functional. Two functionals were explored, B3LYP and BH and HLYP, which mix 20% and 50%, respectively, of HF exchange into the pure functional, at the basis set saturation limit. The B3LYP functional significantly improves the ground and excited state properties of the [CuCl4]2− in D4h geometry, but still gives a ground state that is too covalent, with a calculated copper spin density of 0.52. On the other hand, the BHandHLYP functional gives an overly ionic description, with a copper spin density of 0.67. Therefore the optimal amount of HF exchange was determined by systematically varying the local and non-local exchange and correlation functionals (Figure 28). Among the different combinations, 38% of the total Density Functional exchange (both local and non-local) was replaced with HF exchange to match the experimental spin density keeping the correlation part unchanged. This calibration was done for the BP86 functional, but the amount of HF is transferable to other pure functionals such as BLYP. This B(38HF)P86 hybrid functional, adjusted to the ground state, is also able to calculate the ligand field and charge transfer transition energies with reasonable agreement with respect to experiment. Although all the functionals overestimate the Cu-Cl bond length relative to crystallographic data, it is worth noting that the spectroscopically calibrated B(38HF)P86 functional is the one that gives the best agreement with the experimental value.113
Figure 28.

Optimized Cu-Cl bond lengths (Å) and Mulliken Population Analysis (MPA) Cu spin densities (electron) in D4h [CuCl4]2− at maximal and minimal density functional correlation limits using saturated triple-ζ basis set.
Both solvent and crystal lattice effects on the calculated spin density have been evaluated and lead to small variations of less than 2%. However, the solvent has a larger effect on energy related parameters and bond dissociation energies, as expected for a negative charged molecule. Also the crystal lattice (H-bonding from the counterions) stabilizes the square planar geometry, preventing the distortion towards the D2d geometry observed in the gas phase calculations.
Comparison with higher levels of theory has also been performed. The electron density has been generated for the selected methods in Table 3. MP4 converges to a reasonable bonding description, and only Quadratic Configuration Interaction Singles and Doubles (QCISD) method with a saturated basis set is able to reproduce the experimental value. Coupled Cluster methods give a too ionic bonding description due to the lack of triple excitations.
Table 3.
Calculated Mulliken Spin Densities for Cu(II) in [CuCl4]2− D4h complex113
| Method | TZV*/6-31G* | ECP(SDD) |
|---|---|---|
| HF | 0.83 | 0.85 |
| MP2 | 0.70 | 0.70 |
| MP4 | 0.67 | 0.67 |
| CCD | 0.74 | 0.74 |
| CISD | 0.75 | 0.74 |
| QCISD | 0.60 | 0.58 |
The good description of the ground state and the electronic excitation energies obtained with the B(38HF)P86 functional make it suitable to study biologically important Cu(II) systems. However, as discussed in the next section, environment effects on the HOMO and the presence of stronger covalent bonds require a detailed analysis of each class of copper complexes.
2.5.4.2 Blue Cu site
The first crystallographic determination of plastocyanin was accomplished in 1978 by Freeman and coworkers.116 The geometric structure of the copper(II) active site, distorted tetrahedral, raised the issue of the protein’s role in determining the geometric structure of the active site. The copper coordination sphere in plastocyanin also has two chemically interesting ligands: a thiolate sulfur of a Cys residue with a short bond length (~2.1Å) and a long thioether sulfur-Cu bond of a Met (~2.9Å). The coordination sphere is completed by two His ligands at normal bond distances (Figure 29A). 116
Figure 29.

A. Active site of Plastocyanin, showing the short Cu-S bond (equatorial) and the long Cu-S bond from the thioether (axial). B. Ground state wavefunction (β-LUMO) of a blue Cu site.
The unusual geometry and ligation are responsible of the unique spectral features of the blue Cu site.2,117 Blue Cu has an intense absorption band at 16000cm−1 (ε= 5000 M−1 cm−1)36, and a ground state EPR signal with a hyperfine coupling (|A∥| = 53×10−4 cm−1)118 of the electron spin to the nuclear spin on the copper, reduced by more than a factor of two with respect to normal copper complexes. These spectral features reflect a novel ground state wave function that plays a key role in the biological ET function of this protein. From single crystal EPR studies43 the ground state has an unpaired electron in a dx2-y2 orbital (SOMO, β-LUMO), and the electronic z-axis of this site was found to be tilted only 5° with respect to the long thioeter Cu-S bond. This axis orientates the dx2-y2 orbital to be within 15° of the plane defined by the three strong ligands (Cys and two His). Initially the low Cu hyperfine coupling value was attributed to the distorted tetrahedral coordination site. It was thought that this distortion would allow the Cu 4pz orbital to mix into the dx2-y2 orbital, which would lower A∥ due to the spin dipolar contribution to hyperfine coupling. However, Cu K-edge (Section 2.2.5) experiments clearly showed that only Cu 4px,y mixes into this orbital. These data led to the alternative explanation for the small hyperfine coupling of a highly covalent site. In fact, the experimental values for the ground state wave function through Cu L-edge (Section 2.2.6) and S K-edge XAS spectroscopies are 0.41 Cu-d and 0.38 S-p character respectively.43
As with [CuCl4]2−, Xα-SW calculations gave ground state description that was too covalent, and it was necessary to adjust the parameters of the calculation. This resulted in good agreement with the spectroscopic data on the blue Cu ground state showing a highly covalent site mostly delocalized between the π orbital of the Cys-S and the dx2-y2 orbital of the Cu (Figure 29B).112 When a small model for the active site including only the first coordination sphere was used with modern DFT calculations, the same qualitative description of the ground state was obtained. However, as with Xα-SW this was quantitatively too covalent and the adjusted functional, B(38HF)P86, was required to reduce the covalency through inclusion of significant Hartree-Fock exchange. However, for the blue Cu site when the model used for the calculations was expanded to include second sphere interactions, the H-bond of a nearby amide with the thiolate (which has been studied in detail for iron-sulfur proteins)119 and the protein dipoles, less HF exchange (the 20% of B3LYP) was required in the functional to reproduce experiment (Table 4). This has been experimentally evaluated for the blue Cu site in azurin.120
Table 4.
Effect of second sphere interactions on the covalency of the Cu-S bond in blue Cu sites. Inclusion of protein dipoles and H-bond interactions decreases the HF exchange needed in the hybrid functional.117
| Model | Functional | Cu-spin | SCys-spin |
|---|---|---|---|
| Experiment | 0.41 d | 0.38 p | |
| 33 atom | BP86 | 0.27 | 0.61 |
| B3LYP | 0.33 | 0.57 | |
| B(38HF)P86 | 0.46 | 0.44 | |
| 217 atom | B3LYP | 0.43 | 0.43 |
| QM/MM (all protein) | B3LYP | 0.44 | 0.42 |
It is important to observe that the protein effects on blue Cu site differs from than the inclusion of the crystal lattice effects in [CuCl4]2−. In the [CuCl4]2−, the counterions also interact through H-bonds to the chlorides, but while this stabilizes the square planar geometry it has essentially no effect on the covalency and the Cu-Cl bonds. In the case of blue Cu, however, the site is more covalent and second sphere interactions do effect the covalency of the Cu-S bond. Therefore less HF exchange is required in the hybrid functional to reproduce the experimental nature of the bond.
In summary, correlation to experiments on the blue Cu site show that one must be careful in choosing a computational approach. Although the spectroscopically calibrated B(38HF)P86 functional is in excellent agreement for inorganic Cu(II) complexes, for the highly covalent blue Cu site second sphere interactions affect the covalency of the Cu-ligand bond and result in the need for less HF mixing into the ground state (but still the 20% HF in B3LYP for the blue Cu center).
2.5.4.3 CuO2 species
There are two structural types in this class of oxy-Cu species: end-on and side-on bound O2. For the latter, two limiting electronic structure descriptions are observed. From L-edge XAS and rR spectroscopies the side-on CuO2 complex with the trispyrazolyl borate ligand is a superoxo-Cu(II) species,121 while for the β-diketiminate ligand the side-on CuO2 complex has a peroxo-Cu(III) electronic structure.122 For all end-on CuO2 complexes, the electronic structure description is that of a superoxo-Cu(II) species.123 Both side-on structures are ground state singlets while the end-on structures are triplets. It is important to evaluate how well the different types of DFT calculations (i.e., pure functionals and hybrids) do in correlating to experiment in order to use DFT calculations in evaluating possible reaction coordinates. Both the details of the spectroscopic elucidation of the electronic structures of these complexes and the evaluation of possible reaction coordinates are presented in section 3.3.
For the end-on CuO2 complexes, both pure (BP86) and hybrid (B3LYP and B(38HF)P86) functional calculations give the experimentally observed triplet ground state. In correlating to the crystallographically defined [TMG3trenCuO2]+ complex (Table 5),123,124 the hybrids give the best agreement with respect to the CuO2 bonding. These appear to be appropriate for reaction coordinate calculations for the end-on CuO2 structure observed in the non-coupled binuclear Cu site in peptidylglycine α-hydroxylating monooxygenase (see section 3.3).125 The origin of the triplet ground state can be seen from Figure 30A. For the end-on bound case, the π*σ orbital of the O2•− overlaps with a lobe of the dz2 orbital (highest energy d orbital) of the Cu(II) leading to a σ bonding/antibonding interaction. This raises the energy of the dz2 orbital while leaving the second O2•− orbital, the π*v, non-bonding and on the Cu. If their splitting, Δ, is not large, both the dz2 and the π*v will be half occupied predicting the triplet ground state observed experimentally.123
Table 5.
Crystal structure bond lengths and absolute difference with respect calculated bond length in DFT optimized structures. All distances in Å.
| Bond Lengths | Crystal | BP86 | B3LYP | B(38HF)P86 |
|---|---|---|---|---|
| Cu-O(proximal) | 1.927 | 0.113 | 0.079 | 0.027 |
| Cu-O(terminal) | 2.842 | 0.153 | 0.083 | 0.020 |
| O-O | 1.280 | 0.077 | 0.068 | 0.066 |
Figure 30.

Molecular orbital diagrams. A and B, Cu(II)-superoxo; C, Cu(III)-peroxo. A, end-on triplet; B and C side-on singlet. Representative MO’s are shown at the top.
In going to the side-on CuO2 structure, the highest energy molecular orbital is now the dx2-y2 orbital and it undergoes a stronger bonding/antibonding interaction with the O2•− π*σ due to the greater overlap in the side-on geometry (two Cu-O bonds). This leads to a larger value for Δ. When this is large enough, one gets a spin paired singlet ground state. This is the case for the trispyrazolyl borate CuO2 complex, from SQUID magnetic susceptibility measurements.121 Correlations to DFT calculations (Table 6) show that only a pure functional (BP86) is capable of reproducing the singlet ground state. B3LYP gives a side-on triplet at 8.25 kcal/mol below the antiferromagnetic coupled singlet. It is interesting to compare the contours of these two calculations (Figure 31). For the B3LYP calculation, both the triplet and antiferromagnetic coupled singlet have a dx2-y2 and a π*v orbital half occupied as their splitting Δ is not large enough to spin pair. For the BP86 singlet, the α and β unoccupied orbitals have similar spatial distributions hence little spin polarization. Thus for the pure functional, Δ in Figure 30B is large enough to overcome electron-electron repulsion and spin pair, and the direct covalent interaction between the π*σ and dx2-y2 orbitals is large enough to lead to little spin polarization.123
Table 6.
DFT calculation (6-311G* basis set) for hydrotris(3-tertbutyl-5-isopropyl-1-pyrazolyl)-borate CuO2. Ground state geometries are all side-on bound superoxo-Cu(II). Energies relative to the lowest singlet state (kcal/mol) after correction for spin contamination. Adapted from ref 121
| Functional | (2S+1) | ΔE |
|---|---|---|
| BP86 | 1 | 0.00 |
| BP86 | 3 | 1.23 |
| B3LYP | 1 | 0.00 |
| B3LYP | 3 | −8.25 |
Figure 31.

Isocontours for the lowest singlet state, side-on bound superoxo-Cu(II), hydrotris(3-tertbutyl-5-isopropyl-1-pyrazolyl)-borate CuO2 with B3LYP (left) and BP86 (right) functionals.
From this correlation to experiment, it appears that when the metal-ligand bond gets very strong (i.e, covalent), there is less need for HF mixing in the functional as this tends to decrease the covalency. Finally from L-edge XAS, the appropriate energy diagram for the β-diketiminate complex is that shown in the Figure 30C where the strong β-diketiminate donor ligand raises the energy of the d orbital and limits the amount of charge donation from the O22− to the Cu.122,126 This leads to the peroxo-Cu(III) electronic structure description with a singlet ground state. DFT calculations with a pure functional reproduce this, however when HF is included for this strong donor, β-diketiminate ligand the calculations predict a triplet ground state, while from experiments it is a singlet.126
Therefore, it is clear that the nature of the copper oxygen bond (i.e, the covalency) determines the functional required to correlate electronic structure calculations to experimental data. End-on CuO2 systems are less covalent, thus HF exchange mixing is needed, and the B3LYP functional correctly reproduces the covalency of the bond and the S=1 ground state. Alternatively, side-on CuO2 systems are more covalent, thus requiring less HF exchange. As a consequence, the correct bonding description and S=0 ground state are well described by the pure functional BP86.
These correlations between different functionals and experiment for CuO2 and those presented above for [CuCl4]2− and Blue Cu suggest that the amount of HF mixing in the functional can vary, decreasing with increasing covalency of the bond, and the amount required is best established by correlation to experiment on the system being studied
2.5.4.4 Cu2O2 species
Several enzymes involved in O2 activation for the oxidation of organic substrates function with a coupled binuclear Cu active site. Much effort has been focused on their structure, spectroscopy and reactivity both in the metalloproteins and in model complexes aimed at understanding the nature of the copper-oxygen bond and the characterization of possible intermediates to provide mechanistic insights into reaction coordinates. These are described in Section 3.2. For some model systems, two types of isomers can be found in equilibrium,127 which are the µ-η2: η2 side-on peroxo128 and the bis-µ-oxo species129 (Figure 32). The interconversion and reactivities of these species will be discussed later. Here, we focus on their electronic structures.
Figure 32.

Equilibrium between μ-η2: η2 side-on peroxo Cu(II)2 and bis-μ-oxo species Cu(II)2
The µ-η2:η2 side-on peroxo128 species has been spectroscopically characterized by K-edge XAS, which shows a pre-edge peak at 8979 eV characteristic of Cu(II) (Section 2.2.5). Resonance Raman spectroscopy indicates that this species contains a peroxide moiety with a relatively weak O-O bond (νO-O ranging between 720 and 760 cm−1). SQUID magnetic susceptibility measurements show it has a singlet ground state. The most direct experimental probe into the [Cu2(O2)]2+ bonding interaction is L-edge XAS (Section 2.2.6) that shows 52±4% Cu d character in the LUMO.130 To reproduce this experimental covalency, a hybrid functional containing 10–20% HF exchange is needed. B3LYP (20% HF exchange) gives a ground state wavefunction with 56.6% Cu d character. With BP86 the Cu covalency is underestimated to be 45.3%. Importantly, this difference in HF exchange produces fundamentally different electronic structure descriptions. The pure functional gives delocalized α and β spin orbitals, thus no spin polarization (Figure 33 Left), whereas, B3LYP gives opposite spins localized on each CuII leading to an antiferromagnetically coupled ground state (Figure 33 Right). Thus, hybrid functionals with 10–20% HF exchange better capture the experimental covalency and lead to a different description of the ground state wavefunction compared to the pure functional BP86.
Figure 33.

Isocontours (0.05) of μ-η2: η2 side-on peroxo Cu(II)2 LUMO calculated using BP86 (left) and B3LYP (right).
K-edge XAS performed on the bis-µ-oxo41 isomer shows a pre-edge at ~8981 eV that is characteristic of Cu(III). Magnetic susceptibility measurements have characterized this isomer as a singlet (S=0). L-edge XAS has again been used to quantitate Cu-O bonding giving 40±4% Cu d character per hole in the ground state wavefunction. This experimental covalency can only be reproduced with a hybrid functional containing 20–40% HF exchange (BP86 and B3LYP give 32.9% and 35.4% Cu covalency, respectively).
Thus, the experimental electronic structure of both the µ-η2: η2 side-on peroxo and the bis-µ-oxo species are best reproduced using significant HF exchange. One might thus expect this spectroscopically calibrated hybrid functional to give the best thermodynamic description for the µ-η2:η2 side-on peroxo to bis-µ-oxo equilibrium. However, the literature has indicated that pure functionals (e.g. BP86) seem to correctly estimate the experimentally observed Gibbs free energy of ~0–1 kcal/mol that is associated with the isomer equilibrium for several ligand systems where both species are observed. B3LYP seems to overstabilize the µ-η2:η2 peroxo isomer by ~18 kcal/mol.131 These calculations, however, do not include relativistic and dispersion corrections, both of which have been shown to significantly affect the total free energy.132 The inclusion of these effects are reported to modify the absolute energies of the Cu2O2 systems by significant amounts that range from 10 kcal/mol for the bis-µ-oxo to 30 kcal/mol for the for µ-η2:η2 peroxo isomer, the relativity correction being the dominant contribution to the total energy. Thus, significant changes are expected when calculating the thermodynamics of this equilibrium, which seems to indicate that hybrid functionals with HF exchange are in fact needed to best reproduce the experimental electronic structure and to provide good agreement to thermodynamic quantities when dispersion and relativistic corrections are included.
3. Copper Active Sites that Activate Dioxygen
3.1 Reversible O2 Binding: Overcoming the Spin Forbiddenness
3.1.1. Enzymology
Hemocyanin (Hc) is an extra-cellular oxygen transport protein that makes up the major component of the circulatory fluid (hemolymph) in arthropods and molluscs. Deoxy-Hc contains a pair of Cu(I) atoms which bind dioxygen yielding two Cu(II) centers that lack an EPR signal.133 The antiferromagnetic coupling that is responsible for this observation is a defining feature that classifies Hc as a coupled binuclear copper protein and distinguishes it from other binuclear copper proteins that lack magnetic interactions between the copper centers (Section 3.3). Oxy-Hc also has a unique absorption spectrum (Section 3.1.4) that imparts a blue color to the hemolymph, in contrast to the red blood of organisms that utilize hemoglobin for oxygen transport. However, Hc does not contain the heme prosthetic group of hemoglobin. While the spectral features and protein derived ligands of the binuclear copper site are highly conserved, the protein structure of Hc in molluscs and arthropods is unique.
Hc’s from both organisms have quaternary structure that contains a significant number of binding sites as required for cooperative O2 binding. Mollusc Hc subunits are ~400 kDa and contain eight functional units that each contain a single binuclear copper site (labeled a-h beginning from the amino terminus). The quaternary structure is a decamer of eight subunits or a dimer of decamers arranged as hollow cylinders that are roughly 18 nm high by 35 nm in diameter (Figure 34A).134–136 Within the cylinder, the individual peptides are arranged in an antiparallel fashion forming a major and minor groove. The structure of the wall is highly conserved and contains three tiers made up of functional units a-f (the ordering of the functional units in the decamer of Keyhole Limpet Hc134 is shown in Figure 34A). At one end of the cylinder, functional unit g and h make up the collar, which contains more structural variability across various organisms. Functional unit g (shown in light blue, Figure 34A right) forms dimers to make up the arc portion of the collar located on the inside of the cylinder while functional unit h (shown in gold, Figure 34A right) makes up the slab. In some cephalopods (octopus, squid, and cuttlefish), functional unit g is absent and the arc is symmetrically arranged. In other organisms, one of the g functional units in each dimer is shifted towards the slab reducing the overall symmetry of the decamer.135,136 These decamers can also dimerize at their open face, which occurs in organisms such as keyhole limpet.134 These structures have also been found to contain a diverse array of carbohydrate structures,137–141 however the physiological significance is not well understood. A variety of mollusc Hcs have been clinically used to fight carcinomas due to the antigenic potency from these unique glycosylation patterns.142
Figure 34.

Quarternary structure of mollusc and arthropod Hc. A molecular model determined from cryo-electron microscopy of a decamer of Keyhole Limpet Hc (A) illustrates the subunit order within the wall of the cylinder. A cutout from the center of the cylinder (right) reveals the position of subunit g (light blue) in the arc and subunit h (gold) in the slab. The hexameric structure of arthropod Hc (B) is arranged as a trimer of dimers (viewed from the top on right) with each functional unit as a unique color. The tight dimmer interface (viewed from the side-on the left) is between the blue and yellow subunit while the loose dimmer interface is between the blue and green subunit. (Reprinted from Ref. 134, with permission from Elsevier.)
Arthropod Hc subunits are ~75 kDa and contain one oxygen binding site. The quaternary structure is characterized by one, two, four, six, or eight hexamers depending on the species. Each individual hexamer is comprised of a heterogeneous mixture of bean shaped subunits arranged as two trimers in D3 symmetry (a representative structure of P. interruptus143 is shown in Figure 34B). The two trimers are connected by two types of dimer interface; a tight dimer interface (between the blue and yellow subunits in Figure 34B) and a loose dimer interface (between the blue and green subunits). This hexameric structure also forms the building blocks for the oligohexamers in a variety of different conformations. While arthropod Hc is also a glycoprotein, the carbohydrate content is a smaller fraction of the protein weight and less chemical diversity has been observed across different arthropod species.144–146
While the presence of Hc in chelicerata and crustacean (two subphyla of arthropods) are well known, it was believed that the tracheal system was sufficient for oxygen transport in centipedes, millipedes, and insects which belong to the subphyla myriapoda and hexapod. These organisms, though, contain hexamerins, which are evolutionary related to the arthropod Hc.147,148 The insect hexamerins lost their copper binding domains and hence oxygen binding capacity and instead function as amino acid storage proteins. Recently, Hc proteins that bind oxygen have been identified in myriapods149,150 and hexapods151. While little is known about the O2 binding properties of these Hc’s, Hc from myriapods have high oxygen affinity coupled with low cooperatively which is consistent with a primary function of oxygen storage rather than transport.150 However, higher cooperativity has been observed in a hexapod Hc suggesting a possible role in O2 transport.151 Little is know about the evolutionary causes for the loss or retention of Hc oxygen transport in myriapoda and hexapod.
The evolutionary divergence of arthropod and mollusc Hc from a common copper dependent oxygen binding protein is believed to have happened approximately 550–600 million years ago (MYA)152,153 and 700–800 MYA154, respectively. This divergence occurred early within the evolution of the phyla and is believed to have proceeded gene duplication that is responsible for the unique quaternary structure.155 While it is likely that Hc evolved from a primordial oxygen binding protein that preceded aerobic respiration, the identity of the common ancestral copper protein is currently disputed. Due to sequence and structural similarity at only one copper-binding site, some have proposed that the ancestral protein contained a mononuclear copper site.156,157 However, sequence similarity with tyrosinase (Ty) and catechol oxidase (CO) (vide intra) have lead others to speculate that the common ancestor was a binuclear copper protein and that differences in the second copper-binding site are a result of divergent evolution.153,158
3.1.2. Thermodynamics and Kinetics
Hc is one of three oxygen transport proteins found in biology (a binuclear iron protein hemerythrin and the heme containing protein hemoglobin are the other two). While cooperativity is limited in hemerythrin,159 this feature is essential for the function of hemoglobin and Hc. In the absence of cooperativity, oxygen binds to isolated sites producing a hyperbolic saturation curve (shown in blue in Figure 35A). In the presence of molecular interactions between active sites, the binding of oxygen to one site can increase the affinity of the other active sites producing a sigmoidal binding curve (shown in red in Figure 35 A) described by the following equation
| [29] |
where θ is the fraction of bound sites, PO2 is the pressure of O2, P1/2 is the pressure where the concentration of oxy and deoxy sites are equal, and n (the Hill coefficient) is related to the strength of the interaction between the sites. For a hexamer, n can range from perfectly cooperative (n = 6) to completely isolated (n = 1). In Hc, the values of P1/2 have been shown to vary greatly with environmental factors such as ionic composition, pH, and the presence of organic molecules (vide infra). As a result, oxygen affinities (P1/2) between species have been compared for various organisms measured in whole blood or in physiological saline and pH (Table 7). The average oxygen affinity of Hc in these organisms is 14 and 18 torr for arthropods and molluscs, respectively, which is only slightly higher than the oxygen affinity of adult hemoglobin (27 torr). While these organisms all have similar affinities despite living in different climates, organisms that live in extreme ocean environments such as hydrothermal vents (B. thermydron160) or the oxygen minimum layer (G. ingens161) have very high O2 affinity, similar to other organisms that live in these environments for which the physiological hemolymph pH has not been determined.162
Figure 35.

(A) The fraction of bound sites (θ) is plotted as a function of the O2 pressure for a cooperative (red, n = 3) and non-cooperative (blue) protein that both have the same O2 affinity. (right) An example Hill plot (B) for a Hc with a P1/2 of 20 torr that lacks cooperativity and a cooperative protein with the same affinity and n = 3.
Table 7.
Oxygen affinities (P1/2) of hemocyanin at under physiological conditions.
| Arthropod | ||||
|---|---|---|---|---|
| Organism | P1/2 (torr) | pH | T (° C) | Samplea |
| Crab | ||||
| Atelecyclus rotundatus163 | 5.6 | 7.8 | 10 | WB |
| Birgus latro164 | 21 | 7.6 | 29 | WB |
| Bythograea thermydron160 | 3.0 to 5.3 | 7.7 | 2 to 20 | S |
| Callinectes sapidus165 | 1.4 to 15 | 7.5 to 7.9 | 5 to 25 | WB |
| Cancer borealis166 | 1.2 to 11 | 7.7 to 8.1 | 5 to 15 | WB |
| Cancer magister167 | 20 | 7.7 | 10 | WB |
| Cardisoma carnifex164 | 11 | 7.6 | 29 | WB |
| Coenobita brevimanus164 | 15 | 7.7 | 29 | WB |
| Corystes cassivelaunus168 | 3.1 to 4.5 | 7.8 to 7.9 | 10 | WB |
| Gecarcinus lateralis169 | 18 | 7.4 to 7.5 | 25 | WB |
| Goneplax rhomboids163 | 4.1 | 7.8 | 10 | WB |
| Holthuisana transversa170 | 2.6 to 12 | 7.4 | 15 to 35 | WB |
| Leptograpsus variegatus171 | 22 | 7.8 | 15 to 20 | WB |
| Libinia emarginata172 | 9 to 17 | 7.4 to 7.8 | 25 | S |
| Liocarcinus depurator163 | 11 | 8.1 | 10 | WB |
| Menippe mercenaria166 | 8.2 to 15 | 7.5 to 7.7 | 15 to 25 | WB |
| Pagurus bernhardus173 | 24 to 70 | 7.8 to 8.0 | 5 to 25 | WB |
| Ocypode quadrata172 | 7 to 11 | 7.9 to 8.1 | 25 | S |
| Crayfish | ||||
| Astacus leptodactylus174 | 9.6 to 17 | 7.4 to 8.2 | 10 to 20 | WB |
| Orconectes rusticus175 | 7.0 to 8.4 | 7.7 to 7.9 | 15 | WB |
| Pacifastacus leniusculus 176 | 6.2 to 12 | 7.6 to 7.8 | 10 to 25 | S |
| Isopod | ||||
| Glyptonotus antarcticus177 | 10 | 8.0 | 0 | WB |
| Krill | ||||
| Meganyctiphanes norvegica178 | 18 to 50 | 7.9 | 5 to 10 | WB |
| Lobster | ||||
| Galathea strigosa168 | 12 | 8.0 | 10 | WB |
| Jasus edwardsii179 | 29 | 7.6 | 20 | S− |
| Munida rugosa180 | 29 to 39 | 7.9 | 10 | WB |
| Munida sarsi180 | 50 | 7.9 | 10 | WB |
| Nephrops norvegicus168 | 11 | 7.9 | 10 | WB |
| Shrimp | ||||
| Callianassa californiensis181 | 2.5 | 8.2 | 10 | S |
| Callianassa subterranean182 | 1.4 | 7.8 | 10 | WB |
| Calocaris macandreae182 | 0.9 | 7.8 | 10 | WB |
| Gnathophausia ingens161 | 1.0 to 1.2 | 8.0 | 2 to 10 | S |
| Jaxea nocturna182 | 1.5 | 7.7 | 10 | WB |
| Macrobrachium rosenbergii183 | 6.7 to 35 | 7.5 to 7.7 | 22 to 32 | WB |
| Upogebia deltaura182 | 6.5 | 7.8 | 10 | WB |
| Upogebia stellate182 | 11 | 7.7 | 10 | WB |
| Mollusc | ||||
| Organism | P1/2 (torr) | pH | T (° C) | Samplea |
| Chiton | ||||
| Chiton tuberculatus184 | 24 | 7.3 | 25 | WB |
| Katherina tunicate184 | 23 | 7.4 | 25 | WB |
| Mopalia muscosa184 | 21 | 7.4 | 25 | WB |
| Cuddlefish | ||||
| Sepia officinalis185,186 | 5.3 to 6.5 | 7.4 | 10 to 20 | WB |
| Nautilus | ||||
| Nautilus pompilius187 | 17 | 7.5 | 18 | WB |
| Octopus | ||||
| Octopus dofleini188,189 | 39 | 7.0 to 7.2 | 10 | S |
| Octopus vulgaris190 | 35 | 7.4 to 7.5 | 23 | WB |
| Snail | ||||
| Buccinum undatum191 | 8.9 to 59 | 7.5 to 8.1 | 10 | WB |
| Busycon canaliculatum192 | 11 to 14 | 7.9 to 8.1 | 22 | WB |
| Fasciolaria tulipa193 | 7 | 7.7 to 7.9 | 25 | WB |
| Fusitrition oregonensis193 | 7 | 7.7 to 7.9 | 25 | WB |
| Haliotis iris194 | 3.9 | 7.0 | 15 | WB |
| Squid | ||||
| Illex illecebrosus195,196 | 7.9 | 7.4 to 7.5 | 15 | WB |
| Loligo pealei195,196 | 7.9 to 13 | 7.2 to 7.5 | 15 | WB |
WB (whole blood) or S (physiological saline solution)
However, the high affinity of Hc is not the only feature of these proteins that allow them to reversibly bind O2. In vivo, the presence of sigmoidal oxygen binding behavior is essential to efficiently transfer oxygen from the gills to the extremities. In the case of the crab Cancer magister, hemocyanin in the hemolymph is characterized by a P1/2 of 20 torr and a Hill coefficient of 3 (Figure 35A).167 In vivo, the O2 pressure in the gills and extremities is 105 and 24 torr, respectively. For the physiological sigmoidal curve, the oxygen saturation changes from 99% to 63%, delivering 36% of the O2 capacity of the protein. However, a hypothetical non-cooperative O2 carrier with the same affinity would only deliver 29% of the O2. The difference between the cooperative and non-cooperative binding is greatly increased during exercise where the in vivo pressures drop to 89 and 10 torr in the gills and extremities, respectively. During this time of metabolic demand, a cooperative oxygen transport protein is much more efficient (88% delivery) than the non-cooperative one (48% delivery), which binds less oxygen at the gills and releases less at the extremities.
This cooperative behavior has been shown to dependent on the multimeric quaternary structure of Hc,197–199 including molluscs that contain seven or eight functional units per protein.188,200,201 From equation 29, the magnitude of this cooperativity is quantified by the Hill coefficient. The largest measured Hill coefficients are 9.3202 and 8.6203 for arthropods and mollusc, respectively. While these large Hill coefficients assist with O2 binding, they are much smaller than the number of active sites in each enzyme (24 and 160). These results indicate that the primary function of these large molecular assemblies is not to extend the cooperative unit throughout the quaternary structure. Rather the large molecular weight is believed to increase the number of O2 binding sites in an extracellular protein without drastically increasing the osmotic pressure.204 Experimentally, the Hill coefficient is frequently determined from the linearization of the oxygen binding plots (Figure 35B), called a Hill plot. Here, the is plotted as a function of the log(PO2) and the slope determines the Hill coefficient (n) while the intercept is the log(P1/2). In the case of non-cooperative oxygen binding, the slope is unity since n = 1 (shown in blue squares in Figure 35B). For cooperative binding, three distinct regions of the Hill plot can be identified (shown in red dots in Figure 35B). At high and low oxygen pressures, the slope is one while the slope between these extremes is greater than one.
Physical insight to these regions can be provided by the Monod, Wyman, Changeux (MWC) two-state model.205 In this model, oxygen binding is characterized by two quaternary confirmations of the enzyme, a low affinity tense state (the T-state) and a high affinity relaxed state (the R-state) related by the equilibrium constant L where L=[T]/[R]. At low and high O2 pressures, oxygen binds to only the T-state and R-state, respectively, resulting in a slope of one. At intermediate oxygenation, an increased number of deoxy sites are in the high affinity R-state, resulting in slopes greater than unity. From these plots, three important parameters can be determined. The affinity for the T and R states can be determined from non-linear fitting of the MWC two-state model or by extrapolation of the linear region of the Hill plot (Figure 35B), where the intercepts correspond to the P1/2 of the T and R states. Additionally, the site-site interaction, δ(ΔG), can be determined from the difference in the Gibbs free energy of the T and R states and is related to their respective equilibrium constants where
| [30] |
This site-site interaction represents the thermodynamic change that resulted from the structural re-arrangement from the tense to the relaxed state. In hemocyanin, the average δ(ΔG) is significantly larger in arthropods (−2.5 kcal/mol) than mollusc (−1.4 kcal/mol) suggesting that the hexameric quaternary structure found in arthropods allows for a larger driving force (Table 8) for O2 binding.
Table 8.
Site-site interaction energy δ(ΔG) from model fits to oxygen binding data.
| Arthropod | ||||||||
|---|---|---|---|---|---|---|---|---|
| Organism | (torr)a | (torr)a | δ(ΔG) (kcal/mol) |
T (°C) |
P1/2 (torr) | nH | Heterotrophic Affectors |
Model |
| Crab | ||||||||
| Callinectes sapidus206 | 160 to 450 | 0.3 to 7.9 | −2.3 to −3.6 | 20 | 4 to 75 | 2.7 to 4.7 | Ca2+, Cl−, H+ | TSc |
| Cancer magister207 | 320 to 14 | 1.2 to 1.8 | −1.2 to −3.2 | 15 | 5 to 57 | 1.1 to 3.4 | Dopamine | MWCb |
| Carcinus aestuarii208 | 25 to 170 | 0.5 to 4.0 | −2.2 | 20 | 6.8 to 44 | 3.1 to 3.9 | Ca2+, Cl−, H+ | MWCb |
| Carcinus maenas209 | ||||||||
| Ocypoda cursor210 | 280 | 74 | −0.8 | 20 | 130 | 2.0 | --- | MWCb |
| Pagurus bernhardus173 | 410 | 3 | −2.8 | 15 | 22 to 230 | 2.5–3.7 | whole blood, H+ | MWCb |
| Scylla serrate211 | 33 | 0.27 | −2.8 | 25 | 11 | --- | Ca2+, Cl− | TSc |
| Telphusa fluviatilis210 | 100 | 14 | −1.2 | 20 | 49 | 2.6 | --- | MWCb |
| Insect | ||||||||
| Pachnoda marginata151 | 16 | 1.6 | −1.3 | 20 | 8 | 2 | --- | MWCb |
| Lobster | ||||||||
| Homarus americanus211 | 160 | 1.3 | −2.9 | 25 | 91 | --- | Ca2+, Cl− | TSc |
| Homarus vulgaris212 | 125 | 0.6 | −3.2 | 25 | 6 to 95 | 3.7 to 4.4 | urate, H+ | Nd |
| Panulirus interruptus199 | 9.6 | 1.25 | −1.2 | 20 | 3.5 | 2.3 | Ca2+ | MWCb |
| Panulirus japonicas213 | 13 | 2.3 | −1.0 | 25 | 5 | 3.2 | --- | MWCb |
| Scorpion | ||||||||
| Leirus quinquestriatus210 | 100 | 1.3 | −2.5 | 20 | 14 | 6.8 | --- | MWCb |
| Pandinus imperator214 | 72 | 0.3 | −3.3 | 20 | 4 to 13 | 5.4 to 6.5 | Ca2+, Mg2+, Cl−, H+ | Nd |
| Shrimp | ||||||||
| Callianassa californiensis198 | 170 | 0.6 | −3.4 | 25 | 2.4 to 132 | 1.1 to 3.6 | Mg2+, Ca2+, H+, Cl− | MWCb |
| Penaeus setiferus215 | 500 | 0.1 | −5.0 | 20 | 0.3 to 112 | 2.2 to 4.2 | Ca2+, H+ | MWCb |
| Upogebia pusilla216 | 29 | 0.1 | −3.3 | 20 | 0.8 to 19 | 1.8 to 4.2 | H+, L-lactate | TSc |
| Spider | ||||||||
| Eurypelma californicum197 | 278 | 0.4 | −3.9 | 25 | 3.6 to 33 | 2 to 7 | H+ | MWCb |
| Molluse | ||||||||
| Organism | (torr)a | (torr)a | δ(ΔG) (kcal/mol) |
T (°C) |
P1/2 (torr) | nH | Heterotrophic Affectors |
Model |
| Octopus | ||||||||
| Octopus doflini188 | 4 to 280 | 1 to11 | −0.6 to −2.2 | 20 | 5 to 360 | 1.9 to 3.3 | saline, H+ | TSc |
| Snail | ||||||||
| Haliotis iris194 | 13 | 2.2 | −1.0 | 15 | 8.9 | 3.3 | Mg2+, Cl | MWCb |
| Hexaplex trunculus217 | 42 | 2 | −1.8 | 20 | 2.8 to 28 | 1.3 to 4.0 | Ca2+, Cl | MWCb |
| Levantina hierosolima218 | 11–25 | 1.9 to 5.0 | −0.5 to −1.5 | 25 | 7 to 12 | >1 | Ca2+, Cl | MWCb |
| Lymnaea stagnalis203 | 7.8 to 15.5 | 0.8 to 5.1 | −0.6 to −1.8 | 20 | 2.0 to 7.2 | 2.0 to 8.6 | Ca2+, Cl | MWCb |
| Squid | ||||||||
| Sepioteuthis lessoniana219 | 65 | 4.1 | −1.6 | 20 | 15 | 2.4 | Mg2+ | MWCb |
For models with more than one state, the highest affinity state is and the lowest affinity state is .
Monod, Wyman, Changeux Model
Three State MWC Model
Nested Model
Yet only cooperative oxygen binding is generally not sufficient to efficiently function as an oxygen transport protein especially in organisms that live in dynamic aquatic environments. In many organisms, the modulation of oxygen affinity in response to environmental factors such as temperature changes and temporary hypoxia is essential to survival. The effect of temperature changes on Hc O2 affinity can be curtailed by minimizing the magnitude of ΔH since
| [31] |
However the value of ΔH for Hc has been frequently calculated incorrectly in the literature. Numerous reports have utilized an integrated form of the van’t Hoff equation in the following form
| [32] |
The use of P1/2 rather than the equilibrium constant does not account for the temperature dependence of the solubility of O2, resulting in ΔH values that are significantly smaller due to the decreased solubility of O2 at higher temperatures.220 As a result, thermodynamic parameters have been re-determined from the temperature dependence of P1/2 values by accounting for the solubility of oxygen at the experimental salinity221 from the temperature dependence of Henry’s law parameterized for O2 solubility in sea water.222 Determining values for the themodynamic parameters in this manner (Table 9) indicates that on average, O2 binding by Hc is slightly exothermic (−4.5 and −8.2 kcal mol−1 for arthropods and mollusc, respectively) and ΔS is slightly positive (6 and 5 cal mol−1 K−1), however, large variability in ΔH and ΔS is observed. Some of the most exothermic binding energies exist in organisms (G. antarcticus177 and A. monachus223) that live in cold environments that have little to no change in temperature. Similarly, organisms that live near hydrothermal vents have small or slightly positive values for ΔH, which is believed to be an advantageous adaptation as a direct result of an environment where temperatures change rapidly.160,161,224–246 However, physiological responses to temperature changes complicate the direct interpretation of thermodynamic data. For example, the oxygen affinity of blue crab (C. sapidus) Hc at low temperatures is very high (less than 4 torr), however the animals respond to this environmental condition by entering into a semi-hibernative state.165
Table 9.
Thermodynamic and Bohr effects for Hc from various organisms.
| Arthropod | |||||
|---|---|---|---|---|---|
| Organism | ΔH (kcal/mol) |
ΔS (cal mol−1 K−1) |
P1/2 (torr) | Bohr Effect | Heterotrophic Affectors |
| Crab | |||||
| Alvinocaris lusca160 | 5.0 ± 7.0 | 43 ± 25 | 1.3 to 2.8 | −0.77 | Ca2+, Mg2+, Cl− |
| Birgus latro229 | −6.9 ± 0.2 to −6.3 ± 0.6 | −0.7 ± 0.7 to 0.8 ± 2.0 | 5.6 to 20 | −0.60 | whole blooda |
| Bythograea thermydron160 | −2.3 ± 2.7 to 3.0 ± 2.2 | 16 ± 9 to 34 ± 8 | 1.6 to 7.1 | −0.67 to −0.34 | Ca2+, Mg2+, Cl−, H+ |
| Calappa granulate230 | −20 ± 1 to −16 ± 1 | −50 ± 4 to −36 ± 3 | 11 to 106 | −0.95 | Ca2+, Cl−, lactate |
| Callinectes sapidus165 | −5.2 ± 3.5 to 9.5 ± 2.0 | 3.8 ± 12.0 to 52 ± 7 | 5 to 75 | −1.7 | seawater |
| Cancer anthonyi231 | −4.8 ± 3.0 to 0.3 ± 1.8 | 3 ± 10 to 23 ± 6 | 8 to 54 | −1.11 to −0.49 | Ca2+, Mg2+, Cl−, H+ |
| Cancer borealis166 | −31.7 | −89.7 | 2.5 to 23 | −1.2 to −0.6 | seawater |
| Cancer gracilis231 | 0.4 ± 1.8 to 1.8 ± 2.2 | 23 ± 6 to 26 ± 8 | 11 to 57 | −0.82 to −0.46 | Ca2+, Mg2+, Cl−, H+ |
| Cancer magister167 | −7.1 ± 0.3 | −5.1 ± 0.9 | 19–68 | −0.27 | whole blooda |
| Coenobita clypeatus232 | −3.3 ± 1.9 | 11 ± 6 | 6.7 to 13.5 | −0.47 | whole blooda |
| Cyanagraea praedator224 | 2.5 ± 3.2 to 5.5 ± 3.0 | 34 ± 11 42 ± 10 |
0.8 to 8 | −1.8 | whole blooda, H+ |
| Dardanus calidus233 | −8.7 ± 0.8 | −7.3 ± 2.7 | 5 to 10 | −0.8 to −0.6 | Ca2+, Cl−, L-lactate |
| Eurytium albidigitum231 | −3.5 ± 1.2 to −2.2 ± 1.4 | 12 ± 4 to 16 ± 5 | 1.8 to 7.9 | −0.48 to −0.32 | Ca2+, Mg2+, Cl−, H+ |
| Gecarcoidea natalis234 | −10 ± 1 | −10 ± 4 | 0.9 to 3.9 | −0.26 | --- |
| Holthuisana transversa170 | −9.8 ± 0.5 | −9.7 ± 1.8 | 2 to 11 | −0.90 to −0.44 | whole blooda |
| Leptograpsus variegatus171 | −13.1 to −11.7 | −25.0 to −20.0 | 15 to 41 | −0.78 | whole blood, H+ |
| Lopholithodes foraminatus231 | 1.2 ± 1.9 to 1.9 ± 1.9 | 24 ± 7 to 25 ± 7 | 21 to 91 | −0.70 to −0.60 | Ca2+, Mg2+, Cl−, H+ |
| Menippe mercenaria166 | −13.3 to −1.4 | −24.4 to 18.0 | 6 to 28 | −1.5 to −0.9 | H+, seawater |
| Metopograpsus messor235 | −10.4 ± 0.4 | −13 ± 1 | 6 to 28 | −0.96 | --- |
| Ocypode saratan236 | −0.6 ± 1.3 to 0.0 ± 2.6 | 20 ± 4 to 23 ± 9 | 5.6 to 12 | −0.67 | whole blooda, H+ |
| Paralithodes camtschaticus237 | 2.3 ± 1.7 to 4.5 ± 1.2 | 27 ± 3 to 36 ± 4 | 8 to 83 | −0.7 | Ca2+, Mg2+, Cl−, H+ |
| Segonzacia mesatlantica225 | 8.4 ± 1.8 | 52 ± 6 | 3 to 5 | −2.7 | whole blooda |
| Uca inversa235 | −13 ± 1 | −22 ± 3 | 3 to 21 | −1.07 | --- |
| Crayfish | |||||
| Pacifastacus leniusculus176 | −2.0 ± 0.4 to 0.51 ± 0.16 | 15.3 ± 1.4 to 24.9 ± 0.6 | 4.3 to 10 | −0.54 to −0.50 | acclimation T, Ca2+, Mg2+, Cl− |
| Procambrus clarkia238,239 | −9.3 to −8.7 | −5.5 to −4.0 | 0.5 to 2.9 | −0.42 | whole blooda |
| Procambrus simulans240 | −6.8 ± 0.3 | 1.5 ± 0.9 | 1.6 to 2.8 | --- | whole blood |
| Procambrus zonangulus238 | −5.9 to −3.8 | 5.3 to 11.7 | 0.9 to 3.5 | --- | whole blooda |
| Horseshoe Crab | |||||
| Limulus Polyphemus231,241 | −4.5 ± 1.2 | 6.1 ± 4.2 | 4.1 to 25 | 0.53 to 0.67 | whole blooda |
| Isopod | |||||
| Glyptonotus antarcticus177 | −4.0 to −32.4 | 3.0 to −97 | 48 to 63 | −1.4 to −0.7 | whole blood, H+ |
| Krill | |||||
| Meganyctiphanes norvegica178 | 12.5 to 35.5 | 59.6 to 146 | 18 to 249 | −1.99 to −1.85 | whole blooda |
| Lobster | |||||
| Jasus edwardsii179 | −3.88 | 11.2 | 1.6 to 3.8 | −0.2 to −0.09 | Ca2+, Mg2+, Cl− |
| Munida rugosa180 | −3.6 ± 0.2 | 6.8 ± 0.7 | 18 to 37 | −0.39 | whole blooda |
| Panulirus Interruptus199,242 | −10.32 ± 0.07 | −11.4 ± 0.2 | 1.5 to 6 | −0.4 | Ca2+, Cl− |
| Scyllarides latus243 | −14 ± 1 to −7.2 ± 2.1 | −26 ± 5 to −4.8 ± 7.2 | 3 to 33 | −0.17 to −0.15 | Ca2+, Cl−, urate |
| Shrimp | |||||
| Callianassa californiensis181 | −6.8 ± 0.7 | −1.0 ± 2.6 | 5.7 to 10.5 | −1.59 | Ca2+, Mg2+, Cl− |
| Gnathophausia ingens161 | −2.9 ± 1.7 to 0.82 ± 0.35 | 14 ± 6 to 28 ± 1 | 1.6 to 4.0 | −0.81 to −0.80 | Ca2+, Mg2+, Cl− |
| Macrobrachium rosenbergii183 | −18 ± 2 to −18 ± 2 | −41 ± 6 to −40 ± 5 | 6.7 to 35 | −0.93 to −0.96 | whole blood, H+ |
| Palaemon elegans244 | 3.1 ± 0.9 to 4.0 ± 5.3 | 32 ± 3 to 36 ± 19 | 4 to 12 | −2.00 to −1.01 | whole blooda |
| Rimicaris exoculata226 | 1.1 ± 0.3 to 2.26 ± 0.02 | 26.8 ± 0.8 to 32.12 ± 0.06 | 2.9 to 6.8 | −2.26 to −1.98 | Ca2+, Mg2+, Cl−, H+ |
| Mollusc | |||||
|---|---|---|---|---|---|
| Organism | ΔH (kcal/mol) | ΔS (cal mol−1 K−1) | P1/2 (torr) | Bohr Effect | Heterotrophic Affectors |
| Chiton | |||||
| Katharina tunicata245 | −5.6 ± 1.0 | 1.9 ± 3.5 | 10 to 23 | −0.20 to −0.08 | Ca2+, Mg2+, Cl− |
| Cuddlefish | |||||
| Sepia officinalis186 | 0.20 | 23.3 | 5.3 to 6.5 | −1.33 to −0.99 | whole blooda |
| Nautilus | |||||
| Nautilus pompilius187 | −6.06 | −0.25 | 17 to 25 | −0.20 | whole blooda |
| Octopus | |||||
| Octopus dofleini188,246 | −10.9 | −17.0 | 10 to 37 | −1.7 | whole blooda |
| Octopus vulgaris223 | −6.82 | −3.05 | 18 to 33 | −1.34 to −1.10 | Ca2+, Mg2+, Cl− |
| Megaleledone senoi186 | 2.20 | 33.4 | 0.98 to 1.1 | −2.33 to −0.9 | whole blooda |
| Snail | |||||
| Busycon canaliculatum192 | −16.2 to −6.9 | −33.5 to −1.9 | 3 to 12 | NLb | whole blooda, H+ |
| Haliotis australis247 | −13.2 to −4.3 | −23.5 to 4.8 | 3.8 to 34 | NLb | whole blooda, H+, saline |
| Haliotis iris247 | −10.6 to −4.9 | −15.1 to 2.5 | 5.5 to 38 | NLb | whole blooda, H+, saline |
| Helix pomatia248 | −14.6 to −3.8 | −29.2 to 7.8 | 4.4 to 16 | NLb | whole blooda, H+ |
| Levantina hierosolima228 | 0.58 ± 1.13 | 24 ± 4 | 9.4 to 11.9 | NLb | Ca2+, Cl− |
| Neptunea antiqua249 | −16.4 to 4.6 | −35.9 to 33.9 | 11 to 73 | NLb | whole blooda |
| Squid | |||||
| Architeuthis monachus223 | −36 ± 14 | −110 ± 50 | 14 to 126 | −0.85 to −0.83 | Ca2+, Mg2+, Cl− |
| Loligo pealei223,241 | −7.3 ± 0.1 | −4.9 ± 0.5 | 8 to 31 | −2.18 to −1.56 | whole blooda |
| Loligo vulgaris223 | −11.2 | −20.0 | 31 to 74 | −0.81 to −0.38 | Ca2+, Mg2+, Cl− |
| Todarodes sagittatus223 | −6.6 ± 0.4 | −4.5 ± 1.5 | 32 to 105 | −1.17 to −0.92 | Ca2+, Mg2+, Cl− |
Salt concentration assumed to be 0.0 g/L
Further insight into thermodynamic parameters can be determined from the T and R states of Hc. Since these parameters have only been determined for a smaller number of organisms (Table 10), general trends are difficult to define. For P. interruptus199 and H. pomatia227, both ΔH and ΔS are more positive in the high affinity R-state than the low affinity T-state. However, the opposite trend is observed for L. hierosolima.228 One important difference between L. hierosolima and P. interruptus is the affinity of the monomer. In L. hierosolima, monomeric Hc has identical thermodynamic parameters to the R-state,228 while the monomer in P. interruptus is that of the T-state199 (the affinity of the monomer in H. pomatia is unknown). This difference would necessitate differential subunit interactions to induce cooperativity and could explain the different trends in the thermodynamic parameters.
Table 10.
Thermodynamic parameters for the T and R-states of several hemocyanins.
| Organism | ΔH (kcal/mol) |
ΔS (cal mol−1 K−1) |
|---|---|---|
| Panulirus interruptus199 | ||
| T-Statea | −10.6 | −14.4 |
| R-Statea | −6.9 | 2.4 |
| Helix pomatia227 | ||
| T-State | −15.4 | −31.1 |
| R-State | −11.5 | −12.6 |
| Levantina hierosolima228 | ||
| T-State | 0.31 | 30.5 |
| R-State | −0.75 | −1.8 |
Thermodynamic parameters were calculated as described for Table 9.
The effect of the protein on the thermodynamics can be determined from a comparison to the oxygenation of Cu(I) salts of binucleating and mononucleating synthetic ligands which form binuclear, side-on bridged copper peroxide complexes. For these model compounds, ΔH ranges from −28 to −7.7 kcal mol−1 and ΔS ranges from −65 to −21 cal mol−1 K−1 (Table 11). These ranges are a result of the coordinating ligand, the flexability of the linker in the binucleating ligands, coordinating molecules in the Cu(I) complex, and the solvent. And while the rates of oxygenation for the binucleating ligands are faster due to their intermolecular nature, both the mononucleating and binucleating ligands have similar thermodynamic parameters. This is likely due to large geometric changes in the binucleating ligands since the Cu•••Cu separation in the Cu(I) salts is much longer (7.0 to 8.9 Å for the structurally characterized models250–252) than after O2 binding (Cu•••Cu of ~3.6 Å). A comparison to monomeric Hc199,228 (ΔH ranges from −10.1 to −7.5 kcal mol−1 and ΔS ranges from −12.6 to −1.7 cal mol−1 K−1) indicates that the protein environment causes the reaction to be more thermoneutral and decreases the entropic cost of binding dioxygen. A further comparison to thermodynamic parameters determined from cooperative O2 binding in Hc indicates that on average, ΔH is more thermoneutral and ΔS is slightly positive. Given an identical binuclear copper core, these results suggest that the protein environment functions to preorganize the active site for O2 binding and indicate that changes in the protein tertiary and quaternary structure overcome the intrinsic entropic cost of O2 binding. However, it is important to recognize that data determined from Hc also includes other factors such as the interactions of protein with ions or protons.
Table 11.
Thermodynamic parameters for ligands that form side-on Cu2O2 complexes.
| Ligand | ΔH (kcal/mol) |
ΔS (cal mol−1 K−1) |
|---|---|---|
| Binucleating | ||
| MeL66253 | −7.7 | −21 |
| N3254 | −20 | −71 |
| N4a,254 | −20 to −14 | −65 to −39 |
| N5254 | −19 | −57 |
| XYLb,254 | −15 to −10 | −47 to −42 |
| Mononucleating | ||
| MeAN255 | −28 | −61 |
| MePY2256 | −21 | −57 |
| PYANb,257 | −19 to −14 | −50 to −34 |
With different coordinating ligands
In different solvents
Of these various factors, Hc is generally most sensitive to changes in pH. For oxygen transport proteins (Hc and hemoglobin) a decrease in pH generally causes a decrease in O2 affinity, referred to as the normal Bohr effect.258 During metabolic demand, the concentration of CO2 (which acidifies the blood via conversion to carbonate) and acidic metabolic products such as L-lactate decrease the hemolymph pH.171,247,259–263 The normal Bohr effect causes a decrease in Hc O2 affinity delivering more oxygen under these conditions. The magnitude of this effect is quantified by the Bohr coefficient (Δlog(P1/2)/ ΔpH). Bohr coefficients for arthropods and molluscs can be as large as −2.7225 and −2.2223, respectively. However, some Hcs exhibit a reverse Bohr effect where decreases in pH increase O2 affinity. While some of the measured reverse Bohr effects only occur at extreme pH values,228,237,248 snails,191–194,94,231,247,248,264–267 horseshoe crabs,268,269 and a species of chiton184 and a crayfish240 have reverse Bohr effects within a physiologically relevant pH window. For some snails191,192,270,271, the pH of the blood is around 8.0 where the Bohr effect is very small. For horseshoe crabs272 and some snails193,194,247, the physiological pH falls within the range of the reverse Bohr effect. However, more pronounced blood acidification results from large environmental changes such as decreased temperature or environmental hypoxia.191,192,248,265,266 This increased affinity allows for O2 transport under environmentally imposed O2 limiting conditions and is believed to be an adaptive feature of Hc in these organisms since both snails and horseshoe crabs enter into periods of extended hypoxia during their life cycle.
Within the framework of the MWC two-state model205, external effectors, such as pH, that modulate Hc affinity are referred to as heterotropic allosteric effectors in contrast to O2, which is a homotropic allosteric effector. Within the framework of this model, heterotropic allosteric effectors affect O2 affinity by preferentially stabilizing either the T or R state changing the value of the equilibrium constant L. However, some experimental data in the presence of allosteric effectors, such as protons, cannot be fit to this model. As a result, different modifications of the MWC model have been employed. One modification is to allow the affinities of the T and R state to change as a function of pH.188,203,206,208,264 For Hc’s with a normal Bohr effect, the affinity of both the T and R state decreases with increasing pH. Another strategy that has been employed is the addition of other states to the MWC two-state model. In the three-state MWC model, a third allosteric state is invoked that has an O2 affinity intermediate between the T and R state.273 Another model employs nested interactions.274 In this model, a smaller allosteric unit (likely a hexamer in arthropod Hc) is affected by a larger allosteric unit (an example being a dimer of hexamers). Each of these structural units has a T and R state resulting in four states, tR, tT, rR, and rT, where the lowercase letter denotes the affinity of the smaller allosteric unit and the capital letter is that of the larger one. The fitting of these models to Hc O2 affinity for species with a normal Bohr effect indicates that protons stabilize the lower affinity states.212,214 In the case of organisms with a reverse Bohr effect such as snails, the application of a pH dependent MWC two-state model indicates that protons increase the affinity of either the T-state in H. pomatia264 or the R-state in L. stagnalis203. Data for the horseshoe crab L. polyphemus indicate that in the region of the reverse Bohr effect, protons stabilize the high affinity state decreasing the values of L in a nested model.275
While both temperature and pH independently affect Hc O2 affinity, a decrease in temperature also results in an increase in hemolymph pH.272,276,277 For most Hc’s, the negative ΔH and the normal Bohr effect both increase the O2 affinity of the protein. To minimize the change in Hc O2 affinity, some have hypothesized that the temperature sensitivity of Hc is inversely related to the Bohr effect.231 A large compilation of thermodynamic parameters and Bohr effects (Table 9) indicates that these two parameters are only weakly coupled (the Pearson product-moment correlation coefficient for the compiled arthropods and mollusc in Table 9 is −0.38 and −0.19, respectively, where 1 is a positive correlation, −1 is a negative correlation, and 0 is no correlation.).
For most hemocyanins, temperature and pH have the largest effect on O2 affinity. However, numerous other heterotropic allosteric effectors are known including inorganic ions, products of anaerobic respiration, and neuro-transmitters. In some mollusc Hc, cooperativity has been shown to depend on the presence of divalent cations such as calcium and magnesium.188,201,218,228,267,278 However, this behavior results from a lack of quaternary structure in the absence of these ions. In species where the Hc quaternary structure does not depend on divalent ions, cooperative oxygen binding is observed in their absence.210,279 The majority of Hc have an increased affinity and cooperativity in the presence of increasing concentrations of calcium188,198,203,206,215,280 and magnesium resulting from an increased affinity of the R-state.206 A second calcium binding site has also been observed that causes a decrease in O2 affinity.218,281,282 However, the high concentrations of calcium required to bind in this second site are not observed in hemolymph under normal environmental conditions.259,283–285 Interestingly, at low concentrations calcium has been shown to decrease the affinity of horseshoe crab275 and snail218,228,264,278 Hc while increasing cooperativity resulting from changes to the affinity of both the T and R state,218 however exceptions are known.203
Similar effects have also been observed with chloride. Most species188,215,286, including horseshoe crabs,287 show an increased affinity and cooperativity in the presence of increasing chloride ions, however snail203 Hc experiences a decreased affinity and an increased cooperativity. While these properties of snail and horseshoe crab Hc are generally conserved within their species, the cause or adaptive function of these properties is not well understood. Unlike pH, there is currently no evidence that in vivo ionic environments are utilized to effect Hc O2 affinity. Instead, changes in salinity in organisms that move between different environments must be combated. In general, organisms seem to utilize three strategies to modulate changes in oxygen affinity. Some organisms regulate the ionic concentration of their hemolymph.183,288 Other organisms possess Hc that is not greatly modulated by changes in ionic concentrations289 and some arthropods adapt to changing salinities by regulating Hc protein expression, which changes the ratio of the different subunits making up the hexameric quaternary structure.290,291
In contrast, organic heterotropic allosteric effectors are utilized to modulate Hc in response to changing environments. These organic effectors can be grouped into two broad categories; products of anaerobic metabolism (urate and L-lactate) and neurotransmitters (dopamine). Both the concentration of urate and L-lactate increase in the hemolymph when organisms are maintained in hypoxic environments,283,292–294 while significant increases in L-lactate and not urate occur during exercise.260,295,296 Generally, both urate212,297,298 and L-lactate206,207,216,297 increase the O2 affinity of Hc, however exceptions are known.234 It is believed that the primary adaptive function of these effectors is to increase O2 affinity during hypoxia. During exercise, it is believed that Llactate functions to moderate the Bohr effect. Interestingly, land based arthropods are less sensitive to L-lactate which likely results from these organisms infrequently encountering hypoxic environments.299 The concentration of neurotransmitters in the hemolymph has also been shown to increase during exercise.300 However, its effect on Hc is less well understood since it has only been studied in a small number of species with mixed results. While the O2 affinity of Hc from the crab C. magister increases in the presence of dopamine,207 other Hc are insensitive to changes in dopamine levels.170,301 However, the physiological concentration of dopamine in the hemolymph is very low300,302 suggesting that this effect is moderate in vivo.
Further molecular insight can be gained from exploring the kinetics of O2 binding. In general oxygen-binding rates (kon) range from 1.3 to 44 µM−1 s−1 and dissociation rates (koff) range from 9 to 2750 s−1 (Table 11) These results indicate that changes in affinity result from changing only the dissociative rate. This change accounts for the difference in affinity between the R and T199,303 as well as in the cooperative state203,268 as pH203,215 or temperature199 is perturbed. However, Hirota and coworkers have proposed that changes in kon and not koff are responsible for the observed changes in O2 affinity.304 However, in these experiments koff values were measured by laser flash photolysis while values of koff in Table 11 were determined from temperature jump or stopped flow measurements. The differences in technique are likely the cause of these different results with the temperature jump and stopped flow measurements being more reflective of the O2 dissociation caused by O2 depletion in vivo.
An extensive collection of various molecular properties (P1/2, thermodynamic parameters, responces to heterotropic effectors, etc.) on a large variety of species allows us to draw some general conclusions about the thermodyanic and kinetic properties of Hc. Most essential to its function, is the low O2 affinity coupled to high cooperativity. This allows Hc to transport oxygen in organisms that live in diverse ecosystems, some that have very low O2 concentrations. While the protein functions to minimize the entropic cost of O2 binding, organisms in environments that are susceptible to rapid changes in temperature have adapted to minimize the magnitude of ΔH. In general, a decrease in the hemolymph pH is accompanied by a decrease in O2 affinity (normal Bohr effect), which assists in delivering O2 to the extremities during exercise-induced hypoxia. Yet some species of molluscs that experience extended periods of environmentally induced hypoxia have a reverse Bohr effects in response to lower O2 concentrations. Similarly, divalent cations, chloride, and a number of small molecues that are the byproducts of metabolism have also been shown to be heterotropic allosteric effectors. Yet the concentration of ions is generally kept constant (either in the environment or via regulatory mechanisms) and the concentrations of metabolic products are generally low except in cases of extended environmental hypoxia. From kinetic measurements, changes in the equilibrium constant are attributed to changes in the off rate while the on rate generally remains constant. Yet, less is understood about how various conditions such as changes in temperature or pH affect the tense and relaxed states of Hcs. This is especially true when comparing organisms that have very different responses to the same effector, such as the reverse Bohr effect. This lack of knowledge hinders the development of more molecular models for these properties and a more thorough understanding of the difference properties of Hc among different species.
3.1.3. Structure
The tertiary structures of Hc from both arthropods and molluscs hemocyanins consist of three distinct domains. In arthropod Hc (a representative structure of L. polyphemus306 is shown in Figure 36A) domains one and two (in yellow and red, respectively) are mainly α-helical and the third domain is a β-barrel (in blue). While domain one shields the binuclear copper site contained in domain two, the third domain is believed to be the evolutionary remnant of a copper chaperone.307 This domain is structurally similar to cupredoxins and a bacterial CopC protein (an evolutionary link between copper-trafficking proteins and cupredoxins308). However, the lack of a copperbinding site in domain three suggests that this function has been lost over time. Domain two contains the active site, which is located in a four-helix bundle.309 The tertiary structure of the mollusc Hc functional units a-g contain only two domains (the oxy structure of subunit g from E. dofleini is shown in Figure 36B); an α-helical domain one that contains the active site (in red) and a six-stranded β-sandwich (domain two in blue) that shields the active site.157 While the structure of these two domains area similar in all mollusc functional units, functional unit h contains an extra C-terminal domain that is structurally similar to domain three in arthropods and the copper chaperone CopC.307
Figure 36.

The tertiary structure of the Hc functional units for the arthropod L. polyphemus (A) with the α-helical domain one that shields the four helix bundle of domain two (in red) and the β-barrel of domain three in blue. The mollusc tertiary structure from E. dofleini (B) is divided into two domains: the copper binding domain one in red and the β-barrel of domain two in blue (PDB 1NOL (A) and 1JS8 (B)).
The central domain contains the copper active site, which is coordinated by three His residues per copper. Two copper centers are distinguished by their relative location where CuA is ligated by residues closer to the N-terminus than CuB. While the structure of the CuB site in both arthropod and mollusc Hc is conserved, the structure of CuA is rather unique (Figure 37). In arthropods, the four α-helicies that contain the six His ligands are arranged in pseudo-two fold symmetry.143,306,309 However, in molluscs this symmetry is absent and one CuA ligand (His2562 in E. dofleini, Figure 37C) is located on a loop instead of an α-helix.157,310 However, this His is covalently tethered to a highly conserved Cys residue (2560 in E. dofleini, Figure 37C) at the ε1 carbon. From a structural standpoint, it is believed that this covalent linkage is critical to stabilizing His2562 in the active site yet any definitive role in O2 binding is unknown. The binuclear active site in both arthropods and molluscs is surrounded by two highly conserved Phe residues (Phe200 and Phe360 in arthropods and Phe2569 and Phe2698 in molluscs Figure 37), which form a conserved Phe-X-X-X-His sequence pattern that makes up the coordination environment of both CuA and CuB in all known Hc. A steric interaction between these Phe residues and the copper coordinating His residues and hydrogen bonds from peptide carbonyl oxygens or waters to the histidine Nδ orients these residues for copper binding. Another highly conserved hydrophobic residue is also found in the vicinity of the active site that links two protein domains. In arthropods, domain one is linked to domain two by a single residue, Phe49 (shown in yellow in figure 37B).309 In molluscs, Leu2830 (shown in blue in figure 37C) connects domain two to the active site in domain one.157 Both residues are believed to be essential for allosteric regulation (vide infra).
Figure 37.

A comparison between the deoxy (A) and oxy (B) Hc from L. polyphemus show a large geometric change at the active site upon oxygen binding (the Cu-Cu distance shortens by 1.0 Å). While the overall topology of the active site in Hc is conserved, differences between oxy-Hc from the arthropod L. polyphemus (B) and the mollusc E. dofleini (C) can be observed especially at the CuA site. (PDB 1LLA (A), 1NOL (B), and 1JS8 (C))
A variety of atomic resolution structures from both arthropods and molluscs have been determined (Table 12) In deoxy-Hc, the Cu(I) is coordinated in a distorted trigonal environment (Figure 37A and Table 13).309 Dioxygen binds to the Cu(I) site and is reduced by two electrons to peroxide which binds in an µ-η2:η2 coordination mode (Figure 37B–C);157,306 a structural motif that was originally characterized in a tris(pyrazolyl)borate model complex.311 In L. polyphemus, peroxide binding results in a square planer coordination environment with two trans axial histidines (His204 and His328, Figure 37B) with bond lengths of 2.3 Å.306 In oxy-Hc from E. dofleini (Figure 37C), the His nitrogens adopt a staggered, trigonal, coordination environment and have similar Cu-N bond distances.157 In oxy-Hc, the Cu•••Cu distance is 3.5–3.6 Å, similar to the average Cu•••Cu distance in model complexes (3.51 Å).312 While the crystal structures do not have sufficient resolution to accurately determine the O-O bond length, binuclear Cu peroxo model complexes indicate that average O-O and Cu-O bond are 1.42 and 1.92 Å, respectively.312
Table 12.
Atomic structures of arthropod and mollusc Hc.
| species | state | resolution | O2 affinity | PDB code |
|---|---|---|---|---|
| Arthropod | ||||
| L. polyphemus306,309 | deoxy-Hc | 2.18 Å | T-state | 1LLA |
| oxy-Hc (hexameric) | 2.40 Å | T-state | 1OXY | |
| oxy-Hc (subunit II) | 2.18 Å | T-state | 1NOL | |
| P. interruptus143 | deoxy-Hc | 3.20 Å | none | 1HCY |
| Mollusc | ||||
| E. dofleini157 | oxy-Hc | 2.30 Å | unknown | 1JS8 |
| R. thomasiana310 | deoxy-Hc | 3.30 Å | unknown | 1LNL |
Table 13.
Selected geometric parameters from deoxy and oxy-Hc in Å.
| deoxy-Hc | |||
|---|---|---|---|
| atomsa | L. polyphemus309 | P. interruptusb,143 | R. thomasianab,310 |
| NHis173-CuA | 2.1 | 2.0 | 1.8 |
| NHis177-CuA | 2.0 | 2.1 | 2.7 |
| NHis204-CuA | 1.9 | 2.5 | 2.0 |
| NHis324-CuB | 2.2 | 2.0 | 2.0 |
| NHis328-CuB | 2.1 | 2.5 | 2.3 |
| NHis364-CuB | 1.9 | 2.3 | 2.1 |
| CuA•••CuB | 4.6 | 2.9 | 2.2 |
| τ CuAc | 0.2 | 1.0 | 0.8 |
| τ CuBc | 0.4 | 1.2 | 1.5 |
| oxy-Hc | |||
| atomsa | L. polyphemus306 | E. dofleini157 | |
| NHis173-CuA | 1.9 | 2.3 | |
| NHis177-CuA | 2.0 | 2.2 | |
| NHis204-CuA | 2.3 | 2.3 | |
| NHis324-CuB | 2.0 | 2.2 | |
| NHis328-CuB | 2.3 | 2.1 | |
| NHis364-CuB | 1.9 | 2.1 | |
| CuA•••CuB | 3.6 | 3.5 | |
Residue numbering from L. polyphemus
Subunit 1
The shortest distance from the Cu to the N,N,N plane.
A comparison between the oxy and deoxy structure of L. polyphemus reveals that the binding of O2 shortens the distance between the two copper atoms from 4.6 to 3.6 Å.306 Despite this large structural change at the active site, the rest of the protein structure is mainly unperturbed. However, a larger geometric change between the two arthropod deoxy-Hc structures provides a clue to the molecular mechanism of cooperative oxygen binding.143,309 The Cu(I) coordination distorts from a trigonal planer environment in L. polyphemus to a more pyramidal environment in P. interruptus changing the Cu•••Cu distance from 4.6 to 2.9 Å (Table 13). This change in Cu•••Cu distance is accompanied by a rotation of domain one from a closed conformation in L. polyphemus to an open one in P. interruptus. This rotation of approximately 8° places a steric constraint on the active site via Phe49 in the closed position (found in P. interruptus), which increases the Cu•••Cu distance. The movement of Phe49 (Figure 37A) has also been proposed to gate an O2 diffusion tunnel assisting in cooperativity.306,310 Dioxygen affinity in the crystallization buffer indicates that the deoxy-Hc structure of L. polyphemus is in the T-state while deoxy-Hc from P. interruptus has no O2 affinity.309 Despite the lack of a crystal structure of deoxy-Hc in the R-state, it is hypothesized that the domain rotation, which results in an increased Cu•••Cu separation, is responsible for the major mechanism of allosterism. A binding site for the allosteric regulator, chloride, is located between domain one and two,306 which stabilizes the closed conformation decreasing oxygen affinity for isolated subunits of L. polyphemus.313 However, the native quaternary structure has an increased affinity for O2 in the presence of chloride;287 an observation that currently has no molecular explanation.
In arthropod Hc, the rotation of domain one is proposed to be translated to the hexameric quarternary structure through the tight dimer interface (i.e. between the blue and yellow subunits in Figure 34B).309 The two trimers then rotate with respect to one another along the three-fold symmetry axis. The loose dimer interface (i.e. between the blue and green subunits) assist in the geometric rotation since this contact is located in a plane horizontal to the axis of rotation and is comprised of a small number of residue interactions. In molluscs, the effect of the domain rotation on the molecular structure is less well understood. Molecular modeling combined with electron microscopy suggest the major allosteric unit is located in the wall between the major and minor groove due to an increased number of inter-subunit contacts.134,135 This model suggests that the interfaces contain numerous histidine residues and salt bridges, which has been offered as an explanation for the observed effect protons have on cooperative oxygen binding.
These structures are consistent with a model where cooperative O2 binding is modulated by the Cu•••Cu separation. In the low affinity state, the separation is larger (4.6 Å in the arthropod L. polyphemus) than the high affinity state. The high affinity state is formed by a domain rotation that shortens the Cu•••Cu by placing a steric constraint on the active site via a conserved Phe in arthropods. This rotation can affect other active sites in the hexameric quaternary structure leading to cooperative oxygen binding. A similar model has been proposed for mollusc Hc due to the multidomain structure and a conserved Leu linking the second domain to the active site. However, no direct structural evidence of this rotation has been observed in arthropod Hc.
3.1.4. Electronic Structure
Deoxy-Hc, owing to its closed shell, diamagnetic binuclear Cu(I) state, is spectroscopically silent to most methods. Nonetheless, the oxidation state of the Cu was firmly established as +1 based on its diagnostic 1s → 4p pre-edge transition at 8984 eV (Figure 38).304,314 From the Cu(I) K-edge XAS analysis presented in Section 2.1.1 the intense pre-edge reflects a site composed of a pair of three coordinate Cu(I) ions, consistent with that observed via crystallography.
Figure 38.

Cu K-edge XAS of deoxy-Hc (black) and oxy-Hc (gray).
Upon coordination of O2 to the deoxy-site to form oxy-Hc, a change in the Cu K-edge pre-edge spectrum is observed (Figure 38) indicating that both Cu(I) ions are oxidized to the +2 oxidation state.315,316 Oxy-Hc has an intense absorption band at ~350 nm (ε: ~20 mM−1 cm−1) with an associated resonance enhanced Raman vibration at 749 cm−1 that shifts to 708 cm−1 in the 18O2 isotopologue.317,318 The observation of this band indicates that when the two Cu(I) ions are oxidized (to +2) the O2 is reduced by two electrons to the peroxide level and the 350 nm absorption feature can be assigned as a peroxide → Cu(II) CT transition. For peroxide end-on bound to a single Cu(II) (Figure 39) there is a CT transition at ~10,000 cm−1 lower energy and with approximately one fourth the intensity of oxy-Hc.319 From the resonance enhanced Raman spectrum νO—O is 803 cm−1; 50 cm−1 higher that that of oxy-Hc. Moreover, oxy-Hc has no EPR signal, and from SQUID magnetic susceptibility the two Cu(II)s are strongly antiferromagnetically coupled (-2J > 600 cm-1).320 From Section 2.3.1.1, this reflects the peroxide bridge between the two Cu(II) ions in oxy-Hc providing a superexchange pathway for the strong antiferromagnetic coupling (through the peroxide π*σ orbital, vide infra). For an end-on peroxide bridged binuclear Cu(II) complex, the peroxide to Cu(II) CT transition intensity goes up by a factor of two and νO—O increases by 30 cm−1 relative to the end-on peroxide bound mononuclear Cu(II) site (Figure 39B vs A). The CT intensity quantifies the donor strength of the peroxide to the Cu(II) and the two fold increase in intensity reflects the peroxo donor interactions with the two Cu(II) ions in the end-on bridged structure. This removes electron density from the HOMO of the peroxide that is a π* orbital (antibonding with respect to the O—O bond) and νO—O increases from 803 cm−1 to 832 cm−1. Thus the unique high energy and intensity of the peroxide to Cu(II) CT transition, and low νO—O in Figure 39C, reflect a unique electronic structure associated with the geometric structure of oxy-Hc.
Figure 39.

Comparison of the electronic absorption spectra and resonance Raman spectra (inset) among copper-dioxygen adducts.
From an early model study of Kitajima321 and from the protein crystallography (Section 3.1.3), oxy-Hc has the peroxide bound side-on and bridged between the two Cu(II)s (Figure 39C). This results in the unique electronic structure of oxy-Hc shown in Figure 40.128 The O22− π* HOMO set is doubly degenerate but split in energy upon binding to the Cu(II). The π*σ orbital is oriented along the Cu–O (peroxide) bonds and is strongly σ bonding with the LUMO, the symmetric combination of dx2-y2 orbitals on the two Cu(II)s. The second peroxide π* orbital (the π*v, v = vertical) is perpendicular to the Cu–O bond and only weakly interacting with the Cu(II) ions. The π*σ donor dominates the bonding and is responsible for the intense 350 nm CT absorption band in oxy-Hc. As shown by the contour of the LUMO in Figure 40, the side-on peroxo bridge has four donor interactions (two with each Cu(II)) which stabilizes the π*σ donor orbital energy and results in the high energy and, in particular, the high intensity of the peroxide π*σ → Cu(II) LUMO CT of oxy-Hc (the 350 nm band). This strong donor interaction removes electron density from the peroxide π* orbital and νO—O would be expected to increase to well above the 830 cm−1 of the end-on peroxide bridge structure in Figure 39B. However, the νO—O decreases to 750 cm−1. This reflects the second important contribution to the bonding. The LUMO of peroxide is its σ* orbital. In the side-on bridged structure this undergoes a bonding interaction with the HOMO (antisymmetric contribution of the dx2-y2 orbitals in the Cu(II)). This shifts a limited amount of electron density from the Cu(II) ions into the σ* orbital on the peroxide (a backbonding interaction) which is strongly O—O antibonding resulting in the low νO—O. Finally, these π*σ donor bonding/σ* backbonding contributions produce a large HOMO/LUMO splitting and result in the strong antiferromagnetic coupling of oxy-Hc (see section 2.3.1.1).322
Figure 40.

Molecular orbital diagram depicting the valence interaction between copper and dioxygen in a side-on Cu2(μ-O2) adduct. The contours of the HOMO and LUMO are shown on the left.
A detailed description of the bond strengths and definitive assignments of the vibrational features of the side-on Cu2O2 peroxo core was obtained from a force field based on the resonance Raman data and the IR spectrum of the [{(Tp)Cu}2-(µ-η2:η2-O2-2)] model complex (Tp = trispyrazoyl borate).128 These data are shown in Figure 41 with the normal mode assignment in Figure 42 as obtained from a Urey-Bradley normal coordinate analysis (NCA) (Table 14). In order of increasing energy, the dominant feature in the resonance Raman spectrum associated with the 350 nm absorption is the 284 cm−1 vibration. This has no 18O2 isotope dependence and is assigned as the totally symmetric (Ag in D2h with Cu-Cu along x and z perpendicular to the Cu2O2 plane) Cu•••Cu stretch (vCu•••Cu) which reflects the dominant excited state distortion in this CT transition. In the same energy region in Figure 41 are weaker Cu–N stretches of the ligand environment that varies among species and likely has new information yet to be uncovered. At 331 cm−1 in the IR spectrum of the model is the B2u Cu–O stretch (Figure 42) that shifts to 321 cm−1 in the 18O2 isotopologue. In the proteins (but not in the more symmetric model complex) a weak resonance Raman feature is present at 572 cm−1, which shifts to 549 cm−1 with 18O2 and is assigned as the B3u or B1g Cu-O stretch, both possibilities having been considered in the NCA. Neither mode is totally symmetric and therefore not allowed in resonance Raman but would gain some intensity in the distorted protein site. At 763 cm−1 is the νO—O that is totally symmetric and allowed by resonance Raman and reflects a shortening of the O—O bond in the CT excited state. Finally the feature at 1144 cm−1 shifts to 1098 cm−1 with 18O2 and is assigned as the first overtone of the 572 cm−1 vibration. While the fundamental is not totally symmetric and therefore does not contribute to the resonance Raman spectrum in the model complex, the overtone of a non-totally symmetric vibration is symmetric and resonance Raman allowed. The NCA of oxy-Hc gives the kO—O of 2.4 mDyn/Å. For the end-on peroxo model (Figure 39A) and end-on peroxo bridged dimer (Figure 39B), the kO—O are 2.9 mDyn/Å and 3.1 mDyn/Å respectively. The NCA eliminates mechanical coupling and mode mixing and demonstrates that the O—O bond of oxy-Hc is indeed weak due to the σ* backbonding discussed above.
Figure 41.

Resonance Raman spectrum of {[(Tp)Cu]2-(μ-η2:η2-O2)}.
Figure 42.

In plane normal vibrational modes of a side-on Cu2(μ-O2) dimer. Arrows represent the motion of the respective atoms in the normal mode.
Table 14.
Normal coordinate analysis of {[(Tp)Cu]2-(μ-η2:η2-O2)} based on a four atom diamond core model in the D2h point group.128
| obsvd frequencies (cm−1) |
calcd frequencies (cm−1) |
||||
|---|---|---|---|---|---|
| mode | 16O2 | 18O2 | 16O2 | 18O2 | force const. (mdyn/Å) |
| A. Calculations for B1g = 572 cm−1 | |||||
| Ag | 763 | 723 | 764.7 | 721.2 | kO—O = 2.43 |
| B1g | 572 | 549 | 573.8 | 547.7 | kCu—O = 1.42 |
| B3u | 523.7 | 494.9 | |||
| B2u | 331 | 321 | 333.4 | 318.2 | 0.41 (0.15) |
| Ag | 284 | 284 | 284.0 | 283.9 | 0.26 (-0.12) |
| B. Calculations for B3u = 573 cm−1 | |||||
| Ag | 763 | 723 | 764.5 | 721.3 | kO—O = 2.45 |
| B1g | 629.9 | 601.3 | kCu—O = 1.72 | ||
| B3u | 572 | 549 | 575.3 | 543.7 | |
| B2u | 331 | 321 | 333.5 | 318.3 | 0.37 (0.04) |
| Ag | 284 | 284 | 284.2 | 284.0 | 0.28 (−0.14) |
We now consider in more detail the electronic absorption spectrum of oxy-Hc. Figure 43A shows the low temp absorption and RT CD spectra of oxy-Hc.323 Also included is the low-temp absorption of met-Hc which has two Cu(II) ions that are antiferromagnetically coupled but with the peroxide replaced by a water derived ligand (likely a bridging OH− ligand). This allows the absorption and CD features of oxy-Hc at ~700 nm (~14,000 cm−1) to be assigned as the LF transitions of the two Cu(II) ions. In addition to this and the intense 350 nm peroxo → Cu(II) CT transitions there is a weaker absorption band at ~600 nm (~16,700 cm−1) and a CD feature at ~480 nm (~21,000 cm−1). Neither are present in met-Hc. The excitation dependence of the resonance Raman (Figure 43B) shows that in the low energy (600 nm) absorption band, the νO—O is enhanced while in the ~350 band, the Cu•••Cu stretch at 280 cm−1, which reflects Cu–O distortion (vide supra), is dominantly enhanced. Thus, the low-energy absorption is assigned as the O22− π*v → Cu(II) CT transition with the low intensity reflecting the limited overlap of the dx2-y2 acceptor orbital with the peroxide π*v donor. The enhancement of νO—O by excitation into this band reflects the relative donation of the peroxide π*v being less than that of the π*σ. Thus, CT excitation out of the π*v leads to a greater distortion of the νO—O bond, while CT from the π*σ leads to dominant distortion in the Cu-O bond. The enhancement of the νO—O band also profiles the CD feature at 480 nm; therefore, it is a second component of the π*v CT. In a series of binucleating model complexes where the Cu•••Cu distance was constrained by the length of the organic linker, a fourth CT band is present on the low energy side of the 350 nm absorption which increases in intensity and decreases in energy as the Cu•••Cu distance decreases (Figure 44).324 The Cu2O2 butterflies as the linker is shortened and the new absorption feature was assigned as a second component of the O22− π*σ to Cu(II) CT transition from the resonance Raman profile that shows enhancement of the 280 cm−1 Cu•••Cu vibration in this new absorption feature.
Figure 43.

A) Absorption spectra of oxy-Hc ( ) and met-Hc (—), circular dichroism spectrum of oxy-Hc (
 ) (15K, acetate pH 5.0), B) Resonance Raman excitation profile of 765 cm−1 (○) and 287 cm−1(●) vibrational features of oxy-Hc superimposed over its absorption spectrum.
Figure 44.

UV-Visible absorption spectra of a series of side-on peroxide-bridged binuclear copper complexes in which the Cu2O2 geometry contains a progressively larger “butterfly” distortion due to the ligand architecture where the most distorted complex is N3PY2.
These spectral features of oxy-Hc and related model complexes can be explained based on a transition dipole vector coupling model (TDVC),323 which is a relative of exciton theory.316 Each peroxide π* orbital makes CT transitions to each of the two Cu(II) ions in the peroxide bridged site. In zeroth order, these transitions are degenerate. However, in a dimer their transition dipole moments, which are vectors along the change in electron density in the CT process, couple into symmetric and antisymmetric combinations. These coupled excited states thus split into two transitions for each of the π*σ and π*v CT processes. Considering only the planar Cu2O2 D2h structure (with z perpendicular to the plane and x along the Cu-Cu vector) the O2−2 π*v and π*σ transform as b3g and b1g respectively, and the symmetric and antisymmetric combinations of the dx2-y2 Cu orbitals transform as b1g and b2u respectively. Thus, the π*v transitions split into a B1u (z) component that is electric dipole allowed and corresponds to the 600 nm absorption band and the B2g (Ry) that is electric dipole forbidden but magnetic dipole allowed. From section 2.2.3, the B2g component should contribute to the CD but not the absorption spectrum and thus is assigned to the 480 nm CD feature in Figure 43A. The π*σ CT also splits into two components (Ag and B3u), only one of which (the B3u (x)) is electric dipole allowed and can be assigned to the 350 nm absorption band of oxy-Hc. The butterfly distortion of the Cu2O2 core lowers the symmetry to C2v. In C2v symmetry, the two components of the π*σ become A1 (z) and B1 (x). Thus both are now electric dipole allowed wherein the A1 gains intensity in the out of plane direction due to the butterfly distortion. Thus, π*σ makes a CT transition to each Cu center and these transition dipole moment vectors couple. In the planar D2h structure, in one combination (B3u) the transition dipole vectors add giving intensity polarized along the Cu•••Cu and in the other combination, these cancel and there is no intensity (Ag). In the butterfly distortion, the vectors shift out of the xy plane. Now the antisymmetric (A1) combination of transition dipoles gives a non-zero net dipole that is polarized along z (Figure 44).
The TDVC model correlates the intensity of the A1 and B1 CT transitions in the Cu(II)-peroxo model complexes with the magnitude of the bending of the Cu2O2 core. This gives the intensity ratio as a function of the angle (Θ) between the two transition dipole vectors (μ):
| [33] |
From equation 33, it is evident that as the core distorts away from planar (i.e. the “butterfly” bending distortion), the intensity of the B1 component decreases concomitant with an increase in the intensity of the A1 component.324 This is just what has been observed in the spectra in Figure 44 and may be relevant in the CT absorption and CD spectra of the two phyla of hemocyanins.325 In Figure 45A comparing the mollusc Busycon with the arthropod Cancer Hc, the latter shows increased absorption intensity in both π*v peaks and a moderately intense low energy shoulder is at 400 nm. The EXAFS of oxy-Hc is rather unique showing an intense outer shell feature at ~3.7 Å corresponding to the Cu•••Cu interaction with a low Debye-Waller factor (arrows in Figure 45B and C). In going from mollusc to arthropod Hc, the Cu•••Cu distance decreases from ~3.7 to ~3.6 Å, an observation consistent with some butterfly distortion of the Cu2O2 core in arthropod hemocyanin.315 This structural difference in arthropod compared to mollusc may be relevant to reactivity, as catalase activity is only observed in mollusc hemocyanins.326
Figure 45.

Comparison of the spectral features of arthropod and mollusc hemocyanins. A: UV-Visible absorption spectra of Cancer Irroratus ( ) and Busycon canaliculatum () oxy-Hc; B: Fourier transform EXAFS of deoxy-Hc (
 ) and oxy-Hc () from Cancer Irroratus; C: Fourier transform EXAFS of deoxy-Hc () and oxy-Hc () from Busycon canaliculatum.
As described in Section 2.3.1.2, CT transitions of bridging ligands in metal dimers provide the superexchange pathway for antiferromagnetic coupling in the ground state.327 Here we consider the correlation of the unique CT absorption spectrum of oxy-Hc in Figure 43A to the strong ground state antiferromagnetic coupling (−2JGS > 600 cm−1). In the next section we explore how changes in this superexchange pathway overcome the spin-forbidden process of triplet dioxygen bonding to singlet deoxy-Hc to produce ox-Hc, an antiferromagnetically coupled singlet.
From Figure 46, the electron pair in the π*σ orbital of the peroxide provides the superexchange pathway for the strong antiferromagnetic coupling between the two Cu(II) ions. As indicated at the top of Figure 46, a CT transition from the π*σ of the bridging peroxide ligand to CuA leaves net electron spin in the π*σ orbital which directly overlaps the electron spin on CuB and will have a very strong antiferromagnetic coupling as there is direct orbital overlap. This CT antiferromagnetism greatly lowers the energy of the singlet CT states of bridging ligands (by −2JCT) and it is the mixing of this CT antiferromagnetic coupling into ground state that is responsible for −2JGS. The high intensity of the O22− π*σ → Cu(II) (dx2-y2) CT reflects significant overlap of the π*σ with the dx2-y2 orbitals. Thus, both a large −2JCT and a significant CT mixing into the ground state contribute to a large −2JGS.
Figure 46.

Charge transfer from a bridging peroxide to CuA (top) results in an excited state with a hole on the peroxide (bottom). In the excited state, the singly occupied peroxide and CuB orbitals strongly couple as a result of their direct overlap.
A VBCI model was developed to describe this correlation of the bridging ligand CT excited states to the superexchange pathway of the ground state (i.e. the coupling of the CT absorption spectrum to the ground state magnetism).55,328 This is presented in Figure 47. The GS configuration has spins of ½ on CuA and CuB and forms 1Γ+ and 3Γ− states at zero energy in the absence of CI (+/− refer to symmetric and antisymmetric with respect to the two halves of the dimer). The bridging ligand to metal CT generates four states: 1Γ+, 1Γ−, 3Γ+, 3Γ− given the electron can be excited to CuA or CuB, at an energy Δ above the ground configuration. States of the same symmetry and spin can undergo a configuration interaction due to the covalent ligand-metal overlap given by hdπ that correlates to the intensity of the LMCT transition. As shown in Figure 47, singlet (left) and triplet (right) energy diagrams labeled CI GS-CT, the interaction between the singlet (triplet) ground state and CT state of the same symmetry splits the singlet (right) CT transition by ΔEHL, the energy splitting deriving from covalent overlap (hdπ) and can be related to the HOMO/LUMO splitting in a MO diagram. Importantly, at this level of CI the singlet and triplet GS are at the same energy (i.e. no antiferromagnetic coupling). However, these do split in energy upon inclusion of two more configurations: 1) the metal to metal charge transfer (MMCT) at an energy U above the ground state where U is the the Mott-Hubbard Columb potential of charge transfer insulators that is the repulsion of two electrons in the same Cu d orbital (~6.5eV for Cu), and 2) the double CT (DCT) where the two electrons on the bridging ligand orbital have been transferred to the two Cu(II) ions. The energy of DCT transitions are much higher than U and can generally be neglected. Importantly, the MMCT and DCT transitions only produce singlet excited states and at energies above the LMCT states. These singlet excited states will mix and lower the energy of the singlet CT states relative to the triplet CT states through CI, an effect which propagates to the singlet ground state. As shown in Figure 47 it is the MMCT singlet mixing with the bridging singlet CT state that leads to the CT excited state antiferromagnetic coupling, −2JCT, which in turn yields the ground state antiferromagnetism −2JGS observed experimentally. The energy matrices describing this CI are given by:
| [34] |
| [35] |
and the ground state antiferromagnetic coupling can be related to the excited state antiferromagnetic coupling by −2JGS = λ2(-2JCT), where λ2 is the amount of CT mixing into the ground state due to covalency. Given that λ2 ~10%, the excited state antiferromagnetic coupling will be an order of magnitude larger then the ground state antiferromagnetic coupling. Application of the VBCI model to the absorption spectrum of oxy-Hc gives ~25000 cm−1 for −2JCT suggesting that the 350 nm band is significantly lowered in energy relative to its one electron orbital transition energy (high due to the high Zeff of the side-on peroxide as it has strong donation to the two Cu(II)) leading to a −2JGS of 2500 cm−1.54 This value is consistent with the originally reported lower limit of > 600 cm−1 obtained by SQUID magnetometry320 and reflects the only experimentally based estimate of the ground state exchange coupling; but more importantly demonstrates that the CT absorption spectrum is a distinct probe of the superexchange pathway for exchange coupling between the two Cu(II) ions.
Figure 47.

Configuration interaction diagram for mixing between valence bond states: left singlets, right triplets; in order of increasing energy the ground configuration, the LMCT configuration at an energy of Δ, the Cu to Cu CT configuration energy and the double CT (two-electrons from the ligand to the 2 Cu) at the energy of EDCT
A number of derivatives of Hc have been prepared as probes of the protein environment and the mechanism of O2 binding. One particular derivative of oxy-Hc, metazide, results from the associative displacement of peroxide by azide in the active site while the oxidation state of both Cu ions is still +2.325 Met-azide Hc is EPR silent, which suggests that the azide (possibly along with a µ-OH) bridges the metals creating an overall antiferromagnetically coupled ground state. This is verified by the observation of three intense N3− → Cu(II) CT transitions in the absorption spectrum (Figure 48), whereas only two are possible with an azide bound to a single Cu(II) ion.325 These transitions are πnbσ and πnbv analogs of the peroxide π* CT transitions described above but where the HOMOs of N3− are non-bonding. The splitting and intensity of these transitions of the N3− binding reflect the TDVC of CT transitions to two Cu(II) as described above for oxy-Hc and are quite dependent on the phylum, indicating structural distortions.
Figure 48.

UV-Visible absorption and CD spectra of Busycon () and Cancer () met-Hc with azide bound.
A second derivative of Hc is the “half-met” state generated by reacting deoxy with NO. Two initial equivalents of NO yield met-Hc and N2O, which is then reduced by a third equivalent of NO to yield the half-met NO2− derivative. The NO2− binds tightly but can be displaced using excess N3−, which can in turn be displaced by other anions.57 Half-met Hc is an EPR active mixed-valence Cu(I)Cu(II) state with an overall spin of S = ½. The binding of a variety of monoanionic ligands to half-met Hc has been surveyed including N3–, F–, Cl–, Br–, I–, SCN–, CN–, NO2–, OCN–, CH3CO2–.329–331 The binding of these anions can be classified into two groups. The first group is composed of CH3CO2–, OCN–, SCN–, NO2–, F–, and CN– and result in a localized class I mixed-valence electronic structure. The second group is composed of the halides (not including F–) and azide. Coordination of these anions results in a class II mixed-valence electronic structure as a result of N3– and halides bridging the Cu centers. These second class of anions result in two particularly diagnostic spectral signatures as a result of delocalization of the unpaired spin over the two coppers. The first is the appearance of a broad intervalence-transfer (IT) transition (λmax = 1570 nm, ε = 1200 M−1 cm−1 when L = N3−) in the UV/Vis spectrum 0 (Figure 49A), a feature that requires a bridging coordination mode. This was the first proof that the ligands (including O2) bridge the two Cu(II) ions of Hc. The energy and intensity of this IT band are inversely related, with both the intensity and energy proportional to the efficiency of the bridge as an ET pathway. The second diagnostic spectral feature is the dramatic change in shape of the EPR spectrum (Figure 49B), which is a result of the delocalization of the unpaired spin. The unique EPR spectrum of azide bound half-met Hc was used for structural insight into cooperativity in dioxygen binding to Hc in the “spectral probe” studies described in the next section.
Figure 49.

Spectral changes observed upon addition of azide to nitrite bound half-met-Hc results in significant spectral changes. A. UV-Vis absorption of NO2− bound half-met-Hc () and N3− bound half-met-Hc (); B: EPR spectra of NO2− bound half-met-Hc () and N3− bound half-met-Hc ().
3.1.5. Mechanism
The binding of dioxygen to deoxy-Hc requires the transfer of two electrons from the Cu(I) ions to dioxygen to form the bridged peroxide. Additionally, the triplet ground state of dioxygen must be converted to the antiferromagnetically coupled singlet of oxy-Hc; a formally spin forbidden process. DFT calculations have been performed to obtain insight to the manner in which the active site overcomes this spin forbiddenness.332 Throughout the reaction coordinate, the coordination mode of the dioxygen adjusts to maximize metal-ligand overlap. When the center of dioxygen is distant from that of the coppers (Figure 50 right), the bonding interaction of the O2 is weak and the π* orbitals are not spilt in energy maintaining the triplet ground state, which minimizes electron-electron repulsion. As dioxygen more strongly interacts with the coppers, the coordination mode is converted to a bridging, butterflied µ-η2:η2 one. This results in productive overlap of the Cu orbitals with dioxygen and the transfer of charge from the coppers to dioxygen, each copper interacting with a different π* orbital of dioxygen (becoming a peroxide bridge) producing orthogonal magnetic orbitals, which are ferromagnetic (Figure 22A middle) maintaining the triplet ground state. Importantly at this point, the two unpaired electrons are on the two coppers and the electron, electron repulsion is greatly reduced thus the singlet potential energy surface (PES; Figure 50 blue) is now close in energy to the triplet PES (red). Flattening of the butterfly distortion along the O2 binding coordinate leads to the overlap of both metal centered magnetic orbitals with one superexchange pathway (the π*σ orbital on peroxide), resulting in strong antiferromagnetic coupling to produce the singlet state (Figure 50 left in blue). Analysis of the Mulliken charges along this O2 binding coordinate indicates that the two electrons from the two coppers reduce dioxygen simultaneously, (in the bridged structure), and thus overcome the unfavorable one electron reduction of dioxygen. Thus the strong exchange coupling associated with the bridging peroxide that forms along the O2 binding reaction coordinate overcomes the “spin forbiddenness” of this binding reaction and results in a concerted, 2-electron process.
Figure 50.

The distance d(X-X) between the center of mass of dioxygen and the Hc active site model [{(NH3)Cu}2]2+ for the singlet (blue squares) and triplet surfaces (red circles) shows the reaction coordinate of O2 binding (open symbols signify asymmetric coordination geometries while closed symbols are symmetric). The figure illustrates the simultaneous transfer of two electrons with parallel spin to dioxygen (right) forming peroxide. The ferromagnetically coupled butterflied μ-η2-μ2 peroxo (center) then undergoes an inter system crossing to form the antiferromagnetic singlet (left).
Further insight to the mechanism of O2 binding has come from a comparison to the coupled binuclear Type 3 (T3) site in the multi-copper oxidases (see Section 3.7.1).333 The O2 binding site of the multi-copper oxidases (MCOs) contains a tri-nuclear copper cluster in its native form. Removal of the Type 2 (T2) copper (see Section 3.7.1.2) results in the isolation of a binuclear T3 copper site that is structurally similar to Hc (2 Cu ions each coordinated by 3 His ligands). The oxidized form of this site also lacks an EPR signal due to antiferromagnetic coupling and the reduced form binds small molecules such as CO but importantly does not react with oxygen in the absence of the T2 copper.8,334 A comparison between the XAS spectra of the deoxy forms of both enzymes indicates a substantial difference in their spectral features (Figure 51).333 The binuclear T3 copper in the MCO has a more intense pre-edge feature at 8983 cm−1 corresponding to the Cu 1s → Cu 4pz transition due to a more planar coordination environment. In contrast, both arthropod and mollusc Hc have a lower intensity Cu 1s → Cu 4pz transition and lower energy and higher intensity Cu 1s → Cu 4px,y transitions due to a more trigonal pyramidal coordination environment.
Figure 51.

The spectral differences of the normalized XAS of arthropod, mollusc, and the binuclear MCO reflect a changing coordination environment from trigonal in Hc to more planer in the MCO.
The implications of the different coordination environments of Hc and the binuclear T3 copper site in the MCO on their respective O2 reactivity have been computationally evaluated.333 Models for both sites were constructed that contained the six His ligands from representative crystal structures with frozen α carbon atoms on each of the ligands. Optimization of the deoxy-structures indicated that deoxy-Hc was 6.9 kcal/mol higher in energy than the deoxy form of the T3 site. Importantly, the geometry optimized deoxy sites also had different Cu•••Cu distances (4.2 and 6.5 Å for Hc and the binuclear T3 center in the MCOs, respectively) and a larger trigonal pyramidal distortion of the Cu(I) centers in Hc, consistent with the XAS spectra in Figure 51. While the binding of O2 to the Hc model to form oxy-Hc is exothermic (ΔH = −2.9 kcal/mol), the binding of dioxygen, as peroxide in a side-on configuration to the binuclear Cu(I) site in the MCO is endothermic by 5.6 kcal/mol. This difference in binding energy mostly reflects the protein constraints on the reduced sites. The origin of the energy difference observed in the deoxy structures was determined by comparing an unconstrained potential energy surface (open symbols in Figure 52) along the Cu•••Cu vector to one where the α-carbons were frozen by the protein constrains (filled symbols in Figure 52). The slopes of the two unconstrained potential energy surfaces are very similar, indicating similar electrostatic repulsion in the two protein environments. The energy difference between a Cu•••Cu separation of 6.5 Å (the optimized Cu•••Cu distance in the constrained T3 model) and 4.2 Å (the optimized Cu•••Cu distance of the constrained Hc model) for the unconstrained T3 site is ≈5.8 kcal/mol, which accounts for most of the energy difference between deoxy-Hc and deoxy-T3 MCO. This indicates that the larger electrostatic repulsion between the two Cu(I) atoms in deoxy-Hc is critical for its ability to bind dioxygen.
Figure 52.

A Cu•••Cu potential energy surface for deoxy-Hc (blue diamonds) and deoxy-T3 MCO (red squares, MCOT3). A comparison of the constrained surface (frozen α-carbons represented by filled symbols) and the unconstrained surface (open symbols) indicate that the energy difference between deoxy-Hc and the deoxy T3 site is due to electrostatic repulsion between the coppers.
This electrostatic repulsion in Hc results from the protein constraint on the Cu•••Cu distance due to interactions between two α-helicies that contain a His ligand for each Cu (His204 and 364 in Figure 53). In the absence of this electrostatic repulsion that destabilizes the deoxy site, as observed in the binuclear T3 copper site in the MCO, O2 binding is lost. This protein derived constraint, due to the presence of salt bridges and π-π interactions between these two α-helicies, results in an electrostatic repulsion between the Cu ions that functions as an “entatic” or “rack” state in Hc.333 Cooperativity between active sites can effect this electrostatic repulsion by modulating the Cu•••Cu distance in the deoxy site. In a structural model of the relaxed deoxy state (Figure 53 in orange and light blue), Phe49 is distant from CuB and the Cu•••Cu separation is short (2.9 Å) increasing electrostatic repulsion.143 In the tense deoxy state (red and yellow in Figure 53), the rotation of domain 1 to the closed conformation (with Phe49 close to the copper site) results in a π-π stack between Phe49 and His328 causing the Cu•••Cu distance to increase to 4.6 Å, decreasing electrostatic repulsion.309 Dioxygen binding in a bridging mode shortens the Cu•••Cu distance, breaking this π-π interaction, which favors the open confirmation. This leads to a domain rotation that can be transmitted to other subunits via a variety of interdomain contacts.
Figure 53.

An overlay of structural models for the tense (domain 1 in yellow and domain 2 in red, PDB 1LLA) and relaxed (domain 1 in light blue and domain 2 in orange, PDB 1HC1) states of arthropod Hc show a large rotation in domain 1. This rotation is translated to the active site via the formation of a π-π interaction between Phe 49 and His328, which increases the Cu•••Cu separation (residues numbers are from L. polyphemus 1LLA).
Direct evidence for active site structural perturbations arising from O2 binding to adjacent functional units has come from the preparation of a Hc derivative denoted the “spectral probe”, where a small fraction of the active sites in the quaternary structure have been converted to the EPR active half-met state.335 When the adjacent sites are oxygenated, the EPR spectrum of the half-met spectral probe in both arthropod and mollusc Hc is similar to the half-met monomer in the presence of excess azide (Figure 54). Upon deoxygenation, the spectral probe converts to a class II mixed-valent state, resembling the nonexcess azide spectra (Figure 54 deoxy, compare to Figure 49B red), which converts back to the excess azide spectra upon re-oxygenation. The changes in the spectral features of the half-met sites in the spectral probe indicate that when O2 binds to a binuclear Cu+ site, the quaternary structure shifts (from T to R), which affects the O2 binding through a change in the Cu•••Cu distance.
Figure 54.

The EPR spectra of the half-met spectral probe of mollusc Hc (Busycon canaliculatum) directly probes geometric changes at the active site when the oxygenation state of the adjacent subunits is altered.
3.2 Oxygen Activation by Coupled Binuclear Active Sites: Polyphenol Oxidases and Phenol Oxygenases
3.2.1. Enzymology
Coupled binuclear polyphenol oxidases (CB-PPOs) contain a magnetically coupled binuclear copper active site336 that activates dioxygen to catalyze the production of quinones in a diverse range of organisms. While the term “polyphenol oxidases” has been used to describe the multi-copper oxidase, Laccase (Section 3.7.1), laccase performs one-electron oxidations of phenols, in contrast to the two-electron oxidation of o-diphenols by the coupled binuclear copper protein family. CB-PPOs can be further divided into two subsets of enzymes with differing reactivity: tyrosinase (Ty), also called monophenol monoxygenase, internal monooxygenase, or a mixed function oxidase, (EC 1.14.18.1) and catechol oxidase (CaOx) (EC 1.10.3.1). While both Ty and CaOx perform the two-electron oxidation of o-diphenols to quinones (referred to as two-electron oxidase or catecholase activity), only Ty can catalyze the conversion of phenols to o-diphenols (referred to as monooxygenase, phenolase, or cresolase activity). Ty catalyzes the conversion of the amino acid, L-tyrosine to 3,4-dihydroxy-L-phenylalanine (L-DOPA) and the subsequent oxidation of L-DOPA to L-DOPAquinone (3-(3,4-dioxocyclohexa-1,5-dien-1-yl)-L-alanine) (Figure 55). Early oxygen labeling studies by Mason indicated that the oxygen atom incorporated into L-DOPAquinone originates from dioxygen.337 This, in combination with Hayaishi’s studies on a non-heme iron containing intradiol dioxygenase,338 demonstrated the presence of oxygenases in biology (monooxygenase for Ty and dioxygenase for pyrocatechase).
Figure 55.

Ty is a monooxygenase that converts L-tyrosine to L-DOPA by incorporating labeled oxygen before oxidizing L-DOPA to L-DOPAquinone.
The enzymatic production of L-DOPAquninone by the CB-PPOs provides the monomers that nonenzymatically polymerize, forming eumelanin via the Mason-Raper pathway.339–341 First, L-DOPAquinone forms cycloDOPA via an intramolecular Michael addition (Figure 56).342,343 CycloDOPA is then oxidized by another molecule of LDOPAquinone forming DOPAchrome, regenerating a molecule of DOPA. DOPAchrome decomposes preferentially into 5,6-dihydroxyindole (DHI) via decarboxylation but can also form 5,6-dihydroxyindole-2-carboxylic acid (DHICA) via a tautomerization.344 These two dihydroxyindoles are then oxidized enzymatically by Ty or CaOx or nonenzymatically by L-DOPAquinone before auto-polymerizing, forming eumelanin.345,346 While eumelanin makes up the major component of melanin found in nature, pheomelanin can also be present (usually <25% of the total melanin polymer).347–349 Pheomelanin forms from the intermolecular addition of L-cysteine to L-DOPAquinone, forming 5-S-Cysteinyldopa (Figure 56) or 2-S-Cysteinyldopa (not shown).341,350 Similar to the Mason-Raper pathway, the cysteinyldopa will be oxidized by L-DOPAquinone before cyclizing to a 1,4-benzothiazine intermediate that autopolymerizes to pheomelanin. While the chemical formation of both the benzothiazine and dihydroxyindoles has been extensively studied, the molecular structures of both the eumelanin and phenomelanin polymer are less well understood.
Figure 56.

The initial steps of melanin monomer formation for eumelanin via the Mason-Raper pathway and the formation of phenomelanin via the 5-S-Cysteinyldopa pathway.
Overall sequence similarity suggests that the CB-PPOs in arthropods are closely related to arthropod Hc (and hexamerins, see Section 3.1.1)351,352 while fungal, bacterial, plant, and vertebrate Ty is more closely related to mollusc Hc.351 One defining structural difference between arthropod and mollusc Hc is the presence, only in the later, of a highly conserved His ligand on CuA (the Cu atom that is coordinated by residues closer to the N-terminus) that has been cross-linked to a Cys residue (Section 3.1.3). However sequence similarity,353,354 protein sequencing,355,356 and protein crystallography (vida infra) indicate that plant and fungal CB-PPOs contain a Cys-His crosslink that is absent in bacterial Ty. While not conclusive, this structural feature suggests that the coupled binuclear copper proteins evolved from a common binuclear protein and that the observed differences are a result of divergent evolution. However, the function of this divergence is not well understood.
A variety of intra and extra cellular CB-PPOs have been characterized in fungi, gram-positive, and gram-negative bacteria. The production of melanin in these organisms has been correlated to the resistance to radiation, toxic metals, oxidants, free radicals, extreme temperatures, and fungal tissue damage.357–359 Melanin is also believed to increase virulence in pathogenic fungi and bacteria through a variety of mechanisms including protection from enzymatic lysis and hydrolysis, antimicrobial compounds, and phagocytosis (the process of cellular entrapment in a membrane vesicle).359,360 In soil bacteria, CB-PPOs polymerize otherwise toxic mono and o-diphenols into a variety of polymers such as melanin, and humic acids.357 These physiological functions rely upon the presence of a copper chaperone that ensures the proper transportation and copper loading of Ty. The chaperone MelC1, in the genus Streptomyces, is critical for copper loading361,362 and transports the enzyme through the twin-arginine translocation (Tat) pathway363,364 by forming a dimer with apo Ty.365 A copper chaperone (PpoB1) has also been identified in Marinomonas,366 however a CB-PPOs copper chaperone has not been reported in fungi.
In plants, CB-PPOs polymerize a variety of o-diphenols (catechin, chlorogenic acid, dopamine, and caffeic acid are common in vivo substrates). While the majority of known COs are found in plants and fungi, some of these enzymes also possess monooxygenase activity.367–375 CB-PPOs are nuclear encoded proteins that are directed to the thylakoid lumen by a N-terminal signaling peptide via multiple pathways including the Tat pathway.376,377 While little is known about the function of the enzyme in the thylakoid lumen, it has been hypothesized that the CB-PPOs are involved in the reduction of dioxygen produced from photosynthesis.378,379 Yet most of the enzyme in the lumen is inactive due to the presence of the C-terminal domain (similar to mollusc Hc). In vivo, this latent form can be activated by free fatty acids380 or proteolytic cleavage between the two domains.381 Upon tissue damage, phenols are released from the vacuole and the CBPPOs are activated resulting in the browning of plant tissue.382–385 CB-PPOs are also localized in the trichromes of plants and are critical for the entrapment of insects.282,386 Expression levels have also been correlated to defense mechanisms against insects, pathogens, and herbivores.383,387–389 The plant signaling molecule methyl jasmonate has been shown to increase the expression levels of CB-PPO genes and corresponding protein product in many plants.384,390 A number of CB-PPOs also participate in synthesis of various natural products in plants. Ty related proteins possessing monooxygeanse activity participate in the production of plant pigments such as aurone391 and betalin392 as well as antioxidants such as creosote bush 8–8' linked lignans.393
In arthropods (most notably insects, crustaceans, and arachnids), the CB-PPO (sometimes called phenoloxidase or prophenoloxidase for the active and inactive forms, respectively) is mostly produced by hemocytes, an immune cell found in the hemolymph, and participates in clotting, encapsulation of parasites, and sclerotization of the cuticle.394,395 Similar to plants, arthropod CB-PPOs are transcribed in an inactive form that is activated by a cascade of serine proteases.394,395 However, some arthropods, such as the horseshoe crab, lack a CB-PPOs gene.395 Instead, it is believed that the immune system utilizes a clotting enzyme that induces CaOx activity in horseshoe crab Hc.396,397 A similar activity in Hc has been accomplished in vitro with protein denaturants398,399 such as SDS400–403 or urea404 and by proteolytic cleavage;405,406 however, a more general physiological function of this activity in Hc has not been established.
In animals, the most common CB-PPOs is Ty, which is responsible for melanin formation. However, some specialized functions in animals have been characterized, such as the formation of ink in molluscs including octopus.407–409 Present in vertebrates are two Ty related proteins (Trps) that are believed to have formed from gene duplication.410 While other organisms, notably plants, contain multiple isoforms of CB-PPO, the Trps enzymatically control the polymerization of L-DOPAquinone creating a more diverse melanin polymer.347 One of the Trps, DOPAchrome tautomerase (Dct or Trp2), contains a zinc cofactor and catalyzes the tautomerization of DOPAchrome to DHICA (Figure 57).411 In the absence of enzymatic control, the ratio of DHICA to DHI is 1:70 at neutral pH.344 While the metal cofactor of Trp1 is still unknown,412 it is believed to be an isozyme of Ty given that mouse Trp1 has low monooxygenase and CaOx activity.413,414 However, the reactivity of Trp1 towards DHICA is less clear. In mice, only Trp1, and not Ty, has two-electron oxidase activity for DHICA415,416 while in humans, only Ty has this activity.417 Besides catalytic activity, Trp1 also has a structural function in stabilizing Ty.418,419
Figure 57.

In vivo, GriF converts 3-amino-4-hydroxybenzaldehide to the corresponding iminoquinone while NspF converts 3-amino-4-hydroxybenzamide to a nitrosophenol.
The regulation of Ty expression levels in vertebrates is induced by environmental factors, such as UV light, which is translated to numerous signaling molecules including cyclic AMP.420 The majority of these signals lead to the production of the Microphthalmia associated transcription factor (MITF) causing the upregulation of Ty, Trps, and numerous other proteins that assist in the cellular processing of Ty.420,421 Ty, once synthesized in the cytosol, is processed in the endoplasmic reticulum (ER) and the Golgi apparatus, and is stabilized by both Trp1 and 2.418,419 In the ER, the N-terminal signaling sequence is cleaved and Ty is glycosylated, and folded with the assistance of multiple chaperones.422 Ty is then transported to the Golgi where the glycans are further modified before being exported to the melanosomal membrane that is spanned by a C-terminal domain (only in vertebrates). Copper is loaded by the metal chaperone ATP7A once Ty reaches the melanosome.423 There are numerous mutations in the signaling pathway, in Ty, or in related processing proteins that are responsible for various pigmentation disorders in humans.424 Hundreds of specific mutations of the Ty gene are known that range from point mutations to frame shift mutations cause Type I oculocutaneous albinism causing hypopigmentation and impaired vision with varying severity.424–426 Diminishing melanosome formation in hair follicle is believed to be one cause of hair graying with age.427 While numerous mechanisms have been proposed to account for these observations, recent evidence suggests that high hydrogen peroxide levels coupled to low expression of methionine sulfoxide reductase also cause grey hair by inactivating Ty via methionine oxidation.427,428 Some have also postulated that another function of Ty is the formation of neuromelanin in the brain,429–431 however others have proposed that phenols, such as dopamine, polymerize non-enzymatically.432 Even the presence and expression levels of Ty in neuronal cells are disputed.429,430,432,433 While little is known about the formation of neuromelanin, the cellular production of neuromelanin increases the likelihood of cell death in patients with Parkinson’s disease.434
Recently, a new, fourth sub-class of the coupled binuclear copper enzyme family has been discovered (in addition to Hc, CaOx, and Ty) that converts o-aminophenols to nitrosophenols (hydroxyanilinase activity, Figure 57).435 In S. murayamaensis, a hydroxyanilinase (NspF) performs the terminal step of the biosynthesis of 4-hydroxy-3-nitrosobenzamide. A similar enzyme from S. griseus (GriF) has also been shown to possess hydroxyanilinase activity in vitro on specific p-substituted phenols (vide infra).435 In vivo, GriF performs the two-electron oxidation (oxidoreductase activity) of 3-amino-4-hydroxybenzaldehyde to the corresponding o-iminoquinone in the biosynthesis of grixazone A and B, a yellow pigment and parasiticide (Figure 57).436 Hydroxyanilinases have also been shown to possess CaOx and monophenolase activity indicating that these enzymes possess all of the Ty functions as well as the additional hydroxyanilinase function.435 With o-aminophenols as substrates, Ty only performs a two-electron oxidation to produce o-iminoquinones.435,437
3.2.2. Kinetics
While a number of CB-PPOs have been characterized with various substrate specificities, Ty is the most prevalent and best characterized member. To convert phenols such as tyrosine to L-DOPAquinone, Ty binds dioxygen with a measured equilibrium binding constant of 16.5 – 46.6 µM,438,439 falling within the range of oxygen affinities found in mollusc Hc (Section 3.1.2). The rate of O2 binding to deoxy-Ty (19–23 µM−1 s−1)438,440 is also similar to mollusc Hc (5–30 µM−1 s−1).203,303,305 During catalysis, three states of Ty (and CaOx) have been characterized; deoxy ([Cu(I)2]2+), oxy ([Cu(II)2O2]2+), and met-Ty (two Cu(II)’s bridged and antiferromagnetically coupled by a hydroxide ligand) (Figure 58 and 59). Unlike in Hc where almost all of the active sites are oxygenated under air-saturated conditions, purified Ty contains approximately 85% met and 15% oxy-Ty.441,442 This can be converted to mostly oxy by a peroxide shunt reaction441 or reduction to deoxy followed by exposure to oxygen. While oxy-Ty is able to convert both phenols443 and o-diphenols to quinones,444 met-Ty is only able to oxidize o-diphenols to quinones (Figure 58 and 59). Despite similarities at the active site between oxy-Hc and oxy-Ty, the differential reactivity has been shown to result in part from differential access to the active site. Addition of small molecule ligands, such as azide, displace the peroxide from the oxy site four orders of magnitude faster in Ty than in Hc.325,445 Additionally, a substrate analogue and competitive inhibitor, mimosine, readily displaces peroxide from oxy-Ty (k = 162 h−1) but not from oxy-Hc (k << 10−4 h−1).445 Yet, similar rates of O2 binding to deoxy-Ty and Hc suggest that the active sites have similar access for dioxygen, potentially due to the presence of an O2 tunnel, which in Hc is believed to close after oxygen binding (Section 3.1.3).
Figure 58.

The catalytic cycle for catechol oxidase activity in Ty.
Figure 59.

The catalytic cycle of Ty. Red arrows indicate the preferred, steady state turnover pathway for the monooxygenase activity.
3.2.2.1 Catechol Oxidase Activity
While the enzymatic control of the oxidation of o-diphenols is essential in vivo, the oxidation of o-diphenol can occur in vitro by a variety of oxidants including dioxygen (k = 2.0 × 10⁻⁵ s−1, pH = 7.6)446 and is catalyzed by copper chloride (the rate of oxidation more than doubles with 1.0 mM CuCL2).447 While the oxidation of L-DOPA (E0’ = 0.54 V vs SHE, pH = 6.75, n = 2)448 is required to form melanin, L-DOPA also functions as the in vivo reducing agent for met-Ty (E0’ = 0.60 V vs SHE, pH = 7.0, n = 2)336 regenerating deoxy-Ty (Figure 58). Under steady state turnover conditions, mushroom Ty oxidizes L-DOPA with a kcat of ~150 s−1 (seven orders of magnitude faster than the uncatalyzed reaction) and a Km value of ~450 µM.449–451 The Km for dioxygen varies with the chemical structure of the substrate,449,452 suggesting that the binding of o-diphenols and oxygen is not ordered,14, however kinetic modeling can account for this observation assuming oxygen binds first.453 Thermodynamic parameters for CaOx activity have also been determined from kcat giving ΔG≠ ~ 13–17 kcal/mol (25° C) depending on the substrate (ΔG≠ = 14.5 kcal/mol for L-DOPA).449,454
The CB-PPOs, especially the CaOx from different plant sources, have varied substrate specificity with respect to substituted o-diphenols such as 4-methylcatechol, catechin, pyrogallol, and caffeic acid.455–460 Ty also exhibits stereospecificity with respect to L-DOPA ( for mushroom Ty).450 In vitro, the specific activity of CaOx maximizes around neutral pH.449,461 A decrease in Km from pH 4–7 corresponds to a pKa of 4.9 – 6.0 depending on the substrate.449 However, the molecular identity of this pKa or the cause of the substrate dependence is unknown. In vivo, the pH of human melanosomes (~ 3.5)462 has been shown to affect pigmentation levels due to the pH dependence of Ty.463 Increased melanin production in individuals with darker skin results in part of a more neutral melanosome, increasing Ty activity.464 The substrate dependence of catalysis has also been used as a mechanistic probe of mushroom tyrosinase indicating that substrates with similar redox potentials have kcat values that differ by an order of magnitude.438 However, substrates with no substituents such as pyrogallol (kcat = 1263 ± 63 s−1) are oxidized more rapidly than substrates with large, polar substitutents such as L-DOPA (kcat = 109 ± 9.1 s−1) consistent with the hypothesis that the rate-limiting step in the oxidase catalysis is affected by a steric interaction and not the redox couple of the diphenol.438
To determine the rate-determining step, kinetic modeling coupled with transient phase kinetics have determined that the reaction of 4-tert-butylcatechol with oxy-Ty is 20 times slower than its reaction with met-Ty.438 This model is also consistent with the observation of a steady state concentration of oxy-Ty.438 Additionally, a solvent deuterium isotope effect of 1.67 ± 0.1 on kcat during the oxidation of L-DOPA suggests the rate-limiting step includes a proton transfer.465,466 The observation of a linear free energy relationship between the Hammett parameter and Km and kcat indicates that the resonance delocalization of a negative charge affects both the binding and the rate-limiting step (ρ = −1.0 and −2.5 for Km and kcat, respectively).449 Assuming that the different enzyme sources and substrate substituents do not change the rate-determining step, these data indicate the slowest step in catalysis is the reaction of the oxy form with the diphenol. The solvent KIE and substrate dependence suggest that within this reaction, the rate-determining step is a structural rearrangement that is effected by the size of the substrate concurrent with the transfer of a proton. This proton transfer is then followed by a two-electron oxidation of the diphenol, which is not rate-determining.
3.2.2.2 Monooxygenase Activity
In mushroom Ty, the kinetics of the reaction with L-tyrosine is characterized by a ten-fold decrease in kcat (~10 s−1) compared to the conversion of L-DOPA (~ 150 s−1), while Km is similar (~300 µM) for both reactions.453,467 In steady state turnover, the slowest elementary kinetic step of the monooxygenase and CaOx steps (kMO = 103 s−1, kCO=107 s−1) have been estimated from comparing kinetic simulations to turnover frequency.468 During turnover with a non-native reductant, the o-diphenol can be trapped by borate,469 indicating that the o-diphenol is an intermediate in the catalytic cycle (Figure 59). Ty also exhibits preferential binding of L-tyrosine (Km = 0.270 mM) over D-tyrosine (Km = 1.870 mM).450 Similarly, Ty exhibits regiospecificity, reacting preferentially (lower Km and higher kcat) with p-phenols over m-phenols and is unreactive towards o-phenols such as o-fluorophenol.470 The temperature dependence of kcat in an aqueous, organic solvent mixture gives a free energy barrier of 16.1 kcal/mol (25 °C),454 which is in excellent agreement with the turnover number measured in aqueous solution (kcat = 10 s−1 at 25° C predicts ΔG‡ = 16 kcal/mol). The hydroxylation of monophenols proceeds most favorably at neutral pH.461 Over a pH range of 5–9, a decreased in KM corresponds to a pKa of 7.85,461 however the molecular origin of this protonation is currently unknown.
Unique to the reaction of Ty with monophenols is the presence of a lag period before steady state turnover is established.471 This lag phase depends on substrate concentration,449,472–474 enzyme concentration,471–474 and the presence of native (o-diphenols) 449,461,471,475,476 and non-native473 reductants. The lag phase has been attributed to the presence of met-Ty in the resting form of the enzyme, which is unreactive towards monophenols.14,442 As a result, met-Ty must be converted to deoxy-Ty before the system reaches steady state turnover.14,442 Absent any initial reductant to reduce met-Ty, it (~85% of resting Ty441) does not participate in turnover until o-diphenols such as L-DOPA are generated non-enzymatically from L-DOPAquinone (Figure 56).14,442,477 L-DOPA can then react with met-Ty forming deoxy-Ty to eventually achieve steady state turnover.14,442 Additionally, the lag phase has been shown to increase with increased substrate concentration.449,472–474 This has been attributed to phenols binding to met-Ty forming an off pathway complex,14 consistent with the observed substrate inhibition (Figure 59 bottom left).
To determine the mechanism and the rate-limiting step during turnover, substrate specificity and isotope effects have been measured. Steady state turnover of para-substituted monophenols has been shown to vary with respect to electron withdrawing substituents.469,478 A Hammett relationship between σ+ and kcat has a negative slope (ρ = −2.4 and −1.7 for A. bisporus469 and A. oryzae,478 respectively) indicating that a positive charge is created in the rate-determining step. The magnitude of ρ compared to binuclear copper model systems253,479 has been further used to support a mechanism of electrophilic aromatic substitution (EAS) (vide infra). Incorporation of deuterium at the ortho-carbon produces an inverse isotope effect (kHcat/kDcat = 0.9) supporting a mechanism of EAS where the hydroxylation is rate limiting.478 However a tritium isotope effect of 1.2 has also been measured on Ty from a different source that was originally proposed to support a mechanism of EAS where the proton transfer from the ortho-carbon was rate limiting.480 Yet others have reported being unable to kinetically distinguish between protium and deuterium or tritium.469,481 A large solvent deuterium isotope effect that is linear with respect to the concentration of D2O has been measured for various substrates (3.45 ± 0.3 for L-tyrosine).465 The strength of the isotope effect was correlated to chemical shift of the C1 carbon of the substituted phenol, consistent with the rate-limiting step being the transfer of the phenolic proton to a base upon coordination to the Cu.465 However, this interpretation is inconsistent with the Hammett relationship since this mechanism should produce a positive ρ value due to the creation of negative charge.
To probe the effect of second sphere residues on substrate binding, kinetic parameters of mutatated varients have been determined. Most intriguing is a series of varients have a differential effect on the oxidase and oxygenase reactivity of Ty indicating that monophenols and o-diphenols have different interactions with the protein pocket. For example, the sterospecific recognition of L-DOPA in mouse Ty has been attributed to His389, which is adjacent to His390, a ligand for the Cu atom closest to the C-terminus (CuB) (See Section 3.2.3).482 Interestingly, the H389L variant affects the relative Km for L and D-DOPA ( for WT and 1.3 for H389L) without affecting the sterospecific recognition of L-tyrosine.482 A comparison between the kinetics of L-DOPA and dopamine suggest that His389 forms a hydrogen bond to the carboxylic group in L-DOPA. Another variant in mouse Ty (H378Q), which is also in the vicinity of CuB, affects the substrate Km for the CaOx activity while the Km of the monooxygenase activity is unaffected (Table 15).482 A similar improvement in the oxygenase/oxidase activity has also been observed in the CuB variant (R209H) of bacterial Ty from B. megaterium, which increases the kcat for the Ty activity while decreasing the CaOx activity (Table 15).483 Interestingly, a variant of human Ty (A206T located near CuA) that is responsible for type 1 oculocutaneous albinism484 increases the oxygenase activity 204% while decreasing the oxidase activity to 15% of WT.485 These results have been interpreted to support a mechanism where phenols bind to CuA while o-diphenols bind at CuB.
Table 15.
Kinetic parameters for tyrosinase varients in the vicinity of CuA and CuB.
| CuA Variants |
wt |
Variant |
||||
|---|---|---|---|---|---|---|
| Organism | Mutation | Substrate | Specific Activitya | Specific Activitya | ||
| Human485 | A206T | L-Dopa | 7.6 | 1.1 | ||
| L-Tyrosine | 9.7 | 19.8 | ||||
| CuB Variants |
wt |
Variant |
||||
| Organism | Mutation | Substrate | Km (mM) | Vmax | Km (mM) | Vmax |
| Mouse482 | H378Q | L-Dopa | 0.46 | 38.8b | 22.2 | 32.67b |
| L-Tyrosine | 0.079 | 0.9b | 0.076 | 1.47b | ||
| B. megaterium483 | R209H | L-Dopa | 0.40 | 18.0c | 0.62 | 12.2c |
| L-Tyrosine | 0.038 | 2.2c | 1.3 | 3.8c | ||
picomol per µg per hour
milliunits mg−1
µmol min−1 mg−1
Numerous inhibitors of the CB-PPOs have also been studied for various applications in medicine and agriculture.486–489 Correlations of inhibitor structure to function have generated insight into the nature of the active site pocket. Carboxylic acids have been shown to be competitive inhibitors of L-tyrosinse and L-dopa.449 Binding kinetics for various carboxylic acids indicate that aromatic acids (such as benzoic acid) have larger binding constants (Keq = 800 M−1) than aliphatic acids (such as acetic acid Keq = 180 M−1).14 This is due to an order of magnitude change in binding rate (kon = 17 and 4 M−1h−1 for benzoic acid and acetic acid, respectively) while the dissociation rates are comparable (~1000 h−1).14 This kinetic difference, combined with spectroscopic studies (vide infra), suggests a favorable interaction between the aromatic inhibitor and the protein pocket. These results are also consistent with the weak competitive inhibition of the monooxygeanse activity in Ty by toluene (Ki = 23 mM while the Ki of benzoic acid is 0.018 mM).490 The large ΔS° of binding of toluene (54 cal mol−1 K−1) is also consistent with a hydrophobic interaction between toluene and the protein pocket.490
To further probe the mechanism of binding to the active site, the pH dependence of various inhibitors has been determined. P-nitrophenol, a slow substrate and competitive inhibitor of L-tyrosine, is a better inhibitor at low pH with a pKa of 6.82 measured from the formation constant during L-tyrosine turnover.490 This pKa is similar to the pKa of the phenolic proton of p-nitrophenol under the same conditions, consistent with the protonated phenol inhibiting turnover.490 A similar experiment with the inhibitor benzoic acid indicated that the protonated form inhibits Ty.490 A proton inventory, which measured change in the formation constant with respect to the fraction of D2O in the solvent, is linear indicating that a single proton is transferred in the rate-determining step of inhibition.490 This result excludes protonated groups such as water or hydroxide as the proton acceptor since they would involve multiple protons and would give a non-linear relationship.490 From the slope of this plot, a product fractionation factor, which is the enrichment of deturium in the product relative to the solvent concentration, was determined to be 0.64 ± 0.02.490 This fractionation factor is unique since amino acid residues generally have fractionation factors of one except cysteine which has a fractionation factor of 0.40 – 0.46.491 As a result, Strothkamp and coworkers propose that the identity of the base during inhibition could be the peroxide bridge and hypothesize that the peroxide could also function as a general base in catalysis.490 However, results from model complexes argue against this hypothesis since side-on copper peroxides are not basic.492–494 Additionally, low fractionation factors have been observed with amino acid residues other than cysteine due to the presence of low-barrier hydrogen bonds.495 These low-barrier hydrogen bonds occur when there are short heavy-atom, heavy-atom distances and similar pKa’s of the two groups involved.
These results indicate that the reaction of oxy-Ty with a monophenol is slower than the subsequent reaction of the intermediate diphenol with met-Ty. Data suggest that the monophenol first binds CuA resulting in the formation of a π-protein interaction. Subsequently, attack at the ortho-carbon in an EAS mechanism generates the diphenolic intermediate. However, the rate-determining step of this reaction is currently disputed. Some have argued that the deprotonation of the substrate upon coordination to CuA is rate limiting while others have argued that the EAS (either the attack on the ring or the deprotonation of the σ complex) is rate limiting. A similar controversy exists over the identity of the base that deprotonates the monophenol. While the pH dependence of inhibitors binding has resulted in a model where the bridging peroxide acts as the base, second sphere residues within the vicinity of the active site (vide infra) have also been suggested.
3.2.2.3 Activated Hc
While Hc has a primary function as a dioxygen tranport protein, native Hc has been shown to have weak CaOx activity.496 Significant enhancement of CaOx activity in both arthropod and mollusc Hc has been accomplished with protein denaturants398,399 such as SDS400–403 or urea,404 proteolytic cleavage,405,406 or via protein/protein interactions.396,397 These results further support early kinetic studies that suggest the functional difference between Ty and Hc is due in part to substrate access to the binuclear active site.325,445 A more limited number of both arthropod and mollusc Hc has been shown to have inducible monooxygenase activity.398,400,404–406 For example, tarantula Hc has been shown to convert L-tyrosine to DOPA quinone, however kinetic parameters were not determined.405 The monooxygenase activity of mushroom Ty and subunit g of O. vulgaris Hc have been measured for a series of p-substituted phenols (Figure 60).404 The kinetic parameters indicate that activated Hc is an inefficient tyrosinase with a Km that is two to three orders of magnitude larger in Hc (~10 mM) than in Ty (~ 0.010 mM) and a kcat that is three orders of magnitude smaller (0.099 vs 120 for the reaction of Ty and Hc with 4-methyphenol, respectively).404,469 Given that Ty and Hc have identical oxy sites, these results indicate that second sphere residues in Ty both bind substrate more tightly and lower the activation barrier for hydroxylation more efficiently than in Hc. Yet, the Hammett plot (Figure 60) of kcat for activated Hc is suggestive that both Ty and Hc operate via a similar mechanism (ρ = −1.6 and −2.4 for Hc and Ty, respectively).404,469 Incorporation of deuterium into the ortho positions of the substrate yields in an inverse deuterium isotope effect in subunit g of O. vulgaris Hc, which is suggestive of EAS where the hydroxylation of phenol is the rate-determining step.404
Figure 60.

A Hammett correlation between σ+ and the log(kcat) (s−1) is shown for mushroom Tyrosinase in red squares and O. vulgaris Hemocyanin (functional unit g) in blue circles.
3.2.2.4 Hydroxyanilinase Activity
The best-characterized hydroxyanilinase, NspF, has a kcat and Km of 260 s−1 and 0.72 mM, respectively, for its native substrate, 3-amino-4-hydroxybenzamide (Figure 57).435 Substitution of the functional group para to the o-aminophenol results in a decrease in kcat for the hydroxyanlinilase activity and for some substrates, such as the unsubstituted o-aminophenol, no hydroxyanilinase activity is observed. For this substrate, NspF instead performs the two-electron oxidation to form the corresponding o-iminiquinone (Figure 57). Interestingly, Ty only performs the two-electron oxidation of o-aminophenols.435,437 Turnover rates for the two-electron oxidase activity of S. murayamaensis NspF435 and N. crassa Ty437 with the same substrate are of the same order of magnitude indicating that the difference in selectivity between these two enzymes originates from a difference in kcat for the hydroxyanilinase activity. From the magnitude of the rates, the ΔΔG‡ for this activity in NspF relaive to Ty is expected to be greater than 4 kcal mol−1.497
3.2.3. Structure
High-resolution crystal structures of the CB-PPOs can be divided into four categories, plant CaOx (I. batatas498 and V. vinifera499), bacterial Ty (S. castaneoglobisporus500 and B. megaterium501), fungal Ty (A. bisporus502) and insect Ty (M. Sexta503) (Table 16). While the plant CaOx and bacterial and fungal Ty structures are evolutionarily and structurally similar to mollusc Hc,351 the structure of insect Ty is similar to arthropod Hc.351,352 All of the structures contain a central, globular domain that is mainly α-helical. This domain contains a 4 α-helix bundle that is highly conserved in all known CB-PPOs and Hc. In the plant498,499 and bacteria500,501 CB-PPOs, a highly conserved His-X(n)-His-X(8)-His sequence coordinates CuA while a His-X(3)-His-X(n)-His motif coordinates CuB. While in insect Ty503 (and arthropod Hc), the ligands have a His-X(3)-His-X(n)-His motif for both Cu atoms. Unique to plant CaOx377 and insect503 and vertebrate354,504,505 Ty is the presence of multiple domains that shield the active site. Plant377 and vertebrate505 CB-PPOs also contain an N-terminal signaling peptide that directs transport of the protein to the thylakoid lumen and endoplasmic reticulum, respectively. While plant CB-PPOs are associated with the thylakoid memebrane, only vertebrate CB-PPOs contain a transmembrane fragment found at the C-terminus.354,504 However, the structures of these domains are unknown since the plant CaOx structures are of the processed form that lacks this domain498,499 and no vertebrate structures have been reported.
Table 16.
Crystal structures of the coupled binuclear polyphenol oxidases.
| Enzyme | State | Resolution | PDB code |
|---|---|---|---|
| Plant CO | |||
| I. batatas498 | deoxy-CaOx | 2.7 | 1BT2 |
| met-CaOx (I) | 2.7 | 1BT1 | |
| met-CaOx (II) | 2.5 | 1BT3 | |
| PTU bound | 2.7 | 1BUG | |
| V. vinifera499 | met-CaOx | 2.2 | 2P3X |
| Bacterial Ty | |||
| S. castaneoglobisporus500 | apo-Ty | 2.02 | 1WX5 |
| apo-Ty | 1.20 | 1WXC | |
| deoxy-Ty | 1.37 | 2ZMZ | |
| met-Ty (I) | 1.33 | 2ZMX | |
| met-Ty (II) | 1.45 | 2ZMY | |
| oxy-Ty | 1.80 | 1WX2 | |
| B. megaterium501 | half apo-Ty | 2.2 | 3NQ0 |
| met-Ty (I) | 2.0 | 3NM8 | |
| met-Ty (II) | 2.3 | 3NTM | |
| met-Ty (III) | 2.2 | 3NPY | |
| met-Ty + kojic | 2.3 | 3NQ1 | |
| acid | 2.3 | 3NQ5 | |
| met-Ty R209H | |||
| Fungal Ty | |||
| A. bisporus502 | met-Ty | 2.30 | 2Y9W |
| met-Ty + tropolone | 2.78 | 2Y9X | |
| Insect Ty | |||
| M. sexta503 | met-Ty PPO1 | 1.97 | 3HHS |
| met-Ty PPO2 | 1.97 | 3HHS | |
Crystal structures of four different forms of the binuclear copper active site in the CB-PPOs have been obtained; apo, deoxy, oxy, and met. The similarity between apo and deoxy Ty indicate that the His residues are pre-aligned for Cu binding.500 In the deoxy form, the copper coordination environment is characterized as a distorted tetrahedron with a fourth, bridging water derived ligand that is absent in the deoxy structures of Hc.500 Despite the presence of a bridging solvent ligand, the Cu(I) coordination environment is mostly planer resulting in a Cu•••Cu separation greater than 4.0 Å,500 similar to the T-state of deoxy Hc (Table 13 and Table 17). Oxygen binds the deoxy site as peroxide in an µ-η2:η2 coordination mode, decreasing the distance between the two copper atoms (3.8 Å and 3.4 Å in oxy-CaOx determined from EXAFS in I. batatas498 and oxy-Ty determined from crystallography in S. castaneoglobisporus500, respectively). (Figure 61A). The shorter Cu•••Cu distance in oxy-Ty from S. castaneoglobisporus is potentially influenced by the presence of a caddy protein required for crystallization.500 A caddy protein residue (Tyr98) forms a hydrogen bond with the peroxide (OTyr98-Operoxide = 3.0 Å) causing the core to butterfly, decreasing the Cu•••Cu distance.500 The coordination environment of Cu(II) with respect to the three His ligands in oxy-Ty from S. castaneoglobisporus is staggered trigonal (Cu-NHis bond lengths range from 2.1–2.2 Å),500 similar to oxy-Hc from E. dofleini157. Also relevant to the catalytic cycle is the active site structure of met CaOx and Ty (Figure 61B and Table 17). A variety of different crystal structures of met-CB-PPOs contain two Cu(II) atoms bridged by zero, one, or two solvent derived ligands. In these structures, the distance between the coppers is extremely flexible with Cu•••Cu distances ranging form 4.9 – 2.9 Å. However, two solvent derived bridges can only be accommodated by Cu•••Cu distances that are 3.1 Å or shorter due to steric repulsion between the two single atom bridges.250 A single bridge can accommodate Cu•••Cu distances up to 4.0 Å due to a Cu-O distance of ~2.0 Å. Yet, the inherent flexibility in the Cu•••Cu distance within these different structures assists with oxygen binding (Section 3.1.5) and the shorter Cu•••Cu distances suggest that other copper dioxygen isomers, such as a bis-µ-oxo (Cu•••Cu ≈ 2.8 Å in model complexes312), would not be structurally restrained by the protein environment. However, this isomer has not been observed in any member of this enzyme family.
Table 17.
Selected geometric parameters for deoxy and met tyrosinase and catechol oxidase.
| deoxy-Ty and CaOx | |||
|---|---|---|---|
| Ty Streptomycesa,500 |
CaOx I. batatas498 |
||
| CuA•••CuB | 4.1 | 4.4 | |
| ∠ CuA, O, CuB | 136° | 131° | |
| τ CuAb | 0.6 | 0.1 | |
| τ CuBb | 0.6 | 0.3 | |
| PDB | 2ZMZ | 1BT2 | |
| met-CaOx | |||
|
I. batatas Met(I)c,498 |
I. batatas Met(II)498 |
V. vinifera499 | |
| CuA•••CuB | 3.0, 3.0 | 2.9 | 4.2 |
| ∠ CuA, O, CuB | 104°, 105° f | 104° | 92° |
| PDB | 1BT1 | 1BT3 | 2P3X |
| met-Ty | |||
|
Streptomycesa Met I500 |
Streptomycesa Met II500 |
Bacillusd Met Ic,501 |
|
| CuA•••CuB | 3.9 | 3.3 | 3.6, 3.6 |
| ∠ CuA, O, CuB | 128° | 92°, 107°f | 116, 106°f |
| PDB | 2ZMX | 2ZMY | 3NM8 |
|
Bacillusd Met IIc,e,501 |
A. bisporusc,502 | ||
| CuA•••CuB | 3.2 | 4.4, 4.4 | |
| ∠ CuA, O, CuB | 106° | 122°, 122° f | |
| PDB | 3NTM | 2Y9W | |
| atoms |
M. Sexta PPO1503 |
M. Sexta PPO2503 |
|
| CuA•••CuB | 4.5 | 4.9 | |
| ∠ CuA, O, CuB | --- | 142° | |
| PDB | 3HHS | 3HHS | |
Streptomyces castaneoglobisporus.
The shortest distance from the Cu to the N,N,N plane.
Two unique molecules in the asymmetric cell.
Bacillus megaterium
Only one subunit was fully loaded with Cu.
Contains two water derived ligands bridging the active site.
Figure 61.

The active site of oxy-Tyrosinase (A) from the bacteria S. castaneoglobisporus and a structure of met-Catechol Oxidase from I. batatas (B).
Due to their evolutionary relationship, the overall fold and Cu His ligands of bacterial and fungal Ty, plant CaOx, and mollusc Hc are very similar. While all of these structures have a CuA His ligand that is located on a flexable loop, a conserved Cys (92 in I. batats498 CaOx and 83 in A. bisporus500) is crosslinked to a CuA His ligand (109 in CaOx and 85 in fungal Ty) (Figure 61B). The amino acid sequence of two other fungal Ty355,356 and sequence similarity353,354 indicates that the Cys-His crosslink is conserved in fungal Ty. In both fungal Ty502 and mollusc Hc157, the Cys-His crosslink occurs within a conserved Cys-X-X-His motif while this crosslink is found in a His-X(4)-Cys motif in plant CB-PPOs.498,499 However, the Cys in plant CB-PPOs is not crosslinked to the adjacent His but rather a different CuA His ligand (I. batatas, His88-X(4)-Cys92 forms the motif while Cys92 is crosslinked to His109).498 While this covalent linkage is absent in bacterial Ty (Figure 61), the presence of this structural motif in vertebrate Ty cannot be determined due to the presence of three Cys rich regions that have no sequence similarity to the structurally characterized CB-PPOs enzymes.354 Intriguingly, computational modeling of a human Ty structure predicts five Cys residues located on flexible loops that are unlikely to form disulfide bonds.506 While these regions are known to be essential for protein function,504 no direct evidence for this crosslink in vertebrate Ty has been reported. The formation of this crosslink has been shown to occur in vitro upon loading Cu(II).356 The formation of a disulfide linkage leads to the reduction of the coppers allowing oxygen to bind, forming oxy-Ty that is then reduced to met upon the formation of the crosslink.356 Mutation of this crosslinked Cys was also found to decrease kcat for L-tyrosine (59 s−1 vs 1.8 s−1 in wt vs enzyme varient) but does not completely abolish enzymatic function.356 Structural data indicate that this covalent linkage restricts active site flexibility since crystal structures of bacterial Ty, which lack the crosslink, have larger disorder (B factors) at CuA.500 Yet, how this flexibility impacts catalysis is not well understood.
The second sphere residues of all structurally determined bacterial Ty and CaOx contain a structurally conserved Glu (236 in I. batatas498 and 182 in S. castaneoglobisporus500) that can act as an important acid/base residue during catalysis498 (Figure 61A). While Glu 236 is highly conserved in CaOx, the presence of a variable length, flexible loop in bacterial Ty has likely obscured the observation of this residue based on sequence comparisons.498 While three crystal structures of Ty (from S. castaneoglobisporus,500 B. megaterium,501 and A. bisporus502) have a Glu in the vicinity in the active site, some have suggested that a His ligand could also act as a proton acceptor if it is displaced by substrate binding.500 However, NMR studies on a slow substrate, p-nitrophenol, indicate that all six His ligands remain coordinated to Cu(II) when this substrate binds to met-Ty bridged by a single chloride ion.507 Additionally, the Cys/His crosslink in fungal Ty would greatly restrict the conformational flexibility of this CuA His ligand making it unlikely to act as a base in these organisms.
Unique to CaOx is a large hydrophobic residue (Phe261 in I. batatas CaOx) that shields substrate access to the CuA site (Figure 61B).498 This residue is conserved in all plant CaOx except for two, which have a Leu at this positon.381 In Ty, a smaller hydrophobic residue can be found at this position (Gly 204, Val 218, or Val 283 in S. castaneoglobisporus,500 B. megaterium501 Ty, and A. bisporus,502 respectively), which increases access to the CuA site (Figure 61A). This structural difference in CuA substrate access is consistent with the kinetic results from various Ty variants (Section 3.2.2). A structure of a variant with mutation to a residue in the vicinity of CuB (R209H varient in B. megaterium Ty) has also been determined.501 This residue is located one residue after a CuB His ligand and the wt structure with the inhibitor bound (Figure 62B vide infra) shows the position of Arg209. Kinetic characterization of this variant shows an increase in the oxygenase/oxidase activity ratio. The two different confirmations of Arg present in the wt structure suggest that this residue is more flexible than His209. Hence, His209 is believed to restrict access of diphenols to CuB supporting the hypothesis that monophenols bind CuA while o-diphenols bind CuB.
Figure 62.

An overlay of phenylthiourea (PTU) bound to Catechol Oxidase and met-Catechol Oxidase (green) from I. batatas (A). The structure of met B. megaterium Ty crystals soaked with kojic acid (KA) (B) and met A. bisporus Ty crystals soaked with tropolone (TP) (C).
Three structures with inhibitors bound have also been determined. Phenylthiourea (PTU) (Figure 62) binds the two Cu atoms in CaOx from I. batatas via a bridging sulfur atom of the thiocarbamide while the nitrogen interacts with CuB (Figure 62A).498 The binding of PTU increases the Cu•••Cu separation to 4.2 Å,causes a slight rotation of Phe261, and a movement of His244 ligand to form a π-stack. The direct coordination of sulfur to the Cu in the crystal is also consistent with the observation of a sulfur to copper CT transition at 625 nm.508 Molecular modeling of o-diphenols in this orientation favors monodentate coordination of the substrate to CuB.498 Additionally, two inhibitors that both contain an α-hydroxyketone, kojic acid (KA), and tropolone (TP), have been soaked in crystals of B. megaterium501 (Figure 62B) and A. bisporus502 (Figure 62C) Ty, respectively. However, neither inhibitor interacts directly with the Cu active site, although a direct interaction with the metal centers is observed in solution with a similar inhibitor, mimosine (Figure 63), due to the observation of mimosine to Cu CT transition at 425nm.509 Kojic acid binds to met-Ty crystals from B. megaterium with the hydroxymethyl ~ 7 Å from the active site, forming interactions with Phe197, Pro201, Asn205, and Arg209 (Figure 62B).501 Tropolone binds to met-Ty510 from A. bisporus in a similar hydrophobic pocket 3.0–3.5 Å from the Cu active site forming interactions with Val283, His263, and Phe264 (Figure 62C).502 However, the presence of a pre-binding site is consistent with kinetic measurements that indicate that both kojic acid and tropolone are slow-binding inhibitors.511,512 The most common mechanism that results in slow-binding inhibition involves the formation of a lower affinity enzyme-inhibitor complex that converts to a second, more stable complex.513 For these inhibitors, the structural characterized interaction is likely the non-convalent enzyme-inhibitor complex and the second binding site involves direct coordination to copper.
Figure 63.

The structure of various small molecule inhibitors.
While the majority of CB-PPOs are structurally related to mollusc Hc, the crystal structure from an insect (M. sexta) has also been determined (Figure 64).503 The tertiary structure of insect Ty is different from either the bacteria Ty or the plant CaOx but is similar to the structure of arthropod Hc (RMSD 1.27 Å with 41.4 % amino acid identity to L. polyphemus309). Unique to insect Ty (relative to other CB-PPOs) is the presence of three domains and a hetero dimer interface (between two isozymes, PPO1 and PPO2),503 similar to the three domains in arthropod Hc and the tight dimer interface that makes up the hexameric quaternary structure (Figure 34).309 Domain one shields the active site via Phe88 in PPO2 (Figure 64),503 which is in a similar location as the aromatic ring of PTU bound to CaOx in I. batatas498 (Figure 62A). To activate insect Ty, PPO activating protease cleaves within domain one of Ty at Arg51514,515 exposing a negatively charged surface, which is believed to dimerize with the clip domain of an auxiliary factor, the serine protease homolog.503 This interaction is hypothesized to cause a rearrangement of the tertiary structure of insect Ty, removing Phe88 from the active site,503 however the structure of this active form is unknown. Also within the vicinity of the active site in PPO2 is a basic residue (Glu395), similar to Glu236 in I. batatas CaOx (shown in Figure 61B).503 However, the structurally equivalent residues in L. polyphemus Hc309 and PPO1503 are Thr351 and Ser393, respectively. Kinetic studies suggest that Glu395 in PPO2 may assist in the two-electron oxidase activity of insect Ty since Vmax for PPO2 is approximately five times larger that PPO1.516 Yet, similar tyrosinase activity is measured in the presence of small amounts of L-DOPA.
Figure 64.

The structure of inactive, met-Tyrosinase PPO2 from the insect M. sexta has a unique base in the actives site (Glu 395) as well as Phe88 from domain 1 (in yellow) that restricts access to the active site.
Interestingly, the proteolytic activation of plant and fungal CB-PPO occurs via a different mechanism than in insect Ty. Instead of cleaving within the shielding domain, the proteolytic cleavage of plant and fungal PPO occurs between the two domains.381 While the structures of the two domains in plant, fungal, and mollusc Hc are predicted to be similar from homology modeling,381,517 the two domains are believed to be connected by different secondary structure.381 In mollusc Hc, these two domains are connected by a 24 residue α-helix,157 while the corresponding sequence in plant and fungal CB-PPOs is predicted to be disordered which is believed to favor proteolytic cleavage.381 Thus while both cleavage and a tertiary structure rearrangement are necessary to activate insect Ty, the shielding domain is directly removed by proteolytic cleavage in plant and fungal CBPPO. 381 A similar structural rearrangement has been proposed for the detergent induced oxidase activity in Hc.518 Molecular models from cryo-electron microscopy (8.0 Å resolution) suggest that domain one in arthropod Hc rotates in the presence of SDS, exposing the active site to allow substrate access.518
3.2.4. Electronic Structure
Crystallography of Hc, CaOx, and Ty reveals a common binuclear copper active site. This common molecular structure leads to identical spectroscopic features for both oxy and deoxy states. The spectral features of oxy and deoxy-Hc were described in Section 3.1.4. To summarize, the spectroscopic signature of deoxy is an intense Cu(I) preedge feature at 8984 eV in the XAS. The spectroscopic signatures of oxy are the O22− → Cu(II) CT transitions at ~345 nm (ε ~ 20,000 M−1 cm−1) and ~580 nm (ε ~ 1,000 M−1cm−1) which upon excitation with laser light leads to a low intraperoxide stretch at 755 cm−1 that downshifts to 714 cm−1 in the 18O2 isotopologue, and a “νCu•••Cu” at 274 cm−1 in the resonance Raman spectrum, consistent with a µ-η2:η2 binuclear copper peroxo core (Figure 65).519 Both oxy and deoxy are EPR silent. As presented above, a third EPR silent state found during catalysis for Ty and CaOx that is not functionally relevant in Hc is called the met or fully oxidized bicupric state.
Figure 65.

Comparison of the spectral features of oxy-Tyrosinase and oxy-Hemocyanin. Left: UV-Vis absorption; Right: resonance Raman (364 nm excitation).
Met-Ty and CaOx have been crystallographically characterized, and contain a water derived bridging ligand between the Cu centers (Figure 62B and 64). XAS of met-Ty indicates the Cu ions are in the 2+ oxidation state.520 However, met-Ty is EPR silent, indicating the Cu(II) ions are strongly antiferromagnetically coupled. Given the coupling, the water-derived bridge is likely a hydroxide anion, which would be a far more efficient superexchange pathway than a water bridge and the pKa of the proton to form a µ-hydroxo bridge is estimated to be < 5. A hydroxide anion bridge is supported by EXAFS on the met form which indicates a 1.8 Å scatterer on Cu.508 Met-Ty does not absorb strongly in the visible region. A ligand field band is observed at 680 nm in the absorption spectrum, and a moderatly intense feature at ~325 nm (ε: 3500 M−1cm−1) is observed and assigned as the OH− → Cu(II) CT transition. This feature is also present in the CD spectrum.445
Despite the similarity between the active sites of Hc, CaOx, and Ty, substrate access to the sites is very different as described in Section 3.2.2. Access to the site is not the only issue, as the substrate interaction with the protein pocket at the active site of Ty and CaOx is also essential. From Section 3.2.3, crystallographic characterization of Ty with inhibitors bound display the inhibitor bound to the Cu directly or near the site in a secondary binding site. The structure of CaOx solved with the inhibitor phenylthiourea bound to the active-site in a bridging configuration between the Cu ions (Figure 62A). All other information regarding the interaction of the active-site with substrate and substrate analogs comes from spectroscopy. In a key experiment, the substrate analog mimosine was used as a probe of substrate binding in met-Ty. Upon addition of mimosine, an absorption feature was observed at 425 nm, which was assigned as a mimosine → Cu(II) charge transfer transition (Figure 66).509 The detection of a CT transition is significant, as it requires orbital overlap between the donor phenolate and the acceptor Cu, indicating that mimosine is bound directly to Cu. Further information comes from the EXAFS, wherein a slight increase in intensity of the dipole forbidden 1s → 3d transition was observed upon binding mimosine. This increase is consistent with a distortion of the tetragonal environment of the Cu.520
Figure 66.

The addition of mimosine to met-Ty leads to observation of a CT transition in the absorption spectrum.
As a detailed spectral probe of mimosine binding to the active site of Ty, a half-met derivitive was created in an analogous manner to that for Hc (See Section 3.1.4). The half-met derivative consists of a Cu(I)Cu(II) mixed-valent site with an overall S = ½ ground state. EPR spectroscopy of half-met Ty reveals a localized mixed-valent state, displaying a normal Cu(II) type spectrum. Upon addition of mimosine to half-met Ty, significant changes occur in the EPR spectrum (Figure 67).509 Specifically, the EPR spectrum becomes more rhombic with a splitting of g⊥, the hyperfine coupling at gz decreases, and a large hyperfine coupling is observed on gx (gz = 2.290, gx = 2.115, gy = 2.023, Az = 111.3 × 10⁻⁴ cm−1, Ax = 15.0 × 10⁻⁴ cm−1, and Ay = 72.0 × 10⁻⁴ cm−1). Taken together, these spectral changes require a substantial amount of dz2 mixing into the dx2-y2 ground state. This mixing would occur if a trigonal bipyramidal structural perturbation accompanies the binding of mimosine to copper (Figure 7B).
Figure 67.

Changes observed in the EPR spectrum of half-met Ty upon addition of mimosine.
In a similar manner, the binding of aliphatic and aromatic carboxylates was also investigated with the half-met Ty derivative.14 Whereas binding of aliphatic carboxylates produced no significant change in the EPR spectrum, binding of aryl carboxylates that are competitive inhibitors results in EPR spectral changes that are analogous to those observed in the mimosine adduct (Figure 67), which indicate a similar trigonal bipyramidal distortion. The carboxylate binding is also accompanied by the appearance of a positive CD transition at 10,000 cm−1, the origin of which is a ligand field transition that gains intensity and lowers in energy further supporting a distortion of the Cu towards a trigonal bipyramidal geometry. Thus, substrate analogs bind directly to Cu, and when these contain aromatic substituents there is an additional interaction with the protein pocket that stabilizes a trigonal bipyramidal distortion of the site along the reaction coordinate. From the differences in binding constants (150 M−1 for alkyl versus 1000 M−1 for aryl substrates) the interaction with the pocket is worth −1.3 kcal/mol. Two candidates for the origin of this stabilization are: 1) π-π interaction with a copper bound histidine or 2) interaction with the strictly conserved Asn205 (Figure 62). However, significant efforts are required to develop an understanding of this protein pocket effect.
3.2.5. Mechanism
3.2.5.1 Diphenolase
The mechanism of Ty is described by two interpenetrating catalytic cycles that comprise monophenolase and diphenolase activity (Figure 68). The diphenolase cycle (the outer cycle in Figure 68) has a reductive and an oxidative phase and requires two substrates and one dioxygen for each turnover. In the reductive phase, the 1,2-catechol binds to met to generate met-D. The catechol substrate reduces the Cu(II) ions to Cu(I) concomitant with release of the quinone to generate deoxy. In the oxidative phase, dioxygen binds to deoxy to generate oxy, which subsequently reacts with 1,2-catechol to generate oxy-D, finally releasing quinone and water to generate met. In essence, the enzyme is catalyzing the four-electron reduction of dioxygen to water in discrete 2 electron steps using the substrate catechol as a two electron donor without the release of hydrogen peroxide.
Figure 68.

Interpenetrating mono and diphenolase catalytic cycles.
The structural requirements for diphenolase activity are less than those required for the monophenolase activity, as catechol oxidases are unable to perform monophenolase reactions. Nonetheless, information regarding the structural requirements of the diphenolase cycle is emerging. In the oxidative phase, oxy-D state has traditionally been drawn with catechol bridging the two Cu centers. However, in oxy, the Cu ions are efficiently antiferromagnetically coupled through the peroxide bridge, and thus the twoelectron oxidation of the catechol could proceed via coordination to a single copper. Support for this possibility comes from mechanistic studies on Ty variants (see Table 15), which distinguished effects associated with residues near the individual Cu ions. In these studies, mutations in the vicinity of CuA resulted in no effect on the catechol oxidase activity, whereas mutations to residues around CuB affected this activity. Taken together, these mutational studies suggest that the protein pocket is exerting some influence on the diphenolase reaction, and that binding to a single metal site should be considered.
3.2.5.2 Monophenolase
The monophenolase cycle (inner cycle of Figure 68) requires one phenol substrate and one dioxygen per turnover, and generates one quinone product and one water. The cycle begins with the addition of dioxygen to deoxy to generate oxy. Next, reaction of oxy with a phenol is believed to generate the enzyme-oxygen-phenol ternary complex oxy-T, which is the key intermediate in the catalytic cycle, although this has not yet been observed.521 Interpretations of mutagenesis studies favor coordination of the phenol to CuA since mutations of residues in the vicinity of CuA had an effect on the Ty activity (see Section 3.2.2). It is generally understood that the phenol substrates coordinate directly to a copper, rather then docking into the protein in the vicinity of the Cu2O2 core (as found for example in cytochrome P450)522 based on the spectral features observed upon addition of substrate analogs (Section 3.2.4) to met and half-met Ty. These spectral features require that the phenol-analogs coordinate directly to the Cu. Nonetheless, direct coordination of phenol to Cu in oxy-Tyr has not been demonstrated and model studies of Karlin and coworkers (vide infra) show that monoxygenation can occur without direct substrate coordination.
The intimate details of the attack of oxygen on the ring subsequent to oxy-T has been the subject of intense research efforts that have spanned decades. The consensus overall mechanism of the hydroxylation of the phenol ring is via EAS based on: 1) the negative slope of the Hammet parameter (ρ), which indicates positive charge buildup in the intermediate (Section 3.2.2), 2) correlation to the EAS mechanism of monoxygenation of phenols by cleaved mollusc Hc that proceeds with a similar Hammet parameter and an inverse 2H isotope effect, and 3) correlation to functional model studies (vide infra) which have been conclusively demonstrated to proceed via EAS. The remaining issue pertains to the nature of the Cu2O2 core in the ternary complex oxy-T, an issue raised based on observations in model studies.
Tolman and coworkers discovered that the reaction of dioxygen with certain Cu(I) model complexes resulted in a product wherein the O—O bond was broken to generate a bis-µ-oxo Cu2(O)2 core (Figure 69).127 X-ray diffraction studies demonstrated a long O•••O (2.287 Å) and a short Cu•••Cu distance (2.794 Å). This bis-µ-oxo core was in equilibrium with the “side-on” peroxo Cu2(µ-η2:η2-O2) isomer, an equilibrium that was sensitive to environmental factors including solvent and anions, indicating that these two species were necessarily close in relative free energy for the ligand systems studied. The isomerization from side-on peroxo to bis-µ-oxo is accompanied by significant spectral changes (Figure 70), which have facilitated an in depth study of the electronic structure change associated with this isomerization. An essential detail is that the pre-edge feature at 8979 eV in the side-on peroxo species that is characteristic of Cu(II) (see Section 2.2.5) shifts up in energy by 1.9 eV indicating that the oxidation state of the Cu has increased from Cu(II) to Cu(III). Thus, two electrons from Cu break the peroxo bond. The process can be understood from the correlation of the molecular orbitals upon isomerization (Figure 71).129 As described in Section 3.1.4, the side-on bridged peroxide species on the left has a peroxo group in which its σ* is accepting electron density from Cu dx2-y2 HOMO (i.e. backbonding). As the O—O bond is lengthened from 1.4 Å to 2.8 Å, the σ* of the peroxo is decreased in energy and charge flows from the Cu(II) into this σ* orbital to cleave the O—O bond. In the bis-µ-oxo species on the right of Figure 69, complete transfer of a pair of electrons (one from each Cu(II)) has taken place leaving two µ-oxo groups and two Cu(III). This change in electronic structure leads to two additional diagnostic spectral changes. A new intense charge transfer transition appears at lower energy (400 nm in the bis-µ-oxo compared to 350 nm in the side-on peroxo) corresponding to an oxo → Cu(III) CT transition to the new LUMO on the Cu(III)s. Laser excitation into this band leads to a different resonance Raman spectrum, where the O—O stretch of the side-on peroxide is replaced by an intense peak at ~600 cm−1, assigned as the symmetric Cu2O2 core expansion (Figure 70 bottom). These side-on peroxide and bis-µ-oxo structures provide distinct frontier molecular orbitals (FMOs), which are low lying unoccupied orbitals with significant oxygen character for good overlap with substrate, for electrophilic attack on the π density of the substrate ring. In a side-on peroxo case, the LUMO is Cu(II) based with significant O22− π*σ character and in the bis-µ-oxo case, the Cu(III) LUMO has significant (O2−)2 σ* character (Figure 71). The existence of this equilibrium in model studies raises the possibility of a bis-µ-oxo participating in Ty chemistry upon substrate coordination to the Cu in oxy-T in Figure 68.
Figure 69.

Peroxo & bis-oxo equilibrium.
Figure 70.

Spectral changes accompanying peroxo (blue) to bis-μ-oxo (green) equilibrium in X-ray Absorption Spectra (top), absorption (middle), and resonance Raman (bottom) spectra.
Figure 71.

Correlation of the frontier molecular orbitals between a Cu2(O2) (left) and Cu2(O)2 (right).
Indeed, chemical precedence for this hypothesis has been generated by Stack and coworkers using the dbed (N,N-di-tert-butylethylenediamine) ligand framework (Figure 72).479 From resonance Raman spectra, the precursor complex is a µ-η2:η2 peroxo [dbedCuIII]2(O2) (vo-o = 730 cm−1); reaction with phenolate at cryogenic temperatures (−120°C) results in phenolate binding which drives the formation of a discrete intermediate {[dbedCuOPh]-(O)2-[dbedCu]}, wherein the O—O bond is cleaved, resulting in a bis-µ-oxo core, based on the loss of the 730 cm−1 O—O feature of the side-on peroxide with concomitant growth of the 600 cm−1 feature of a bis-µ-oxo core (Figure 72 left). Upon warming, the phenol is hydroxylated; a process that has been attributed as an EAS mechanism based on its inverse isotope dependence (kH/kD = 0.9) and phenol substituent effects (σ+ correlation, ρ = 1.4). Monitoring this process by resonance Raman spectroscopy indicates the loss of bis-µ-oxo at 600 cm−1 and the growth of the carbonyl stretch of the oxygenated product, demonstrating that the bis-µ-oxo is directly responsible for oxygenation of the ring (Figure 72 right).
Figure 72.

Resonance Raman spectra (left) showing conversion of formation of a bis-μ-oxo upon phenolate binding to the peroxo and (right) monooxygenated phenolate product, with oxygen isotopic substitutions, bound to copper that is formed from the decay of the bis-μ-oxo complex (inset).
DFT calculations correlated to the spectral data have been performed to quantitatively assess the reaction coordinate.523 The phenolate binds axially to the side-on peroxo core, and undergoes a rotation into the equatorial plane, which drives the formation of the bis-µ-oxo isomer. This orientation is suitable for proximal attack on the ortho position of the ring. Inspection of this process reveals that the frontier molecular orbital (the LUMO) that is available for EAS in bis-µ-oxo complexes is the antisymmetric combination of the Cu 3dx2-y2 orbital which contains the oxo σ* character (Figure 73 left). Two electrons from the ring are transferred to reduce the Cu(III) to Cu(II), forming the EAS sigma complex (Figure 74). Finally, the reaction trajectory is completed by deprotonation of the ring to yield a bidentate bridged catecholate species. Taken together, these studies demonstrate that it is feasible for a bis-µ-oxo to be the reactive intermediate during tyrosinase catalysis, formed by coordination of phenolate to the Cu with substrate rotation into the equatorial plane.
Figure 73.

Reactive frontier molecular orbitals (LUMO and LUMO+1) of {[(dbed)Cu(OPhMe)]-(O)2-[Cu(dbed)]}+1 which represent σ and π acceptor channels for electrophilic aromatic substitution of the phenolate ring.
Figure 74.

Mechanism of biomimetic tyrosinase model complex
Earlier, Karlin and coworkers demonstrated that Cu-peroxo adducts were also competent for EAS to yield phenols.524–526 They synthesized a scaffold based on a m-xylyl bridge to generate the µ-η2:η2 peroxo complex [Cu2(NO2-XYL)O2]+ (Figure 75). This complex, upon warming, hydroxylates the xylyl tether. The rate of oxidation is dependent on the substituents on the tether, which correlates to the Hammett σ+ parameter with a ρ value of ~ 2.1. When the reactive ring carbon position is methylated, an NIH shift was observed.525 These observations strongly indicate an EAS mechanism. The reaction has been monitored spectroscopically by resonance Raman (a 750 cm−1 O—O stretch is observed in this µ-η2:η2 peroxo; no 600 cm−1 stretch of a bis-µ-oxo is present, therefore there is no evidence for involvement of this species along the reaction), and as shown in Figure 76, the disappearance of the peroxo structure was coupled to the growth of C-O stretch of the phenolate product. These studies indicated that the µ-η2:η2 peroxo core is also competent for EAS of exogenous substrates. Calculations were performed on this model system to evaluate the reaction coordinate. The side-on peroxo attacks the ring to generate an sp3 hybridized carbon, followed by electron transfer from the ring directly in the peroxo. Importantly, the transfer of the electrons proceeds without intermediacy of a bis-µ-oxo along the reaction coordinate.
Figure 75.

Thermal decay of [Cu2(NO2-XYL)(O2)]2+ results in an intramolecular ligand oxidation product.
Figure 76.

Resonance Raman spectra of the decay of a 4 mM solution of [Cu2(NO2-XYL)(O2)]2+ in acetone which demonstrates the loss of the ν(O—O) band of the peroxide adduct concomitant with the growth of a ν(C=O) of the product without presence of a Cu2(O)2 adduct (to a 0.005 mM detection limit).
Given these two model systems that demonstrate both bis-µ-oxo and side-on peroxo cores are competent for the EAS of phenols, the timely question is which does Nature utilize as the active oxidant in Ty and what are the factors that control this selection. The lack of a trapped intermediate state with phenol bound to the oxy core has motivated theoretical investigation into the likelihood of the peroxo/bis-µ-oxo equilibrium in Ty. DFT studies deemed the bis-µ-oxo to be prohibitively uphill from the µ-η2:η2, and thus an unlikely intermediate.131,527,528 However, different functionals suggest this possibility is feasible. It is useful to consider the structural factors required to direct the core towards peroxo or bis-µ-oxo descriptions, and the impact of the protein pocket on structure. One factor that derived from the studies on the binuclear copper complexes in Figure 74 is the rotation of the phenolate donor ligand into the equatorial plane as being essential for bis-µ-oxo formation. It could be envisioned that the protein pocket controls the orientation of the phenol relative to the Cu2O2 core. In this context, two observations provide insight. First, in the binding of aliphatic versus aromatic carboxylates to met-Ty it was found that substrate binding is favorable in the aromatic case by an additional ~1.5 kcal/mol due to interactions of the phenol ring with the active site pocket. Second, the EPR spectrum of mimosine bound half-met Ty (Figure 67) showed a significant trigonal bipyramidal distortion about the copper, indicative of the active-site influence on the orientation of the phenol. These observations suggest that the pocket influences the orientation of the phenol prior to and during electrophilic attack and the key issue is whether a major rearrangement of the substrate occurs before the transition state of the EAS.
To complete the monophenolase catalytic cycle, the face of the phenol ring rotates towards the oxygen of the core to orient the ortho carbon into position for electrophillic attack. During the attack, the electrons are transferred to the dioxygen (or to the Cu’s directly in the case of a bis-µ-oxo oxidant) and the C—O bond is formed in a sigma complex. The proton is removed from the ring to the distal O to yield an orthodiphenolate that bridges the Cu(II) ions, perhaps asymmetrically as in Figure 74. Further protonation of the resulting µ-OH to H2O leads to the reduction of the Cu ions and a release of quinone, thus reforming the deoxy state.
A final observation of the hydroxylation of phenols by synthetic complexes is that the hydroxylation occurs when phenolate,479,529 rather then phenol,530,531 is reacted with the Cu2O2 cores. Reaction of the synthetic copper dimers with phenol does not result in the hydroxylation product, but instead results in the radical coupling products, suggestive of H• abstraction competency of Cu2O2 cores in addition to EAS.531 The relevance of this synthetic observation for tyrosinase catalysis is unclear but suggests an intimate relationship between protons and mechanism in Ty catalysis. The identity of the associated active site base has been the subject of investigation, with three possible candidates emerging. First, it has been proposed that the bridging peroxo itself is basic, a hypothesis that is contradicted by model studies wherein side-on peroxo adducts have been shown to be electrophilic, rather then nucleophilic. Second, it has been proposed that a Cu bound His could dissociate and be the destination of the proton. However it is noteworthy that the His believed to be involved is in fact crosslinked to a nearby Cys residue in nearly a third of the Ty homologs, and a crosslink would be expected to rigidify this residue. In addition, the dissociation of His from the Cu is expected to be a thermodynamically uphill process. Finally, a third possible base that is somewhat underexplored in the literature is a conserved glutamate in close proximity to the Cu2O2 core (see Section 3.2.3). Regardless of the identity of the base, the issue of proton movement is important, based on the observation of a solvent 2H isotope effect (Section 3.2.2).
3.2.5.3 Hydroxyanilinase
Reaction of o-aminophenol with Ty and CaOx yields the two electron oxidation product, o-iminoquinone, in a reaction analogous to diphenol oxidation by CaOx. Recently it was found that a fourth member of the coupled binuclear copper family (NspF) catalyzes an alternative reaction, the oxygenation of o-aminophenol to nitrosophenol, reactivity coined hydroxyanilinase activity. Comparison of the hydroxyanilinase versus CaOx activities in NspF versus a close homolog GriF and Ty revealed that the difference in selectivity leading to the oxygenated nitrosophenol product was a result of differences in the oxygenase (hydroxyanilinase) activity rather than differences in the oxidase (CaOx) activity (see Section 3.2.2).497 This observation was suggestive of protein secondary coordination impacts on the reaction landscape rather than intrinsic differences in the reactivity of the Cu2O2 cores, which appear indistinguishable spectroscopically. The reaction trajectories were evaluated by DFT and further supported this secondary coordination environment control hypothesis, in that the structural requirements for the hydroxyanilinase reaction differed from that of either oxygenation of monophenols or oxidation of diphenols (Figure 77). Specifically, the transition state for oxygenation of o-aminophenols by an electrophilic attack mechanism required a six member ring, whereas oxygenation of monophenols requires a five member ring. Thus, the substrate orientation is significantly different in the transition state, which would be expected to be a major factor in controlling the selectivity of the reaction as the protein pocket must accommodate this different in substrate orientation. Details regarding which specific residues direct the reaction landscape require a crystal structure of NspF, but the coupled binuclear Cu family of enzymes provide an important series where the protein pocket different types of reactivity utilizing equivalent Cu2O2 active sites.
Figure 77.

Overlay of the transition states of monophenylase and phenylanilinase with similar Cu2O2 cores
3.3 O2 Activation for H-atom abstraction: Non-coupled Binuclear Copper Enzymes (role of exchange coupling in reactivity)
3.3.1 Enzymology
In addition to the coupled binuclear copper enzymes Tyrosinase, Catechol Oxidase and NspF, there exists another class of binuclear copper proteins where the coppers are at a distance of ~11 Å with no bridging ligands such that they do not electronically couple. These enzymes, the non-coupled binuclear copper enzymes, accomplish activated C-H bond hydroxylation for the synthesis of physiologically important neurotransmitters and hormones.532 Three enzymes comprise this class: the well studied eukaryotic proteins dopamine β-monooxygenase (DβM; EC 1.14.17.1) and peptidylglycine α-hydroxylating monooxygenase (PHM; EC 1.14.17.3) and the recently identified insect tyramine β-monooxygenase (TβM).533,534
The non-coupled binuclear copper enzymes catalyze the regio- and stereospecific hydroxylation of secondary C-H bonds (Figure 78). This hydroxylation is a two-electron oxidation, which is coupled to the reduction of dioxygen to yield one H2O and the incorporation of the second oxygen into the substrate therefore these enzymes are classified as monooxygenases. Two electrons come from the substrate and the second two electrons come from the oxidation of two equivalents of ascorbate to semidehydroascorbate.535–537 These enzymes have two coppers per subunit. On the basis of structural538 and spectroscopic539 studies (vide infra), the coppers have different coordination environments, either CuH (or CuA) and CuM (or CuB). CuM is the site where dioxygen is activated and substrate binding occurs while CuH serves as an electron transfer site.540
Figure 78.

Respective reactivity of the non-coupled binuclear copper enzymes
DβM, a glycoprotein found in mammalian neurosecretory vesicles of the adrenal gland, carries out the catalytic conversation of dopamine to norepinephrine (Figure 78) in the catecholamine biosynthetic pathway.541 DβM activity is physiologically critical for the regulation of dopamine and epinephrine. DβM genetic deficiency in humans results in patients being unable to synthesize norepinephrine and epinephrine resulting in severe hypotension.542 Additionally, in mouse studies it has been found that knocking out the DβM gene results in fetal death in utero, verifying that DβM is also essential for fetal development.543 Inhibitors have been developed for DβM as antihypertensive agents in effort to limit the production of norepenephrine. The first compound to reach clinical testing was fusaric acid, 544 but most modern inhibitors are based on an imidazole-2-thione scaffold and are significantly more potent.545 DβM is also capable of carrying out hydroxylation chemistry on a series of phenylethylamine compounds similar to dopamine.546 Interestingly, the presence or absence of the phenol –OH group does not impact turnover suggesting that aryl alcohol group does not constructively interact with the protein (Figure 78).547 DβM is also capable of catalyzing various non-native oxidation reactions including sulfoxidation,548 selenoxidation549 and epoxidation550 of olefins. The protein has been isolated from a number of mammalian sources, most studied of which are bovine551 and rat552. The protein exists in both soluble553 and membrane-bound554 forms. Soluble DβM can be either a dimer or tetramer consisting of two and four identical 73-kDa monomeric subunits, respectively.555 The membranebound enzyme is exclusively a tetramer and is composed of two soluble-like subunits of 73-kDa and two other distinct 77-kDa subunits. It is thought that this protein exists in equilibrium between the membrane-bound and soluble forms where the soluble form is released into the blood and cerebrospinal fluid.555
TβM catalyses the hydroxylation of tyramine to octopamine (Figure 78), a crucial neurotransmitter that is responsible for a wide variety of physiological functions including neuromuscular transmission, behavioral development and ovulation556,557. TβM is a homologue of DβM exhibiting 39% and 55% sequence identity and similarity, respectively.558 It has been isolated from Lobster559, Moth560 and Drosophila561, but little is understood about the enzyme in vivo. Recombinant TβM (rTβM), from Drosophila, has been expressed and used in site-directed mutagenesis studies (vide infra). rTβM exists in solution primarily as a ~69 kDa monomer with small amounts of dimer.561
PHM exhibits 32% sequence identity with DβM and is one component in the bifunctional membrane-bound enzyme peptidylglycine α-amidating monooxygenase (PAM), which facilitates hydrolytic amidation of peptide hormones.562,563 PAM is capable of carrying out alternative monooxygenase reactions including sulphoxidation, amine N-dealkylation and O-dealkylation.564 Peptide amidation occurs in two steps. The first is accomplished by PHM that hydroxylates the α-carbon of a C-terminal glycine-extended peptide (Figure 78). This is followed by hydrolytic amidation of the geminal aminoalcohol by peptidyl-α-hydroxylglycine-α-amidating lyase (PAL) yielding the activated N-terminal peptide hormone. This process is crucial in the activation of hormones since over half of all peptide hormones must be α-amidated to be bioactive.565 PAM has been isolated from a number of mammalian sources including bovine563, mouse566 and rat567 and is found in Drosophila568. Deletion of the PAM gene in Drosophila results in the absence of amidated peptides and leads to late embryo or early larva death.569 Additionally, PAM knockout mice died midgestation consistent with the amidated peptides being crucial for fetal development.570 Rat PAM (~120 kDa) undergos endoproteolytic cleavage to give a soluble PHM domain of 45 kDa and a membrane-associated (70 kDa) or soluble (50 kDa) PAL domain where each domain was catalytically active in their respective reactions.571 This recombinant form has been used in site-directed mutagenesis experiments (vide infra). An important development in the study of this enzyme came from the development of a recombinant form of PAM from rat. A 35 kDa protein was isolated, exhibiting only PHM activity, denoted as the PHM catalytic core (PHMcc).572 This is the predominant form used in kinetic, crystallographic and spectroscopic studies (vide infra).
As stated above, these proteins contain two copper ions per subunit in different coordination environments, which are suggested to have different roles in catalysis. Blackburn has succeeded in producing a ‘half-apo’ form of PHM.573 This was accomplished by using CN− to remove Cu from the protein with CO bound selectively to CuM (vide infra). For DβM the tetrameric form can exist as either an 8 Cu or 4 Cu form, where the 4 Cu form is thought to contain only CuM.574 Whether this form is catalytically active has been the subject of debate. Another human protein was found to exhibit high sequence similarity to these enzymes and classified as a member of this family. Named monooxygenase-X (MOX), this enzyme is the least well-understood member as its chemistry and function are still unknown. MOX is not secreted, as is DβM, but membrane bound in the endoplasmic reticulum of both endocrine and non-endrocrine cells and highly expressed in the salivary gland and ovaries. 575
Together, these enzymes exhibit distinct physiological functions but are complimentary in their stereospecific hydroxylation chemistry. The following sections deal with the similarities and differences in reactivity of these proteins and how they relate to the mechanism of substrate hydroxylation and dioxygen activation by the non-coupled binuclear copper sites. We then correlate their reactivity to that of the coupled binuclear Cu enzymes and consider the role of exchange coupling in determining reactivity.
3.3.2 Kinetics
The enzymes in this group exhibit similar kinetics and therefore equivalent mechanisms.532 Generally, two molecules of ascorbate reduce the coppers of the fully oxidized resting state in a ping-pong mechanism576 (vide infra)–giving the reduced enzyme and two molecules of semidehydroascorbate. Substrate and dioxygen then bind to the reduced enzyme yielding a ternary complex577 from which dioxygen activation and substrate hydroxylation occur to give product and oxidized enzyme.
3.3.2.1 Steady State Kinetics
Extensive steady-state kinetic studies533, including isotope effects, have been performed on all three of the enzymes in this group. Under conditions of excess ascorbate where the reduction of the enzyme is facile, the two steady-state parameters are the catalytic efficiency (kcat/Km), which accounts for all reversible steps leading to the first irreversible step (i.e., the C-H abstraction step) and turnover number (kcat), which includes all steps after the first irreversible step leading to product and resting enzyme.532 The perturbation of these kinetic parameters is important for the discussion of isotope effects later in this section.
These proteins turnover in the presence of substrate, ascorbate and dioxygen. Dioxygen dependent steady-state kinetics for these enzymes are comparable where all enzymes exhibit Km(O2) ~ 50–500 µM.534,580,581 The dependencies on substrate will be discussed in terms of the most studied substrates of the respective enzymes. The substrate dependent steady-state parameters are enumerated in Table 18. It is found that these enzymes have comparable kcat and Km values. It should be noted that hippuric acid is the smallest substrate and most versatile for isotope substitution for PHM (vide infra), however, many glycine terminal peptides are found to be catalytic for PHM (e.g., Tyr-Val-Gly).581 These extended peptides bind tighter to PHM (Km ~ 10 µM), which may be due to constructive protein-substrate interactions absent in hippuric acid. Additionally, the substrate dependence on enzyme activity is found to exhibit Michalis-Menton steady-state kinetics for DβM and PHM, while TβM is inhibited (Ki = 3.5 mM) by substrate at tyramine concentrations greater than 250 µM.534 It is suggested for this enzyme that tyramine binds to the oxidized state since enzyme inhibition diminishes with increasing ascorbate, generating more reduced enzyme. This is also supported by an increase in inhibition with additional dioxygen, generating more oxidized enzyme.534
Table 18.
Representative Steady-State parameters for the non-coupled binuclear copper enzymes.
These enzymes exhibit similar Km values for ascorbate and a ping-pong mechanism for enzyme reduction. PHM exhibits an apparent ascorbate Km(asc) = 0.25 mM, where increasing the ascorbate concentration leads to an increase in both kcat and Km for substrate (Tyr-Val-Gly).582 Therefore, the rate of enzyme reduction increases the rate of substrate turnover. Interestingly, no ascorbate is found to be bound in the reported crystal structures for PHM, where reductant is in significant excess (vide infra)125,583,584. In contrast to PHM, DβM turnover velocities decrease with increasing ascorbate fitting to negative cooperatively with a Hill coefficient in the range of 0.15 – 0.30.585 This is reflected in the increase of apparent Km(asc) of 0.05 – 0.10 mM at high ascorbate concentration to > 10 mM under limiting reductant concentration. Due to the substrate inhibition of TβM, only an estimated Km(asc) ≥ 16 mM was obtained.534 Additionally, it was found that kcat/Km(asc) decreases with added tyramine, which is not observed in the other two enzymes. These results, along with the substrate inhibition, indicate that tyramine competes with ascorbate for binding to the oxidized enzyme. Therefore, an ascorbate binding site can be invoked for TβM where no such a binding site has been found for PHM and DβM.
Significant mechanistic insight has come from the substrate primary isotope effect on kcat and Vmax/Km, (Table 19). The isotopic perturbations do not significantly alter kcat indicating that C-H activation is not rate limiting.534,586,587 Furthermore, dioxygen 18O kinetic isotope effects on kcat/Km values (table 20) values are consistent with dioxygen reduction also not being rate limiting since they are below the maximum equilibrium isotope effect for the formation of a superoxo (1.0339). 588 Interestingly, with deuteron-substrate, the measured 18O isotope effect for both PHM and DβM increases implying that changes in the dioxygen bond order are coupled reversibly to the C-H activation step.578,587 If dioxygen activation were irreversible, the magnitude of the 18O isotope effect would be independent of substrate deuteration. In other words, O-O bond cleavage can only occur after H-atom abstraction (vide infra).
Table 19.
Primary Deuterium isotope effects on steady-state parameters
Table 20.
Dioxygen 18O isotope effects with primary proteo- and deterio- substrate.
Since the isotope perturbations do not significantly impact turnover, in contrast to the expected behavior for an enzymatic process where C-H and/or O-O activation would be rate limiting, dissociation of product has been proposed as the likely rate determining process in catalysis. This is consistent with the fact that enzyme reduction and reoxidation can be ruled out as rate determining based on single turnover studies, where the latter process includes the intramolecular electron transfer step (vide infra). 540,576
3.3.2.2 Dioxygen and Substrate Order
To determine the order of the reaction of substrate and dioxygen in catalysis, two general methods were employed. The first comes from the interpretation of the intercepts of reciprocal (1/v versus 1/[O2]) plots where varying amounts of reactants change the intercepts depending on the formation of the ternary complex589. The other, developed by Klinman measured the substrate primary isotope effect on kcat/Km(substrate) as a function of dioxygen concentration.590 Since this parameter contains all rates up to the first irreversible step (k5 in Figure 79), which is the step that exhibits the isotope effect, the effect of varying dioxygen on the isotope effect will reflect the binding of dioxygen to the ternary complex relative to the labeled substrate.591
Figure 79.

(top) Random mechanism for the formation of the ternary complex for DβM and TβM. (bottom) Equilibrium ordered mechanism for formation of the ternary complex for PHM.
For PHM, the substrate and dioxygen binding order was found to indicate an equilibrium ordered mechanism (Figure 79 top).578 The intercepts of the initial velocity measurements in the plot of 1/v versus 1/[O2] showed no variance with substrate consistent with a mechanism where dioxygen binds to the enzyme after substrate. The isotope effect on kcat/Km(hippuric acid) was invariant with respect to dioxygen (and kcat/Km(O2) showed no variation with hippuric acid). This was also consistent with an equilibrium ordered mechanism where the dissociation of substrate (k2) is faster than that of dioxygen binding (k3[O2]). 578
Alternatively, the mechanism was found to be random for DβM and TβM (Figure 79 bottom). 534,577 For both proteins, the plots of 1/v versus 1/[O2] intercept change with varying substrate concentrations all to the left of the 1/v axis, consistent with either substrate or dioxygen having the ability to bind first to the reduced enzyme Additionally, the isotope effect on kcat/Km(substrate) (2H for tyramine with TβM and 3H for dopamine with DβM) varies with dioxygen concentration and remains above 1.0 at maximal O2 concentration.590 Since the isotope effect remains above 1.0, it is implied that both dioxygen and substrate are capable of dissociating from the ternary complex, consistent with a random mechanism.
3.3.2.3 C-H hydroxylation
As mentioned above, the primary isotope effect on kcat is minimal and implies that C-H hydroxylation is not rate limiting in catalysis. However, it is still possible to obtain the ‘intrinsic’ kinetic isotope (Dk) effect for this step in a method developed by Northrop using the tritium and deuterium isotope effects on V/K under identical conditions (equation 36) 591,593
| [36] |
The intrinsic isotope effects for PHM and DβM (table 21) are remarkably similar and imply that the complex for C-H activation is identical in both enzymes. Using this intrinsic primary isotope effect, the microscopic rate for C-H activation can be modeled and the values for both enzymes are comparable. The intrinsic secondary deutero α-isotope effects are also found to be essentially identical.533 Additionally, using the temperature dependence on the intrinsic isotope effect (Dk) in PHM afforded an estimation of the ΔH‡ for C-H cleavage to be ~ 13 kcal/mol and a ΔG‡ can be calculated from transition state theory for C-H cleavage to be ~ 14 kcal/mol.594 Using kcat for these overall reaction conditions, an activation free energy of ~ 17 kcal/mol for the overall rate determining process (likely product release).
Table 21.
Intrinsic isotope effects for the H-atom abstraction step.
3.3.2.4 Dioxygen and Substrate Coupling
The kinetic relationship between substrate oxidation and dioxygen reduction came from a study on DβM where substrates with a ~103 fold range of kcat/Km all showed ~1.0 dioxygen consumption per product formed.595 This establishes that dioxygen and substrate are ‘tightly coupled’ in catalysis and suggests that no partially reduced dioxygen species (e.g., hydrogen peroxide) are ‘leaked’ during turnover, which would result in values < 1.0. It was argued on this basis that a Cu-hydroperoxo species is unlikely the primary oxidant in catalysis. This is strongly supported by electronic characterization of a Cu-hydroperoxo model complex where the results clearly indicate that this species is not activated towards C-H abstraction (vide infra).596,597
3.3.2.5 Single Turnover
Further insight concerning the mechanism of these enzymes came from single turnover experiments on DβM.540,576 Kinetics on the reduction of the copper sites in DβM came from EPR freeze quench studies. Reduction of DβM fit to a first order rate of 250 s−1. Steady state measurements at these conditions (16 s−1), and those noted previously are an order of magnitude slower and therefore enzyme reduction is not rate limiting in catalysis.576
In order to examine the kinetics of enzyme reoxidation, DβM was stoichiometrically reduced with ascorbate and then combined with tyramine substrate. It is noted that pre-reduced enzyme does reoxidize in air, but on the minute time scale.540 It was measured by EPR that in the presence of substrate the enzyme reoxidizes at a maximal rate of 82 s−1.540 This confirms two aspects of the oxidation of the enzyme and substrate hydroxylation: (1) in the absence of substrate the enzyme reacts with dioxygen nearly 1000-fold slower confirming that substrate accelerates dioxygen reduction, and (2) that enzyme reoxidation is also not rate limiting in catalysis (Table 18).
3.3.2.6 Possible Cu-O2 species
The species responsible for C-H abstraction has been a debated topic for many years. To this end, the aforementioned kinetics studies are able to eliminate a few possibilities. The first intermediate proposed to perform this reaction was a Cu(II)-hydroperoxo species.540,580 From the kinetics on dioxygen-substrate coupling, the argument that no decoupling of dioxygen reduction and product formation has provided evidence that a Cu(II)-hydroperoxo is likely not the primary oxidant.595 Furthermore, a Cu(II)-hydroperoxo species has been studied experimentally in a model complex and is not activated towards C-H abstraction.596 Another relevant intermediate discussed recently is a [Cu-O]+ oxyl species.598,599 From O-O cleavage bond energetics, it is expected that the formation of this is very energetically unfavorable and likely catalytically inaccessible. Furthermore, the 18O isotope effects increase with deutro-substrate indicating that dioxygen reduction is coupled to C-H activation.578,587 Therefore, the O-O bond cannot be cleaved prior to C-H activation. The intermediate that best fits the kinetic and experimental models (vide infra) is a Cu-superoxo species.533,597
In summary, kinetic studies mostly by Klinman533 have been paramount in the development of the mechanism of the non-coupled binuclear copper enzymes. Overall, the kinetics derived mechanism (Figure 80) of these enzymes involves initial reduction (kred) of the resting enzyme by ascorbate to give the reduced state. This then binds substrate and dioxygen, random in DβM and TβM and equilibrium ordered in PHM, to give the ternary complex. From here the dioxygen bond is activated to form a putative Cu(II)-O2·− (vide infra) and is coupled to the abstraction of a hydrogen atom from substrate (kC-H).595,600 The following step is either (pathway 1) hydroxyl transfer to form product (i.e. O-O bond homolysis) followed by electron transfer from CuH to CuM (ket) (vide infra) or (pathway 2) electron transfer that occurs with protonation and heterolytic O-O cleavage followed by substrate radical coupling to a Cu-O. radical species. The pathway for the electron transfer has yet to be determined and has been subject of debate (vide infra). Both mechanistic pathways yield the oxidized enzyme with substrate still bound, to CuM in pathway 2 versus protein bound in pathway 1. The dissociation from the enzyme (koff) is suggested to be the rate determining process in catalysis. This mechanism will be further elaborated with information from spectroscopic and electronic structure studies (section 3.3.4 and 3.3.5). From a physiological standpoint, a rate determining product release implies that these proteins function not only to produce their respective biological products but also in product regulation.
Figure 80.

Mechanistic summary of the coupled binuclear copper enzymes
3.3.3 Structure
Important advances in the understanding of these enzymes came with the determination of various crystal structures of PHMcc by Amzel and coworkers and are summarized in Table 22. Due to the high sequence identity among these enzymes, the structure of PHMcc has been interpreted generally for all of the proteins in this class.
Table 22.
Crystal structures of PHM.
| Oxidation State | Bound Ligand | Resolution (Å) | PDB ID | Reference |
|---|---|---|---|---|
| Cu2+ | NO2− | 2.35 | 3MIB | 601 |
| Cu2+ | N3− | 2.42 | 3MIC | 601 |
| Cu2+ | N3− | 3.06 | 3MID | 601 |
| Cu2+ | N3− | 3.26 | 3MIE | 601 |
| Cu2+ | CO | 2.00 | 3MIF | 601 |
| Cu2+ | NO2−a | 2.70 | 3MIG | 601 |
| Cu2+ | N3−a | 2.74 | 3MIH | 601 |
| No CuM, Cu2+ | 1.70 | 1YI9b | 583 | |
| Cu2+ | c | 2.20 | 1YIP | 583 |
| Cu+ | d | 2.00 | 1YJK | 583 |
| No copper | 2.40 | 1YJLb | 583 | |
| Cu+ | Substratee, dioxygen | 1.85 | 1SDW | 125 |
| Cu2+ | Substratef | 2.10 | 1OPM | 584 |
| Cu+ | d | 2.10 | 3PHM | 584 |
| Cu2+ | d | 1.90 | 1PHM | 538 |
| Cu+ | CO | 2.15 | 3MLJg | 601 |
| Cu+ | NO2− | 3.10 | 3MLKg | 601 |
| Cu+ | N3− | 3.25 | 3MLLg | 601 |
Substrate N-R-acetyl-3,5-diiodotyrosylglycine (Ac-DiI-YG, IYG) is present but showed not to bind to copper.
With mutation M314I.
Two solvent derived aquo ligands
A solvent derived aquo ligand
Substrate N-acetyl-diiodotyrosyl-D-threonine (IYT)
N-α-acetyl-3,5-diiodotyrosylglycine (IYG)
The overall structure of PHMcc has two domains consisting of about 150 residues each.538 The protein secondary structure is mostly composed of β-strands (Figure 81 top) with one copper cofactor per domain. The two coppers are separated at a distance ~ 11 Å, which is consistent with the spectral features indicating no magnetic coupling (Figure 81 bottom). Interestingly, both coppers are solvent exposed where a water filled cleft separates the metal sites and provides easy access for substrate to the active site. The coppers are differentiated on the basis of their protein derived coordinating ligands. CuH is bound by three histidines (107, 108 and 172) while the other copper, CuM, is bound by two histidines (242 and 244) and one methionine (314) (Figure 81 bottom). Both oxidized538 and reduced584 forms of PHMcc have been crystallized and show changes at the copper centers. In the oxidized form, CuM is also coordinated by a solvent derived aquo ligand, presumably hydroxo, which is absent in the reduced form. CuH also has an aquo derived ligand in the oxidized state based on spectroscopic studies539 (vide infra); this ligand is not observed in the reduced structure, which has a trigonal planar geometry. The overall protein structure does not change considerably between the reduced and oxidized forms. Interestingly, the reduced structure, obtained with high ascorbate concentration, shows no evidence for ascorbate bound to the protein. The structure of these sites will be further refined by spectroscopic studies in the following section.
Figure 81.

Top. A representation of secondary structure of PHMcc, PDB code 1PHM. The backbone is in gray, the strands are in cyan and the coppers are shown as green spheres. The ligands to the two catalytic coppers are colored by element (carbon is gray, nitrogen is blue, sulfur is yellow, and oxygen is red). Bottom. Coordination ligands of CuH and CuM sites. Coppers are shown by green spheres and ligands are colored by element.
Another series of crystal structures have described the nature of substrate interaction with the protein.584 Oxidized PHMcc was crystallized in the presence of a substrate, N-α-acetyl-3,5,-diiodotyrosylglycine (Ac-DiI-YG, IYG). The resulting crystal structure (PDB code 1OPM) shows the substrate bound near the CuM, which supports the idea that this copper is the site of substrate hydroxylation. More recently, the crystal structure of a pre-catalytic complex (Figure 82A) was solved at a resolution of 1.85 Å (PDB code 1SDW) with the slow substrate N-acetyl-diiodotyrosyl-D-threonine (IYT) bound near CuM.125 Interestingly, a dioxygen derived moiety is observed bound to CuM in an end-on mode (Figure 82 B, O-O of 1.23 Å). The IYT substrate is anchored to the protein via a salt bridge to Arg240, a hydrogen bond to nearby Tyr318 and a hydrogen bond from the side chain amide of Asn316 (Figure 82C). Although the Cu(I) oxidation state was thought to be appropriate as the crystal structure was under reducing conditions, since the crystal was exposed to molecular oxygen, the oxidation state of the copper and dioxygen derived moiety are ambiguous. Additionally, the dioxygen moiety is poised, upon rotation by 110° of its distal oxygen, at a distance of ~ 2.2 Å to abstract the Pro-S hydrogen of the glycine residue (Figure 82D). The findings in this structure support the idea that an end-on Cu(II)-superoxo activated species is formed at CuM and is oriented such that it can abstract the relevant H-atom in catalysis.
Figure 82.

A. The precatalytic complex of PHM showing the relative position of bound substrate, N-acetyl-diiodotyrosyl-D-threonine (IYT), and dioxygen at CuM site. The 2Fo-Fc electron density is shown for dioxygen and the IYT peptide. Substrate and protein atoms are colored by atom type; iodine atoms are purple. The water molecule is represented by a red sphere and molecular oxygen by a red rod. Dotted lines indicate hydrogen bonds and bonds to the copper atoms (green spheres). B. The structure of the dioxygen binding site showing the precatalytic complex. Dioxygen (the red rod) is shown bound to CuM (the green sphere) in an end-on manner. Amino acid ligands to CuM are shown colored by atom type. Simulated annealing difference omit maps that leave out either both oxygen atoms (red mesh) or the distal oxygen atom of dioxygen (blue mesh) are shown contoured at 8σ. In this crystal structure, CuM-O-O angle is 110.2°, CuM-Oproximal is 2.106 Å, the O-O distance is 1.232 Å and the distance between the α-C in the substrate and the CuB-O-O is about 4-5 Å. C. The backbone of IYT and the anchor residuals are shown: Arg240 forming a salt bridge, the hydroxyl of Tyr318 and the side chain amide of Asn316 both in hydrogen bonds to the D-threonine main-chain amide. The hydrogen bonds are shown in dotted lines. D. A structure-based model of substrate dioxygen interaction. The structure of the PHM active site is oriented looking down the copper-oxygen bond. The modeled position of the substrate hydrogen atom that is abstracted during the PHM reaction is shown in turquoise. Rotating the copper-oxygen bond by 110° brings the terminal oxygen of dioxygen within 2.2 Å of the substrate hydrogen, a position consistent with hydrogen abstraction by an activated oxygen species. (From Ref. 125. Reprinted with permission from AAAS.)
Recent investigations have lead to crystal structures of PHMcc with small molecules bound to CuM.601 Crystals of PHMcc were soaked with excess NO2−, N3− and CO (3 atm), and show the exogenous ligands only bound to CuM. These results are consistent with FTIR studies of CO binding to the reduced enzyme, where CO only binds to CuM.574 It is suggested that, since CuH functions to transfer electrons to CuM, CuH must maintain its redox potential in a narrow range and therefore does not bind exogenous ligands. However, these results are not consistent with the spectroscopic findings from solution samples that show both N3− and NO2− bind to both the CuM and CuH sites.539 This likely reflects the higher concentration of exogenous ligands used in the spectroscopic studies and/or the difference in sample preparation between the spectroscopic studies and the crystallization.
These crystal structures have provided (1) the identity of the endogenous ligands that bind the copper centers, (2) insight into the distance between the two coppers, (3) the substrate binding mode, and (4) the possibility of having an activated Cu/O2 intermediate poised to perform H-atom abstraction in catalysis. The next section reviews the electronic structure of these sites and possible reactive Cu/O2 intermediates as candidates in the enzyme mechanism.
3.3.4 Electronic Structure and Spectroscopy
3.3.4.1 Enzyme Spectroscopy
First, the spectroscopy of the reduced Cu(I) state will be considered. As mentioned in section 2, this is limited to only a few methods (XAS, XES and FTIR of carbon monoxide binding). EXAFS on reduced DβM indicates that the protein has two coppers with an average of ~ 2–3 histidines at ~ 1.93 Å with one Cu bound to a methionine at 2.25 Å and ~ 1–2 aquo derived ligands.602 These results are analogous to those observed for PHM603 and TβM.604 Additionally, copper pre-edge and EXAFS data on the reduced M314I variant in PHM indicate the loss of a copper, likely CuM.605 This implies that the methionine ligand is essential for stabilization of the reduced CuM site. This is consistent with the observation of no activity of the M314I varient. Carbon monoxide (CO) binds the Cu(I) ions in both PHM and DβM with a Cu:CO stoichiometry of 1:0.5, indicating that CO only binds to one copper.574 EXAFS of this form shows that CO binds to CuM. The enzyme-CO complexes exhibit analogous C-O stretches at ν(CO) = 2089 cm−1 and 2093 cm−1 for DβM and PHM, respectively, which show only limited backbonding from Cu into the CO.574,603 A reduced half-apo derivative of DβM has also been characterized (prepared by dialysis of the CO bound form in the presence of CN−). EXAFS on this derivative shows one copper with 2 histidines at 1.99 Å, one methionine at 2.25 Å and a solvent derived ligand weakly bound at 2.53 Å. The presence of the methionine ligand indicates that the copper remaining is CuM.574 EXAFS on this form also shows that CO binding displaces the weakly bound ligand, and the FTIR spectrum shows a C-O stretch at ν (CO) = 2089 cm−1, which is identical to the fully metalated enzyme.574 These results confirm that CO binds to CuM, the dioxygen binding site. Using the XAS data and DFT calculations based on the crystal structures, reduced Cu(I) resting state geometries were obtained.539 The resulting CuM structure is tetrahedral with two histidines, an axial methionine and a water ligand (Figure 83A). CuH is in a trigonal planar geometry ligated by three protein derived histidines and no solvent ligand (Figure 83B).
Figure 83.

Optimized geometries by density functional theory of reduced CuM and CuH sites, based on spectroscopic studies. A. Reduced CuM site. B. Reduced CuH site. . C. Oxidized CuM site. D. Oxidized CuH site. Relevant bond lengths (Å) are indicated. Color codes: Cu, green; N, blue; C, gray; O, red; S, yellow; H, light blue. (Reprinted with permission from Ref. 539. Copyright 2004 American Chemical Society.)
The oxidized state of these enzymes contains two Cu(II) ions and is accessible to a larger range of spectroscopic studies (Section 2.2). EXAFS on the oxidized state of DβM exhibits an average of ~ 2–3 histidines at 1.99 Å and ~ 1–2 solvent derived O ligands per copper at 1.94 Å.602 Interestingly, there is no observed methionine bound to copper, implying that the Cu-SMet bond has elongated or been broken upon oxidation. Ligand field (LF) transitions (i.e., d→d transitions) are essential in describing the geometry of Cu(II) sites. The LF region of the CD and MCD spectra of resting PHMcc gives two transitions at 12,200 cm−1 and 16,700 cm−1 that form a pseudo-A term (derivative shape) in the MCD spectrum (Figure 84A).539 These transitions do not shift upon binding of substrate (acetyl-Tyr-Val-Gly, AcYVG) implying that substrate binding does not perturb the copper ions, consistent with the EXAFS of substrate bound to DβM and the IYG bound crystal structure. The EPR spectrum of oxidized PHMcc exhibits only one resolvable signal (gz = 2.288; Az = 157 × 10−4 cm−1 (Figure 84B)) that integrates to 2 Cu(II) ions and exhibits gz > gx,y > 2.0, confirming that both coppers have dx2-y2 ground states. In attempt to differentiate the Cu centers, nitrite (NO2−) and azide (N3−) were bound to the Cu(II) sites.539 Azide binding slightly shifts the two LF transitions (Figure 84C) and new transitions are observed in the charge transfer (CT) region at 21,000 cm−1 to 30,000 cm−1 (Figure 85). Azide bound to a single copper can only exhibit two CT features from the highest occupied πnbv and πnbσ MOs of azide. Since the CT spectrum resolves into three bands (29,600 cm−1, 25,550 cm−1 and 21,950 cm−1), azides must bind to both coppers. The 29,600 cm−1 and 25,550 cm−1 features are assigned to πnbσ (the non-bonding MO of the azide that σ-bonds to the copper) to Cu(II) CT transitions for CuM and CuH, respectively (since CuM has a higher coordination number and therefore higher energy Cu d orbitals then CuH). The third transition at 21,950 cm−1 is of lower intensity and can be assigned to a πnbv (where the v indicates the azide orbital perpendicular to the Cu-azide plane) CT to one of the Cu(II) sites due to the limited orbital overlap. Thus the absorption/CD/MCD spectra show that azides are bound to both Cu centers. The X-band EPR spectrum of azide bound PHMcc (Figure 84D) shows only one tetragonal Cu(II) EPR signal with a smaller gz = 2.246. NO2− binding results in significant perturbation of the MCD spectrum (Figure 84E). Six transitions were observed in the LF region and since a single Cu(II) can only have 4 d→d transitions, this confirms that NO2− binding leads to different geometric and electronic structures for both CuM and CuH. This observation is consistent with changes in the EPR spectrum. Addition of NO2− to the PHM enzyme leads to the resolution of two EPR signals with gz = 2.265 and 2.298 (Figure 84F). Neither corresponds to that of the resting oxidized state and indicate that both two copper sites have bound nitrite. This change in the EPR indicates different binding modes for nitrite to CuM and CuH, presumably due to differences in the exchangeable coordination positions for each copper. Over all, these spectroscopic findings show that azide and nitrite bind to both the CuH and CuM sites in solution.
Figure 84.

A. Ligand field 5 °C CD and 5 K, 7 T MCD spectra of the resting PHMcc and 5 K, 7 T MCD spectrum of the resting PHMcc with 2-3 equiv of AcYVG substrate; C. ligand field 5 °C CD and 5 K, 7 T MCD spectra of resting PHMcc with 350 mM N3− and the 5 K, 7 T MCD spectrum with an additional ~4 equiv of AcYVG substrate; E. ligand field 5 K, 7 T MCD spectrum of resting PHMcc with 300 mM NO2−; B., D., F. experimental (77 K) and simulated X-band EPR spectra for the resting PHMcc (9.321 GHz), resting PHMcc with 350 mM N3− (9.319 GHz), and resting PHMcc with 300 mM NO2− (9.394 GHz) samples, respectively. In panel B, “*” denotes a cavity signal. The sharp signal at g ≈ 2.0 is due to a radical signal of the quartz tube used in the EPR measurement. In panel E., the weak derivative shaped spectral feature at ~24,500 cm−1 (“*”) is due to a small heme contaminant. (Reprinted with permission from Ref. 539. Copyright 2004 American Chemical Society.)
Figure 85.

A. Charge-transfer absorption spectrum (5 °C) of resting PHMcc with 350 mM N3− (dashed lines are Gaussian fitted bands); B. Charge-transfer region (5 °C) CD and 5 K, 7T MCD spectra of resting PHMcc with 350 mM N3− and 5 K, 7 T MCD spectrum with ~ 4 equiv of substrate AcYVG added to PHMcc + N3−. (Reprinted with permission from Ref. 539. Copyright 2004 American Chemical Society.)
With insight from spectroscopy539 and crystallography538,601, structures of the oxidized Cu(II) sites were obtained from DFT calculations (Figure 83C and D). The CuM site is in a distorted square pyramidal geometry ligated by a long axial methionine, two histidines and two aquo derived ligands, one hydroxo and one water (Figure 83C). Oxidized CuH is in a D2d distorted square planar geometry ligated by three histidines and one aquo ligand (Figure 83D).539
It is interesting to consider how these very structurally different resting Cu(II) sites exhibit practically identical EPR and LF spectroscopic features. This was explained with geometric/electronic structural correlations between CuH and CuM (Figure 86). The square pyramidal CuM structure has a LF with the dx2-y2 orbital highest in energy and dxy, dz2, and dxz/dyz in decreasing order (Figure 86, right). The LF of the CuH D2d distorted square planar structure has dx2-y2 highest in energy with dxy, dxz/dyz, and dz2 in decreasing order (Figure 86, left). Removing the axial methionine of CuM shifts the dx2-y2 and dxy orbitals up in energy while the dz2 orbital shifts down. Replacing a hydroxo ligand with a histidine significantly stabilizes the dx2-y2 and dz2 due to the stronger donation of the hydroxo relative to histidine. Distortion (D2d) of the ligands from square planar destabilizes the dx2-y2 orbital while the dxy is stabilized resulting in the CuH site. Its LF is similar to that of CuM where the only significant difference is the energy of the dz2 orbital, which is higher in the latter case due to bonding with the methionine. Therefore, the square pyramidal distortion and the axial methionine oppose the effects of the strong hydroxo ligand yielding an electronic structure that produces analogous spectral features for CuM and CuH. 539
Figure 86.

Structural correlations of ligand field splitting patterns. Ligand field calculated d-d orbital energy diagrams for CuH (oxidized, left) and CuM (oxidized, right). I.S.1 is an intermediate structural model derived from CuM 1a where the axial methionine is removed and the equatorial OH- is replaced by a histidine ligand. I.S.2 is an intermediate structural model with the axial methionine removed from CuM 1a. All energies are referenced to the lowest d orbital, which is set to zero. Geometries of first coordination sphere atoms are shown on the top. (Reprinted with permission from Ref. 539. Copyright 2004 American Chemical Society.)
3.3.4.2 Cu/O2 Model Complexes
Thus far, no dioxygen intermediates have been spectroscopically characterized for these enzymes in solution leading to much speculation about their nature. Alternatively, synthetic model chemistry has produced a series of structurally defined and, in some cases, reactive mononuclear Cu-oxygen complexes, including Cu(II)-superoxo, Cu(III)-peroxo and Cu(II)-hydroperoxo species that have been used to evaluate the plausibility of each intermediate in this reaction.
Early kinetics investigations of DβM and PHM proposed that a Cu(II)-hydroperoxo was the likely candidate for the intermediate responsible for H-atom abstraction. 540,580 This prompted the spectroscopic study of Fujisawa’s tris(pyrazolyl)borate Cu(II) hydroperoxo model complex (Figure 87), in addition to analogous alkylperoxo complexes, in effort to evaluate its electronic structure and potency for H-atom abstraction.596 The EPR spectrum of this complex has g∥ = 2.380, g⊥= 2.090 consistent with a dx2-y2 ground state where the small hyperfine splitting |A∥| ~ 40 × 10−4 cm−1 is consistent with a ground state with ~ 62% Cu character (note from equation 2 the high g// value brings down the A// value). Absorption and MCD spectra (Figure 88) exhibit LF transitions at < 13,000 cm−1 and two CT transitions at ~ 16,500 cm −1 and ~ 18,000 cm−1 associated with the hydroperoxo π*v and π*σ peroxo orbitals respectively, where v and σ indicate that the π* orbitals are perpendicular to and within the Cu-O-O plane, respectively. The former transition is more intense than the latter, indicating that the dominant bonding interaction is between the dx2-y2 and the π*v hydroperoxo orbitals. This complex exhibits a resonance Raman (rR) enhanced O-O stretch at 843 cm−1, which shifts to 799 cm−1 upon 18O substitution, and a Cu-O stretch at 624 cm−1, which shifts to 607 with 18O substitution (Figure 89). The high O-O stretch frequency for the peroxo is indicative of a strong O-O bond due to polarization of the hydroperoxo by the proton, which mixes the π*v and π*σ orbitals. Extending this hydroperoxide intermediate to the CuM active site of PHM produces a half occupied FMO mostly on the Cu site with a dx2-y2 - π*σ ground state of 61% Cu and only 2% distal O character (Figure 90 right). This electronic structure will be considered with respect to its relevance in the reaction mechanism in the next section.
Figure 87.

Density functional theory optimized geometry of tris-pyrazolborate Cu(II) hydroperoxo model complex. Color codes: Cu, green; B, light pink; N, blue; C, gray; O, red; S, yellow; H, light blue.
Figure 88.

A. 220 K solution absorption spectrum of hydrotris(3-tert-butyl-5-isopropyl-1-pyrazolyl)borate Cu(II)-hydroperoxo (referred as L3CuOOH) in tert-butylbenzene. B. 5 K, 7 T MCD spectrum of L3CuOOH in a toluene glass. The Gaussian-resolved bands are shown in dashed lines along with their spectral assignments. (Reprinted with permission from Ref. 596. Copyright 2000 American Chemical Society.)
Figure 89.

77 K Resonance Raman spectra of L3Cu18O18 OH and L3CuOOH excited at 568.2 nm in a tert-butylbenzene glass. (Reprinted with permission from Ref. 596. Copyright 2000 American Chemical Society.)
Figure 90.

Energy optimized geometry of oxidized putative hydroperoxo intermediate CuIIM-OOH, [CuIIM(Met)(His)2(H2O)(OOH)]+, relevant bond lengths (Å) are indicated. Color codes: Cu, green; N, blue; C, gray; O, red; S, yellow; H, light blue. Surface contour plot of frontier molecular orbital LUMO of the CuIIM-OOH model. Orbital decompositions (%) are given. (Reprinted with permission from Ref. 65, copyright 2004 National Academy of Sciences, USA.)
As presented in the kinetics and structure sections, further research on these enzymes led to the postulation that a Cu(II)-superoxo intermediate is responsible for C-H abstraction.595,600 In efforts to understand this intermediate, a number of synthetic complexes have been reported as reported (Table 23) along with their Cu-O and O-O vibrational frequencies. The first such structurally and spectroscopically defined side-on bound (η2) Cu(II)-O2•− model complex was synthesized by Fujisawa and coworkers (Figure 91).121 Resonance Raman spectra of the complex exhibited a diagnostic O-O vibration of a superoxo at 1043 cm−1 accompanied by the symmetric Cu-O vibration at 554 cm−1 (Figure 92). The presence of a pre-edge feature at ~8979 eV in the K-edge XAS confirmed that the copper oxidation state was Cu(II).126 This complex exhibits no effective magnetic moment (µeff) from SQUID magnetic susceptibility below 150 K indicating an S = 0 ground state (Figure 93) (consistent with its lack of an EPR signal). As the temperature is increased, µeff increases consistent with Boltzmann populating a low-lying S = 1 excited state, fit to ~1500 cm−1 above the ground state. The absorption spectrum reveals four weak (< 400 M−1cm−1) d → d transitions at 10,200 cm−1, 14,300 cm−1, 22,100 cm−1 and 26,100 cm−1, consistent with a square pyramidal Cu(II) LF. The onset of an intense band occurs at an energy of > 30,000 cm−1 was assigned to a dimeric Cu2O2 component in the CuO2 complex while no LMCT transition from the superoxo Cu(II) is observed (Figure 94A). The O-O vibration in the resonance Raman spectrum profiles the 22,100 cm−1 feature implicating d → d transition mixed with the superoxo π* → Cu CT and therefore is assigned as dyz → dxy since the dyz is the only orbital with the correct symmetry to mix with the superoxo π* orbital. The Cu dxy is the highest energy metal orbital in square pyramidal complexes while the two highest occupied superoxo MOs (in the singlet side-on copper complex) are the π*σ and π*v orbitals. Thus, two LMCT transitions would be expected from the π* orbitals to the Cu dxy orbital. The π*σ orbital is located in the CuO2 plane and has considerable overlap with the dxy, which would lead to an intense CT feature at high energy. Since no CT feature is observed experimentally (Figure 94A), this transition must be higher than the spectral cutoff (i.e. > 32,500 cm−1). DFT calculations predicted a low-lying singlet excited state would produce a low energy LMCT transition and, indeed, this was observed at low temperature at 4,200 cm−1 (~ 200 M−1cm−1 at 10 K, Figure 94B). This CT arises from the superoxo π*v orbital, which is oriented out of the CuO2 plane and minimally overlaps the dxy orbital leading to its weak intensity. The (xy)1(π*v)1 CT excited configuration associated with this singlet would lead to a triplet excited state at lower energy. This can be assigned to the paramagnetic excited state that is experimentally observed by SQUID magnetic susceptibility (Figure 93) at ~1500 cm−1 above the singlet ground state. Consequently, the singlet ground state must derive from a different electronic configuration compared to the lowest energy triplet state.
Table 23.
Structures and vibrational properties of Cu(II)-superoxo model complexes
| Supporting Ligand |
Superoxide Binding Mode |
ν(16O-16O)/cm−1 (Δ(18O)/cm−1) |
ν(Cu-16O)/cm−1 (Δ(18O)/cm−1) |
Refs. |
|---|---|---|---|---|
| TPA6'-NHPv | η1 | 1130 (63) | 482 (20) | 606 |
| TPANMe2 | η1 | 1121 (63) | 472 (20) | 607 |
| TrenMe,Bn | η1 | 1120 (61) | 474 (20) | 608 |
| TrenTMG | η1 | 1120 (63) | 435 (20) | 123 |
| Pyridyl-diazacycloocctane tridentate | η1 | 1033 (65) | 457 (15) | 609 |
| DPH3 | η1 | 964 (55)* | 610 | |
| Pyridyl diamido dianionic tridentate | η1 | 1104(60) | 611 | |
| Me6tren | 1122(52) | 612 | ||
| HB(3-Ad-5-iPrpz)3 | η2 | 1043 (59)* | 613 | |
| HB(3-tBu-5-iPrpz)3 | η2 | 1112 | 554 (20) | 121 |
| TACNPhOH | η2 | 1120 (62) | 450 (8), 422(5) | 121 |
IR Data
Figure 91.

DFT optimized geometry of tris-pyrazolborate Cu(II)-superoxo model complex. The atoms are colored by atom type, the copper is green and the boron is pink.
Figure 92.

A. Resonance Raman spectra of hydrotris(3-tert-butyl-5-isopropyl-1-pyrazolyl)borate Cu(II)-superoxo (referred as L3CuO2) excited at 406.7 nm (~24,590 cm−1). B. hydrotris(3-adamantyl-5-isopropyl-1-pyrazolyl)borate Cu(II)-superoxo (referred as L10CuO2) excited at 482.5 nm (~20,725 cm−1) in CH2Cl2. (Reprinted with permission from Ref 121 Copyright 2003 American Chemical Society.)
Figure 93.

SQUID measured effective magnetic moment μeff (B.M. = Bohr magneton) of L3CuO2. Lines are the simulated curves assuming the S/T energy splitting (ES=1 – ES=0) = 1800, 1600, 1500, 1400, or 1200 cm−1. (Reprinted with permission from ref 121 Copyright 2003 American Chemical Society.)
Figure 94.

A. UV/vis absorption spectrum of L10CuO2 in CH2Cl2 at −70 °C (solid line) with Gaussian resolved individual transitions (dashed lines). Overlaid is the rR profile of the 1043 cm−1 vibrational mode of L10CuO2 (•). B. Variable temperature near-IR mull absorption spectra of L10CuO2. Vibrational overtones of the mulling agent are labeled as “*”.(Reprinted with permission from ref 121 Copyright 2003 American Chemical Society.)
Correlation of these data to DFT calculations of the singlet ground state and the triplet excited state provides further insight into the electronic structure of this complex. The singlet ground state MO diagram consists of a pair of opposite spin electrons delocalized over the Cu dxy and the π*σ antibonding orbitals (Figure 95). The calculated spin distributions have very little polarization (small net spin densities) on the Cu and superoxo moieties due to the highly covalent spin delocalized nature of the ground state. The computed triplet excited state is comprised of the two orthogonal β-LUMO orbitals: the superoxo π*v and the Cu dxy-π*σ. These two states reflect different configurations where the singlet ground state is highly covalent with no spin polarization and the triplet excited state involves excitation of one e− from the π*v into the dxy/π*σ orbital.121
Figure 95.

Schematic diagram bonding interaction of the singlet ground state and the lowest triplet state. (Reprinted with permission from ref 121 Copyright 2003 American Chemical Society.)
The high covalency between the copper and superoxo of the ground state of this Cu(II)-superoxo species is significant. When a side-on superoxo is modeled into the active site for PHM, an α, β unoccupied FMO is obtained that is delocalized over the superoxo and the Cu (Figure 96). Due to this high oxygen character in the FMO, this intermediate is more activated for H-atom abstraction than the Cu(II)-hydroperoxo therefore strongly implying the relevancy of the CuII-superoxide for reactivity.600
Figure 96.

Energy optimized geometry of putative side-on CuIIM-superoxo, [CuIIM(Met)(His)2(O2)]+, relevant bond lengths (Å) are indicated. Color codes: Cu, green; N, blue; C, gray; O, red; S, yellow; H, light blue. Surface contour plot of frontier molecular orbital LUMO of the CuIIM-OO− model. Orbital decompositions (%) are given. (Reprinted with permission from Ref. 65, copyright 2004 National Academy of Sciences, USA.)
Elucidation of the PHMcc crystal structure showing dioxygen bound to CuM125 in an end-on fashion focused interest on end-on bound Cu(II)-superoxo complexes. Although end-on bound species are observed as transient intermediates in the formation of binuclear copper trans-peroxo complexes, eight stabilized end-on bound mononuclear Cu(II)-superoxo model complexes have been reported (Table 23). The first and only structurally characterized complex is end-on Cu(II)-superoxo, [TMG3trenCuO2]+ (where TMG3tren is 1,1,1-tris[2-[N2-(1,1,3,3-tetramethylguanidino)]ethyl]-amine), of Sundermeyer and Schindler (Figure 97).124,614 This complex has been subjected to rigorous spectroscopic study. According to the NMR, the model complex is paramagnetic.615 Variable temperature, variable field (VTVH) MCD shows that this complex has a triplet ground state.123 The complex exhibits one intense absorption band at 22,500 cm−1 (3,500 M−1 cm−1) attributed to a LMCT (π*σ of the superoxo to the dz2 of the copper; note the trigonal bipyramidal geometry of TMG3tren leads to a dz2 ground state) based on its low MCD to absorption intensity (Figure 98A and B). Three bands at 10,100 cm−1, 11,670 cm−1 and 14,820 cm−1 exhibit intense MCD signals but limited absorption intensity and thus were assigned as d→d transitions. There is also a weak transition at ~13,000 cm−1 with no MCD intensity but is apparent from the rR excitation profile (Figure 98C). The rR spectrum exhibits resonance enhancement of both the Cu-O stretching mode at 435 cm−1 and O-O stretching mode at 1120 cm−1 consistent with a superoxo-level species. The rR profiles of these two vibrations are significantly enhanced over the aforementioned CT transition while only the O-O stretch is enhanced within the envelope of the low energy transitions (Figure 98C). The former is consistent with the assignment of a superoxo to Cu(II) CT, but the second is unique. The profile reaches a maximum corresponding to the weak absorption feature at 13,000 cm−1 implying considerable distortion of the O-O, with little distortion of the Cu-O bond, in the excited state associated with this transition. From analysis of possible excited state distortions using TD-DFT calculations, the 13,000 cm−1 was assigned as a superoxo intraligand (IL) transition from the π*σ to the π*v orbital (Figure 99), the first observed for any superoxo bound metal complex.
Figure 97.

Crystal structure of the [TMG3trenCuO2]+ model complex .
Figure 98.

A. Low temperature absorption and B. MCD spectra of [TMG3trenCuO2]+ C. Low temperature (5K) absorption spectrum of [TMG3trenCuO2]+ (black) and rR profile for ν(Cu-O) (435cm−1, blue) and ν(O-O) (1120cm−1, red) (77K). (Reprinted with permission from ref 123 Copyright 2010 American Chemical Society.))
Figure 99.

Schematic molecular orbital diagram of the copper-superoxo bonding in [TMG3trenCuO2]+. The LMCT (red) and IL (blue) transitions are shown, as are the orbital energy separations (Δ). The π*σ (+dz2) MO is dominantly superoxo-based and σ-bonding to dz2 and the dz2(−π*σ) MO is dominantly copper-based and σ-antibonding to π*σ. (Reprinted with permission from ref 123 Copyright 2010 American Chemical Society.))
From the above discussion, side-on superoxo Cu(II) complexes are singlets while end-on superoxo-Cu(II) complexes are triplets.123 The separation of the π*v and the dz2 orbitals (Δ in Figure 99) is the significant contributor in determining the ground state of these complexes. For the triplet to be the ground state, Δ must be smaller than the electron spin pairing energy. In going from end-on to side-on the binding of the superoxo with the Cu(II), the d-π*σ/π*v splitting (Δ) increases due to the strong σ bonding in the side-on case causing the spins to pair (Figure 100). From the experimentally observed π*σ to π*v (IL) and superoxo π*σ to copper dz2 (LMCT) transitions in the end-on [TMG3trenCuO2]+ complex, an upper limit of Δ in the end-on structure can be established (Figure 99) to be 9,500 cm−1, which is ~ 1/2 of the energy required for spin pairing. A calculated end-on structure from CuM in PHM also has a triplet ground state with two orthogonal half occupied orbitals: the Cu dx2-y2 - π*σ and the superoxo based π*v. Importantly, the half occupied π*v orbital is at low energy (Figure 100) with near 100% character on the superoxo (Figure 101; it would therefore be an optimal FMO for H-atom abstraction by a metal bound superoxo species.597
Figure 100.

Diagram (middle) showing the transition between end-on and side-on with frontier molecular orbitals of [TMG3trenCuO2]+ as the end-on example and the frontier molecular orbital of tris-pyrazolyl borate Cu(II)-superoxo as the side-on example.
Figure 101.

The frontier πv* molecular orbital of a Cu(II)-superoxo modeled in PHM, at CuM site. Reproduced by permission of The Royal Society of Chemistry (Reprinted with permission from ref 597.))
3.3.5 Molecular Mechanism
3.3.5.1 Dioxygen Intermediates
Initial mechanistic hypothesis for the non-coupled binuclear Cu enzymes suggested that H-atom abstraction is accomplished by a CuM(II) -hydroperoxo intermediate. 540,580 The electronic structure of this species was characterized in the aforementioned spectroscopic study of the tris-pyrazolyl borate Cu(II)-hydroperoxo complex.596 Computationally, an end-on bound hydroperoxo was modeled into the active site of CuM (Figure 90) where the electronic structure consists of a singly occupied FMO that has essentially no character on the distal oxygen of the hydroperoxo (~ 2%).600 This FMO is not activated for H-atom abstraction since it lacks oxygen orbital character to overlap with the substrate H-atom donor orbital. Consistent with this, there is a high computed activation barrier for H-abstraction by a Cu(II)-OOH intermediate (~ 40 kcal/mol) (Figure 102, left in blue). Therefore, a Cu(II)M-hydroperoxo is not suitable for H-atom abstraction in catalysis.597
Figure 102.

Summary of the 2e− (left, blue) and 1e− (right, red for H atom abstraction, green for subsequent steps) reaction pathways in PHM. For clarity, His and Met ligands are omitted in the structures. Only species that are essential to the reactions are indicated in the figure. Free energies are referenced to the initial reactions, which are set to zero. The proton and H2O ligand in steps (v) and (a) and the H2O ligand in step (iii) are from the solvent. Reproduced by permission of The Royal Society of Chemistry (Reprinted with permission from ref 597))
Spectroscopic123, kinetic595 and crystallographic125 studies have alternatively suggested that the key reaction intermediate for H-atom abstraction is a Cu(II)-superoxo species. Modeling a side-on Cu(II)-superoxo at the active site of CuM results in an electronic structure with an α, β unoccupied FMO that is non-polarized and covalently delocalized over the Cu and πσ* with considerable oxygen character (Figure 96). Therefore, this FMO is more activated towards H-atom abstraction than the Cu(II)-hydroperoxo model.600 However, the PHMcc pre-catalytic crystal structure exhibits an end-on bound dioxygen. Building on the results from the spectroscopically and structurally defined end-on superoxo model complex [TMG3trenCuO2]+, which has a triplet ground state, an end-on superoxo species was modeled at the CuM active site.597 This computed intermediate also has a triplet ground state with two half-occupied orthogonal magnetic orbitals: one being the Cu dx2-y2 that is antibonding with the πσ* and the other is the πv* orbital with little Cu d character (Figure 101). The latter orbital is highly activated for H-atom abstraction due to its low energy and considerable oxygen character. Extending this one-electron reduced end-on triplet Cu(II)M-superoxo species into the PHM active site, a Gibbs free energy activation barrier for H-atom abstraction is calculated to be 19.7 kcal/mol, which is much lower than that for the Cu(II)-hydroperoxo model and is in reasonable agreement with the experimental value of ~ 14 kcal/mol. Thus, the one-electron reduced Cu(II)-superoxo species is a viable intermediate in the non-coupled binuclear copper enzymes.597
Other reactive dioxygen intermediates have been proposed based on calculations as the primary oxidant in these enzymes. Yoshizawa and coworkers modeled the homology of the PHM crystal structure to construct a three-dimensional structure of DβM.598 QM-MM calculations were then used to generate reaction coordinates. The H-atom abstraction by a Cu(II)-superoxo species (modeled as an antiferromagnetic coupled singlet state) was calculated to have a barrier of 16.9 kcal/mol; while a Cu(III)-oxo species was shown to accomplish H-atom abstraction with a barrier of +3.8 kcal/mol (modeled as a triplet state). The Cu(III)-oxo intermediate is actually a Cu(II)-oxyl with a triplet ground state from DFT calculations.600 However, this intermediate is not feasible due to the thermodynamic cost of forming this strong oxidant (~ 37 kcal/mol from Cu(II)-OOH homolytic cleavage). Another QM-MM calculation by Crespo and coworkers invokes the formation of the Cu(II)-hydroperoxo species but predicted that it will spontaneously form a [Cu(IV)O]2+ intermediate upon protonation where this high valent species would be responsible for H-atom abstraction.599 This reaction parallels that of P450 mechanism where compound I (formally a Fe(V)=O species) forms via protonation and heterolytic cleavage of a Fe(III)-hydroperoxo intermediate.522 This is also unreasonable as the energy required to form this intermediate is thermodynamically inaccessible. The spontaneous cleavage of the O-O bond upon protonation of the Cu(II)-OOH was performed by adding a proton to the system without compensating the for the energy of removing the proton from solution (~260 kcal/mol). Additionally, both of these proposals are inconsistent with the kinetics result of Klinman and coworkers where the dioxygen 18O2 kinetic isotope effect was found to increase with substrate deuteration establishing that the O-O bond must be intact prior to H-atom abstraction (vide supra).533
Synthetic model complexe experiments have also supported a Cu(II)-superoxo species in H-atom abstraction. Two end-on Cu(II)-superoxo model complexes have been shown to activate C-H bonds. Karlin et al. have synthesized an end-on Cu(II)-superoxo species, from the reaction of the Cu(I) complex with dioxygen at −125 °C, that is competent towards C-H activation via H-atom abstraction from N-Benzyl-1,4-dihydronicotinamide (BNAD).606 This reaction is first order in both Cu(II)-superoxo complex and the substrate, and exhibits a primary KIE of 12.1, consistent with enzyme kinetic data. Additionally, Itoh and coworkers have synthesized a mononuclear compound that is spectroscopically characterized to be an end-on Cu(II)-superoxo, in the ligand system LX (LX =1-(2-p-X-phenethyl)-5-(2-pyridin-2-ylethyl)-1,5-diazacyclooctane; X=-OCH3, -H, -NO2).609 Upon first-order decomposition, it is found that the benzyl C-H bond of the ligand has been hydroxylated in ~ 30% yield where an 18O substitution experiment confirms that the origin of the hydroxyl is from molecular oxygen. The Sundermeyer end-on Cu(II)-superoxo [TMG3trenCuO2]+ has also been found to perform H-atom abstraction from TEMPO-H and phenols producing a Cu(II)-hydroperoxo species that is proposed to go on to hydroxylate a ligand methyl group.616 Calculations investigating this hydroxylation found the barrier to abstract the H-atom by the Cu(II)-hydroperoxo species to be 23.5 kcal/mol. This barrier is much lower than that calculated for a Cu(II)-hydroperoxo species in the enzyme system (~ 40 kcal/mol) and appears to reflect an incorrect transition state.600
Finally, the significant issue remaining in the research on this mechanism is the lack of definition of the oxygen intermediates in the enzymes. The PHMcc pre-catalytic crystal structure has defined an end-on oxygen bound species whose electronic structure is unclear and requires experimental definition.
3.3.5.2 Electron Transfer (ET)
One puzzling aspect of the mechanism of these enzymes is the process by which the electron is transferred from CuH to CuM. As observed in the crystal structure of PHMcc, the coppers are separated at a distance of 11 Å through a water filled cleft.538 It has been suggested that inter-domain motion may help to diminish the distance between the coppers, but this is considered unlikely due to the fact that PHM in the crystal phase, where conformational rearrangement is limited, is catalytically active.584 An ET pathway provided by the substrate and protein residues has also been proposed for the enzyme-substrate complex. Interestingly, in the IYT bound form of the pre-catalytic complex of the PHMcc, the enzyme shows a ~ 20 Å pathway, which has been considered viable for ET.584 This pathway consists of H108 bound to CuH that is hydrogen bonded to Gln170 where the electron would be delivered to substrate via a water mediated hydrogen bond (Figure 82A). It is important to note that this electron transfer would be to the glycyl α-carbon, which is conserved for all substrates. This is supported by molecular dynamics calculations by Moliner.617 However, a mutational study by Eipper and coworkers showed that mutation of Gln170 to Ala or Asn resulted in no change in enzymatic activity suggesting that this residue does not play an important role in ET.618 These findings have been evaluated by the previously mentioned calculations, which do not agree as they predict significant loss of activity for the Asn variant. Klinman has also studied the effects of peptide substrates of different lengths on turnover.619 The kcat was found to be higher (~ 2 times) for the shorter substrate. This implies the electron transfer step is independent of substrate length where the difference in rate was attributed to a difference in product dissociation from the enzyme (vide supra). This is presented as evidence for a water-mediated pathway and against a through protein-substrate ET pathway.
3.3.5.3 Completion of the Reaction Coordinate
After the hydrogen atom from the substrate has been abstracted, the resulting intermediate is proposed to be a Cu(II)-hydroperoxo species and a substrate radical.595,597,600 Two mechanisms, a rebound mechanism and a heterolytic cleavage mechanism, have been suggested as shown in Figure 80. Calculations suggested a mechanism of hydroxyl rebound to the substrate radical to yield a Cu(II)-oxyl species. Proton coupled electron transfer from CuH to this then results in the fully oxidized form with a hydroxo bound to CuM, which can be reduced to react with dioxygen (Figure 102 green). Klinman and coworkers proposed an alternative hydroxylation mechanism where electron transfer from CuH is coupled to the hydroperoxo cleavage to form a Cu(II)-oxyl species, which then recombines with the substrate radical to give a copper bound hydroxylated product complex. The relative energetics of these and other possibilities are presently being evaluated.
3.3.6 Exchange Coupling Contribution to Reactivity
The key electronic difference between the “coupled” and “non-coupled” binuclear copper enzymes is the different magnetic interactions between the Cu(II)’s that leads to consideration of the impact of exchange coupling on determining the individual reaction mechanisms. The exchange coupling term J of binuclear cupric sites can be related to the electronic coupling matrix element for electron transfer (HAB) between a Cu(I) and Cu(II) in Marcus Theory via equation 16 in Section 2.3.2, where U is the repulsion between two electrons on the same copper.55 For the coupled binuclear copper sites (sections 3.1 and 3.2) this exchange coupling, therefore HAB, is large and results in the simultaneous two electron reduction of dioxygen to peroxide, where the resulting [Cu2O2]2+complex has an electronic structure (i.e., an FMO) capable of 2 e− electrophilic aromatic substitution (section 3.2).65 This contrasts the non-coupled binuclear enzymes where the exchange coupling is immeasurably weak and thus HAB is small. This would allow for initial single electron reduction of dioxygen (as opposed to two electron reduction) at CuM to form a superoxo species with the appropriate electronic structure (π* FMO in Figure 101) for 1 e− H-atom abstraction. Electron transfer from CuH would then occur at a later stage in the reaction where an intermediate is formed with a large driving force to allow for ET even at low HAB (e.g., the Cu-oxyl species that would form upon substrate oxygenation (Figure 102, right green).
3.4 O2 activation by a mononuclear Cu site: cofactor biogenesis in Galactose Oxidase
The enzymes Galactose Oxidase and Amine Oxidase catalyze the two-electron oxidation of substrates with a single copper center. This is accomplished with an additional covalently bound redox active cofactor present at the active site. The formation of this cofactor (known as a biogenesis reaction) involves the post-translational modification of a Tyrosine residue at the active site. In this section we consider the cofactor biogenesis reaction of Galactose Oxidase, with Cu(I) and Cu(II), with the former being more efficient and potentially relevant to the reduction of O2 by Cu(I) in the non-coupled binuclear copper enzymes discussed in the last section.
3.4.1. Enzymology
The active form of Galactose Oxidase (D-Galactose Oxidase EC 1.1.3.9, GO) has a radical containing copper site that catalyzes the stereospecific oxidation of primary alcohol substrates into aldehydes, coupled to the two electron reduction of one dioxygen molecule to hydrogen peroxide (Figure 103 top).620,621 Although the natural substrate for the enzyme is D-Galactose, GO accepts a broad range of substrates, from sugars to aromatic alcohols. Alcohol oxidation is strictly regioselective and no secondary alcohols are oxidized. The enzyme can also oxidize aldehydes to carboxylates, but at a much slower rate (Figure 103 bottom).622,623
Figure 103.

Reactions catalyzed by Galactose Oxidase
GO is a secretory fungal enzyme that has been isolated from Dactylium dendroides, Gibberella fujikuroi and Fusarium graminearum. Mature GO is a monomer of 68 kDa molecular mass, containing one copper center per protein. The protein has three distinct domains, and the active site is located on the surface of the second domain, which is the largest. It has been reported that the mature protein contains a small amount of carbohydrate (less than 10% of the total mass), although this has not been observed in the crystal structures. 624
The GO oxidation reaction (Figure 103 top) makes this enzyme ideal for bioanalytical applications, due to the stoichiometric relation between substrate oxidation and oxygen reduction. The highly clinically important determination of galactose uses this type of chemistry.625 GO is also used in synthetic chemistry to generate complex aldehydes and carboxylic acids from compounds with a single primary alcohol as a functional group. In addition, GO has recently been used because of its selectivity towards galactose, among other hexoses, to modify D-galactose-β[1,3]-N-acetylgalactosamine, an important tumor marker. The presence of this disaccharide is strongly correlated with colon cancer, and GO provides a rapid method for its early detection.626
The two-electron reduction of dioxygen to hydrogen peroxide involves the two-electron oxidation of the substrate by a site that contains only one copper center. Therefore, nature has evolved an additional cofactor at the active site, a Cys-Tyr covalently linked radical center bound through the phenoxyl oxygen and antiferromagnetically coupled (J < −100 cm−1 for H = −2J•S1•S2) to the copper(II) center. The redox potential for this cysteinated-tyrosine ligand has been measured to be 0.45 V, and is thus stabilized relative to a free tyrosine radical (0.95 V) through the covalent linkage with the cysteine residue in the ortho position and through π-π stacking with a nearby tryptophan residue (W290). Among the variants that have been developed for this enzyme, those that involve W290 (W290G, W290H and W290F), show profound effects on the galactose binding constant and the catalytic rate of the enzyme, suggesting an additional role of W290 residue in substrate binding and activation. 627
The catalytic mechanism of GO has been studied with a range of approaches, including enzyme model studies and calculations.628–633 The kinetics of GO are complex due to the coexistence of three oxidation states of the enzyme and the possibility of reversible activation/inactivation by the interconversion of these states (section 3.4.5). The overall reaction consists of separate reduction and oxidation steps, i.e. a ping-pong mechanism (Figure 104).634 While kred has a broad range of values depending on the substrate (0.8–2.7×10⁴ M−1s−1), the kox is more or less constant (0.98–1.02×10⁷ M−1s−1). Steady state kinetics gives a Km of 82 mM for D-Galactose substrate at saturated O2 concentrations,635 that varies a little depending on the organism from which the enzyme is obtained. This large kox value might reflect an enzyme strategy for broad substrate specificity.
Figure 104.

Ping-pong mechanism for the radical cofactor in Galactose Oxidase.
There is no crystal structure of the active site with the D-galactose bound, but the fact that the open coordination site of Cu(II) in the crystal structures is usually occupied by water or an anion of the crystallization buffer indicates that the galactose coordinates to replace the labile equatorial ligand (see section 3.4.3).636 The proposed mechanism involves the deprotonation of the OH group of the sugar by an axial tyrosine (Y495) upon coordination to the Cu(II), a stereospecific pro-S hydrogen atom abstraction by the Cys-Tyr radical cofactor, an inner sphere electron transfer by the substrate radical reducing Cu(II) to Cu(I) and finally the dissociation of the aldehyde product (Figure 105).622
Figure 105.

Proposed catalytic mechanism for substrate oxidation by Galactose Oxidase.
Glyoxal oxidase (GLOX) is a related enzyme that performs the oxidation of aldehydes to carboxylic acids coupled to a two electron reduction of O2 to H2O2. This enzyme is found in the fungus Phanerochaete chrysosporium, an organism extensively studied for its lignin-degrading ability. GLOX shares many properties with GO despite lacking obvious sequence identity (less than 20%). No crystal structure has been solved yet for GLOX, but the spectroscopic data on the active site (mostly EPR and rR) indicate that the active site is very similar to that of GO.637 Although these two enzymes are related in many ways (including similar molecular weights), the redox potentials for the radical cofactors are different (0.66 V in GLOX vs. the 0.45 V in GO, both relative to NHE). The biological function of GLOX is clearly the generation of H2O2. The enzyme only works under ligninolytic conditions, when lignin peroxidase and manganese peroxidase are also produced, and both of these enzymes require hydrogen peroxide to function. The fact that the main biochemical role of GLOX is the generation of H2O2 has raised the issue of as to whether this might also be the in vivo role of Galactose Oxidase.
In order to be fully active, Galactose Oxidase has to go through a series of post-translational modifications that results in three protein forms. The pre-sequence form has 680 amino acids and a molecular weight of 70.2 kDa. The first cleavage removes the 24 amino acid pre-sequence leader peptide in the secretory pathway, and seems to be copper independent, because fungi can produce both cleaved and pre-sequence forms of GO under metal deprivation stress.627 A second cleavage that is dependent on the Cu(II) cuts the C-terminus at an arginine and removes 17 amino acids to generate the preprocessed form of the enzyme (without the Cys-Tyr crosslink), with 639 amino acids and 68 kD molecular weight. Finally, the biogenesis reaction takes place, generating the processed Cu(II)-Tyr-Cys radical antiferromagnetically coupled active site. In copper-limited conditions, heterologous expression of galactose oxidase results in the three forms of the protein, identifiable as distinct bands on SDS/PAGE.638 The other enzymes that use a metal catalyzed biogenesis reaction to modify a tyrosine residue (cytochrome c oxidase, with a histidine ligand covalently linked to a tyrosine residue, and Amine Oxidase) use the modified Tyr along with the copper to react with O2. Here we focus on the biogenesis reaction to form the radical cofactor in GO, which involves dioxygen activation by a single copper center without the involvement of an additional redox cofactor.
3.4.2 Kinetics
Preprocessed GO from Pichia pastoris can be expressed without the crosslink between Cys228 and Tyr272, allowing for kinetic studies of the biogenesis reaction. This can be accomplished by following the formation of the radical cofactor, which has been studied using both redox states of copper (Cu(I) and Cu(II)) and under both aerobic and anaerobic conditions. Studies of copper(I) biogenesis are more challenging as this d10 metal ion is spectroscopically silent (section 2.1)
Cu(I) performs the biogenesis reaction about 104 times faster than Cu(II),639 with a t1/2 of 3.9 s compared with a t1/2 of 5.1 h for Cu(II). The Cu(I) reaction (studied at low copper loading) uses 1.8eq of O2 consistent with the generation of two molecules of H2O2 per active site formed. For Cu(I), three reactions are observed depending on pH. Reaction 1 (Figure 106) dominates at the biologically relevant pH (pH ~7.0). Stopped-flow kinetic experiments monitoring the reaction of Cu(I) GO with O2 leads to the formation of the characteristic bands of the fully oxidized form, with the crosslink between Tyr272 and Cys228, at 445 nm and 850 nm (see section 3.4.4) with a k1 = 1.78×10⁻¹ s−1, which is well described by a single exponential. This rate constant increases with increasing pH to k2 = 4.15×10⁻¹ s−1 at pH = 8.35, at which point reaction 2 (Figure 106) dominates. The increase in rate constant with pH is interpreted as the deprotonation of the mechanistically important Cys228 proton (section 3.4.5). The increased rate at pH 8.35 can also be described using a single exponential. The spectral features observed at pH < 7.0 are different from the ones observed at pH ≥ 7.0 (Reactions 1 and 2 in Figure 106), lacking the 850 nm band and showing a blue shift of the 445 nm band (a phenolate to Cu(II) charge transfer band, see section 3.4.5). Reaction 3 proceeds in two steps, in which the GO-Cu(I) first reacts with O2 in the presence of a proton with k3 = 4.47×10⁻² s−1 to oxidize the metal and release HO2. The GO-Cu(II) then turns into a species (k4 = 1.8×10⁻⁵s−1) that has spectral features similar to those of GO anaerobically loaded with Cu(II) and lacking the Tyr272 and Cys228 crosslink (406 nm band, see section 3.4.4), suggesting a possible Cu(II)-Cys bond. Further characterization of this species is yet to be reported. The solvent kinetic isotope effect (SKIE) has been studied for this reaction over a broad range of pH, showing a maximum kH2O/kD2O of 1.51 at pH 7.00 that drops to 1.00 at pH 8.35. The pH dependence of the kinetic constants and the SKIE between 6.5 ≤ pH ≤ 8.5 show the same behavior, implying that the trend observed in both is due to the ionization of an unique proton that plays a mechanistically important role in the biogenesis reaction (see section 3.4.5).
Figure 106.

pH dependent reactions for the biogenesis of the cofactor in preprocessed GO-Cu(I).
While the Cu(I) biogenesis reaction is much faster, there has been discussion as to whether a Cu(II) might be involved in forming the crosslink in vivo, possibly in the absence of O2 to avoid premature cell deterioration due to radical reactions and is thought to be viable in the formation of the thioether crosslink in the trans-Golgi network.636 To study the possible role of Cu(II) in biogenesis, both aerobic and anaerobic loading experiments have been done with preprocessed GO and Cu(II).
When 0.8eq of Cu(II) and O2 are added simultaneously to preprocessed GO, the biogenesis reaction takes place with a kinetic constant of k = 3.8×10⁻⁵ s−1 (Figure 107a), which increases by two orders of magnitude to k = 3.5×10⁻³ ± 5×10⁻⁴ s−1 when 3.5 fold excess Cu(II) is added, indicating a copper concentration dependence.640,641 Under excess copper conditions, densitometry measurements on stained gels from samples taken during the reaction gave a rate constant for the formation of the Cys228-Tyr272 bond of k = 5×10⁻³ ± 8.3×10⁻⁴ s−1, which is comparable to the biogenesis rate under the same copper concentration conditions. These results suggest that the rate limiting step for the formation of the fully oxidized mature GO is the formation of the thioether crosslink. This reaction consumes 1.5 equivalents of O2, determined by the concomitant formation of H2O2.
Figure 107.

Kinetic rates for the stoichiometric Cu(II) aerobic (a) and anaerobic (b) loading with premature Galactose Oxidase. All rates are in s−1.
When Cu(II) is added anaerobically to preprocessed GO, a three phase process is observed (Figure 107b). The first occurs upon addition of 0.8eq of Cu(II) to preprocessed GO. Based on EPR data, the copper(II) loads completely in seconds into the active site, showing one very weak absorption band at 600 nm.639 Anaerobic incubation of this species leads to the formation of a second species with an intense absorption feature at 406 nm. The kinetics for the formation of this absorption band can be fit with a single exponential to give a k406 = 3.2×10⁻⁴ s−1. Longer incubation times (up to 24 h) leads to a third bleached species indicating reduction to Cu(I). Crystallographic data and SDS-PAGE analysis show that this species contains the covalent bond between the Cys228 and the Tyr272, indicating that Cu(II) is able to crosslink these two residues in the absence of O2. The decay of the 406 nm band gives k406(decay) = 5×10⁻⁵s−1 ± 5×10⁻⁶ s−1, which is comparable to the aerobic rate of formation of the mature form of the enzyme when stoichiometric Cu(II) is added (vide supra). This may indicate that the rate-determining step is the anaerobic formation of the thioeter crosslink by the single Cu(II) center.
There is also an anaerobic Cu(II) concentration dependence on the kinetic constants as addition of a 3.5eq excess Cu(II) leads to the immediate formation of the 406 nm species, followed by its rapid decay to the bleached species (k406(decay) = 4.08×10⁻³s−1 ± 3.66×10⁻⁴ s−1). SDS-PAGE analysis shows that this species contains the thioether crosslink. Interestingly it has also been detected that the excess copper does not act as the additional electron acceptor required in the formation of the crosslinked, bleached species. The nature of the extra electron acceptor remains unclear (section 3.4.5)
The effect of anaerobic Cu(I) addition was also studied and the amount of thioether bond formed quantified by SDS-PAGE analysis. The rate of thioether bond formation with Cu(I) was estimated to be kCu(I) = 7.8×10⁻⁵ s−1, which is on the same order as the kinetic constant of the anaerobic crosslink formation with stoichiometric copper(II). From the experimental data it remains unclear if the similar rate is because both Cu(I) and Cu(II) can perform the anaerobic crosslink or their similar rates simply reflect a faster conversion of Cu(I) to Cu(II).
When the second species (406 nm) is mixed with oxygenated buffer, the crosslinked radical site is generated with a k406,O2 = 3.9×10⁻⁵ s−1 for stoichiometric Cu(II) loading This rate is very similar to the rate reported for biogenesis by the addition of Cu(II) in oxygenated buffer, and is in the same order of magnitude as the kinetic constant k406,O2 for the anaerobic decay of the 406 nm species to the bleached one. These rates suggest that the 406 nm species is the reactive species that forms the crosslink anaerobically in vivo, and that the rate-determining step is the formation of the thioether bond.
From the above rates is can be concluded that the Cu(I) performs the aerobic biogenesis reaction most rapidly with a rate dependent on the protonation state of the nearby cysteine residue, while Cu(II) can also generate the crosslink in a slow, but O2 independent reaction.
3.4.3 Structure
X-ray crystal structures for GO have been reported from a variety of organisms, including Dactylium dentroides, Aspergillus nidulans and Fusarium Graminearum. Most of the crystal structures are on processed forms of the enzyme (i.e., with the thioether crosslink or with the radical cofactor present); little crystallographic data are available for the preprocessed enzyme (Table 24).
Table 24.
Crystal structures for Galactose Oxidase and derivatives.
| PDB ID | Resolution/Å | Enzyme Variant | Reference |
|---|---|---|---|
| 2VZ1 | 1.91 | apo preprocessed GO | 636 |
| 2VZ3 | 1.90 | Bleached GO | 636 |
| 2JKX | 1.84 | apo processed | 642 |
| 2EIB | 2.10 | W290H variant | 641 |
| 2EIC | 2.80 | W290F variant | 641 |
| 2EID | 2.20 | W290G variant | 641 |
| 2EIE | 1.80 | N3− coordinated to Cu(II) | 641 |
| 1T2X | 2.30 | C383S variant643 | |
| 1K3I | 1.40 | Precursor GO638 | |
| 1GOF | 1.70 | First report of the thioether bond pH = 4.5 | 644 |
| 1GOG | 1.90 | First report of the thioether bond pH = 7.0 | 644 |
| 1GOH | 2.20 | Apo postprocessed | 644 |
Processed Galactose Oxidase (with the radical cofactor) is a monomer with one copper center per protein, three distinct domains and a total molecular weight of 68 kD with 639 aminoacids (Figure 108). The three domains are composed mostly of beta sheets, with almost no turns. The N-terminal domain (domain 1, red in Figure 108) contains the first 155 amino acids, and forms a globular unit with eight strands of antiparallel β-sheets folded into a sandwich. This domain contains a metal binding site that is not the active site. It is formed by Asp32, Asn34, Thr37, Glu142 and the peptide carbonyls of the Lys29 and Ala141. These amino acids define a pseudo octahedral coordination site that contains a Na+ cation from the crystallization buffer (PIPES). However, based on its −2 negative charge, the natural metal might be a divalent cation (e.g. Ca2+). In addition, this domain contains a carbohydrate binding site that may function in targeting extracellular carbohydrates. A hydrophobic patch connects domain 1 with domain 2. The second domain is the largest (residues 156 to 532, yellow in Figure 108) and contains the copper active site. This domain is formed by groups of four-stranded antiparallel β-sheets in pseudo sevenfold symmetry (Figure 108B). This second domain contains three of the four metal ligands of the active site Tyr272 from the Cys-Tyr radical cofactor, Tyr495 and His496. Domain 2 contains a large hole along the sevenfold axis, which is filled by two β-strands of the third domain and a number of water molecules, one of this β-strands, belonging to the third domain, contains the fourth copper ligand (His581).644 The third domain (residues 533 to 639, blue in Figure 108) lies behind the second domain, and is formed by a pack of seven, mostly antiparallel, β-strands surrounding a hydrophobic core.
Figure 108.

Molecular model of Galactose Oxidase, showing the three domains (red domain 1, yellow domain 2 and blue domain 3) (a). Computer generated model of the second domain showing the seven fold axis and the location of the copper ion inside the domain (b).
The active site of the enzyme is located in the second domain, and the copper center is located on the solvent accessible surface of this domain, close to the pseudo-sevenfold axis. The copper ion has a square pyramidal geometry, with Tyr495 in the axial position and the rest of the ligands in the equatorial plane, including the crosslinking cofactor formed by the Tyr272 and Cys228. The open equatorial coordination position is usually filled by a water molecule or a negative counterion from the crystallization buffer. Once the cofactor is formed, a Tryptophan residue from domain 2 interacts with the crosslinked Cys-Tyr residue through a π-π stacking interaction (Figure 109). This interaction has been shown to provide structural and electronic stability to the active site of GO through the effects on the catalytic reaction of a series of Trp290 variants. 641
Figure 109.

Active site of mature processed Galactose Oxidase showing residues Tyr272 (1.93 Å), Tyr495 (2.69 Å), His496 (2.11 Å), His581 (2.14 Å) and Trp290 and the open coordination position.
Dooley and coworkers have reported the only crystal structure of apo-preprocessed Galactose Oxidase. The structure largely resembles the mature GO, with the exception of the active site region. The thioether bond is not present, and the Tyr272 is disordered and modeled in two conformations. Trp290 is also not found in its stacking position (Figure 110A). The authors were also able to obtain crystallographic data on a 3 minute Cu(II) soaked apo crystal (Figure 110B). The electronic density suggests that the copper binds to His496 and His592, and that Cys228 rotates around its carbon-carbon bond to coordinate to the copper. The later observation is based on a negative density peak from the Cys228 sulfur and a positive peak adjacent to the copper. The Cu-S bond is estimated to be 2.2 Å and the copper(II) is in a very unusual three coordinate T-shaped geometry. After 24 h, the anaerobic Cu(II) soaked crystals show that the Cu-S bond is broken, the thioether crosslink is formed, and Tyr272 is coordinated to the Cu(II) in the equatorial plane (Figure 110C). 636
Figure 110.

Crystal Structures of the active site of GO processing forms. (A) apo-GO, showing the disorder on Tyr272. (B) Crystal structure after 3 minutes soak on Cu(II) solution, indicating coordination of Cu(II) to the His in the active site. The negative peak on the Cys228 sulfur and the positive peak adjacent to copper are consistent with the rotation of the residue. (C) Crystal structure at 24h incubation with Cu(II), showing the thioeter bond and the Thr290 in its stacking position. (Reprinted with permission from Ref. 636, copyright 2008 American Chemical Society.)
Given the important role that Cu(I) seems to play in the biogenesis reaction, it would be highly desirable to have structural information on its coordination environment in the preprocessed enzyme. However, no crystallographic or XAS information on this species is currently available.
3.4.4 Electronic structure
Preprocessed copper bound GO, is an important target for spectroscopic studies that would provide insight into the metal ion activation for the biogenesis reaction. As indicated in section 3.4.2, this reaction is performed by both Cu(I) and Cu(II), and it is clear that the cofactor biogenesis is 104 times faster with Cu(I). As shown in section 2.1, Cu(I) is unaccesible to most spectroscopic techniques, and requires the use of X-ray absorption and emission spectroscopy at the Cu K-edge and crystallographic studies. However such studies have not yet been reported.
From section 3.4.2, when Cu(II) is loaded anaerobically into preprocessed GO, a series of three species is observed. The first species appears almost immediately after anaerobic Cu(II) loading. This species has a characteristic EPR signal (g∥ = 2.21, g⊥= 2.05, Gauss, Figure 111A black), indicative of coordination of the Cu(II) to the protein, and shows a weak absorption feature at 600 nm (ε600 = 200 M−1cm−1, Figure 111B, first spectrum) that likely reflects ligand-field transitions. After a few hours of incubation, the spectral signature of the second species is fully formed, although it is important to note that the 600 nm absorption band does not decay. This second species has been studied with several spectroscopic methods. Its EPR spectrum shows basically the same features as the short time species (g∥ = 2.225, g⊥ = 2.005, Gauss, Figure 111A blue and red), which are characteristic of an axial Cu(II) site) and lacks a detectable free radical feature. Its most distinctive feature is its yellow color, which reflects the intense ligand to metal charge transfer (LMCT) at 406 nm (ε406 = 3790 M−1cm−1, Figure 111B). The CD spectrum of the 406 nm species shows features at 434 nm and 748 nm (both bands positive, Figure 111C). The 406 nm absorption band was used to resonance enhance the Cu-ligand Raman vibrations associated with this feature. The rR spectrum shows vibrational features at 257 and 343 cm−1, assigned to Cu-S stretches (Figure 111D).645,646 Based on these vibrations and the lack of Tyr ring modes, the 406 nm band has been assigned as a Cys to Cu(II) charge transfer transition. At longer incubation times (24 h), the bleached species is formed. This third species has the thioether crosslink, and from the lack of an absorption and EPR features is likely reduced. Thus, from spectroscopy, a Cu(II)-thiolate complex forms and this then decays to form the crosslink between Tyrosine and Cysteine. The crosslink involves a two-electron oxidation. The first electron is accepted by the Cu, while the acceptor of the second electron is not clear. Experiments with 3.5 excess Cu(II) shows the rapid formation of the 406 nm feature and a broad and weak band at 625 nm. The band at 625 nm has tentatively been assigned to aqueous Cu(II), and does not decay with time. With 3.5 fold excess Cu(II), the 406 band decays to a species with absorbance at 435 nm and lower intensity.
Figure 111.

Spectral features of anaerobic Cu(II) loaded GO (406nm species). EPR from promptly made preprocessed GO-Cu(II) (A black) and 4 h incubation (A blue at 100K and A red at 305K). Absorption spectrum showing the formation of the 406 nm band (B). CD spectrum (C) and rR spectrum (D) of the 406 nm LMCT.
The reaction of anaerobic processed reduced GO with O2 generates mature GO. Mature GO has some distinctive spectral features not observed in any other copper metalloenzyme, reflecting the Cys-Tyr radical and its interaction with the Cu(II). The fully oxidized form shows no EPR signal, due to antiferromagnetic coupling between the Cu(II) and the Cys-Tyr crosslink radical cofactor (J < −100cm−1 for H = −2J•S1•S2). A small sharp signal around the free electron value corresponds to a small (~0.1 spins/protein) fraction of crosslinked apoenzyme in the sample that is able to form a stable free radical (Figure 112, upper right).634 In addition to the lack of EPR signal, the holo enzyme has distinctive features in its absorption spectrum. This is dominated by two intense bands: one centered at 445 nm (ε445 = 5500 M−1cm−1) the second is very broad and centered at 850 nm (ε850 = 3400 M−1cm−1) (Figure 112, upper left). The CD spectrum resolves these bands into at least 8 different transitions (Figure 112, left). rR experiments with excitations at 659 nm and 875 nm on the 850nm band show vibrations that correspond to ring mode frequencies (Figure 112 lower right). The peaks at 1382, 1487, 1479, 1595 and 1185 cm−1 are assigned to the tyrosyl radical, while the peaks at 1170, 1246, 1499 and 1603 cm−1 are assigned to the tyrosinate ligand. From these the 445 nm band has been assigned as a LMCT from the Cys-Tyr radical cofactor to the Cu(II). Based on absorption and MCD data, The 850 nm band is assigned as a ligand to ligand charge transfer (LLCT) between the axial tyrosinate and the equatorial Tyr-Cys ligand radical mediated by the dxy orbital of the Cu(II). TD-DFT calculations disagree with this assignment and suggest an intraligand transition of the cysteinated Tyrosine with no contribution from Tyr495. 634,647,648
Figure 112.

Spectral features of Cu(II)-Y(•). Absorption, Circular Dichroism, EPR and resonance Raman at 875nm.
3.4.5 Mechanism
In contrast to the biogenesis mechanism for the formation of TPQ in Amine Oxidase (see section 4.2), very little is known about the cofactor biogenesis mechanism in GO. The ortho covalent linking of the cysteine sulfur to the tyrosine is indicative of oxidative radical coupling reactions and would be consistent with the nucleophilic addition of a thiol to a phenoxyl radical or the addition of a phenol to a thiyl radical. The proposed mechanisms for the radical cofactor biogenesis are often based on the product and involve a high degree of speculation. For the more efficient Cu(I) aerobic mechanism the radical would have to be generated by reaction with O2, while for the less efficient but anaerobically viable mechanism the radical would be generated by ligand coordination to the Cu(II). This ligand could either be the Tyr272 or the Cys228, and the radical character in the Cu-ligand is thus thought to reflect a resonance contribution to the ground state.
Dooley and coworkers have proposed two possible pathways for the cofactor biogenesis with copper(II), one for aerobic and another for anaerobic conditions. The aerobic proposal (Figure 113) invokes the copper(II) coordination to the Tyr272 in the active site, and some radical character in the ground state, very similar to a proposal for the first step in the biogenesis reaction of Amine Oxidase (section 4.2). This tyrosyl radical character would react with O2, generating a peroxo-bridged quinone species. The thiolate would then attack at the ortho position with the loss of H2O2. The loss of the ortho hydrogen atom as H+ recovers the aromaticity of the ring and a second oxidation with another O2 molecule generates the final Cu(II)-Tyr(•) cofactor with the concomitant formation of a another H2O2 molecule. Firbanks, Dooley and coworkers have outlined an alternate aerobic mechanism, which involves the monooxygenation of the Cys228 to a sulfenate group. 638
Figure 113.

Reaction mechanism for the aerobic copper(II) cofactor biogenesis. L has been reported to be water or a negative counterion from the crystallization buffer (see 3.5.3)
Both Firbank and Dooley have also proposed a possible route for the anaerobic copper(II) dependent biogenesis.636,638 This mechanism (Figure 114) uses the rR data that show a copper-thiolate bond (i.e. the absorption band at 406 nm, Figure 111B). The authors propose that under anaerobic conditions, the copper(II) binds to the cysteine (and not the tyrosine), generating a copper(II)-thiolate species which has a resonance form in which one electron is transferred from the sulfur atom to the copper(II) to generate a Cu(I)-thiyl radical species. The thiyl radical would attack the phenol ring, and with the loss of an electron (acceptor unknown) generate a carbonium ion intermediate. Proton loss would then lead to the final species in which the thioether bond has been formed (i.e. the Cu(I) containing bleached species in Figure 114). 636
Figure 114.

Reaction mechanism for the anaerobic copper(II) cofactor biogenesis
These mechanisms, although consistent with the formation of a crosslinked product, have issues. In the aerobic route, the proposed resonance contribution of the radical form to the ground state complex will be very small, because it corresponds to a charge transfer excited state of the phenolate-copper(II) complex (see section 4), and the EPR data show no contribution from a radical. In the anaerobic route also no radical is observed and the final electron acceptor is unknown.
Finally, as indicated above, the biogenesis reaction with copper(I) is orders of magnitude faster than with copper(II). Whittaker and coworkers have proposed a mechanism for the copper(I) aerobic biogenesis reaction (Figure 115). The copper(I) coordinates to His496, His581 and Tyr272, and reacts with O2 to generate a superoxide radical via one electron transfer from copper to dioxygen. This would parallel the discussion in Section 3.3 concerning the non-coupled binuclear Cu enzymes and would likely involve end-on triplet CuO2 species.
Figure 115.

Reaction mechanism for the aerobic copper(I) cofactor biogenesis.
This bound radical is thought to perform hydrogen atom abstraction from the Cys228 to form a thiyl radical, reducing the superoxide to hydrogen peroxide. The next step would be an electrophilic addition of the thiyl radical to the Tyr272 ring and the formation of the thioether bond. Loss of the ortho proton with concomitant lost of an H2O2 molecule would then lead to a reduction of the copper(II) to copper(I). Addition of another equivalent of O2 generates the final Cu(II)-Tyr(•) species (Figure 115). Within this model the measured rate constant at high pH (8.5, see section 3.5.2) is associated with the deprotonation of the Cys228. The thiolate group has a lower reduction potential (E0(RS•/RS−) = 0.80 V vs. E0(RSH•/RSH) = 1.37 V both vs. NHE) and would react more rapidly (via electron transfer) to generate a thiyl radical and a coordinated peroxide. Exchange of the cysteine sulfhydryl group in D2O would also account for the observed SKIE. However, this mechanism does not deal with the spin along the biogenesis reaction, particularly as end-on Cu(II)-O2(−) complexes are triplets while formation of the crosslinked product results in a singlet. Also the one electron reduction of O2 is energetically unfavorable and for this to occur the potential of the Cu(I) preprocessed site needs to be tuned down and the resultant superoxide-Cu(II) bond needs to be strong.
In summary, a lot is known about the catalytic reaction of GO, but less is known about the biogenesis reaction to form the unique Cys-Tyr radical cofactor. Although the in vitro biogenesis reaction with Cu(I) is four orders of magnitude faster than with Cu(II), there is still a debate as to which copper redox state is involved in the biogenesis reaction in vivo. Both processes clearly involve different mechanisms as O2 is the oxidant with Cu(I) in the aerobic route while the Cu(II) would be the oxidant in the anaerobic mechanism. Also, the aerobic reaction appears to involve coordination of a Tyr to the Cu(I) while the anaerobic reaction appears to involve activation of the Cys by coordination to the Cu(II). Clearly, interesting chemistry needs to be understood in the formation of this unusual covalent crosslinked-Cu site.
3.5 Particulate methane monooxygenase and related systems: H-atom abstraction from methane
3.5.1 Enzymology
Methane monooxygenases (MMOs) present in methanotrophic bacteria accomplish a formidable task in nature: oxidation of the inert C-H bond of methane (bond dissociation energy of ~104 kcal/mol). It is this capacity which constitutes the enzyme’s functional significance and application. Methane gas is an underutilized source of global energy; understanding the mechanism of methane oxidation by MMOs can greatly advance the molecular design and synthesis of functional catalysts with the ability to carry out the methane to methanol conversion at ambient temperature and pressure. This would allow for the efficient storage and use of methane as an independent source of carbon-derived energy.649 This is attractive as current methods which perform the methane to methanol conversion involve high temperatures and pressures and are not energy efficient. In industry, the first step in methanol synthesis from methane gas is steam-methane reformation (SMR) (CH4 + H2O → CO + 3H2O) over a nickel catalyst, which is highly endothermic. The products of this reaction are referred to as synthesis gas (syngas). Syngas is further reacted over a different catalyst (Cu/ZnO/AL2O3), also at high temperature and pressure, to form methanol (CO + 2H2 → CH3OH). Methane is also a major contributing greenhouse gas.650 In this respect, overall methane reduction in the atmosphere is important and could be facilitated by MMOs.650–652 Also important from the standpoint of bioremediation is the ability of MMOs to oxidize other alkanes and alkenes, including chlorinated compounds.653,654
There are two types of MMOs, a soluble (sMMO)655 and particulate (pMMO),656–658 membrane bound form. Methane oxidation in sMMO occurs at a binuclear non-heme iron site, while for pMMO this has been controversial but appears to occur at a binuclear copper site (vide infra, 3.5.3).659 It should be noted that the only other enzyme currently known to oxidize methane is ammonia monooxygenase (AMO) and is found in ammonia oxidizing bacteria.660,661 These bacteria are obligate chemo-lithoautotrophs which oxidize ammonia to nitrite in two steps. NH3 is oxidized to NH2OH by AMO and NH2OH is oxidized to NO2− by hydroxylamine oxidoreductase (HAO). Like pMMO, AMO is membrane bound and has three subunits (Section 3.5.3). Unfortunately, the structure and metal content of AMO remain unknown due to the lack of pure active enzyme , which retains activity. Evidence exists that supports either a copper662,663 or iron664 or copper/iron665 metal containing cofactor in AMO.
Methanotrophic bacteria currently constitute 13 genera, all of which are within α and γ proteobacteria.666 These bacteria thrive in diverse, and sometimes extreme, aerobic environments,667 which consist of sediments, soils, peat bogs, freshwater, seawater, and hotsprings. Methane, utilized as a sole source of carbon and energy in these bacteria, is oxidized in the first step of their metabolic pathway (Figure 116). Proceeding methane oxidation is the oxidation of methanol to formaldehyde by methanol dehydrogenase, formaldehyde oxidation to formate by formaldehyde dehydrogenase (FalDH), and, finally, the pathway completes with formate oxidation to CO2 by formate dehydrogenase. Carbon utilized for biosynthesis of cellular material is assimilated at the level of formaldehyde. Further oxidation of formaldehyde to CO2 is dissimilatory, generating metabolic reducing equivalents. The division of these bacteria into types is based upon their mode or pathway of formaldehyde assimilation. Type I (genera Methylomicrobium, Methylomonas, Methylosphaera, Methylocaldum, and Methylobacter) methanotrophs use the ribulose monophosphate (RuMP) pathway and type II (genera Methylosinus, Methylocella, and Methylocystis) use the serine pathway. Type X (e.g. Methylococcus) utilizes the RuMP pathway, while also containing enzymes involved in the serine pathway. Type X also grow at higher temperatures than Types I and II. Researchers within the bioinorganic community largely study MMOs derived from the organisms Methylococcus capsulatus (Bath) (Type X) and Methylosinus trichosporium OB3b (Type II).
Figure 116.

Methanotrophic bacteria metabolic pathway.
Apart from the genus Methylocella, all types of methanotrophs produce particulate forms of MMO (pMMO), which are housed in intracytoplasmic membranes.668–670 The genus Methylocella utilizes only sMMO.671 However, both types II and X are capable of expressing either pMMO or a cytoplasmic, sMMO. Which MMO is expressed is dependent upon the growth media, with sMMO being expressed under copper starvation conditions. When copper is present in sufficient concentrations the ‘copper switch’ is thrown, a currently unknown mechanism, and pMMO is expressed.668–670,672
Given the importance of copper concentration in MMO expression, an efficient mechanism for copper uptake and acquisition is essential. Recent progress has been made concerning this subject. The main player has been identified as methanobactin (mb),673–677 originally coined, more generally, as copper binding compounds (CBCs) or copper binding ligands (CBLs), although the latter compounds were previously poorly identified and of variable sizes. Recently, mb has been isolated678,679 and more thoroughly characterized using XAS,680 XPS,681 and EPR,680,682 and is compared to the iron siderophores, the iron-binding compounds responsible for the cellular uptake of iron. Interestingly, copper bound mb is reduced (Cu(I)) upon either Cu(I) or Cu(II) loading.678–680,682,683 The source of the reducing equivalent has yet to be determined. Cu(I) and Cu(II) binding to mb have been proposed to take place via different pathways. Cu(II) binding is proposed to proceed through multiple steps, which may involve dimeric and tetrameric forms,679 while Cu(I) binding appears to take place through a monomer species. Affinity for Cu(II) has been reported for various Cu:mb ratios, and can be as high as 3.25 × 1034 ± 3.0 × 10¹¹ M−1 for Cu:mb ratios between 0.07 and 0.2.679 A value of >8 × 10¹⁸ M−1 was reported upon fitting the isothermal titration calorimetry data.679 The affinity of mb for Cu(I) has been reported to be (6–7) × 1020 M−1.684
pMMO and sMMO, although performing the same function, show large differences in their structural features. sMMO contains three components: a hydroxylase (MMOH), a regulatory protein termed B (MMOB), and a reductase (MMOR). All of these components must be present for methane oxidation. pMMO is trimeric; each monomer is composed of three polypeptide subunits, α (pmoB), β (pmoA), and γ (pmoC), ~47, ~24, and ~22 kDa, respectively, in an α3β3γ3 polypeptide arrangement. This differs from MMOH of sMMO. MMOH is a heart-shaped dimer; the protomers are each made up of three subunits, and form an overall α2β2γ2 structure. X-ray crystallographic studies (Section 3.5.3) indicate that the pmoB subunit is made up of two cupredoxin-like β-barrels, which constitute the soluble domain, and two transmembrane helices.685 The pmoA and pmoC subunits constitute the majority of membrane-spanning region. Although the metal content and the location and nature of the active site for methane oxidation have been highly controversial, X-ray crystallography, in combination with a reactivity study involving site-directed mutagenesis has recently allowed for significant headway. It is now considered that the pmoB subunit contains the active site for methane oxidation and consists of a binuclear copper center ligated by highly conserved residues.659 Furthermore, in the Bath enzyme, the pmoB subunit also contains a mononuclear copper site, but this site is not conserved across all pMMOs and is not observed in the crystal structure of the OB3b enzyme. The pmoC subunit houses another metal binding site. In M. capsulatus Bath it is occupied by zinc from the crystallization buffer, but houses copper in the OB3b enzyme. The function of the mononuclear metal sites is not currently understood. A more detailed discussion of the structure of pMMO is presented in Section 3.5.3.
3.5.2 Kinetics
Unlike the well-studied sMMO, only limited kinetic data exist for pMMO. Data that are currently available show a high degree of variability depending on preparation and purification procedure. The variations across different preparations have been previously discussed and tabulated.656,686 While sMMO is capable of oxidizing a wide range of substrates including n-alkanes, n-alkenes, aromatic and alicyclic compounds, pMMO is far less promiscuous and only shows the capability of oxidizing short alkane and alkene chains up to five carbons in length.687–690 Additionally, pMMO has been shown to hydroxylate n-butane and n-pentane enantioselectively to (R)-2-butanol and (R)-2-pentanol,691 respectively. Both pMMO and sMMO can oxidize chlorinated substrates.692
The activity of pMMO samples is typically determined using the propylene epoxidation assay either with NADH (used for membrane bound pMMO) or duroquinol (used for solubilized pMMO) as a reductant. As mentioned, values obtained from these assays show a high degree of variation. Nevertheless, specific activities of ~10–200 nmol propylene oxide (mg protein · min)−1 have been reported for the membrane bound form of M. capsulatus (Bath), while values of ~2–126 nmol propylene oxide (mg protein · min)−1 have been reported for purified preparations.656,693 Purified M. trichosporium OB3b pMMO had a reported activity of ~3–4 nmol propylene oxide (mg protein · min)−1. A more confusing aside is that, in one report, when pMMO was isolated under anaerobic conditions, a specific activity of 290 nmol propylene oxide (mg protein · min)−1 was measured, the highest yet observed.670 This is inconsistent with another report that anaerobic purification yields an enzyme with little to no activity.694
Although it is typical to use NADH or duroquinol (only quinols can reduce solubilized pMMO)675,694–69 in determining the enzymatic activity, the in vivo electron donor is unknown. Some data exist that suggest various possible physiological electron donors for pMMO. pMMO activity is inhibited by diphenyliodonium (DPI). DPI is known to inhibit type 2 NADH:quinine oxidoreductase (NDH-2), which is proposed to catalyze the reduction of pMMO through the reduction of a pool of endogenous quinones. These reducing equivalents may arise from oxidation of formaldehyde and formate during metabolism (Figure 116). Alternatively, methanol dehydrogenase and the cytochrome bc1 complex have also been implicated as having possible involvement in the electron transfer process. The former proposal is based on the observation of increased pMMO activity when copurified with 63 and 8 kDa polypeptides, where the 63 kDa polypeptide may be methanol dehydrogenase. The cytochrome bc1 complex may reduce pMMO through ubiquinone 8, a hypothesis based on the copper induced coexpression of pMMO and the cytochrome b-linked FalDH. A putative docking site for electron transfer agents, which consists of several negatively charged residues, has been observed by X-ray crystallography (Section 3.5.3).685
pMMO from M. trichosporium OB3b is inhibited by the aerobic addition of H2O2.691 This was determined by the observation that the addition of catalase to pMMO reduced with duroquinol increased the activity of pMMO. H2O2 inhibition could also be reversed by the subsequent addition of catalase.
Studies of sMMO have benefited from a large body of kinetics data using radical clock type probes; however, little data of this type have been accumulated for pMMO. Furthermore, single-turnover reactivity has yet to be addressed for pMMO, and therefore little is known about the catalytic cycle. Using chiral ethanes and butanes,697 Chan and coworkers have observed complete retention of stereochemistry upon hydroxylation and a kH/kD kinetic isotope effect of 5.2–5.5 at 30 °C.698 Further study indicated that, for multicarbon alkane chains, pMMO preferentially oxidizes at the C-2 position.699 Also, no intermolecular 12C/13C kinetic isotope effect was observed for pMMO initiated propane hydroxylation at the secondary carbon (no 12C/13C isotope effect was found for sMMO either), which was interpreted as indicating that there is very little transition state structural change at the carbon center involved in the oxidation.700 Alkene epoxidation of cis- and trans-but-2-ene by pMMO yielded only the meso and d,l-2,3-dimethyloxirane products, which led the authors to favor an electrophilic syn addition across the double bond.699 With these data, Chan and coworkers argue that methane oxidation by pMMO occurs via a concerted, direct O-atom (or oxene) insertion mechanism (vide infra, Section 3.5.5).700,701 In order to unravel the mechanism of pMMO, further single turnover kinetics data, activation energies, and trapping intermediates will be important.
3.5.3 Structure
X-ray crystal structures of pMMO have been reported for both the M. capsulatus (Bath)685 and M. trichosporium OB3b658 enzymes at resolutions of 2.8 and 3.9 Å, respectively. We first address the Bath structure and then highlight important differences between the M. capsulatus Bath and M. trichosporium OB3b structures. pMMO is found to crystallize as a trimer, as mentioned above, consisting of three copies each of the pmoB, pmoA, and pmoC subunits, which together form an α3β3;3 polypeptide arrangement (Figure 117). The trimer is ~105 Å in length and ~90 Å in diameter with a large hole at its center. The three pmoB subunits form the soluble region, which consists of six β-barrels, two from each protomer, and extends ~45 Å from the membrane region (Figure 117). The pmoA and pmoC subunits comprise the majority of the membrane region, which is spanned by 42 transmembrane helices, 14 from each protomer. The hole is ~11 Å in diameter in the soluble region and expands to ~22 Å on its way through the intramembrane space. Hydrophilic residues (e.g., glutamic and aspartic acid and arginine) line the inside of the hole in the soluble region while hydrophobic residues line the hole in the membrane region. The hydrophilic residues are not conserved, however.
Figure 117.

pMMO crystal structure. (a) Trimer viewed parallel to the membrane normal and (b) perpendicular to the membrane normal. The three protomers are shown in dark purple, magenta, and light pink. Helices are represented as cylinders and β strands are represented as arrows. The soluble domain is represented by the β-barrels. (Reprinted with permission from Macmillan Publishers Ltd: Nature Ref. 685, copyright 2005.)
A single protomer is shown in Figure 118a. It contains one copy each of pmoA, pmoB, and pmoC. A single subunit of pmoB, shown in Figure 118b, consists of two anti-parallel β-barrels (one seven stranded, the other eight) located at both the N-terminus and C-terminus. These β-barrels are roughly perpendicular to one another and are separated by a β-hairpin and two transmembrane helices. pmoA and pmoC are shown in Figure 118c and Figure 118d, respectively. pmoA is made up of seven transmembrane helices, which pack against the two from pmoB. Some of these helices are parallel to the membrane while others are tilted. The five transmembrane helices of pmoC are parallel to the membrane.
Figure 118.

The pMMO subunits. (a) Stereoview of a single protomer with pmoB shown in magenta, pmoA shown in yellow, and pmoC shown in blue. Copper ions are shown as cyan spheres (the arrow points to the binuclear copper site), and a zinc ion is shown as a grey sphere. (b) The pmoB subunit viewed looking down the membrane normal. The N-terminal β-barrel is in the middle. (c) The pmoA subunit, and (d) the pmoC subunit. (Reprinted with permission from Macmillan Publishers Ltd: Nature Ref. 685, copyright 2005.)
pmoB was found to contain two distinct metal sites: one mononuclear copper center and one binuclear copper site. The mononuclear copper center is located ~25 Å above the membrane near the N-terminal β-barrel surface (Figure 118a and b) and is coordinated via δ-N atoms of His48 and His72 in a close to linear fashion (Figure 119A). Another residue, Gln404, is within 3 Å of copper. No solvent ligands could be discerned at 2.8 Å resolution. Neither His48 nor Gln404 are conserved across all pmoB subunits, and this results in different metal contents across pMMOs (vide infra). Also contained within the pmoB subunit is a binuclear copper site (Figure 119B), found to be ~10 Å from the lipid bilayer interface (arrow, Figure 118a). The Cu-Cu distance was refined to ~2.6 Å, in good agreement with EXAFS experiments (vide infra, Section 3.5.4). One copper is coordinated by both the δ-N and N-terminal amino nitrogen of the N-terminus His33 residue (the first 32 residues have been proposed to be part of a leader sequence) while the other copper is coordinated by both the δ-N and ε-N of His137 and His139, respectively–two highly conserved residues in various pMMOs. pmoC contains the third metal binding site in the crystal structure. This site, ~19 Å from the binuclear copper site, contains zinc (Figure 118a, just beneath arrow). The Zn2+ coordination environment is represented by a distorted tetrahedron made up of by the conserved residues Asp156, His160, and His173 from pmoC and Glu195 from pmoA (Figure 119c). The authors contribute the presence of zinc in this site to zinc acetate derived from the crystallization buffer because of the virtual absence of zinc measured by inductively coupled plasma atomic emission spectroscopy (ICP-AES) before crystallization. The possibility of other metal binding sites was not fully ruled out. Chan et al have used the crystal structure to model a trinuclear copper cluster in a site ~13 Å from the ‘zinc site’, termed ‘Site D’ (Figure 120).702 The presence of this cluster was considered on the basis of metal stoichiometry and spectral data (vide infra, Section 3.5.4). This putative metal binding site is composed of a number of hydrophilic residues from the pmoA subunit (His38, Met42, Met45, Asp47, Trp48, Asp49, and Glu100) and one from the pmoC subunit (Glu154). Chan et al proposed that the lack of metals in this site in the crystal structure was due to loss of copper during purification. In summary, the X-ray crystallographic results for M. capsulatus (Bath) pMMO show that the enzyme contains both a mononuclear and a binuclear copper site located within the soluble pmoB (spmoB) subunit, a possible third metal binding site in pmoC, and a hydrophilic pocket that may house other metals.
Figure 119.

The pMMO metal centers of the Bath enzyme. (a) Mononuclear copper center; (b) Binuclear copper center; and (C) ‘zinc center’, which contains copper in the OB3b enzyme. Ligand sets are color coded (Magenta (pmoB); Green (pmoC); and Blue (pmoA). (Reprinted with permission from Ref. 657. Copyright 2007 American Chemical Society.)
Figure 120.

Proposed location of ‘Site D’ in the X-ray crystal structure of the pMMO Bath enzyme. (Reprinted with permission from Ref. 701. Copyright 2008 American Chemical Society.)
The X-ray crystal structure of M. trichosporium OB3b shows interesting correlations to that of M. capsulatus (Bath). There was also a Cu-Cu interaction in this structure (~2.52 Å); however, the mononuclear copper site which was present in M. capsulatus (Bath) (in the pmoB subunit) is not found in pMMO from M. trichosporium OB3b as the ligands of this metal site are not conserved. The third metal binding site (zinc site) present in M. capsulatus (Bath) was found to be occupied by copper in M. trichosporium OB3b. Here, copper is coordinated by the same ligands found for the ‘zinc site’ in M. capsulatus (Bath) (ligands are conserved). Lastly, similar to the Bath enzyme, no copper was found in site D.
Recently, a 2.68 Å X-ray crystal structure of Methylocystis species strain M (type II) has appeared and is the highest quality structure yet determined.703 It shows structural similarities to both M. capsulatus (Bath) and M. trichosporium OB3b in that it contains a binuclear copper site (although not all pmoB subunits bind two copper ions, but instead contain only one (vide infra)), a ‘zinc site’ (pmoC), and no mononuclear site (pmoB subunit) (Figure 121A). Furthermore, the overall trimeric structure is maintained; however this structure has led to revised models of the pmoA and pmoC subunits and the coordination geometry of the ‘zinc site’ in the M. capsulatus (Bath) structure. The pmoB subunit structure in Methylocystis species strain M is very similar to other pMMOs; however, two of the three binuclear active sites of the trimer were modeled as containing one copper ion. The lack of the second copper ion in these sites was proposed to be due to the increased lability of copper. The structure also revealed that part of pmoA in the Bath enzyme structure was actually from pmoC. An overlay of pmoA from the Methylocystis species strain M and the original M. capsulatus (Bath) structures are shown in Figure 121B. A difference was observed at Thr196 (Thr191 in M. capsulatus (Bath) pmoB), which is labeled in Figure 121B, where it extends along the membrane (on the periplasmic side) and is connected to a transmembrane helix (residues 217–244) and terminates at residue 252 (on the cytoplasmic side of the membrane). This is different from the structure from Bath, in which Thr191 is modeled as continuing through the membrane to the cytoplasmic side and winds up toward the periplasmic side (overlaid with residues 217–244 of Methylocystis species strain M). This difference in traces indicated that residues 195–215 in the M. capsulatus (Bath) structure belonged to pmoC, which now makes them residues 178–197 of Methylocystis species strain M pmoC. Furthermore, the residues 225–252 of pmoC from Methylocystis species strain M (Figure 121C) were proposed to derive from a yet to be identified polypeptide. Because the extra helix is not observed in the Bath enzyme (Type X) and is also observed in the OB3b enzyme, it was suggested that it may be related to type II methanotrophs. The M. capsulatus (Bath) structure was resolved using this model as a starting point and resulted in a higher quality fit. Also, instead of Asp156, His160, and His173 from pmoC and Glu195 (M. capsulatus (Bath) numbering) from pmoA being bound to zinc, this structure showed that zinc was bound by only Asp129, His133, and H146 from pmoC. Glu200 (Methylocystis species strain M numbering) from pmoA is H-bonded to pmoB residues. A fourth ligand was modeled as water, but possible partial occupation of this ligand binding site by a disordered side chain was not ruled out because of the poor electron density in this region and the fact that residues 197–225 could not be modeled. This structure shows that the ‘zinc site’ is now exposed and resides along the wall of the hole in the center of the trimer.
Figure 121.

Structures of Methylocystis sp. strain M pMMO subunits. (A) One of the three protomers in the trimer. The pmoB, pmoA, and pmoC subunits are shown in gray, blue, and purple, respectively. Copper ions are shown in cyan and a zinc ion is shown in gray. The additional helix is shown in yellow. (B) Overlay of the pmoA subunits from the Methylocystis sp. strain M (blue) and the original M. capsulatus (Bath) (gray) structures. (C) Overlay of the pmoC subunits from the Methylocystis sp. strain M (purple) and the original M. capsulatus (Bath) structures. (Reprinted with permission from Ref. 703. Copyright 2011 American Chemical Society.)
The hydrophobicity of a protein pocket adjacent to the binuclear site has led to the suggestion that it may support methane binding.691 This pocket is lined with hydrophobic residues (Pro94 from pmoB and Leu78, Ile163, and Val164 from pmoC). Other aspects of the protein structure have been used to make observations concerning putative electron donors. As mentioned in Section 3.5.2, the in vivo electron donor is not known for pMMO. It was noted previously that there was a section of non-protein derived, strong electron density found close to the interface of the pmoB β-barrels (Figure 122, Left).685 This density was overlaid with the structure of a duroquinol molecule, and it was suggested that quinols derived from exogenous quinones could bind in this region. Also, Figure 122, Right shows a surface representation of the electrostatic potential of a pMMO protomer. A negative (red) patch made up of acidic residues from both the pmoB and pmoC subunits is located in the soluble region. This patch of density is near the binuclear copper site in the pmoB subunit and was compared to the proposed cytochrome c docking site in cytochrome c oxidase.704
Figure 122.

(Left) Unmodeled electron density located at the interface of the pmoB β-barrels. The 2Fo–Fc density (contoured at 1σ) is colored light green and the Fo–Fc density colored yellow (contoured at 3σ). A duroquinone molecule (HIC-up ID DQN) is superimposed on the density. (Right) Surface representation of the pMMO protomer colored according to electrostatic potential: red, −12 kT; white, 0 kT; blue, +12 kT. (Reprinted with permission from Macmillan Publishers Ltd: Nature Ref. 685, copyright 2005.)
It is also interesting to compare the binuclear copper site found in pMMO to those observed for the other coupled binuclear copper sites in hemocyanin and tyrosinase (Section 3.1 and 3.2), as well as the T3 site in the MCOs (Section 3.7.1). In pMMO, the protein only provides two nitrogen-based ligands to each copper, whereas three histidine-derived ligands to each copper are present in the other binuclear copper sites. Furthermore, the Cu-Cu distance in pMMO is very short (~2.6 Å) relative to hemocyanin (~4 Å), tyrosinase (~3.5 Å), and the T3 site in the MCOs (~6 Å) in their deoxy states. The function of protein constraints on the ligand field geometry of the coppers and the initial Cu-Cu separation has already been shown to play a functional role in the differences in O2 activation (or reversible binding) across these related active sites (e.g. the close Cu(I)-Cu(I) distance in hemocyanin relative to the T3 site provides the driving force for O2 binding in the former). Some experimental data concerning O2 (and/or H2O2) activation at the binuclear site in pMMO exist and are summarized in Section 3.5.4.
As mentioned in Section 3.5.1, copper uptake and acquisition is accomplished by mb. Despite being difficult to isolate and purify, several different types of mbs have been identified, although only a couple have been fully structurally and chemically characterized. The 0.92 Å resolution X-ray crystal structure of mb from M. trichosporium OB3b is shown in Figure 123.684 The exact mass has been determined from mass spectrometry to be 1215.1781, with the molecular structure of 1-(N-[mercapto-{5-oxo-2-(3-methylbutanoyl)oxazol-(Z)-4-ylidene}methyl]-Gly1-L-Ser2-L-Cys3-L-Tyr4)-pyrrolidin-2-yl-(mercapto-[5-oxo-oxazol-(Z)-4-ylidene]methyl)-L-Ser5-L-Cys6-L-Met7 (C45H56N10O16S5Cu−).678,681 Other forms of fully structurally characterized mbs vary slightly.683 Cu(I) is bound in a distorted tetrahedron by two nitrogen (~2.0 Å) and two sulfur ligands (~2.4 Å) provided by the two non-amino acid moieties (oxozolone rings), which each contribute one nitrogen and one sulfur ligand (Figure 123). The sulfur ligands are modeled as thionyl groups (C=S-Cu) as opposed to thiolates (C-S-Cu).
Figure 123.

Structure of Cu(I) full length-mb.. (Reprinted with permission from Ref. 684. Copyright 2011 American Chemical Society.)
3.5.4 Electronic Structure
In this section, we first briefly review the spectral features of mb, then focus on the spectral data of pMMO. Because of the controversial nature of the active site and its rationalizations based on the reported spectroscopy, we briefly summarize these spectral data and the proposed structures, but focus more on the data that directly relate to the M. capsulatus (Bath) and M. trichosporium OB3b crystal structures (Section 3.5.3).
To date, absorption data for apo-mb have been reported for M. trichosporium OB3b from various preparations with only subtle differences.678,679,683,684,705,706 They show several features in the 200–400 nm region. From low to high energy, these features have been assigned to the oxazolone rings and the thionyl functionalities. Small contributions in the higher energy region (<300 nm) may also occur from the disulfide linkage as well as the phenolic group of the tyrosine residue.679 The absorption spectra do show variability with addition of Cu(II), pH, and UV light exposure.678 Fluorescence data at various wavelengths have been reported as well, and have been shown to be quenched upon addition of Cu(II).678,706 As mentioned in Section 3.5.1, Cu(I) is bound in mb, despite Cu(II) loading. The source of the reducing electron is not currently known, but structural, analytical, and spectroscopic methods have been able to rule out the S(Cys) residues or disulfide linkages of the copper binding molecule or a ‘sacrificial’ pool of mb molecules which form disulfide linkages.679,680,684 In addition, the origin of high binding affinity for Cu has not been determined and no electronic structure calculations have appeared. A bonding analysis for copper mb would be important in determining the origin of the high affinity for copper and, possibly, whether or not the ligand donates the reducing equivalent upon Cu(II) binding.678 mb can also bind other metals, but with a reduced affinity relative to Cu.707
As opposed to sMMO, the study of pMMO has not benefited from a large body of spectroscopic data on different forms of the enzyme, and no catalytic intermediates have yet been observed. This is due mostly to the difficulties associated with handling and purifying pMMO, which has led to a number of different preparation protocols to be implemented and reported in the literature. Not surprisingly, the metal contents and stoichiometries of these preparations vary considerably. Tabulations provide a summary of these various preparations and the resultant metal analyses.656,686 Some spectroscopic data do exist on these different samples, and they have been used to generate hypotheses of the active site structure of pMMO. Chan and coworkers, with samples containing 13.6 Cu per 100 kDa, observed a broad, isotropic EPR signal at g ~2.1. This signal was superimposed with a type 2 EPR signal (g∥ = 2.24 and g⊥ = 2.059), which exhibited hyperfine coupling (190 × 10−4 cm−1). The g ~2.1 signal was assigned to a ferromagnetically coupled trinuclear Cu cluster,708 while the type 2 signal was proposed to arise from a separate trinuclear Cu(II) cluster containing two antiferromanetically coupled Cu(II)’s.709 When combined with the Cu stoichiometry, Chan and coworkers proposed pMMO housed five trinuclear Cu clusters: 3 E-clusters, which function as ET conduits, and two catalytic C-clusters.689 Note that the appearance of the X-ray crystallographic data led to the revision of this original assignment to a single catalytic trinuclear Cu center, which was modeled into the M. Capsulatus (Bath) crystal structure (vide supra, Section 3.5.3)702 (Chan and coworkers also pointed out that the other C-cluster could also be mononuclear or binuclear copper). Other groups have not been successful in reproducing the broad, isotropic g ~2.1 signal, but do observe the type 2 EPR signal.670,675,694,695,710 Alternative interpretations of the g ~2.1 EPR signal have been suggested.675,694,711,712 Other propositions for the active site structure in pMMO include a Cu/Fe site,675 a binuclear iron site,713 or a binuclear copper site.685,695 The Cu/Fe proposition by DiSpirito and coworkers was due to the observation that pMMO activity increased upon addition of Fe(III) to M. trichosporium OB3b membrane preparations isolated from cells grown at low iron concentrations. Mössbauer data indicated the presence of a binuclear Fe(III) center, which was observed to be diamagnetic and thus antiferromagnetically coupled. The binuclear iron site was proposed to reside in the crystallographic ‘zinc site’ in M. Capsulatus (Bath).
Before the crystal structure in 2005, Rosenzweig et al suggested pMMO from M. Capsulatus (Bath) contained both a mononuclear copper site and a copper containing cluster.695 In that study, the XANES exhibited features indicative of both Cu(I) and Cu(II) in as-isolated pMMO (pMMOiso). The Q-band EPR data for purified and membrane bound pMMO are given in Figure 124, Left. The spin Hamiltonian parameters were reported to be g∥ = 2.24, g⊥ = 2.05, A∥ = 177 × 10−4 cm−1. Integration of the X-band EPR signal indicated that this species accounted for 40–50% of the total copper present (Note a variety of methanotrophs display this type 2 EPR signal). The intensity of this EPR feature did not increase upon ferricyaninde addition, but did go away entirely upon addition of dithionite. The EXAFS data indicated a Cu-metal interaction, which was best fit to a 2.57 Å Cu-Cu interaction. Another study has provided more information on the nature and oxidation state of the metal sites in purified pMMO.714 Again, the XANES indicated the presence of both Cu(I) and Cu(II) in the as-isolated sample (Figure 124, Middle; note that the 8984 eV feature is characterstic of Cu(I) (see Section 2.1). The intensity of the Cu(I) feature increased upon reduction and decreased slightly with the addition of H2O2, although it did not disappear entirely. EPR spin quantitation indicated that ~40 % of copper in pMMOiso and oxidized (pMMOox) was EPR active. As observed before, this type 2 signal went away upon reduction. It also did not increase in intensity upon H2O2 addition. EXAFS data for pMMOox, pMMOiso, and pMMOred are given in Figure 124, Right. Single first shell fits to these data gave Cu-O/N bond lengths of 1.95, 1.97, and 2.11 Å for pMMOox, pMMOiso, and pMMOred, respectively. Addition of a split first shell Cu-O/N ligand environment improved the fits. The bond distances for pMMOred and pMMOox were within the range of 1.93–2.11 Å. However, the Cu-O/N ligand environment in pMMOiso was best fit with inclusion of a bond at 2.22 Å in addition to 1.97 Å. Fits were further improved when scattering interactions at >2.5 Å were included. This resulted in a Cu-Cu bond length of 2.51 Å (a refinement of the previously reported 2.57 Å) for pMMOiso and pMMOox. This increased to 2.65 Å in pMMOred. Furthermore, the Fe EXAFS data reported in this study did not yield an iron-metal scattering in the 2.5–2.65 Å range, which ruled out a Cu/Fe site. The very low intensity (~3 % of the Cu edge) observed in the Zn fluorescence region was used to rule out the presence of zinc in the ‘zinc site’ observed in crystallography, which indicated that this site was loaded with either copper or another metal. The EPR data (Q-band, 2K) also indicated that the iron present in these samples corresponded to high-spin ferric heme impurities (g⊥ = 6.00 and a g∥ feature that could not be observed due to overlap with the copper-based signals).
Figure 124.

(Left) Q-band EPR spectra (2 K) of purified (upper) and membrane-bound (lower) pMMO. (Reprinted with permission from Ref. 695, copyright 2003 National Academy of Sciences, USA.) (Middle) Cu XANES spectra for pMMO from the Bath enzyme. (Right) Cu EXAFS fitting analysis. (Panel A) Raw unfiltered EXAFS data and fits. (Panel B) Fourier transforms and simulated fits. Empirical data are in black and fits are in gray. (Fit over a k range of 1–12.85 Å−1.) (Reprinted with permission from Ref. 714. Copyright 2006 American Chemical Society.)
Spectral data relative to the OB3b enzyme crystal structure have been reported (i.e. purified M. trichosporium OB3b, three Cu/protomer and no iron or zinc).658 The X-Band EPR spectra are given in Figure 125, Left. These contained contributions from two species: a major component (g∥ = 2.247, g⊥ = 2.052, A∥Cu = 196 × 10−4 cm−1) and a minor component (g∥ = 2.225 and g⊥ = 2.060 with an A∥Cu very similar to the major component). The relative amount of the two components was not determined, but it was estimated that the major component made up at least 80% of the total copper present. Cu XANES data are given in Figure 125, Middle, and showed that purified M. trichosporium OB3b contained a mixture of Cu(I) and Cu(II). EXAFS data (Figure 125, right) were best-fit with a Cu-O/N ligand environment with 1.97 Å bond lengths and a Cu-Cu distance of 2.52 Å.
Figure 125.

(Left) X-Band EPR of purified M. trichosporium OB3b pMMO. (A) Experimental data; (B) and (C) simulations of the major and minor components, respectively. (Middle) Copper XANES spectrum of purified M. trichosporium OB3b pMMO (solid line indicates 8984 eV). (Right) Copper EXAFS fitting analysis for purified M. trichosporium OB3b pMMO. (A) Raw unfiltered EXAFS data (Black) and simulations (Gray) for copper bound to pMMO. (B) Fourier transforms of the raw EXAFS (Black) and the best-fit simulations (Gray). (Reprinted with permission from Ref. 658. Copyright 2008 American Chemical Society.)
A limited set of spectroscopic data do exist on variants (obtained by site-directed mutantagenesis) available in pMMO from a heterologous expression system in E. coli (vide infra, Section 3.5.5).659 These are given in Figure 126, Left. Fits to the EXAFS data for spmoB (Figure 126, Left, A and B) yielded a Cu-O/N environment with bond lengths of 1.95 Å and a Cu-Cu interaction at 2.53 Å. The XAS edge data on spmoB (Figure 126, Right) indicate that all copper is present in the reduced state, despite loading Cu(II). The source of the electron was not determined, nor was the possibility of photoreduction ruled out. The Cu-Cu interaction at 2.53 Å in spmoB is shorter than that found in pMMOred (2.65 Å). Some spectral data exist for the enzyme variants spmoB_H48N and spmoB_H137,139A (Figure 126, Left, (C,D) and (E,F) and Figure 126, Right, (B,C)). The former was designed to eliminate the mononuclear copper site (this is the copper site that is not present in the OB3b enzyme, but is present in the Bath enzyme) and the latter to eliminate the binuclear copper center (vide infra, Section 3.5.5). The XAS data on the these variants indicate that copper is present as a mixture of Cu(I) and Cu(II) (Figure 126, Right). The EXAFS data for spmoB_H48N were best fit with a Cu-O/N ligand environment of 1.96 Å and a Cu-Cu distance of 2.52 Å. The presence of a binuclear copper site in spmoB_H137,139A was ruled out by the fact that, upon including a second shell, the fits were best when carbon was used as a scatterer rather than copper.
Figure 126.

(Left) Copper EXAFS data and simulations for spmoB and spmoB variants. Raw k3-weighted EXAFS data and phase-shifted Fourier transforms are shown for spmoB (A,B), spmoB_H48N (C,D), and spmoB_H137,139A (E,F). Raw unfiltered data are shown in black and best-fit simulations are shown in grey. χ, EXAFS region of the XAS spectrum; Δ, apparent shift in Fourier transform displayed bond distance (by ~−0.5 Å) due to a phase shift during calculation of the transform; k, photoelectron wavevector; R, metal-ligand bond length. (Right) Normalized XANES spectra of spmoB (A), spmoB_H48N (B), and spmoB_H137,139A (C). Vertical line is drawn at ~8984 eV. (Reprinted by permission from Macmillan Publishers Ltd: Nature Ref. 659, copyright 2010.)
Thus, the current, most favored situation for the oxidation states of the metal ions in pMMOiso from the combination of the X-ray crystallography and spectroscopy is that the binuclear copper site is in a localized mixed-valence Cu(I)Cu(II) state.657 Since reduction eliminates the type 2 EPR signal and the Cu-Cu distance increases from 2.51 to 2.65 Å, this signal is thought to be associated with the mixed-valent binuclear copper site. Thus, the binuclear copper site would be in a Cu(I)Cu(I) state in the fully reduced enzyme, which is important for further development of the mechanism of methane oxidation (vide infra, Section 3.5.5). The copper bound in the mononuclear and ‘zinc site’ would then be either Cu(I) or Cu(II). Note that the assignment of the Cu(II)Cu(I) site as localized mixed-valent (vide supra) is difficult to rationalize due to the short Cu-Cu distance (2.51 Å). This short distance leads to a direct overlap of the Cu 3d orbitals and will strongly favor a delocalized Cu(1.5)Cu(1.5) site. It is also interesting to note that the assignment as localized mixed-valent comes from the lack of the observation of a seven-line hyperfine pattern. An analogous situation occurs in CuA, which is a fully delocalized mixed-valent Cu(1.5)Cu(1.5) site (vide infra, Sections 3.7.2 and 5.2), where upon lowering the pH from 7 to 5 the seven-line hyperfine pattern collapses into a four-line pattern.59,715 Originally, this was thought to reflect a transition from a delocalized to a localized mixed-valent state; however, in CuA, lowering the pH from 7 to 5 resulted in the loss of a His ligand due to protonation and allowed a small amount of 4s mixing on one of the coppers.716 This mixing is responsible for the change in the EPR spectrum, but the site remains fully delocalized (from ENDOR and rR spectroscopy) due to the strong Cu-Cu interaction. If the binuclear site in pMMO is mixed-valent, a possibility such as this has yet to be ruled out. Further spectroscopic study of pMMO in various oxidation states should further elucidate the nature of the metal sites in pMMO.
Some spectroscopic data suggest H2O2 and/or O2 may bind at the binuclear copper site.717 Anaerobic reaction of reduced pMMO (solubilized) with H2O2 (incubated overnight at room temperature) resulted in the formation of an absorption band at 345 nm (ε not reported) (Figure 127 (left)). This absorption band does not form using O2 instead of H2O2. The same experiments were carried out in spmoB and the spmoB_H48N, spmoB_H137,139A, and spmoB_H48N_H137,138A variants. For reduced spmoB, addition of O2 and H2O2 both result in the formation of 345 nm absorption feature (ε ~10 000 M−1cm−1) (Figure 127 (middle)). Titration data indicated binding of two molecules of H2O2 per spmoB. Only the spmoB_H48N variant was capable of forming the 345 nm band with O2 and H2O2 (Figure 127 (right)). Furthermore, incubation of CH4 and the spmoB samples in which the 345 nm band was formed (1h and 45 °C) resulted in a loss of absorption intensity, which was proposed to indicate that the 345 nm species is involved in the CH4 oxidation pathway. However, it should be noted that protein degradation occurred during this process and inhibited the monitoring of the absorption feature with time. The results of a similar experiment without CH4 were not reported. The absorption band energy and ε of these Cu2-H2O2/O2 derived species are all consistent with the formation of the following: 1) µ-η2-η2-peroxo-Cu(II)2; 2) met-Cu(II)2; and 3) hydroxo-bridged Cu(II)2 type 3 site. These results support the fact that Cux/Oy species can be formed at the binuclear copper site in both solubilized pMMO and spmoB. Further studies are needed to determine whether they are involved in catalysis. Lastly, also interesting are possible comparisons between the results presented here and those for the O2 activation of Cu-ZSM-5, the only binuclear copper model capable of methane oxidation, where a µ-η2-η2-peroxo-Cu(II)2 is the precursor to a mono-(µ-oxo) dicopper(II) reactive intermediate (vide infra, Section 3.5.5).718
Figure 127.

Absorption data for O2 and H2O2 binding in pMMO. (Left) H2O2 reacted with solubilized pMMO from M. capsulatus (Bath) (Heme contaminant absorbs at 410 nm). Difference absorption spectra for both H2O2 and O2 reacted with (Middle) spmoB and (Right) O2 with spmoB and the spmoB_H48N, spmoB_H137,139A, and spmoB_H148N_137,139A variants. All samples were anaerobically reduced before addition of oxidant. (Reprinted with permission from Ref. 717. Copyright 2012 American Chemical Society.)
3.5.5 Mechanism
3.5.5.1 Methane Oxidation by pMMO
Recently, a study by Rosenzweig and coworkers has addressed the location and nature of the active site for CH4 oxidation in pMMO, and builds on this group’s report of the 2.8 Å X-ray crystal structure of pMMO from M. capsulatus (Bath) (vide supra, 3.5.3).659 Using a series of variants from site-directed mutants, the authors showed that methane oxidation occurs at the binuclear copper site in the soluble domain of the pmoB subunit.
Specifically, the as-isolated pMMO sample in membranes had a specific activity of 50–200 nmol propylene oxide mg−1 min−1.659 Cyanide treatment to remove metal ions eliminated all activity in the propylene epoxidation assay. Reconstitution of apo pMMO with 2–3 equivalents of copper/100 kDa pMMO protomer restored ~70 % of the propylene epoxidation activity. The ability for these samples to oxidize methane was also investigated. The as-isolated pMMO samples had a specific activity of 22.9 ± 6.1 nmol methane mg−1 min−1. Reconstitution with copper after cyanide treatment restores ~90 % of the activity (21.7 ± 3.5 nmol methane mg−1 min−1). Addition of iron under either aerobic or anaerobic conditions to the apo pMMO, however, does not form an active enzyme. This was taken as evidence that copper, not iron, is contained in the active site of pMMO.659
With the knowledge that copper is the metal in the active site, the authors showed that the location of the active site is in the spmoB subunit, specifically, spmoBd1 (the amino (N)-terminal cupredoxin domain; residues 33 – 172, contains both the binuclear and mononuclear copper sites).659 The soluble domains of the pmoB subunit were expressed in E. coli. spmoB, spmoBd1, and spmoBd2 (the carboxy (C)-terminal cupredoxin domain; residues 265 – 414) load copper in quantities of 2.84 ± 0.66, 1.59 ± 0.84, 0.24 ± 0.09, respectively. spmoB loads 0.17 ± 0.1 iron ions per protein. (The low copper loading value of 1.59 ± 0.84 for spmoBd1 is attributed to protein instability due to loss of stabilizing contacts (i.e., H-bonds and hydrophobic contacts) between spmoBd1 and spmoBd2). Both propylene epoxidation and methane oxidation activity were measured for these samples. The results are summarized in Figure 128, in which activity is given as the percentage of activity as compared to the activity of as-isolated, membrane-bound M. capsulatus (Bath) pMMO. The specific activity for propylene epoxidation by spmoB was reported to be 30.2 ± 10.5 nmol propylene oxide µmol−1 min−1 (note change in units), while the same assay under similar conditions for as-isolated pMMO yielded 51.1 ± 11.3 nmol propylene oxide µmol−1 min−1. For methane oxidation, spmoB yielded 203.1 ± 20.2 nmol methanol µmol−1 min−1, and the as-isolated pMMO yielded 325.1 nmol methanol µmol−1 min−1. spmoBd1, which houses both the mononuclear and binuclear copper sites, showed activity in both assays: 8.1 ± 3.7 nmol propylene oxide µmol−1 min−1 and 19.3 ± 4.7 nmol methanol µmol−1 min−1. Neither the spmoBd2 nor the iron loaded spmoB showed activity for either assay. These data eliminated the possibility that a binuclear iron site in the zinc crystallographic site or a trinuclear cluster in the intramembrane space could represent active sites for methane oxidation in pMMO.659
Figure 128.

Catalytic activity of spmoB proteins. (a) Epoxidation activity measured as percentage of the activity of as-isolated, membrane bound pMMO from the Bath enzyme. (b) Methane oxidation activity measured as percentage of the activity of as-isolated, membrane bound pMMO from the Bath enzyme. (Reprinted by permission from Macmillan Publishers Ltd: Nature Ref. 659, copyright 2010.)
To distinguish between the mononuclear and binuclear site being responsible for methane oxidation, the authors also studied several site directed mutants of spmoB. The spmoB_H48N variant, which eliminates the mononuclear copper site, binds 1.86 ± 0.52 copper ions per protein and had specific activities for propylene epoxidation and methane oxidation of 2.3 ± 0.4 and 14.8 ± 9.2, respectively. The spmoB_H137,139A and spmoB_H48N_H137,139A double and triple variants, which eliminate only the binuclear and both the binuclear and mononuclear copper sites, respectively, both bound copper ions (0.73 ± 0.15 and 0.82 ± 0.36, respectively), yet had no measurable activity. Interestingly, the authors note removal of the mononuclear copper site does not completely eliminate activity, even for the methane oxidation assay. These results show that the binuclear copper site can oxidize methane to methanol in pMMO. Now, it remains to determine the mechanism for this important reaction in pMMO.
Since no intermediates have been identified in pMMO to date, the current insight into the mechanism of pMMO has largely been derived from models–both experimental and computational. Below, we first summarize the computational studies that have appeared and follow with a description of the one well defined copper active site model for the methane to methanol conversion–specifically the zeolite Cu-ZSM-5.
3.5.5.2 DFT Calculations of C-H activation of methane by CuxOy Complexes
Quantum chemical calculations related to pMMO have mainly focused on evaluating the reactivity of a few CuxOy species. These structures are encompassed by trinuclear (5, considered to be a copper cluster where O2 is reduced to a µ3 and a µ2 oxo), binuclear (2, 3, and 4), and mononuclear (1) copper complexes and are presented in Table 25. Methane oxidation has been modeled with two reaction mechanisms: concerted oxene insertion and hydrogen atom abstraction (Figure 129). The experimental data presented in Section 3.5.2 that indicate the presence of a KIE (5.2 ± 0.4 for [1-3H1,2H1]ethane and 5.5 ± 0.7 for [1-3H1,2H1, 2-2H3]ethane at 30 °C) and complete retention of stereochemistry for alkane hydroxylation have been used to argue for a concerted oxene insertion. However, these data cannot rule out a hydrogen atom abstraction mechanism. Of the structures in Table 25, 1, 3, and 4 were used to evaluate a hydrogen atom abstraction mechanism. Of these, 4 had the lowest calculated activation energy at 9.5 kcal/mol. 4 is disfavored relative to 3, however, because of the higher energy of formation, and 1 can be eliminated as it is formed at the mononuclear copper site, which is not conserved across pMMOs. Therefore, a hydrogen atom abstraction mechanism is most viable for intermediate 3. However, higher energy transition states are found in the complete reaction profile for 3. These represent C-O bond formation and rebound, which predicts a rate-limiting step other than C-H bond cleavage, in disagreement with the KIE for ethane hydroxylation.
Table 25.
Summary of DFT studies related to several putative CuxOy intermediate species for methane oxidation in pMMO.
| Complex | Ea (kcal/mol) |
Mechanism | C-H(O-H) Bond Distance (Å) |
i (cm−1) | Reference |
|---|---|---|---|---|---|
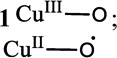 |
18.8 | H-atom | 1.321(1.184) | 1445 | 598 |
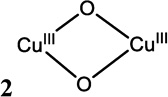 |
44.0 21.0 |
Concerted Concerted |
1.731(1.014) 1.631(1.039) |
703 799 |
719 720 |
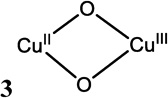 |
14.2 19.1 40.5 21.7 |
H-atom H-atom Concerted H-atom Concerted |
1.396(1.132) 1.394(1.144) 1.382(1.255) 1.455(1.113) 1.384(1.261) |
1226 1298 1487 1052 1488 |
719 720 721 721 721 |
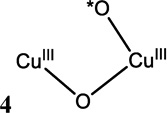 |
9.5 | H-atom | 1.325(1.176) | 1350 | 719 |
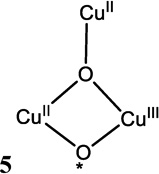 |
15.0 | Concerted | 1.654(1.095) | 593 | 720 |
Figure 129.

Two different mechanisms for H-atom abstraction from methane.
A concerted oxene insertion has been evaluated for 2, 3, and 5. The activation energy for 2 is 44.0 kcal/mol719 (a barrier of 21.0 kcal/mol has also been reported;720 however, these calculations were performed using a spin restricted methodology, so the number is not likely reliable as the transition state should be spin polarized), which is much too high to represent the reactive species in the mechanism of pMMO. Activation energies of 21.7 and 15.0 kcal/mol have been reported for 3 and 5, respectively (a barrier of 40.5 kcal/mol has also been reported for 3. Here, upon formation of the transition state, a Cu-NH3 bond is lost while a Cu-CH3 bond is formed, which likely contributes to the high energy of this transition state). Thus, the oxene insertion mechanism favors 5.
It is difficult to draw conclusions based on the computational results reported thus far. In only one case are the activation energies for both mechanisms reported for one structure (3). More specifically, the hydrogen atom abstraction mechanism has yet to be considered for 2, which is known to abstract hydrogen from alkyl C-H bonds. Furthermore, low reaction barriers can be obtained when high energy reactants are generated, which is the case for 4.
In summary, computational studies have yet to establish insight into the activation of a binuclear copper site for reaction with inert C-H bonds of substrate. That is, what geometric and electronic properties of the reactant, transition state, and product contribute to the thermodynamics (i.e., O-H bond strengths) and the activation energy of the reaction (i.e., FMOs).
3.5.5.3 pMMO Active Site Models
Only very recently have copper containing molecular models been made that can oxidize methane to methanol. A series of tricopper complexes have been shown to oxidize hydrocarbons,722,723 including methane.724 Heterogeneous systems, such as zeolites, offer alternatives for the study of the methane to methanol conversion by copper active sites.39,725,726 Zeolites are microporous materials that can be impregnated with metal ions. Dioxygen (as well as N2O and NO) can be used as a reagent for the generation of reactive, yet well isolated, Mx/Oy species in the zeolite channels. In many ways, this resembles the strategies adopted by Nature in the function of metalloenzymes. The protein structure directs substrate access and guidance to a reactive species, the formation and isolation of which is well controlled in order to prevent deleterious side reactions with the protein. This active site isolation allows for the direct spectroscopic study of molecular structures that would be very difficult to generate, trap, and study in solution. This approach makes heterogeneous structures such as the zeolites or metalorganic frameworks (MOFs) a powerful approach to studying reactive Mx/Oy species. The interaction of O2 with various transition metal ion-containing zeolites has recently been reviewed.727 Despite these attractive properties, however, one problem in studying zeolites, as well as heterogeneous catalytic systems in general, is that the active site usually represents a minority species, constituting only ~5% of the total metal content. This presents a unique problem relative to the spectroscopic study of metalloproteins, in which the metal cofactor is present in only ~0.2 weight % but in a spectroscopically silent (between 280 nm and 2 µm and diamagnetic) protein background. In order to gain insight into the active site in these systems, a direct spectroscopic handle on the active site and its reactivity is required (vide infra).
The zeolite frameworks which are currently known to selectively oxidize methane include ZSM-5, mordenite (MOR), ferrierite (FER), and beta (BEA).726 Both O2 as well as N2O activated Cu-ZSM-5 and N2O activated Fe-ZSM-5 (O2 does not activate Fe-ZSM-5) can oxidize methane into methanol at low temperature (100–150°C). Cu-MOR can oxidize methane at 150°C as well, but there is an increase in methanol yield when reaction temperatures reach 200 °C. This result has been ascribed to the presence of a second, less reactive core in Cu-MOR. Both the Cu-FER and Cu-BEA require reaction temperatures above 200°C. The nature of the reactive species in zeolite-based systems has remained elusive; however, recently the formation and reactivity of the reactive species in Cu-ZSM-5 have been elucidated in some detail.39,718 We review these results here.
Reduced Cu-ZSM-5 reacts with O2 at 450°C and produces an intense absorption feature at 22,700 cm−1 (~440 nm) (Figure 130 Inset A) due to the formation of a Cux/Oy species. This O2 derived active oxygen species was shown to stoichiometrically oxidize methane into methanol at temperatures as low as 100°C. Upon exposure to CH4, the 22,700 cm−1 band is eliminated and CH3OH is produced. The low energy of the absorption band combined with EXAFS data (Cu-Cu distance of 2.87 Å) were initially used to assign this species as a bis(µ-oxo)dicopper(III,III) core (see Section 3.2).728 However, from the analysis of the amount of methanol formed, it was estimated that only ~5% of copper existed in the activated form,725,726 thus making the EXAFS results irrelevant as this is a bulk spectroscopic method. Also, an absorption band does not elucidate the nature of a species. In order to definitively define the methane oxidizing active core in Cu-ZSM-5 an appropriate spectroscopic method was needed. Laser excitation into the 22,700 cm−1 absorption band of O2 activated Cu-ZSM-5 resulted in a very rich and informative resonance Raman spectrum. The data obtained after 16O2 and 18O2 (which generates CH318OH) activation are given in Figure 130. Isotope sensitivity is observed for features at 237 cm−1 (Δ(18O2) = 3 cm−1), 456 cm−1 (Δ(18O2) = 8 cm−1), 870 cm−1 (Δ(18O2) = 40 cm−1), 974 cm−1 (Δ(18O2) = 10 cm−1), 1725 cm−1 (Δ(18O2) = 83 cm−1), and 1852 cm−1 (Δ(18O2) = 52 cm−1). These vibrational data immediately ruled out the previous assignment of a bis(µ-oxo) dicopper(III,III) species due to the lack of an intense resonance enhanced 600 cm−1 vibration (See Table 26 for a compilation of the vibrational data of known Cux/O2 species) and are also inconsistent with either a µ-η2-η2 dicopper(II) (ν(Cu-Cu) at ~270 cm−1, ν(O-O) at ~750 cm−1) or Cu(II)-superoxo (ν(O-O) at ~1,000–1,150 cm−1) species. However, due to the observation of the 870 cm−1 isotope sensitive vibration, the 16,18O2 data alone allowed the possibility that the Cux/Oy core has an O-O bond as η1-hydroperoxide Cu(II), trans-µ-1,2-peroxo Cu(II), and hydroperoxo 2Cu(II) species can contribute in this region (Table 26). However, these alternatives were eliminated by using mixed-isotope O2 to activate Cu-ZSM-5 (a statistical (1:2:1) mixture of 16O2:16/18O2:18O2). An O-O bond would show three vibrational features with a 1:2:1 intensity distribution pattern with the frequencies of the 18O2, 16,18O2 and 18,16O2, and 16O2 at 830, ~850, and 870 cm−1, respectively, for Cu-ZSM-5. Activation of Cu-ZSM-5 with mixed-isotope O2, however, resulted in the rR data in Figure 130 Inset B green. These are identical to the 1:1 normalized sum of 16O2 and 18O2 (black), which indicates that there is no O-O bond in the active species. Thus, the rR data ruled out all known Cu/O2 structures in inorganic chemistry.
Figure 130.

rR spectra of Cu-ZSM-5 + 16O2 and 18O2 (blue) using 457.9 nm excitation. Inset A: Absorption spectrum of O2 activated Cu-ZSM-5. Inset B: 16,18O2 (green) and a 1:1 normalized sum of 16O2 and 18O2 (black). (Reprinted with permission from Ref. 39.)
Table 26.
Spectroscopically characterized Cux/O2 species. Adapted from Reference 39.
| Cu/O2 species | rR Vibrations (Δ18O2) / cm−1 |
|---|---|
| O2-activated Cu- ZSM-5 |
456 (8) 870 (40) |
 |
ν(Cu-O) = 606 (23) |
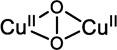 |
ν(Cu-Cu) = 284 (0) ν(O-O) = 763 (40) |
| ν(Cu-O) = 472 (20) ν(O-O) = 1121 (63) |
|
 |
ν(Cu-O) = 554 (20) ν(O-O) = 1043 (59) |
| ν(Cu -O) = 624 (17) ν(O -O) = 843 (44) |
|
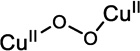 |
ν(Cu-O) = 561 (26) ν(O-O) = 832 (44) |
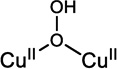 |
ν(Cu-O) =322 (10) ν(O-O) = 892 (52) |
The most intense isotope sensitive feature was observed at 456 cm−1 (Δ(18O2) = 8 cm−1). The 870 cm−1 feature (Δ(18O2) = 40 cm−1) had low intensity, while its second quantum, the 1725 cm−1 (Δ(18O2) = 83 cm−1) vibration, had an intensity that is six times higher than the fundamental. This supported the assignment of the 456 and 870 cm−1 vibrations as symmetric (νs) and antisymmetric (νas) stretches, respectively, of a mono-oxo group bridging two copper centers. Note that even quanta of antisymmetric modes are symmetric and rR allowed. Also, the energy of 2νas in 16O2 activated Cu-ZSM-5 was not exactly two times νas (1740 cm−1 instead of 1725 cm−1). This difference is due to a Fermi resonance between the 18O-isotope sensitive fourth quantum of νs, which is predicted to be at 1,824 cm−1, and the 18O-isotope sensitive 2νas. Thus, the combination of an intense symmetric and a weak antisymmetric stretch was used to unambiguously assign the active species in Cu-ZMS-5 as a bent [Cu-O-Cu] core. The energy splitting of these symmetric and antisymmetric vibrations and their isotope shifts via normal coordinate analysis gave a Cu-O-Cu angle of ~140°. This represented the first definitive characterization of a mono-oxygen bridged binuclear copper site in any system, synthetic, bioinorganic, or heterogeneous. It should be noted that, from UV-Vis, rR, and reactivity data, the identical site also forms with N2O.
Monitoring the disappearance of the 22,700 cm−1 absorption feature as a function of temperature allowed for the determination of an activation energy of 15.7 ± 0.5 kcal/mol (from Arrhenius plots of the reaction with CH4 between 110 and 200 °C). Reaction with C2H4 resulted in an increased Ea of the reaction by 3.1 ± 0.5 kcal/mol. These data show that O2 activated Cu-ZSM-5 performs H-atom abstraction of the strong C-H bond of methane with a low barrier. The electronic structure contributions to the high reactivity of this core were defined using spectroscopically calibrated DFT calculations. A Cu2O core with an angle of ~140° was modeled in the 10-membered ring of the ZSM-5 lattice and fit with two Al T-sites separated by two Si spacers (Figure 131). Both Cu(III)2O and Cu(II)2O models were considered; however, the former was eliminated due to the fact that the singlet wavefunction contained an internal instability. This relaxed the formally copper based holes into the zeolite lattice to form a Cu(II)2O core and an electron deficient lattice. Thus, calculations were conducted using a [CuAII-O-CuBII]2+ species in the ferromagnetically coupled triplet state (predicted to be ~2 kcal/mol lower in energy than the antiferromagnetically coupled singlet state). DFT calculations on this Cu(II)2O core accurately reproduced the vibrations observed from rR spectroscopy as well as the energy of the intense absorption feature (i.e. an oxo to CuII CT). A transition state for hydrogen atom abstraction was found using this model. It had a calculated Ea of 18.5 kcal/mol, which increased by 1.3 kcal/mol in the reaction with C2H4. These were in reasonable agreement with experiment. It was therefore shown that the computational Cu(II)2O model in Figure 132 reproduced the low Ea determined experimentally for H-atom abstraction from CH4. Complete hydrogen atom abstraction (addition of both a proton and an electron) generated a delocalized [CuA-OH-CuB]2+ intermediate and a carbon centered radical. This step was calculated to be endothermic by only 13.8 kcal/mol. This indicates that a strong O-H bond is formed in this intermediate (~90 kcal/mol, calculated), which contributes to the low barrier. Further insight into the contributions to the reactivity of this core came from an analysis of the electronic structures of the transition state. It was found that there are two low lying singly-occupied orbitals (SOMOs) of the Cu(II)2O core which contribute to the reactivity and the low activation barrier for C-H bond cleavage (Figure 132A). Upon formation of the transition state the frontier molecular orbitals (FMOs) of the [CuAII-O-CuBII]2+ core becomes strongly polarized to a [CuAI-O−·-CuBII] “oxyl” species. This type of species, although yet to be observed experimentally in model chemistry, would be highly reactive as it has a low-energy unoccupied orbital with large O-character for overlap with the C-H bond. Indeed, the top SOMO in Figure 132B reflects this, showing 24% O and 60% CH4 character, which is delocalized along the O-H-C vector. This strong orbital polarization at the transition state is responsible for the low activation energy for methane oxidation. Thus, both Cu-ZSM-5 and pMMO oxidize CH4 at a binuclear copper active site, which makes Cu-ZSM-5 a very promising molecular model of the reactivity of the enzyme.
Figure 131.

Model of the active [Cu2O]2+ core in the 10-membered ring of the ZSM-5 lattice. (Reprinted with permission from Ref. 39.)
Figure 132.

DFT-calculated reactivity of the Cu(II)2O core with CH4. (A) Reaction coordinate of H-atom abstraction from CH4 by Cu(II)2O. (B) SOMOs at the transition state. CH4 approach is shown in the plane (Left) and below the plane of the figure (Right). (Reprinted with permission from Ref. 39.)
A precursor to the mono(µ-oxo) dicopper(II) species in Cu-ZSM-5 has also been observed and spectroscopically characterized, which allows for a direct correlation of the zeolite model to binuclear copper enzyme chemistry.718 Reaction of reduced Cu-ZSM-5 with O2 at room temperature yields a different absorption spectrum than when this reaction is carried out at 450°C. Under low temperature conditions, a band at ~29,000 cm−1 was rapidly formed (Figure 133A). Subsequent heating resulted in the direct transformation of the ~29,000 cm−1 band into the ~22,700 cm−1 band observed for the [Cu2O]2+ mono(µ-oxo) (Figure 133B). The ~29,000 cm−1 feature does not form with N2O; only the ~22,700 cm−1 band is formed, even at RT. rR spectroscopy with laser excitation at 363.8 nm on a RT, 16O2 activated sample yields a spectrum with vibrational features at 269 and 736 cm−1 (Figure 134A, blue). Only the 736 cm−1 feature showed isotope sensitivity (Δ(18O2) = 41 cm−1). The absorption and rR data are characteristic of a µ(η2-η2)peroxo dicopper(II,II) species with the ~29,000 cm−1 band assigned as the π*σ to Cu(II) CT and the 269 and 736 cm−1 vibrations assigned to the Cu-Cu and O-O stretch, respectively. This is very similar to what is observed upon O2 binding in Hc and Ty (Sections 3.1 and 3.2). Furthermore, upon heating the RT, 16O2 sample, the 368.3 nm resonance enhanced features associated with the µ(η2-η2)peroxo dicopper(II,II) species disappear while the 457.9 nm resonance enhanced features of the [Cu2O]2+ species grow in (Figure 134B). Thus, this coupled binuclear µ(η2-η2)-[Cu2(O2)]2+ species is a precursor complex and converts directly into the [Cu2O]2+ species, which oxidizes methane into methanol. Temperature programmed desorption (TPD) experiments showed that the second oxo atom transfers to the ZSM-5 lattice. The two electrons required to cleave the peroxo O-O bond appears to derive from spectator Cu+ located in ion-exchange sites. The resultant cycle for active site formation and reaction is summarized in Figure 135.
Figure 133.

Diffuse reflectance UV-vis spectra of prereduced Cu-ZSM-5 (in He at 450 °C) during (A) O2 treatment at RT (time interval between spectra is 10 s during the first 2 min, and then every 50 s for 10 min) and (B) subsequent heating from 25 to 375 °C in He atmosphere (temperature interval between spectra is 25 °C. (Reprinted with permission from Ref. 718. Copyright 2010 American Chemical Society.)
Figure 134.

(A) rR spectra (363.8 nm) of 16O2 (black) and 18O2 (blue) precursor formed at RT and (B) rR spectra (457.9 nm) of the reactive site formed by heating the O2 precursor samples. (Reprinted with permission from Ref. 718. Copyright 2010 American Chemical Society.)
Figure 135.

Reactivity cycle for methane oxidation in Cu-ZSM-5. (Reprinted with permission from Ref. 718. Copyright 2010 American Chemical Society.)
The reactivity cycle for Cu-ZMS-5 may have implications for the catalytic cycle of pMMO. Like ZSM-5 and sMMO, the cycle for pMMO may begin with a precursor type of complex in which O2 is activated to a peroxo level species (vide supra, Section 3.5.4). The Cu-Cu separation of ~3.3 Å in the zeolite likely drives O2 binding and the reduction of dioxygen to the peroxo level in a µ-η2-η2 structure as in oxy Hc/Ty. Here, branching between the zeolite relative to the coupled binuclear copper sites may occur. In the zeolite, the Cu-Cu separation is not likely to change to a large extent during formation of the precursor and its subsequent transformation into the mono(µ-oxo) dicopper(II) species. This geometric constraint (i.e. an entatic type state associated with the zeolite lattice) on the Cu-Cu distance may play a role in driving the formation of a mono-(µ-oxo) as opposed to a bis(µ-oxo) species.
3.6 Structure/Function Correlations of O2 Activation by Copper Sites
From Sections 3.1 – 3.5 we have observed that O2 is activated by mononuclear copper sites in the non-coupled binuclear copper enzymes (the CuM center) and in cofactor biogenesis by GO and by binuclear copper sites in the coupled binuclear copper enzymes and pMMO.
For the mononuclear copper sites, research efforts to this point have strongly indicated that a Cu(II)O2− (i.e., cupric-superoxide) end-on triplet catalyzes a one-electron H-atom abstraction reaction. For both the non-coupled binuclear copper enzymes and the biogenesis reaction in GO, the X-H bonds are activated at ~87 kcal/mol, which would be accessible based on the [Cu(II)O2]+ → [Cu(II)O2H]+ homolytic bond strength. Depending on the ligation and protein environment, this bond strength would be in the range of ~80 kcal/mol. The interesting issue in these mononuclear copper sites is the activation of O2 by one electron reduction. The reduction potential for this process is −330 mV vs SHE depending on the conditions, and thus the ligation at the copper would have to tune down the potential and stabilize the Cu(II)-O2•− bonding interaction (i.e., allow formation of an inner sphere complex). There can also be an entropic contribution depending on whether the O2 replaces a coordinated H2O.
In the coupled binuclear copper enzymes a [Cu(II)2O22−]2+ peroxy intermediate species is clearly generated. The substrates are aromatics with strong C-H bonds (~110 kcal•mol−1), and thus this reaction proceeds through an electrophilic aromatic attack, a two-electron process. This involves the transfer of the two electrons into the peroxide σ* orbital to cleave the O-O bond, either directly from the substrate or from the coppers if the bis-µ-oxo species is in fact formed along the reaction coordinate. Again this reaction is energetically accessible as the two-electron reduction potential of peroxide is ~300 mV vs NHE.
pMMO is rather unique in that the C-H bond is strong yet the enzyme uses a binuclear copper site to perform a one-electron H-atom abstraction. This would seem to require the formation of a strong O-H bond in the initial product as found to be the case in the Cu-ZSM-5 [Cu(II)2O2−]2+ active site where the strength of the O-H bond formed is ~92 kcal•mol−1. If an oxo (bridged or terminal) intermediate were indeed involved in pMMO, this would require that the 2Cu(I) reduced site react with O2 to proceed to the 2Cu(III) state to reductively cleave the O-O bond. In this regard, it is interesting to note the significant structural differences in pMMO relative to the coupled binuclear copper enzymes where the 3 His/Cu of the latter are replaced by two endogenous ligands/Cu in pMMO, and one of these is a terminal amine. This strong equatorial donor ligation could promote further oxidation of the two coppers and the short Cu-Cu distance (~2.6 versus ~3.6 Å in the coupled binuclear copper enzymes) would also favor O-O cleavage. Clearly, it is important to define the factors in the pMMO binuclear copper site that activate it for H-atom abstraction from a strong C-H bond and in fact whether this is the correct description of the mechanism. As a final point, in the only intermediate in the CH4 → CH3OH reaction thus far characterized, the [Cu(II)2O]2+ FMO has the important property of polarizing to a Cu1+O−• (i.e., oxyl) species at the transition state. This is also the case for Fe(IV)=O intermediates at their transition states and is likely a key requirement for H-atom abstraction from strong C-H bonds.729
3.7.1 Multicopper Oxidases
Multicopper oxidases (MCOs) constitute a large and diverse family of enzymes, where oxidation of various substrates is coupled to the four-electron reduction of dioxygen generating two water molecules.730 Common to all MCOs, this activity is carried out by a minimum of four copper ions, arranged in a mono-nuclear Type 1 (T1) Cu site, which is the entry point of electrons from substrate, and a trinuclear Cu cluster (TNC), which accepts the substrate electrons and utilizes these in the 4 e− reduction of dioxygen.730 The diversity of MCOs is inferred primarily at the T1 Cu site, where differences in coordination environments and solvent accessibility result in different substrate specificities.731,732,733,734,735 Based on this, MCOs can be divided into two classes where members of the first target a variety of phenolic substrates, with broad specificity, while members of the second has high substrate specificity towards one- or two metal substrates (see Table 27). Some broad substrate MCOs have traits of both classes, with high specificity towards a single substrate, e.g. ascorbate or bilirubin, while still showing significant activity towards a broad range of phenolic substrates.736,737 The following sections will provide an overview of the enzymological (see also Table 28), kinetic, spectroscopic, and mechanistic properties of the MCOs.
Table 27.
The two classes of multicopper oxidases.
| Phenolic substrates (broad) | Metal ion substrate (specific) |
|---|---|
| Laccases (plant, fungal, bacterial, insect) | Ceruloplasmin/ Hephaestin |
| Ascorbate Oxidase | CueO |
| Bilirubin Oxidase (including CotA) | Fet3p |
| MnxG |
Table 28.
Multicopper oxidase subgroups and their proposed functionalities.
| Multicopper Oxidase subgroups | Proposed Functionalities |
|---|---|
| Plant laccases | wound healing738 |
| lignin formation739 | |
| flavonoid oxidation740 | |
| cell wall formation741 | |
| Fungal laccases | lignin degradation742 |
| pathogenesis743 | |
| detoxification743 | |
| fungal development and morphogenesis743 | |
| Prokaryotic laccases | melanin formation744,745 |
| resistance against UV-light744,745 | |
| resistance against hydrogen peroxide744,745 | |
| Insect laccases | cuticle formation746 |
| Ascorbate Oxidase | plant growth747 |
| terminal oxidase in electron transport chain748 | |
| plant defense against insects749 | |
| hyperoxia prevention750 | |
| Bilirubin Oxidase | lignin degradation751 |
| Ferroxidases | iron metabolism-including iron transport752 |
| (Fet3p, ceruloplasmin) | copper homeostasis753 |
| Cuprous Oxidase (CueO) | copper homeostasis754 |
| antioxidant activity755 | |
| Manganese Oxidase | manganese oxidation756 |
3.7.1.1 Enzymology
3.7.1.1.1 Fungal laccases
The most abundant group of MCOs is the so-called laccases (EC 1.10.3.2), which are found throughout nature, and classified as broad substrate MCOs. Fungal laccases are the most well described MCOs, with over 100 enzymes purified and characterized.757 Apart from being easily accessible, this is evidently related to their interest from a commercial standpoint, where many functions have been proposed and several already implemented.758,759
Fungal laccases have primarily been identified in basidiomycetes, with white-rot fungal species being particularly abundant, and brown-rot fungi only described at a limited level.760 Fungal laccases are also present in ascomycetes and deuteromycetes, whereas no enzymes have been identified in zygomycetes or chytridiomycetes.760 Fungal laccases are usually present in several isoforms within the same organism, mainly identified by a genetic approach or by iso-electric focusing. The typical fungal laccase is a monomeric protein, with a molecular weight of approx. 60–70kDa, including a carbohydrate content of 10–25%. The pIs of fungal laccases fall in the acidic range, with most enzymes between 3–5.760,761 An interesting property of fungal laccases is their heat tolerance, with optimum activity often reported at more than 55° C.762,763,764,757 This is one of the features that make fungal laccases interesting from an industrial perspective. In addition to activity, fungal laccases are also relatively stable at elevated temperatures, with half lives for decay reported to be several hours.762,765,757 Fungal laccases are most often extracellular, but several intracellular enzymes have been identified.760,766,767
Due to their ability to oxidize various poly-phenolic compounds, fungal laccases have long been suggested to participate in lignin degradation.768 Conclusive evidence for this functionality was presented in the late 1990’s by Bermek and Eriksson, who showed that laccase mutants from Sporotrichum pulverulentum were incapable of degrading lignin, in contrast to the wild-type enzyme.742 Despite the relatively early elucidation of lignin-degrading functionality, the precise mechanism by which this occurs in fungal laccases is still not known.769 Other proposed biological functions of fungal laccases include pathogenesis and detoxification as well as development and morphogenesis of fungi.743
3.7.1.1.2 Plant Laccases
Although not as abundant as fungal laccases, plant laccases have played a pivotal role in the study of MCOs (vide infra). In particular laccase from the Japanese lacquer tree, Rhus vernificera laccase (RvL), has been subject to numerous studies, both with respect to biological function and molecular mechanism.
Plant laccases are glycoproteins, with a carbohydrate content ranging from ~20–45%.770,771 Molecular weights have been reported in the range from ~60–130kDa,772,773 whereas pI values vary from 7.0–9.6. Most plant laccases are secreted proteins, with a few exceptions predicted to be targeted to the mitochondria.769
Previously, plant laccases were believed to be scarcely distributed, but recent studies have shown that they are in fact widely distributed in higher plants, particularly in angiosperms, but also in gymnosperms.774 An investigation of laccase gene sequences in Arabodopsis thaliana among others, showed that plant laccases can be divided into six divergent phylogenetic groups. Interestingly, groups 1–3 contain both gymnosperms and angiosperms, indicating that these genes had evolved prior to the division of gymnosperms and angiosperms some 300 MYA.774
A characteristic feature of plant laccases, is the high degree of isoform occurence in different plants, with 17 laccase genes being identified in Arabidopsis thaliana.774 Along with the complexity of plant extracts in general, this provides a significant challenge in determining the biological function of plant laccases,
One of the most well established functions of plant laccases, is wound healing in R.vernicifera.738 In response to stem cuts, an oxidative polymerization reaction of the alkylcathechols in the latex sap, is initiated by laccase. This produces a hard seal over the wound that serves to protect the stem. A more controversial role of plant laccases, is the involvement in lignin formation. This issue has been heavily debated over the years, but so far no conclusive evidence has emerged, although several strong indications have been reported. The first indication of a possible role in lignin formation came in 1992 when Sterijiades reported on the oxidative capability of a maple laccase on the three lignin precursors, sinapyl, coniferyl, and p-coumaryl alcohols.739 This finding was in contrast to previously conducted studies on R.vernicifera laccase, which indicated that this enzyme was not involved in lignin formation.775 Recent studies indicate that some laccase isoforms in Arabodopsis thaliana are involved in lignin formation, but that the majority are not.774 In contrast, strong evidence has been presented that links the formation of lignin to the class III peroxidases.776 An interesting hypothesis, in that respect, is the involvement of laccases in formation of the early primitive forms of lignin, whereas the later emerging, more complex, lignin structures are proposed to have been synthesized by peroxidases.776 Other putative functions of plant laccases include flavonoid oxidation,740 and cell wall formation,741 which also involves oxidation of phenols. Finally, it should be mentioned that Hoopes and Dean reported ferroxidase activity of a plant laccase from Liriodendron tulipifera in a 2004 study.777 However, no further information has been presented on this subject.
3.7.1.1.3 Prokaryotic Laccases
Bacterial laccases were first described in Azospirrillum lipoferum in 1993.778 Several other bacterial laccases have been purified, expressed and characterized since then.779 In addition, a significant number of bacterial laccase genes have been identified in a variety of bacterial strains.757 Recently, prokaryotic occurrence of laccase was extended to archae, with the reported purification and characterization of a glycosylated enzyme showing activity towards laccase substrates like syringaldazine, 2,2’-azino-bis(3-ethylbenzothiazoline-6-sulphonic acid) (ABTS), and 2,2’-dimethoxypropane (DMP).780 Furthermore, the archael laccase showed activity towards bilirubin. Based on this, the enzyme would more correctly be grouped with other Bilirubin Oxidases (BODs), as described below. This is also the case for the best studied bacterial laccase, CotA.751 From an evolutionary standpoint, fungal BOD structures actually group with the bacterial laccases,781 and it is likely that several of the putative prokaryotic laccases may indeed turn out to be BODs. Whereas bacterial laccases seem to be widely distributed in bacteria; only a few archael enzymes have been proposed based on genetic analyses.782 This may be related to the mostly anaerobic nature of archae.
Compared to fungal laccases, only limited information is available on the properties of prokaryotic laccases. Molecular masses have been reported from 50kDa to 250kDa.779 In addition to “traditional” laccase structures, prokaryotic laccases also include the so-called two-domain or small laccases (SLACs), which are significantly different with respect to size and structure.783 The molecular weight per active site is as low as 30kDa and the enzymes have two domains rather than three.784
With respect to other properties, prokaryotic laccases differ significantly from fungal laccases. Generally, they have been reported to have higher pI’s. Salt tolerance is another featured property of prokaryotic laccases. Lastly, it should be mentioned that prokaryotic laccases are generally expressed intracellular, again in contrast to most fungal laccases.779
The functionality of prokaryotic laccases have so far been elucidated only for a few species, and include melanin formation, spore resistance against UV-light and hydrogen peroxide,744,745 and morphogenesis.785 Studies on the laccase functionality of CotA revealed that the mutated enzyme were incapable of forming spore pigment.786 Similar conclusions were made in a study of Azospirillum lipoferum mutants.787 In a study on EpoA from S.griseus, morphogenesis was shown to be inhibited in mutated protein.785 However, upon incorporation of an epoA-induced plasmid, activity was restored.
3.7.1.1.4 Insect Laccases
Laccase-like activity has been known in insects for more than 50 years.788 Despite this, only limited information on insect laccases has been gathered and only a few enzymes have been purified and characterized.789 Studies have, however, identified laccase-like genes in a number of insects, and shown these genes to be present in a variety of tissues.789 Further, laccase-like activity has been identified in more or less purified samples from a number of insects, where the active enzymes showed properties such as acidic pH-optimum and thermal stability of up to 60–70°C.789
As for other laccases, the biological function of insect laccases is difficult to elucidate, primarily due to the complexity of samples. One function has, however, been unambiguously assigned for insect laccases, namely cuticle formation in Tribolium castaneum.746 Knock-out of the so-called laccase 2 gene resulted in a lethal phenotype with soft, unpigmented cuticle, observed in larval, pupal, and adult stages. The same gene has been identified in the cuticle of several other insect species.790–793
3.7.1.1.5 Ascorbate Oxidase
The existence of a unique ascorbic acid oxidizing enzyme was proposed more than 80-years ago,794 and finally established in 1941.795 Over the years, ascorbate oxidase (AOx) has attracted much interest both with respect to elucidation of the biological function, but also in various structural and mechanistic studies. In 1989, Messerschmidt et al. published the first crystal structure of a multicopper oxidase; that of AOx from green zucchini.796
Ascorbate oxidase is most commonly found in higher plants,750 but has also been identified in fungi.781 AOx is characterized by having a high activity towards ascorbate, whereas “normal” laccase substrates are less efficient. Based on this activity, AOx is defined as a unique subclass of enzymes (E.C. 1.10.3.3), separate from laccase and other multicopper oxidases. This is consistent with a phylogenetic analyses of MCOs that group plant and fungal AOxs together, clearly separate from laccases and ferroxidases.781
In plants, AOx forms homodimers with molecular weights of approx. 130kDa,797 whereas the sole fungal AOx characterized is a monomer with a molecular weight of 80kDa, including a carbohydrate content of approx. 11%.798 Another interesting property is the conserved functionality of fungal AOx at pH’s as low as 3.798 Furthermore, the fungal enzyme is thermostabile up to ~60°C,798 whereas plant AOs has a t1/2 of only 20min at 55°C.799
Despite intense investigation, the biological function of plant and fungal AOs has still not been fully elucidated.800 Numerous studies have led to different proposed functions, among those, involvement in plant growth, which was initially proposed by Mertz based on cellular localization of maize AO.747 Later studies on this hypothesis have been somewhat contradictory. Lin and Varner,801 and Kato and Esaka802 supported the hypothesis by showing increased levels of AOx in expanding cells in zucchini, and elevated AOx activity in elongating tobacco cells, respectively. On the other hand, Sanmartin et al. did not detect any effect of AOx overexpression on plant growth.803 Other proposed functions of AOx includes a role as a terminal oxidase in an electron transport chain,748 and as a plant defense system against insects, decreasing the level of available ascorbic acid and thereby the level of antioxidants in the insect.749 A common feature of the above listed functionalities, is the importance of the reducing substrate, ascorbate. Recently, Tullio et al. suggested a novel functionality, which focuses on the oxygen reducing ability of AOx. The authors propose that AOx can establish an O2 gradient across the cytoplasmic membrane, preventing hyperoxia by releasing excess O2 to the apoplast.750
3.7.1.1.6 Bilirubin Oxidase (BOD)
Bilirubin oxidases (EC 1.3.3.5) are multicopper oxidases, categorized based on their ability to oxidize bilirubin to biliverdin, using dioxygen as an electron acceptor.804 This reactivity has been known for a long time, and has traditionally been observed in fungi.804 In addition to bilirubin activity, BODs also show activity towards the traditional phenolic laccase substrates.804 Recently, the bacterial laccase CotA from Bacillus subtilis was shown to have significant BOD activity,751 extending the occurrence of BODs to the prokaryotic kingdom. BODs are interesting in several respects, first due to their diagnostic properties in medical examination of the liver. Also, they are candidates for the cathodic reaction of biological fuel cells, where they show important advantages compared to the fungal laccases, such as pH optima close to 7, and high tolerance to NaCl.804 From a mechanistic point of view, BODs have provided significant insight into the MCO family, primarily from mutational studies on Myrothecium verrucaria.805–807 Recently, the first crystal structure of a BOD was published,808 and it revealed an overall structure very similar to that of fungal laccases. Differences were, however, observed in proximity to the T1 Cu binding site, which may provide insight into the redox properties of this site.
Very little is known about the physiological function of BODs, but due to their similarity to fungal laccases, it’s hypothesized that the enzymes are involved in lignin degradation.751
3.7.1.1.7 Phenoxazinone Synthase (PHS)
Phenoxazinone synthase (EC 1.10.3.4, PHS) is a bacterial MCO identified only in Streptomyces antibioticus.809 Other enzymes, classified in the same group, have been found in other organisms, but none of these incorporate the four copper motif characteristic for MCOs.809 The particular interest in PHS stems from its ability to oxidize o-aminophenol to phenoxazinone, which is a precursor to the antibiotic Actinomycin.810–812 A pivotal study from 2000 showed that depletion of PHS from S. antibioticus had no affect on the formation of Actinomycin, indicating that this is not the biologically relevant function of the enzyme.813 Instead it has been proposed that PHS is involved in spore pigment production or spore morphogenesis.813 Interestingly, a crystal structure of PHS revealed that the active form of the enzyme is a hexamer, which in addition to the four catalytically relevant Cu ions per monomer, incorporates a structurally important fifth Cu which is proposed to link together the individual monomers. This motif has not been observed in any other MCOs (see section 3.7.1.3).
3.7.1.1.8 Ferroxidases: Fet3p, Ceruloplamin, and Hephaestin
Ceruloplasmin (Cp, EC 1.16.3.1), particularly the human enzyme, has been intensely studied since its discovery more than 60 years ago.814 The enzyme displays a variety of fascinating properties, among them binding ~95% of serum copper,815 a unique six domain structure,734,816 and ferroxidase activity.817,818 Ceruloplasmin has been described in several organisms, including rat and mouse, which showed amino acid identity of up to 90%.819,820 The crystal structure of ceruloplasmin has been resolved, and it revealed a unique structure compared to other multicopper oxidases.734,816 First, the enzyme consists of six domains per active site, significantly different from the traditional three-domain MCOs and the newly discovered two-domain SLACs. Furthermore, ceruloplasmin has six coppers distributed into three T1 sites (one of which is permanently reduced and possibly an evolutionary remnant) and one trinuclear copper cluster. The six domain structure was recently proposed in another enzyme showing ferroxidase activity, namely Hephaestin (Hp).821 This enzyme has 50% sequence homology with ceruloplasmin, including conservation of copper ligating amino acid residues.822 Hp has not been studied as intensively as ceruloplasmin, and so far no crystal structure has emerged. Significant insight into the properties of this enzyme has, however, been obtained from heterologous expression of the human protein in hamster.823 In this study, the recombinant enzyme showed significant ferroxidase activity, but only 3.13 Cu/molecule. The electronic absorption spectrum revealed a band at 607nm, consistent with oxidized T1 Cu, as generally observed for multicopper oxidases. The molecular mass of the recombinant Hp is 130kDa. Hp is a membrane-bound protein that has been found in a variety of tissues including the small intenstine, colon, and brain.824–826 A 582 base pair deletion of Hp results in sex-linked anemia, a condition characterized by severe iron deficiency.822 The exact function of Hp has not yet been determined, but has been proposed to be linked to iron metabolism, with a possible role of oxidizing Fe(II), to the transferrin receptive Fe(III) form.822,827 However, no direct interaction between Hp and transferrin has yet been discovered.828
Cp is a glycoprotein with a molecular weight of ~130kDa,815 with small variations due to differences in glycosylation. Two forms of Cp are expressed. The best characterized isoform being serum Cp, which has been identified in spleen, lung, and testis.815 The second isoform is a glycophosphatidylinositol (GPI)- anchored protein, occurring in astrocytes of the Central Nervous System (CNS) and the epithelial cells of the choroid plexus.820 The precise function of the anchored isoform is not known, but it is believed to be involved in iron-mobilization on the blood-brain, blood-testis barriers.829
One of the main reasons for the interest in serum Cp is due to the mutational disease, aceruloplasmenia. This fatal inherited genetic disorder leads to progressive neurodegeneration (often diagnosed as dementia) in addition to diabetes caused by iron accumulation in the liver and pancreas.830 Mutations in the ceruloplasmin gene prevents loading of the trinuclear copper domain and thereby prevents ferroxidase activity significantly hindering iron metabolism, which leads to rapid degradation of the protein in blood plasma.830
Interestingly, the aceruloplasmin specific mutations in Cp does not lead to significant abnormalities in copper metabolism, which is somewhat surprising considering the high level of serum copper incorporated in Cp.831
In addition to the iron homeostatic functionality, Cp has also been suggested to be involved in anti- or prooxidant actions, with somewhat contradicting studies supporting each case.831,832
Fet3p is the functional homolog of Cp in yeast, in that it is critical for iron homeostasis.833–835 The enzyme has been studied primarily in Saccharomyces cerevisiae, but genetic analyses have revealed its presence in a range of fungal species.836 In comparison to Cp, the structure of Fet3p resembles the traditional three-domain MCOs, with a total of four Cu ions involved in the active site.733 Fet3p is a membrane-bound glycoprotein with a molecular weight of approx. 100–120kDa.837
In the regulation of iron homeostasis, Fet3p has been shown to work in conjunction with a transmembrane iron transporter, Ftr1p, together facilitating the transport of iron across cellular membranes.837–840 The role of Fet3p is to oxidize Fe(II) to Fe(III), which is the substrate for Ftr1p Several lines of evidence have been presented to support this functionality, among them the presence of Fet3p being required for the correct targeting of Ftr1, the intracellular accumulation of Ftr1p upon Fet3p depletion, and the co-expression of Fet3p and Ftr1p..733,752,841,842
In addition to ferroxidase activity, Fet3p also exhibits significant cuprous oxidase activity.843 Mutational studies on Fet3p revealed that the enzyme plays a significant role in copper homeostasis, by regulating the amount of free Cu, and thereby preventing the toxic effects of this metal.753
3.7.1.1.9 Cuprous oxidase: CueO
CueO is a multicopper oxidase involved in copper homeostasis in Escherichia coli.754 The periplasmic enzyme is co-expressed with a membrane-bound ATPase, CopA, which together functions as a copper efflux system leading to copper tolerance in the organism.754 Roberts et. al reported the crystal structure of E.coli expressed CueO, highlighting, in addition to the general three-domain motifs, a 42 residue insert in domain three with a high occurrence of methionine residues.844 This region was later found to ligate a labile fifth copper ion, a novel feature of CueO compared to other MCOs.845 CueO has a high affinity for Cu(I), which is oxidized to Cu(II). This property has been hypothesized to diminish the availability of toxic Cu(I), a metal ion involved in Fenton chemistry, forming highly reactive radicals.755 CueO also shows considerable phenol oxidase activity, especially in the presence of excess Cu.846 The role of the phenol versus cuprous oxidase activity has long been debated, and was actually shown to be heavily influenced by the aforementioned met-rich insert. In a mutational study of CueO, Kataoka et al. investigated the influence on activity upon removal of the met rich region. It was shown that cuprous oxidase activity was significantly diminished upon removal, whereas the phenol oxidase activity was enhanced.847 In a more recent study, elegant experiments led to the conclusion that CueO is solely a cuprous oxidase in vivo, and that phenol oxidase activity is prevented due to the selective affinity of the met rich region for Cu(I) over Cu(II).848
3.7.1.1.10 Manganese oxidases
Mn is an important trace metal in the environment as well as in living cells. It occurs in a soluble reduced form, Mn(II), and in the insoluble forms, Mn(III,IV). Mn(II) is highly stabile, and is only slowly converted to the oxidized forms.849,850 Certain, primarily bacterial strains, have been shown to enzymatically enhance the oxidation of Mn, an interesting property for bioremediation. Little is known about the oxidative process by which these bacteria operate, but it has been suggested that MCOs play a pivotal role.756,849 Several bacterial MCOs have been identified as putative manganese oxidases. None of these enzymes have, however, been purified or expressed.851 The most compelling evidence of involvement of MCOs in Mn oxidation came in a study on marine Bacillus species, where a gel-band with Mn oxidase activity, was determined to have a putative MCO, namely MnxG, based on mass spectrometry analysis.756 Interestingly, the enzyme was proposed to convert Mn(II) to Mn(III), but also Mn(III) to Mn(IV).
3.7.1.2 Kinetics
The MCOs can be divided into two categories depending on their native substrate either being a redox active organic molecule (organic oxidases) or a metal ion (metalloxidases; Table 27). Comparing the parameters from steady-state kinetics in Table 29, the organic oxidases have variable KM values with the highest being the tree Lc from Rhus vernicifera852 while the metalloxidases Fet3p843 and Cp have very low KM values. (CueO853 is comparable to CotA854,855 and AO.856) Therefore, the metalloxidases bind their substrate significantly tighter than to the organic oxidases with a specific metal binding site (vide infra). Additionally, the generally higher KM values of the organic oxidases are consistent with their low substrate specificity and reflect the fact that the substrate binding sites are more accommodating to various substrates. The turnover numbers for the metalloxidases are generally slower compared to those of the organic oxidases. The organic oxidases exhibit a wide range of optimal pH values (5.0 – 9.4) under catalytic conditions while the metalloxidases have optima within pH = 6.0 – 6.8. This large pH variance in the organic oxidizers has been shown to correlate with the isoelectric point of the protein.857
Table 29.
Steady-State Kinetic properties for multicopper oxidases
| Enzyme | Km (mM) |
kcat (s−1) |
Substrate | pH | Referenceb | |
|---|---|---|---|---|---|---|
| Organic Oxidases | ||||||
| Laccase (Tree) | R. vernicifera | 200 | 560 | Hydroquinone | 7.5 | 852 |
| Laccase (SLAC) | S. coelicolor | 3.6 | 5.8 | 2,6-DMPa | 7.0 | 858 |
| Laccase (Fungal) | T. villosa | 0.13 | 25.2 | Hydroquinone | 5.0 | 859 |
| M. thermophila | 0.73 | 15.5 | Hydroquinone | 5.0 | 859 | |
| CotA | B. licheniformis | 0.0567 | 28 | 2,6-DMPa | 7.0 | 854 |
| B subtilis | 0.216 | 29 | 2,6-DMPa | 7.0 | 855 | |
| Ascorbate Oxidase | C. Pepo medullosa | 0.200 | 7.50 × 10³ | Ascorbate | 6.0 & 7.5 | 856 |
| Metalloxidases | ||||||
| Fet3p | S. cerevisiae | 0.0054 | 1.01 | Fe(II) | 5.0 | 843 |
| Ceruloplasmin | H. sapien | 0.0083 | 0.51 | Fe(II) | 5.0 | 843 |
| CueO | E. coli | 0.165 | 15.2 | Cu(I) | 5.0 | 853 |
2,6-dimethoxy-phenol;
The mechanism for substrate oxidation at the T1 site has been investigated from kinetics. kcat for a selection of laccases have been shown by Xu to correlate linearly with the difference between the single electron reduction potential of the substrate and the T1 copper site.857 This is consistent with substrate reduction of the T1 in organic oxidizers being an outer-sphere electron transfer mechanism and the rate-determing-step in turnover. Furthermore, the KM values for the laccases were shown to be invariant with respect to reduction potential differences between the T1 and substrate. In steady-state kinetics, Fet3p exhibited a significant increase in KM, while leaving kcat unaffected, upon sight-directed mutation of key Fe(II) binding residues near the T1 site, implying that tight binding of the metal ion is essential for its oxidation.753,860 Single turnover kinetics on these variants exhibit marked rate depression of T1 reduction from >1200 s−1 in WT to ~141–2 s−1 in the variants, establishing that these residues also provide a path for the electron to be transferred to the T1.861 It is interesting to note the extremely fast reduction rate of the T1 Cu in Fet3p, which is much faster than the turnover rate of the enzyme843, and therefore not involved in the rate determining step, in contrast to the organic oxidases. A similar fast ET between Fe2+ and T1 Cu2+ is seen for Cp, the mammalian analog of Fet3p.862 However, Cp differs markedly from Fet3p, in that it has a total of three T1 Cu sites, two of which are redox active, while the third is permanently reduced.863 Kinetic and spectroscopic studies have shown that the redox potentials of both of the active T1 Cu’s in Cp are almost identical, and that ET between the two occurs at a rate of > 150 s−1.
Steady-state kinetics on dioxygen reduction by the MCOs, show similar values for KM(O2) ~ 20 µM and k ~ 6.0 × 10⁶ M−1s−1 at 25 °C suggesting that the dioxygen reaction in the reoxidation of the enzyme is comparable among all MCOs.852
Further understanding of the mechanism of the MCOs and their intermediates has come from extensive single turnover kinetic studies. The best-characterized and most extensively studied MCO, RvL, is considered here. Reduction of fully oxidized resting laccase proceeds via a multiphasic process.864,865 Using hydroquinone as the reductant at physiological pH, the T1 exhibits an initial reduction rate of 1.58 × 10³ M−1s−1 and a final rate of 800 M−1s−1 while the T3 reduces initially at 1.45 × 10³ M−1s−1 and finally at a substrate independent rate of 0.40 s−1. A key observation here is that the T1 is reduced faster than the T3 implying that there exists a slow intramolecular electron transfer between the T1 and T3 sites. Post-steady-state kinetics of RvLc, where oxygen is limiting with respect to substrate, exhibits second order decay at physiological pH of the T1 band to be 800 M−1s−1, while the decay at 340 nm (corresponding to the TNC Cu’s) exhibits biphasic decay with a substrate dependent rate of 1400 M−1 s−1 and a substrate independent rate of 0.3 s−1. It is important to note that this contrasts the reduction kinetics of the resting laccase, where the T1 reduces faster than the 340 nm species and therefore must be different from the process in catalysis. Pulse radiolysis experiments have measured the intramolecular T1 to T3 electron transfer process to be 1.1 s−1 in resting RvLc and were independent of the amount of reductant and extent of reduced T1.866 This further suggests that the reduction of resting laccase is not relevant under catalytic conditions since it is orders of magnitude slower than the maximal turnover rate (560 s−1).852
Reaction of reduced native RvL with dioxygen rapidly forms the “native intermediate” (NI) 864,867 at a bimolecular rate of 1.7 × 10⁶ M−1 s−1 at 3 °C and 6.0 × 10⁶ M−1 s−1 at 25 °C, in agreement with steady-state measurements.852 A derivative of the native enzyme was generated where the T1 Cu has been eliminated either via the mutation of the T1 Cys ligand to a Ser to give the T1 depleted form (T1D)868,869 or replaced chemically with a redox and spectroscopic inactive Hg(II) ion to give the T1 mercury derivative (T1Hg).870,871 Both of these derivatives contain a valid, reactive trinuclear Cu cluster that upon reduction reacts with dioxygen at a comparable bimolecular rate with that of the native enzyme (2.2 × 10⁶ M−1s−1 for reduced T1Hg Lc)872, however, yielding a spectroscopically distinguishable intermediate from NI (vide infra) known historically as the “T1Hg intermediate” or more recently as the “peroxide intermediate” (PI).873 Without the T1 Cu present, PI slowly decays to NI, while in the native enzyme PI is not observed.874 Therefore, in the native enzyme, PI converts to NI at an estimated unimolecular lower-limit rate of > 350 s−1. In the decay of PI to NI, there is an observed 18O2 KIE of 1.11, which indicates that O-O bond cleavage occurs in this step and is rate limiting. Another relevant derivative of Lc, is the T2 depleted (T2D) form, where the T2 Cu of the trinuclear cluster has been reversibly removed leaving the T3 and T1 Cu’s.875 Exposure of dioxygen to reduced T2D Lc shows no reactivity therefore establishing that the T3 site in the MCOs is different from the coupled binuclear Cu center found in Hc, Tyr & CaOx (vide supra).8
The NI intermediate decays slowly in the absence of reductant to the resting fully oxidized form with a first order rate constant of k = 0.05 s−1 at 25 °C.876 This rate is significantly slower than that of the maximal turnover rate (560 s−1)852 and therefore NI must reductively decay in the presence of substrate in catalysis. Therefore, NI is the catalytically relevant fully oxidized intermediate, not the resting state of the enzyme (vide infra). Additionally, since the intramolecular electron transfer from the T1 to the T3 in resting is slow, this electron transfer must be greatly accelerated in the reduction of NI, to be consistent with turnover.
3.7.1.3 Structure
Since the first report of a MCO crystal structure, that of ascorbate oxidase published in 1989 by Messerschmidt,796 several structures have emerged, covering almost all classes of MCOs. Invaluable insight has been obtained from these structures, both with respect to overall structure of the enzymes and with respect to the active copper sites. In this section we present the general three-domain MCO structure, as well as the deviations from this motif, observed in ceruloplasmin, and more recently the two-domain MCOs. We also provide a description of the various active site features, highlighting similarities and differences for the T1 and trinuclear sites, respectively.
3.7.1.3.1 Overall structure
The most widely distributed structure of MCOs is a globular, three cupredoxinlike domain structure.877–879 Domain 1 incorporates the T1 copper site, whereas the trinuclear site is situated in between domains 1 and 3, with ligated histidines from both domains (Figure 136A). This structure is observed in laccases (except for the two-domain laccases),880,881 CueO,844 BOD,844 Fet3p,733 and ascorbate oxidase.796 Generally, two substrate channels are identified, one presumably facilitating dioxygen delivery to the trinuclear site, terminating close to the binuclear T3 site, and a second channel, presumably serving as an exit channel for the active site generated water molecules, originating at the T2 site (Figure 137).878
Figure 136.

structural comparisons of multicopper oxidases. (A) 3-domain structure from Pyrobaculum aerophilum (PDB: 3AW5). (B) 6-domain structure from Homo sapiens (PDB: 2J5W). (C) 2-domain structure expressed in Escherichia coli (PDB: 2ZWN). Copper atoms depicted in gold, oxygen atoms in red.
Figure 137.

Water/O2 channels connecting the surface to the T2 and T3 Cu sites in T. versicolor laccase (1GYC). Cu atoms depicted in gold, oxygen atoms representing water molecules in red.
In contrast to the three-domain MCOs, Cp has a unique six-domain structure, which incorporates a total of six copper ions in three T1 sites and one trinuclear site.734,816 The mononuclear T1 sites reside in domain 2, 4, and 6, respectively, whereas the trinuclear site is situated between domain 1 and 6 (Figure 136B), with ligands from both domains, similar to the three-domain MCOs.
Recently, a new type of MCO has emerged, namely the two-domain laccases. So far, three two-domain structures, all from bacterial sources, have been published.784,882,883 The structures consist of six domains, arranged in three two-domain units, each pair incorporating a T1 and a trinuclear cluster. As for other MCOs, the trinuclear cluster is situated in between two domains, with the T1 site incorporated in either domain 1 or 2 (Figure 136C).
3.7.1.3.2 Active site structures
From the first MCO crystal structure published in 1989, the unique active site including the T1 site and the spectroscopically predicted (in 1985),884 trinuclear Cu cluster was finally confirmed. Furthermore, the structure strongly supported a mechanistic model of substrate oxidation in the vicinity of the T1 Cu, electron transfer via a Cys-His pathway from the T1 Cu to the T3 Cu’s, and finally oxygen reduction to water at the trinuclear center, also first demonstrated by spectroscopy.
3.7.1.3.3 Substrate binding and the T1 Cu site
The unique T1 Cu site in MCOs, single domain blue Cu proteins, and nitrite reductase (see section 5.1), has been intensely studied. Much knowledge has been gathered from a combination of structural, spectroscopic, and biochemical experiments, and many of the properties determining electron transfer rates and redox potentials of these sites have been elucidated.4,117,885A common trait of the T1 Cu’s in MCOs is the ligation by two His and one Cys, with the latter being responsible for the intense blue color of these enzymes. Furthermore, a fourth ligand, in the form of a weakly coordinating axial Met, is often observed (Figure 138A). Alternatively, the axial position can be occupied by non-coordinating residues e.g. Leu or Phe (Figure 138B), which tend to result in a high redox potential for these T1 coppers.
Figure 138.

Type 1 Cu sites with Met (S to Cu 3.3A) (A) and Phe (B) in the axial coordination position of CotA (2X88) and T. versicolor laccase (1GYC), respectively
Solved structures of fungal laccases from M. albomyces,735 T. versicolor731 and T. trogii886 with phenolic substrates and analogues have described the binding sites for substrate oxidation. In general, the T1 sites in the organic oxidases are significantly solvent exposed and the substrate binding sites near the T1 site are ~5–8 Å deep comprised predominantly of hydrophobic residues. Therefore, the T1 site is particularly accessible to hydrophobic substrates. In the 2,6-DMP bound structures of M. albomyces, the oxygen of the phenol is within hydrogen bond distance of H508 (Figure 139A), which is a ligand to the T1 copper and therefore the principle electron acceptor in the oxidation reaction. This is further supported by the structures of xylidine bound to T. versicolor and p-toluate bound to T. trogii where the nitrogen and oxygen of the respective molecules are in similar orientation to the T1 histidines. Additionally, these atoms bound to the T1 histidines are also within close proximity to a nearby carboxylate residue, the only hydrophilic residue in each pocket. This carboxylate is suggested to be the proton acceptor in phenol oxidation. The nature of these substrate binding sites is consistent with the fact that these proteins are non-specific in terms of their oxidase activity since the sites only contain two key interactions for substrate oxidation.
Figure 139.

Coordination environments of the Type 1 Cu and substrate binding sites for (A) M. albomyces laccase (3FU7) and ceruloplasmin (2J5W), respectively
Structural data of the metalloxidases Fet3p, Cp and CueO show that the T1 sites are far less solvent exposed compared to the sites for the organic oxidases. Structures of divalent cations bound to Cp show a substrate binding site composed of solvent exposed carboxylates (E272, E935 & D1025) and H940 in near proximity (~8 Å) to the buried T1 copper (Figure 139B).734 In Cp, this T1 connects to the TNC via the Cys-His pathway. Ion bound structures of Fet3p have not been reported, but a similar site comprised of solvent exposed carboxylates is evident from the structure and kinetic experiments coupled to site-directed mutagenesis suggesting that carboxylates D283, E185 and D409 bind ferrous substrate in Fet3p.733,860–862 Spectroscopic studies of Fe(II) bound to Cp and Fet3p confirm that the iron is bound in a six coordinate octahedral geometry in both enzymes.861 Therefore, both Fet3p and Cp display specific ferrous ion binding to a carboxylate rich substrate binding site that can facilitate e.t. to the T1.
A similar ion binding site has been structurally elucidated for CueO.845 Here, a fifth labile copper is present at a site located ~8 Å away from the T1 and bound in a trigonal bipyamidal fashion by two methionines (M355 and M441), two aspartate carboxylates (D360 and D439) and an aquo ligand. D439 hydrogen bonds to the nearby T1 histidine and therefore provides a pathway for electron transfer.
3.7.1.3.4 Trinuclear copper site
Common to all crystal structures of the MCOs, is the coordination to a total of 8 His ligands of the three Cu ions in the trinuclear cluster, arranged in four HXH motifs.877–879 Each of the T3 Cu’s are ligated to three His and the T2 Cu is ligated to two (Figure 140). A water derived ligand is a third T2 ligand in all structures except for M. albomyces, which has a Cl− coordinated in the similar position.887 Furthermore, all crystal structures contain a highly conserved 2nd sphere carboxylate residue, hydrogen bonded to His residues from the T2 and T3β Cu (D77 in Figure 140). The significance of this residue has been demonstrated in independent mutational studies, where it was shown to be required for enzymatic activity.806,888 Another well-conserved carboxylate residue is identified at the bottom of the trinuclear cluster, hydrogen bonded to solvent channel water molecules (D456 in Figure 140). This residue has been demonstrated to play a significant role in the protonation of the dioxygen-derived molecules generated in the trinuclear cluster.889–892
Figure 140.

Structural representation of the trinuclear cluster in the multicopper oxidases, depicting eight 1st sphere His in the HXH conformation. Also shown are the conserved carboxylate residues D77 and D456 (numbering according to T. versicolor laccase (PDB: 1GYC))
The redox states in the crystal of the individual Cu’s in the trinuclear cluster are difficult to assign. In addition, solvated electrons generated during X-ray irradiation may result in further reduction of the trinuclear Cu’s.893,894 A general feature of reported MCO crystal structures is the high variability observed for Cu-Cu distances in the TNC, in particular between the T3 Cu’s. This variability was shown, early on, to be related to the redox state of the TNC Cu’s. Messerschmidt et al. obtained a crystal structure of AOx grown under anaerobic conditions, with excess reductant, and found a T3 Cu-Cu distance of 5.1Å, significantly longer than the spectroscopically calibrated fully oxidized resting form of AO, that was found to be 3.7Å (Figure 141).796 In most crystal structures reported for MCOs, the T3 Cu-Cu distance falls within this range, with a few examples of shorter distances, e.g. in the structure of NI recently published.894 Another feature of the fully reduced structure of the TNC was the lack of any di- or monooxygen derived electron density between the two T3 Cu’s, consistent with the two T3 Cu’s having close to trigonal planar geometry (formed by the three His ligands), a preferred geometry of Cu(I). In the fully oxidized structure, for comparison, the geometry of the T3 Cu’s have trigonal pyramidal geometries (three His and one oxygen derived bridging ligand), with open coordination positions oriented towards the center of the TNC (Figure 140), consistent with the spectroscopically calibrated DFT structure (vide infra).895 Interestingly, very little difference is observed in the reduced versus oxidized geometry of the T2 Cu, with the two His ligands and a water derived ligand (OH− from spectroscopy)895 resulting in a square planar geometry, with an open coordination position oriented towards the center of the TNC (Figure 140).
Figure 141.

Comparison of the TNC in reduced (red) and oxidized (blue) ascorbate oxidase
In most MCO crystal structures, mono- or dioxygen assigned electron density is observed in the TNC, showing a range of different confirmations. Only in very few cases, however, have the investigators made any attempt to spectroscopically calibrate the grown crystals either before or after exposure to radiation.893,894,896 A number of studies have reported changes in the oxygen derived species upon increasing radiation doses, most systematically in a study by Halkulinen and coworkers, where at low dose, a dioxygen was observed, which, upon increased radiation resulted in observation of single oxygen species.896 Several groups have employed the observations of different oxygen derived species to propose solution-relevant mechanisms for MCOs, often with obvious contradictions to spectroscopically well defined reaction intermediates.893,897,898 This illustrates that although much information can be obtained from X-ray crystallography, there is a need for more rigorous evaluation of the crystal growing conditions, as well as the effect of radiation on a given crystal structure.
3.7.1.4 Electronic Structure
3.7.1.4.1 Resting Enzyme
The resting oxidized state of the MCOs exhibits spectral features associated with all four of its coppers. The absorption spectrum (Figure. 142, top) exhibits two main features, a band at 330 nm (30,300 cm−1), assigned as µ2-OH to T3Cu(II) CT transitions and another at ~ 600 nm (16,700 cm−1) assigned as the SCys,π to T1Cu(II) CT. The EPR spectrum shows contributions from two S = ½ Cu(II) ions, the T1Cu(II) (g∥ ~ 2.30, A∥ = 40 – 95 × 104cm−1) and the T2Cu(II) (g∥ ~ 2.24, A∥ = 140 – 200 × 104cm−1) (Figure 142, bottom). The T3 coppers are EPR silent due to antiferromagnetic coupling via a µ2OH superexchange pathway leading to an S = 0 ground state with an observed lower limit of −2J > 550cm−1 from SQUID magnetic susceptibility experiments.730
Figure 142.

Spectroscopic features of the resting oxidized enzyme in RvL: (A) Electronic absorption and (B) EPR.
The spectroscopic features of the T2/T3 trinuclear cluster of the resting state have been further refined in the T1Hg derivative where the T1 Cu does not contribute and the TNC is unperturbed.871,895 This allows the LF transitions to be observed; the T2 in LT MCD as it is paramagnetic, and the T3 in CD. From a LF analysis of the d → d transitions observed in LTMCD (Figure 143A), and its EPR signal (Figure 142, bottom), the T2 copper has a d(x2-y2) ground state in an approximately square planar geometry with a vacant equatorial position pointed towards the center of the TNC. Additionally, the T2 Cu(II) is coordinated by a solvent derived hydroxo ligand external to the cluster, which (from ESEEM) remains in this protonation state over its functional pH range.895 The spectral features of the T3 Cu(II)’s are resolved in the RT CD spectrum (Figure 143B). More than four LF transitions are observed indicating the two T3 Cu(II)’s are inequivalent, likely related to the ε coordination of one His residue on T3α (vide supra). The LF’s of the T3 Cu’s are best described as trigonal bipyramidal with d(z2) ground states with the z-axis of each half occupied orbital oriented toward the µ2OH giving the AF coupling, and open coordination positions in the equatorial plane on each T3 Cu oriented toward the center of the cluster.895 Density functional theory derived surface plots of the trinuclear cluster also show LUMOs on the T3 Cu-α/β and the T2 Cu directed towards the center of the cluster, where small molecules can bind in a bridging mode (Figure 144).895
Figure 143.

Spectroscopic features of the trinuclear Cu site in Lc: (A) LT MCD and (B) RT CD of oxidized T1Hg Lc. (Reprinted with permission from Ref. 922. Copyright 2001 John Wiley and Sons Inc.)
Figure 144.

Electronic structure of the resting trinuclear cluster. (From Ref. 921 – Reproduced by permission of The Royal Society of Chemistry.)
Key observations of the properties of the resting oxidized state of the MCOs, came from spectroscopic characterization of exogenous ligand binding to the trinuclear cluster. In a study from 1985, Allendorf et al. provided the first evidence, based on rigorous spectroscopic evaluation of azide and fluoride binding to native RvL, that the T2 and T3 Cu sites form a trinuclear copper cluster (TNC).884 These data were further elaborated upon in a subsequent study by Spira-Solomon et al.899 From room temperature absorption and LTMCD experiments, azide was found to bind in a high affinity form (K ≥ 104M−1) and a low affinity form (K ~ 200M−1). Two features from the high affinity bound azide were resolved in LTMCD at 445 and 510 nm. The intensity of these features maximized at less than one enzyme equivalent of azide, and this high affinity form was eliminated upon treatment with peroxide. XAS studies showed that purified resting tree laccase contains ~ 25% reduced T3 Cu, which is oxidized by addition of peroxide. Based on this, the high affinity feature was assigned as T2 Cu(II) bound azide, formed in the presence of a reduced T3 Cu site.
Upon additional titration of native laccase with azide, several new features were observed in Abs, LT MCD, and LT EPR. Figure 145A shows the Abs. and LT MCD spectra in the azide to Cu(II) charge transfer region, baseline corrected by subtracting the intensity of the high affinity azide binding features. Several important features were observed. First, two prominent transitions are present in the Abs spectrum; an intense feature at 400nm and a shoulder at 500nm. Both transitions increase in intensity with the addition of azide. Comparing these transitions with transitions in the LT MCD spectrum revealed that only the 500nm shoulder has a corresponding paramagnetic contribution. The negative feature in LT MCD at 485nm is seen to increase with addition of azide, whereas the 385nm positive MCD feature first increases and then decreases with increasing azide concentration, inconsistent with the intensity pattern of the 400nm band in Abs. Based on this, the 400nm absorption band was assigned as an azide to T3 Cu(II) CT transition (AF coupled so no corresponding feature in LT MCD), whereas the 500nm absorption (485nm LTMCD) band was assigned as a to T2 Cu(II) CT transition. Additional features in LT MCD at 330nm (−) and 440nm (−) showed intensity patterns identical to those of the 385nm LT MCD band. Finally, azide titrated laccase was also probed by LT EPR. Here, a characteristic new feature emerged at g = 1.86 (Figure 145B). The spin integrated intensity of this signal, correlated with that of the 340, 385, and 440nm LT MCD transitions. Importantly, these LT MCD transitions as well as the LT EPR signal showed a pH- dependent behavior, with increasing intensity at low pH, consistent with protonative uncoupling of the µ2-OH T3 bridge. This uncoupled species has been investigated in significant detail in subsequent studies (vide infra).
Figure 145.

(A) RT Abs (top) and LT MCD (bottom) spectra of azide titration at 2.5, 9.0 and 38 protein equivalents (a,b, and c) of native RvLc. (Reprinted with permission from Ref. 884.) (B) LT EPR spectra corresponding to the RT Abs and LT MCD samples. (Reprinted with permission from Ref. 871. Copyright 1990 American Chemical Society.) (C) Optimized structures of Niaz and Raz. (Reprinted with permission from Ref. 900, copyright 2007 National Academy of Sciences, USA.)
Returning to the 400nm Abs with no corresponding LT MCD intensity, and the 485/500nm LT MCD/Abs features, complimentary fluoride binding experiments were conducted in order to obtain more information on exogenous ligand binding to the different copper sites. When fluoride was added to native laccase, pre-treated with 9 equivalents of azide, doublets were observed in the hyperfine EPR signal, indicating that fluoride bound to the T2 Cu(II) (vide infra). This F− binding, significantly decreased the intensity of all the azide CT transitions, both to the T2 and to the T3 Cu(II)’s. Importantly, the stoichiometry of the reaction revealed that only one fluoride bound to the enzyme, i.e., one fluoride bound to the T2 eliminated azide binding at both the T2 and the T3 Cu(II)’s. This led to the conclusion that the T2 and T3 Cu sites of MCOs are arranged in a trinuclear cluster. This was later confirmed in all reported crystal structures of MCOs.
A further resolution of the above mentioned spectroscopic features of azide binding, was obtained in a study from 1990 by Cole et al.871 Here, azide titrations were performed on the T1Hg derivative of RvL, eliminating the spectral complications of the T1 Cu. This study showed that the low affinity binding, associated with the 400 and 500nm bands, could be further resolved into two different binding events, with binding constants of 780M−1 (500nm feature) and 270M−1 (400nm feature), respectively. Also, the protonative uncoupled species was shown to correlate with binding of the first azide, and upon binding of the second azide, these features, including the 385nm MCD band and the LT EPR signal at g = 1.86, decreased in intensity (Figure 145A and B), indicating that the second azide binding perturbs the first azide bound trinuclear structure and thus its corresponding spectroscopic features.
Additional information of the nature of the uncoupled species has been obtained from more recently conducted experimental and computational studies.900 Here, a species with identical spectroscopic features to those of the uncoupled species but much more intense, was generated by azide addition to the native intermediate (NI). NI is the fully oxidized, catalytically relevant species in turnover of MCOs (vide infra, section 3.7.1.4.3). This azide bound NI (NIaz) was found to decay to the one azide bound resting species (Raz, the first azide species) elucidated by Cole et al.871 Also, interconversion of NIaz and Raz is reversibly obtained by changing the pH, consistent with previous findings (vide supra). Figure 145C presents a structural model for this interconversion, obtained through DFT optimized structures calibrated by the spectroscopic data.
Further insight into the properties of the TNC came from spectroscopic and computational studies of T1Hg Lc in its fully oxidized resting form as well as a fully oxidized fluoride bound form.895 Fluoride is known to bind to the TNC with >105 higher affinity than for mononuclear Cu(II) sites.901,902 Since F− has In = ½, this results in characteristic doublet EPR features (Figure 146). A correlation with RT Abs, CD, and LTMCD showed that one fluoride binds to the open coordination positions at the center of the cluster, with only a weak perturbation of the LF features (T2 in LT MCD and T3 in CD) and without influencing the T3-OH bridge or the T2 coordinated hydroxide.895
Figure 146.

Fluoride binding to T1Hg Lc, showing the splitting of the parallel hyperfine structure into doublets. Data-solid line, simulation-dotted line. Y-axis in units of Magnetic Field (Gauss). (Reprinted with permission from Ref. 895. Copyright 2005 American Chemical Society.)
These experimental results were correlated to DFT calculations, and binding energies were calculated for F− and the possibility of water binding as OH− to the open coordination positions of the center of the TNC. The results showed that F− binding was highly exothermic (−69 kcal/mol), explained by a favorable electrostatic interaction between the anion and the highly positive TNC, large enough to overcome the energy loss from desolvation of the fluoride.895 A similar electrostatic interaction was observed in binding of OH− to the TNC, again resulting in an exothermic process. However, due to the energetically unfavorable deprotonation of water to produce the hydroxide, this process was calculated to be less favorable by 48kcal/mol compared to fluoride binding. However, water binding as OH− at the center of the TNC is still calculated to be an exothermic process which is inconsistent with the coordination unsaturation of the resting enzyme (vide supra). However, there are four negatively charged residues found within 10Å of the TNC in most MCOs, counteracting the high positive charge of the resting TNC (+4 from 3 Cu(II)’s and 2 OH‘s). Including this charge contribution to the active site lowers the net positive charge and thus the energy gain of anion binding by ~27kcal/mol, enough to make the binding of OH− unfavorable as observed experimentally.895 Thus, the protein environment facilitates open coordination sites in the center of the TNC, thereby tuning the redox properties of these Cu’s. This is highly important in that it drives electron transfer from the T1 to the TNC, a requirement for activation of the enzyme towards dioxygen reduction (vide infra).
3.7.1.4.2 Peroxy Intermediate
The intermediate formed upon dioxygen exposure to a fully reduced TNC with the T1 redox inactivated (T1D and T1Hg) is the peroxy intermediate (PI).903 This species has now been identified in a number of different MCOs.806,869,903–905 PI forms rapidly (vide supra) to give an EPR silent species exhibiting strong CT transitions at 340 nm (29,400 cm−1) and 470 nm (21,300 cm−1) (Figure 147).903 In the T1Hg derivative of RvL, PI decays slowly (k = 0.013 min−1) to an intermediate with an MCD signal of an NI-like species (vide infra) and finally to a species with an EPR signal identical to that of the T2 Cu in the resting enzyme.873 The decay of PI generated with 18O2 shows the appearance of two H2 18O’s, monitored via isotope ratio mass spectrometry (IRMS) indicating that both atoms of 18O2 must be present in PI since this labeled oxygen appears concomitantly with PI decay (Figure 148).873 The CD spectrum of PI (Figure 149 left) exhibits LF features of Cu(II)’s corresponding to the band observed in the Abs. spectrum at 600–800nm (Figure 147B), while no LT MCD intensity is observed (Figure 149, right). The absence of an MCD signal is consistent with the EPR silence of PI and indicates that the two Cu(II)’s are AF coupled (S = 0) with the third Cu in the TNC reduced. This confirms that PI is a two-electron reduced peroxo level species. Importantly, the CT Abs spectrum of PI greatly differs from that of oxy-Hc, requiring that the peroxide bridging motif of PI is different from the µ-η2: η2-peroxo structure of Oxy-Hc (Figure 150).903,906 SQUID magnetic susceptibility studies further demonstrated AF coupling between the two Cu(II)’s in PI with a lower limit of −2J > 200 cm−1.873 Finaly, the Fourier transform of the EXAFS spectrum of PI (Figure 151) shows a new strong outer shell peak consistent with a tightly bridged (ie. low Debye-Waller factor) Cu-Cu vector at 3.4 Å, whereas this feature is absent in the EXAFS spectrum of the resting TNC.873
Figure 147.

Decay of PI in T1Hg Lc. (A) decay of the RT absorption and (B) difference spectra of PI with the spectrum of reduced T1Hg subtracted. (Reprinted with permission from Ref. 873. Copyright 1996 American Chemical Society.)
Figure 148.

IRMS and absorption of the decay of PI monitored under the same conditions. (Reprinted with permission from Ref. 873. Copyright 1996 American Chemical Society.)
Figure 149.

Comparison of (left) RT CD and (right) LT MCD of the oxidized resting state of T1Hg laccase (dashed) and PI (blue). (Reprinted with permission from Ref. 922. Copyright 2001 John Wiley and Sons Inc.)
Figure 150.

(A) Absorption spectra of the charge transfer region of oxy-Hc (black) and PI (red). (B) RT Abs of the CT region of PI, with assignment of CT transitions indicated. (Reprinted with permission from Ref. 906. Copyright 2007 American Chemical Society.)
Figure 151.

Fourier transforms of the EXAFS data for PI (−), reduced (- -), oxidized (-_-) forms of T1Hg Lc. (Reprinted with permission from Ref. 873. Copyright 1996 American Chemical Society.)
A geometric and electronic structure model of PI has been developed from extensive DFT correlations to the spectroscopic data (Figure 152).906 When O2 is bound to the reduced trinuclear cluster, the geometry optimized structure observed is that of the µ-η2: η2-peroxo between the two oxidized T3 Cu’s, a structure very similar to that of oxy-Hc in section 3.1 (Figure 152A) This, however, is inconsistent with the absorption features of PI compared to oxy-Hc (Figure 150). Mutagenesis studies, in Fet3p, have shown that reaction with dioxygen does not occur upon substitution of an MCO-conserved carboxylate residue, near the T2/T3β edge (D94 in Fet3p, β indicates the T3 closest to D94) with charge neutral Ala/Asn.888 Since a carboxylate residue at this position is required for dioxygen reactivity, it was included in the computational model. Optimization of a D94-included active site yielded a µ3-1,1,2-peroxo species bridged between the oxidized T3β (η2), oxidized T2 (η1), and reduced T3α (η1).906 These predicted oxidation states of the TNC Cu’s in PI have recently been experimentally confirmed (vide infra).907 The T2 and T3β Cu’s are close to D94, suggesting that the negative charge of the carboxylate residue lowers the redox potentials of the T2 and T3β Cu, resulting in favorable two-electron transfer to dioxygen from these Cu’s. This is seen in the electronic structure of PI (Figure 152B) where the T2 and T3β Cu(II)’s have their half occupied dx2-y2 orbitals strongly overlapping the π*σ orbital of the peroxo, providing the superexchange pathway leading to their antiferromagnetic coupling in the µ2-1,1,2 bridged structure (Figure 152B). The LF of the T2 Cu(II) is lower than the LF of T3β Cu(II), therefore the CT transitions to the T2 Cu(II) will be lower in energy.906 Also, as described in section 3.1, the O22− has a low energy π*v and high energy π*σ CT transition, which lead to the assignment of the O22− to T2 and T3β Cu(II) CT transitions of PI, given in Figure 150.906
Figure 152.

(A) Calculated geometric structures of PI without and with D94. The PI structure without D94 (left) has both T3 Cu’s oxidized and the T2 Cu reduced while in the structure with D94 (right), the T3β and T2 are oxidized and the T3A is reduced. (B) Contours of the α- (based on the T2 dx2-y2) and the β- (based on the T3 β dx2-y2) LUMOs of PI + D94. (Reprinted with permission from Ref. 906. Copyright 2007 American Chemical Society.)
3.7.1.4.3 Native Intermediate
As described above, PI is generated in the absence of a redox active T1 Cu. When the fully reduced native enzyme (T1 and TNC are all present and reduced) reacts with dioxygen, a different intermediate,908 NI is formed. This is characterized in Abs. by intense charge transfer bands at 318 and 365nm associated with the TNC, and also a 614nm band (Figure 153A top),909 the latter indicating that the T1 site has been oxidized. Therefore, at least one additional electron has been transferred to dioxygen, relative to PI. The 77K EPR spectrum only shows features resembling those of the T1 Cu(II). This led Reinhammar, who first reported NI, and others, to assign NI as a three electron reduced hydroxyl radical species, with electron transfers from the T1 Cu and two type 3 Cu’s.876,910–912 However, Cu K-edge XAS and MCD spectroscopies were not consistent with a hydroxyl radical species (vide infra).909
Figure 153.

Stopped flow absorption spectra (top) and rapid freeze quench MCD spectra (A), Cu K-edge XAS spectra (B), variable temperature, variable field behavior of the MCD spectra with Brillouin function fits with different values (C), low temperature X-band EPR (D), temperature dependence of the MCD spectra (E) and plot of temperature dependence of MCD intensity at 25,000 cm−1 of NI. (From Ref.597–Reproduced by permission of The Royal Society of Chemistry.)
Although NI studies have mainly been conducted in RvL, due to favorable kinetic properties, its occurrence in Cp,913 BOD, 806 and CueO904 indicate that this intermediate is part of the reaction cycle in MCOs in general.
NI displays a range of interesting spectroscopic features, summarized in Figure 153, all contributing to the final determination of its geometric and electronic structure.909 From Cu K-edge XAS the lack of a 8984eV feature characteristic of Cu(I) showed that all Cu ions in NI are oxidized (Figure 153B), clearly inconsistent with a three electron hydroxyl species. Instead, dioxygen is reduced to the water level by four electrons. As mentioned, the 77K EPR spectrum shows the typical T1 Cu signal with narrow AII, but no contribution from the TNC. However, upon lowering the temperature, new rhombic features emerge with g-values of 2.15, 1.86, and 1.65, drastically different from “normal” Cu(II) signals (e.g. the T2 Cu in the resting MCOs) that generally do not have g values below 2.00 (Figure 153D). The new features also show markedly different power saturation behavior with temperature relative to the T1 Cu, indicating a low lying excited state at the TNC in NI. The LT MCD spectrum of NI shows an intense pseudo-A term signal (ie. derivative shaped) with features at 318nm (31,780cm−1) (+) and 365nm (27,560cm−1) (−), corresponding to the two CT Abs features (Figure 153A bottom). Furthermore, saturation behavior of the LT MCD signal with varying magnetic field at low temperature shows the unusual g values of NI are associated with an STOT = ½ ground state (Figure 153C). Finally, the temperature dependence of the MCD intensity at high field shows an unusual behavior. Normally, the MCD intensity of paramagnetic species follows a 1/T Curie type behavior.909 From Figure 153E, the intensity at 25,000cm−1 does initially decrease with increasing temperature up to 30K. However, when the temperature is raised further the intensity increases, a non-Curie behavior indicative of population of the low-lying excited state with a more intense positive MCD feature at this energy, compared to the ground state. By fitting the intensity at 25,000cm−1 to a Boltzmann population model, an excited state energy of ~150cm−1 is obtained (Figure 153F). Furthermore, by simulating the temperature dependence at each wavelength, the MCD spectrum of the excited state can be modeled (vide infra). The excited state energy of 150cm−1 is supported by the relaxation studies (power at variable temperature) of the EPR signalat g = 1.65 signal indicating an Orbach process. In summary, there are three unique spectroscopic features of NI: a low lying excited state at 150cm−1, a ground S =1/2 with g-values below 2.00, and a CT pseudo-A term in MCD.909
An additional important spectroscopic input was obtained from EXAFS, which revealed that at least two Cu’s of the TNC in NI are tightly bridged together at a Cu-Cu distance of 3.3Å (Figure 154A).909 From magnetostructural correlations, this distance is consistent with a pair of Cu’s with a singlet/triplet splitting of ~520cm−1 for a singly bridged species (Figure 154B). Accounting for the presence of a third Cu(II) in the TNC 155, left), a singly bridged structure should have a ground doublet with excited doublet and quartet states at 520cm−1. When a bridge is introduced to the third Cu(II), this excited degeneracy is lifted (Figure 155, middle), but the lowest energy excited state remains at ~500cm−1 above the ground state, inconsistent with the 150cm−1 observed experimentally. Introducing a third bridge to close the triangle leads to spin frustration that significantly lowers the energy excited state transitions. As presented in section 2.4, spin frustration arises when all three bridging interactions are antiferromagnetic and of similar magnitude. In that limit, each of the Cu(II) pairs want to be antiferromagnetically coupled, but this is obviously not possible in an all bridged triangle. The significant lowering of the doublet excited state energy is consistent with the low lying excited state observed in NI. From the constraints of the bridging interaction of 520cm−1 and the 150cm−1 low lying excited state, limits of the two remaining exchange couplings can be estimated to be 440–520cm−1 and 435–445cm−1, respectively. These limits can be further refined by evaluating the contribution of each Cu(II) in the TNC to the ground- and excited state MCD spectra in Fig 156A. The MCD C-term has contributions from each of the three Cu’s of the TNC, representing the coupling coefficients of the individual Cu(II)’s to the overall ground- and excited state wavefunctions of NI. These are given by:
where C0 and C’0 are the total C-term intensity of the ground and first excited state MCD spectra, respectively, and C0(i) is the C-term contribution from Cui. The coupling coefficients, c(i), are dependent solely on the J couplings, and from these, ground and excited state coupling coefficients can be evaluated within the above mentioned limits (Figure 156B). Inspection of the ground and excited state MCD spectra of NI (Figure 156A) reveals three different behaviors with respect to intensity and sign of the transitions. Bands labeled 8, 11, and 12 are negative in the ground state but have large positive intensities in the excited state. Band 9 is large and positive in the ground state with very limited intensity in the excited state. Finally, band 10 is positive in both the ground and excited state. Evaluating these behaviors in connection with the possible coupling coefficients of Fig 156B, gives AF exchange interactions of 520 (fixed from EXAFS distance), 470, and 430cm−1 (Figure 156C). Importantly, this analysis shows that the different Cu centers contribute to the different CT transitions in the MCD spectrum of NI (labeled in Figure 156A) and the three large J-values (Figure 156C) require that all 3 Cu’s of the TNC are bridged.909
Figure 154.

Fourier Transformed EXAFS spectra of NI (A) and magnetostructural correlation of the Cu-Cu distance (and angle) with exchange coupling constants (J) for OH bridged Cu(II) model complexes (B). (Reprinted with permission from Ref. 909. Copyright 2002 American Chemical Society.)
Figure 155.

Energy levels of spin states in trinuclear Cu(II) species, with one, two, and three bridging interactions, respectively. (From Ref. 921 – Reproduced by permission of The Royal Society of Chemistry.)
Figure 156.

Modeled LT MCD spectra of the ground and first excited state of NI (A), Coupling coefficients of individual Cu’s in the ground and excited state wave functions (B), Estimated bridging interactions between the three Cu(II)’s (C). (Reprinted with permission from Ref. 909. Copyright 2002 American Chemical Society.)
As discussed in section 2.4, a spin frustrated trinuclear Cu(II) center can undergo a zero field splitting due to antisymmetric exchange which would lead to g-values well below 2.00 as observed for NI in Figure 153D. From section 2.4, antisymmetric exchange requires good ground state exchange coupling between two Cu(II)’s, SOC to an excited state on one Cu(II), and good exchange coupling between this excited state and the ground state on the adjacent Cu(II). There are two possible allbridged structures of NI, and model complexes exist for both.914,915 On possibility, TrisOH as shown in Figure 157A, would result from reduction of O2 to H2O to produce two bridging OH-‘s, and a third bridge would derive from the H2O solvent. In the alternative µ3-oxo stucture (Figure 157B), the O would derive from full reduction of O2. Both structures have the appropriate orbital arrangements for ground to ground and ground to excited state exchange coupling to have significant antisymmetric exchange (Figure 157C) and indeed we have observed this experimentally.66,916,917 Single crystal EPR experiments on TrisOH, Figure 158, show that very low g-values are in fact observed for this structure, when the field is perpendicular to its z-axis.918 From Figure 157C, for TrisOH two dx2-y2 ground state orbitals on two Cu(II)’s strongly antiferromagnetically couple, and SOC on one Cu gives a dxy excited state on that Cu, that can strongly couple to the dx2-y2 ground state of the adjacent Cu, thus fulfilling the requirements for efficient antisymmetric exchange. A similar mechanism is realized for µ3-oxo when the µ3-bridging oxo group resides in or close to the plane of the three Cu(II)’s.917 In this case, each dz2 ground state can SOC to a dxz excited state on an adjacent Cu(II) via the Lz orbital angular momentum operator. Thus both TrisOH and µ3-oxo are possible structures for NI.
Figure 157.

Structures of the TrisOH (A) and μ3-oxo (B) model complexes. Mechanism for antisymmetric exchange in TrisOH. (Reprinted with permission from Ref. 916. Copyright 2005 American Chemical Society.)
Figure 158.

Single crystal LT EPR of TrisOH at angles from 0–60° spanning g-values from 2.3 to 1.2 of the molecular z-axis with respect to the direction of the applied field. (Reprinted with permission from Ref. 918. Copyright 2004 American Chemical Society.)
In order to distinguish between these models and determine the geometric and electronic structure of NI, we performed an analysis of the LT excited state CT MCD features of these trinuclear model complexes and applied the results to NI.916 TrisOH (Figure 159A), µ3-oxo (Figure 159B), and NI (Figure 153A) all share the common feature of an intense derivative shaped pseudo-A term in the charge transfer region of their MCD spectra. In order to have pseudo-A term MCD intensity, two perpendicular CT transitions are required, that can spin orbit couple in a third mutually perpendicular direction. Due to the 1/r3 dependence of spin-orbit coupling, this can be approximated as a single center, one electron operator. Thus for two CT transitions to SO couple, they must have the same donor and different acceptor orbitals (or vice versa) that share a common metal- or ligand based center. These requirements give rise to two different scenarios: CT from two ligands to a given Cu (TrisOH, Figure 159C) with metal based SOC, or CT from an oxo bridge to two different Cu’s (µ3-oxo, Figure 159D) with oxo centered SOC.
Figure 159.

MCD spectra of the TrisOH model complex (A), and the μ3-oxo complex (B), Metal-based SOC as observed in TrisOH (C), Ligand-based SOC as observed in μ3-oxo (D). (From Ref. 921 – Reproduced by permission of The Royal Society of Chemistry.)
From Figure 159A, an intense symmetric pseudo-A term feature is observed for TrisOH in the energy region between 27,000cm−1 and 35,000cm−1.916 VTVH MCD of this feature shows four individual transitions, all x,y polarized, which then requires the spin-orbit coupling to be in the z-direction. Analyzing the orbital origin of these transitions indicates that only metal-based SOC can lead to significant pseudo-A intensity, coupling transitions from two different OH-ligands to the same metal site. This is possible due to the highly covalent Cu-OH σ-bonds that allow for significant metal character in the charge transfer states. As observed in Figure 159A, the pseudo-A term of TrisOH consists of a negative lower energy and a positive higher energy band. The signs of these bands can be theoretically predicted by evaluating the signs of the transition moment dipoles and the SOC operator as they relate to the MCD C-term. The sign of the transition moment dipole is obtained from the transition densities, which are the products of the donor and acceptor wavefunctions, whereas the sign of the SOC operator is given by ligand-field theory. From these assignments, the predicted signs of the pseudo-A term in TrisOH are a negative low energy and a positive high energy band, consistent with the experimental data in Figure 159A.
For the µ3-oxo complex, only ligand-based SOC is possible (Fig 158D).916 The MCD spectrum of µ3-oxo shows an intense pseudo-A term in the CT region (Figure 159B), with the low energy band positive and the high energy band negative. (Note: these transitions are eliminated by protonation of the bridge to µ3-OH). While this complex has an S = 3/2 ground state, DFT calculations of a more planar S = ½ µ3-oxo structure, predict that the corresponding pseudo-A term will also have a positive low energy and negative high energy band, as observed experimentally in Figure 159B, and opposite to that of the TrisOH complex.
Finally this analysis was applied to the MCD features of NI.916 From Figs. 156A ground state MCD spectrum, the characteristic pseudo-A term has a positive low energy (27,560cm−1) and a negative high energy band (31,780cm−1). The VT MCD data further show that the pseudo-A term consists of CT transitions to the different Cu(II) centers (Figure 156A bottom). The fact that more than one Cu center is involved in the pseudo-A term, unambiguously assigns NI as having a µ3-oxo-like structure, since only the ligand-based SOC mechanism allows coupling of CT’s to two different Cu centers (Fig 159D). This assignment is further supported by the sign of the pseudo-A term of NI (Figure 153A and 156A ground state), with the positive band lower in energy than the negative band, consistent with the µ3-oxo but not the TrisOH spectrum in Fig 158B and A, respectively.
One issue remains regarding the structure of NI, namely whether the second oxygen atom of O2 reduction stays bound to the TNC as in Figure 160 (the origin of the proton on the µ2OH will be resolved in the next section). EXAFS and DFT calculations were conducted in order to address this issue.900 In EXAFS, NI was compared to an azide-bound NI derivative (NIaz), where a single azide molecule is internally bridged to all three TNC Cu’s, with no additional bridging interactions. The first shell Cu-N/O interaction shows a higher coordination number in NI vs. NIaz, indicative of a second bridging interaction between the two T3 Cu’s. Also, DFT calculations predict that protonative loss of the µ2OH T3 bridge in Figure 160, will rotate one of the T3 Cu orbitals away from the x,y plane, resulting in ferromagnetic coupling with the other Cu ions, clearly inconsistent with the above described spin frustration features of NI. Finally, it is in fact calculated to be ~17 kcal/mol more favorable to protonate the µ3-oxo than the µ2OH. These results allow the assignment of NI as a µ3-oxo species, with an additional µ2OH bridge between the two T3 Cu(II)’s (Figure 160). This structure for NI is also consistent with QM/MM calculations.919,920
Figure 160.

Spectroscopically derived calculated structure of NI where the μ3-oxo and μ2OH derive from the 4-electron reduction of dioxygen. (Reprinted with permission from Ref. 906. Copyright 2007 American Chemical Society.)
In summary, extensive spectroscopic and theoretical studies have identified two fully oxidized TNC structures in MCOs. The resting enzyme with AF-coupled T3 Cu’s via a µ2-OH and a magnetically isolated T2 Cu (Figure 144), and NI with an all-bridged µ3-oxo structure (Figure 160). The all-bridged nature of NI tunes its redox properties and allows for facile e.t. from the T1 Cu to each of the TNC Cu’s through µ3-oxo superexchange pathways; a significant feature in terms of the reactivity of the MCOs (vide infra).
3.7.1.5 Molecular Mechanism
3.7.1.5.1 Molecular mechanism of O2 reduction in MCOs
Reduction of dioxygen to water by the MCOs occurs at the TNC, with four electrons being transferred in two two-electron transfer steps. A generally accepted mechanism, as depicted in Figure 161, has been formulated.921 The starting point is the fully reduced enzyme where O2 binds and gets reduced by two electrons from the T2 and T3β Cu, forming the spectroscopically characterized peroxy intermediate, PI. Two additional electrons are then rapidly transferred to PI (one from the T3α of the TNC and one from the T1 Cu), resulting in O-O bond cleavage and formation of NI, where the oxygen atoms of the original O2 are reduced to the water level. In the presence of reducing substrate, NI will undergo fast reduction back to the fully reduced enzyme. Alternatively, with no excess reductant, NI will slowly decay to the thermodynamically more stable resting oxidized enzyme. The resting TNC is only slowly reduced by the T1 at a rate inconsistent with turnover. This mechanism is a result of many years of spectroscopic, kinetics, and computational studies by our group and others that are summarized in the following sections.
Figure 161.

Mechanism of O2 reduction to water by the multicopper oxidases. The catalytic cycle comprise steps connected by the red arrows, with an additional facile intramolecular ET from T1 to T2 Cu in-between step 1 and 2. Due to slow conversion, NI to resting oxidized enzyme is not part of the catalytic cycle. (From Ref. 921 – Reproduced by permission of The Royal Society of Chemistry.)
3.7.1.5.2 Reactivity of the T3 binuclear Cu site
A significant achievement in the elucidation of the mechanism by which MCOs reduce O2 to water, has been in determining the individual role of each of the Cu’s in the TNC. From Figure 161, the T2/T3β Cu(I)’s deliver the electrons in the first two-electron transfer step. This was shown experimentally as well as computationally (vide supra). Prior to this, the T3 binuclear Cu’s were assumed to be the active Cu’s in this step,730,922 mainly due to the resemblance of the site with that of the coupled binuclear Cu enzymes like hemocyanin, tyrosinase, and catechol oxidase (section 3.1 and 3.2), which in their reduced state bind and reduce dioxygen in a two-electron reversible step. Experimental insight into the reactivity of reduced T3 Cu sites in Hc (deoxy-Hc) and T2D RvL (deoxy-Lc) with dioxygen, was obtained by probing the redox state of the T3 Cu’s, by Cu K-edge XAS. Spectra of reduced enzymes were compared to those of these enzymes shortly after exposure to dioxygen.730 As seen in Figure 162A, a reduced T3 Cu site in deoxy Hc has significant intensity in the 8984eV region, consistent with the spectra of Cu(I) model complexes.8 After exposure to dioxygen, however, this intensity is eliminated showing oxidation of the two Cu ions in Hc. In contrast, no change is observed in the XAS spectrum of T2D deoxy-Lc after exposure to O2 (Figure 162B), showing a lack of reactivity of the reduced T3 Cu site in the MCOs in the absence of the T2 Cu. This is interesting considering the apparent similarity in ligand environments, where both the Hc T3 and RvL T3 Cu sites have 6 highly conserved 1st sphere His ligands. A recent study by Yoon et. al, provided insight into this reactivity difference (cf. section 3.1.5).333 This was based on computational evaluation of energies of the deoxy forms of the enzymes, as well as binding energies of O2 to the fully reduced sites. Models for each binuclear deoxy site were generated, imposing frozen αC positions of the His ligands as dictated by crystallography of Hc vs. MCOs. By varying the Cu-Cu distance, Potential Energy Surfaces (PES) were generated (Figure 52, filled symbols), with the most energetically favored structures obtained at 4.2 and 6.5Å for deoxy-Hc and T2D deoxy-Lc, respectively. A significant destabilization of ~6.9kcal/mol was observed for deoxy-Hc compared to deoxy-Lc. Subsequently, PES with the αC constraints removed, were generated (Figure 52, open symbols), revealing that the main contribution to the difference in energy is the electrostatic repulsion of the closely spaced Cu ions in deoxy-Hc. Additionally, O2-binding energies of the two deoxy sites were evaluated on S=0 and S=1 reaction coordinates, generated by introducing an O2 molecule into the center of the binuclear sites. For deoxy-Hc, O2 binding was observed to be exothermic by 2.9kcal/mol, with a spin cross-over from S=1 to S=0 occurring at ~4.0Å with no additional barrier, resulting in a final µ-η2;η2 peroxy-level (S=0) structure with a Cu-Cu distance of ~3.6Å, consistent with experimental data (vide supra). In contrast, O2 binding to T2D deoxy Lc was energetically unfavorable by 5.6 kcal/mol (Figure 163), where a peroxy structure was obtained, similar to that of oxy-Hc (Cu-Cu distance of 3.7Å), with spin cross-over occurring at ~4.0 Å and an energy barrier of ~9.0 kcal/mol. Thus, while O2 binding to deoxy-Hc is exothermic with a barrier-free spin crossover, O2 binding and reduction by deoxy T3 in T2D Lc is thermodynamically as well as kinetically, unfavorable. It is interesting to note, that the calculated total energy of the O2 bound structures of Hc and RvL, respectively, only differs by 1.9kcal/mol, but due to the energy difference of the deoxy forms, only deoxy-Hc is capable of facile reaction with O2. This difference is a property of the backbone constraints imposed on the T3 Cu coordinating His residues, as illustrated in Figure 164.333 Here, it is observed that most of the His residues, in Hc, reside at the end of rigid α-helical motifs, whereas, in MCOs, the corresponding residues are mainly situated on long flexible loops. The flexibility in the MCOs, is reflected in reduced and oxidized crystal structures, respectively, where T3 Cu-Cu distances are seen to vary from ~3.4 to >5Å (see section 3.7.1.3).
Figure 162.

A. Cu K-edge XAS of deoxy Hc before and immediately after exposure to O2. B. Similar as A, but with deoxy laccase. (From Ref. 921 – Reproduced by permission of The Royal Society of Chemistry.)
Figure 163.

Reaction coordinates for O2 binding in laccase. S=0 (obtained from broken symmetry calculations) and S=1 energies are shown in filled and open symbols, respectively. Inset: similar results for deoxy hemocyanin. (Reprinted with permission from Ref. 333.)
Figure 164.

Structures of deoxy hemocyanin and deoxy laccase emphasizing the backbone induced constraints on the T3 Cu coordinating His residues. (Reprinted with permission from Ref. 333.)
3.7.1.5.3 T2 and T3 Cu’s deliver electrons in the first two-electron step
While the T2D MCOs do not react with O2, the T1 depleted forms, with full TNCs, do rapidly react with O2 to form PI. From spectroscopic experiments, two electrons are transferred from the TNC to O2 to form a peroxide bridged structure. The stabilization energies of possible PI structures of the TNC were evaluated.906 With a relatively small model, including only the three TNC Cu’s and their first coordination sphere (8 His and one T2 Cu OH), a side-on peroxy structure, bridging the two T3 Cu’s was found (Figure 152A, left). This is clearly inconsistent with reactivity- and spectroscopic results (vide supra). Therefore, an extended version, including a highly conserved aspartate residue (D94 in Fet3p, see Figure 165), was included in the model. A µ3- 1,1,2 peroxy structure was now found, with the peroxide bridging all three coppers, bidentate to T3β and monodentate to T2 and T3α (Figure 152A, right). Furthermore, calculated spin densities revealed that the T2 and T3β Cu were oxidized, and thereby responsible for the first two-electron reduction of dioxygen.
Figure 165.

Active site structure with residue numbering according to the Fet3p sequence. (Reprinted with permission from Ref. 907. Copyright 2010 American Chemical Society.)
Experimental studies, supporting these calculations, have been carried out, focusing primarily on variants of Fet3p, including first and second sphere residues of the TNC Cu’s. In one study, the conserved aspartate residue (D94) was mutated to Glu, Gln, and Asn, in the holo forms of the enzyme, as well as the T1D forms.888 All mutated varients were expressed and purified with intact TNCs, but only D94E/T1DD94E showed facile reactivity towards dioxygen. While no reactivity was observed upon reaction of reduced T1DD94A/N with O2, for T1DD94E, a peroxy intermediate with almost identical spectroscopic features to those of PI, was rapidly formed. This indicates that having a negatively charged residue in the vicinity of the T2 and T3β Cu’s is critical in the O2 reduction process of MCOs. Similar results were later presented for bilirubin oxidase variants.806
Experimental verification of the role of each of the Cu’s in the first two-electron transfer step, was obtained from a mutational study focusing on H126Q and H483Q variants of Fet3p (ligands to the T3α- and T3β Cu, respectively) (Figure 165).907 These two residues mirror each other in that they both connect to T2 Cu residues via a backbone N-H H-bond to C=O.733 The effect of the mutations was probed by XAS, CD, MCD, and EPR. Compared to the WT enzyme, small variations in energies and intensities were observed in the CD spectra of T1DH126Q and T1DH483Q, reflecting the change in electronic structure of the T3α- and T3β Cu. Furthermore, the observed changes in the EPR and MCD spectra, which selectively probe the paramagnetic mononuclear T2 Cu (vide supra), highlighted the above mentioned connectivity due to the H-bonding network in the vicinity of the TNC. Whereas only small perturbations were observed in the resting forms of the mutated enzymes, large structural changes of the reduced forms were observed in Cu K-edge XAS spectra. The 8984eV feature, probing the geometry of the reduced Cu’s, were observed to be more intense in the mutated enzymes compared to the WT. This is consistent with the mutated residues not being able to bind to their respective Cu’s in the reduced state, resulting in a close to linear geometry of the remaining ligated His residues. In comparing the reactivity of the reduced TNCs of T1DH126Q and T1DH483Q with that of WT T1D, only T1DH126Q was capable of facile reaction with dioxygen, as observed in the resulting absorption spectra in Figure 166. Importantly, in the CD spectra, which can resolve different components, the T1DH126Q O2-generated species is identical to PI (Figure 167). This verifies that the T3α Cu is reduced in PI, since the mutated H126Q clearly perturbs the T3α Cu in the resting form. Despite the similarities of the T3α- and T3β Cu’s of the TNC, it is evident that these Cu’s possess an inherent asymmetry with respect to reactivity; mutating His to Gln on T3α- and T3β Cu, respectively, results in similar spectroscopic perturbations. However, only mutation of a T3α residue (stabilized in a redox inactive form) still allows facile two-electron reduction of dioxygen.
Figure 166.

Absorption spectra of reduced T1D WT (red) T1DH126Q (blue), and T1DH483Q (green), immediately after exposure to O2. (Reprinted with permission from Ref. 907. Copyright 2010 American Chemical Society.)
Figure 167.

CD spectra of PI in T1D WT (red), T1DH126Q (blue) and band assignments (dotted). (Reprinted with permission from Ref. 907. Copyright 2010 American Chemical Society.)
A closer look at the environment of the two Cu ions provides insight into the origin of this asymmetry. The conserved aspartate (D94), is close to the reactive T2-T3β Cu edge of the TNC (Figure 165), thereby lowering the potential of these Cu’s.733,888 Secondly, from crystal structures of fully reduced MCOs and corresponding XAS Cu Kedge features of T2D Lc, Figure 162 (more intense 8984eV feature in deoxy-Lc compared to deoxy-Hc), it is observed that the T3α Cu is situated in the plane of the coordinating His-N’s, whereas the T3β Cu is held out of the plane by as much as 0.3Å.333 This further stabilizes the T3α Cu(I) relative to the T3β Cu(I) (verified by potentiometric redox titrations of T1DH126Q and T1DH483Q),907 thus deactivating T3α towards oxidation. This asymmetry leads to irreversible O2 binding and its activation for reductive cleavage of the O-O bond by the TNC.
3.7.1.5.4 Second two-electron step- cleavage of the O-O bond
The second two-electron transfer step in the reduction of O2 by the MCOs, involves cleavage of the O-O bond and formation of NI. As for the first two-electron step, insight into this step has been obtained from experimental as well as computational studies. On the experimental side, T1 inactive MCOs (primarily T1D in Fet3p and T1Hg in RvL) has been critical in evaluating the PI to NI conversion, due to the altered kinetic properties of the reaction. In a study from 1996, Shin et. al showed that T1Hg-generated PI slowly decayed, eventually regenerating the resting form of the enzyme.873 Monitoring the decay process by MCD established that PI decays via NI, before regenerating the resting form. This was significant because it allowed the study of the PI to NI conversion, which is not accessible in the holo enzyme, where this conversion is extremely fast and not rate limiting (vide supra). This study found a pH dependence of PI decay, with the decay rate at low pH being ~10 fold higher than at high pH. This was ascribed to protonation of a carboxylate residue in close vicinity to the TNC (vide infra). In a subsequent study, Palmer et. al investigated the Kinetic Isotope Effect (KIE) of 16O2/18O2 generated PI decay, and found a k16/k18 of 1.11, verifying that O-O bond cleavage is an integral part of this process.874 Furthermore, an inverse SKIE was observed at low pH, while no SKIE was observed at high pH, indicating that a proton assists in the O-O bond cleavage at low pH, but is not required at high pH. Finally, Palmer et. al evaluated the more than 106 decrease in rate of PI to NI conversion, observed in the redox inactive T1 enzyme compared to holo enzyme. By employing a model for dissociative electron transfer, developed by Saveant and coworkers,923 activation energies for one electron (T1 depleted enzyme) and two electron (holo enzyme) cleavage of the O-O bond were predicted at 8.5–12.5kcal/mol and 2–3kcal/mol, respectively, consistent with the difference in experimentally determined activation energies. This difference correlates to the redox potentials of the one and two electron reductions of peroxide, ~0.38 and ~1.37V,924 resulting in the Morse potential energy surfaces in Figure 168. The high driving force of the two-electron reduction results in a low activation barrier, in contrast to the one electron process.
Figure 168.

Morse Potential energy surfaces of reductive cleavage of peroxide in (A) 1e− and (B) 2e− processes. (Reprinted with permission from Ref. 874. Copyright 2001 American Chemical Society.)
To obtain further insight into the origin of the pH effect on PI decay, mutational studies on Fet3p were conducted, focusing on the two highly conserved carboxylate residues (D94 and E487, Figure 165) in the second coordination sphere of the TNC.889 D94E, E487D, and E487A type 1 depleted variants were generated and analyzed with respect to their PI decay rates at high and low pH, and their SKIEs. PI decay rates are shown in Figure 169 and summarized in Table 30. All variants, except for E487A, show accelerated PI decay rates at low pH. This unambiguously ascribes the low pH accelerating effect to E487. The position of this residue, close to the T3 binuclear Cu’s,733 indicates that this pH effect is connected to the formation of the µ2-OH bridge, which, as previously described, is an important feature of the NI structure. Secondly, the SKIE of PI decay shifts from inverse (~0.89) in the WT enzyme to normal (2.0) in E487D. By employing the Westheimer model,925 the extent of µ2-O-H bond formation in the transistion state of O-O bond cleavage can be evaluated. An inverse SKIE is indicative of a strong O-H bond being mostly formed in the transition state, whereas a normal SKIE indicates that the proton is further away from the product position.889 This is consistent with the shorter carboxylate side chain of Asp in E487D, compared to Glu in WT, being less efficient in proton transfer to the T3 bridging oxygen. This is also reflected in the decreased rate enhancement at low pH in E487D vs. WT (3-fold vs. 10-fold). Finally, from Figure 169 and Table 30, D94E has a normal SKIE at low pH, and the rate of decay is slower at all pH’s.889 In the WT T1D, changes in pH led to changes in the MCD spectrum. This was ascribed to perturbation of the T2 Cu OH ligand, induced by protonation of the D94 residue; a property of the aforementioned hydrogen bonding network in the vicinity of the T2 Cu. This connectivity is lost in the D94E variant, where no change in the MCD spectrum of the resting enzyme is observed upon changes in pH. The H-bonding network has a mechanistic role. In the WT enzyme, D94 is capable of removing a proton from the H2O ligand at the T2 Cu in PI. This results in increased electron density at the T2 Cu, thereby enhancing the electron transfer from this Cu to the bound peroxide. This enhancement is lost in the D94E variant, resulting in the significantly lowered decay rate, compared to the WT enzyme.
Figure 169.

PI decay rates as a function of pH of T1D WT (red), T1DD94E (blue), T1DE487D (green), and T1DE487A (black). (Reprinted with permission from Ref. 889. Copyright 2007 American Chemical Society.)
Table 30.
Decay rates and SKIE’s of T1D WT and variants in Fet3p
| T1D | T1DE487D | T1DE487A | T1DD94E | |
|---|---|---|---|---|
| rate of PI decay pH=5.0 |
1.8×10⁻³s−1 | (1.6±0.1)×10−4s−1 | (7.2±0.5)×10−5s−1 | (3.7±0.4)×10−4s−1 |
| rate of PI decay pH=7.5 |
2.9×10⁻⁴s−1 | (5.2±0.9)×10−5s−1 | (8±1)×10−5s−1 | (4±1)×10−5s−1 |
| rate enhancement | 6.2× | 3.1× | 1× | 8.0× |
| SKIE@low pH | 0.89 | 2.0 | ~1 | 2.3 |
| pH effect on resting T2 Cu | yes | Yes | yes | no |
We combine the above results into an overall model for the O-O bond cleavage step in native MCOs, as presented in Figure 170.906 The starting point (hypothetical), is a one electron reduced PI, PI`, where an electron has been transferred from the T1 Cu to the T2 Cu (vide infra), setting up a two electron reduced TNC capable of facile reduction of PI to NI. At low pH we assume that E487 is protonated, while D94 is deprotonated as required for reactivity (vide supra). The reaction coordinate towards the transition state involves proton transfer from E487, via a water molecule to the proximal oxygen atom of PI`, and a concerted deprotonation of the T2 Cu-bound water molecule via a H-bonded water molecule to D94. The combined effect of these proton rearrangements is to weaken the O-O bond of PI and decrease the redox potential of the T2 Cu, both of which will promote the O-O bond cleavage. At high pH, both of these proton transfer mechanisms are disrupted, resulting in the decreased reaction rate and less involvement of the µ2-O-H bond in the transition state, as reflected in the lack of a SKIE.889
Figure 170.

Model for proton assisted reductive cleavage of the O-O bond in PI. (Reprinted with permission from Ref. 889. Copyright 2007 American Chemical Society.)
The above spectroscopically defined structures of PI and NI, as well as the experimental kinetic and mechanistic insight, led to a computational evaluation of the energetics of O-O bond cleavage.906 The starting point of the reaction is ‘PI + e-‘ (Figure 171), where electron transfer from the T1 to the T2 Cu generates a structure with the T2-PI-O1 bond broken, and two TNC electrons available for reduction of PI to NI, at the T2 and T3α Cu’s. As shown in Figure 171, PI + e− to NI conversion involves O-O bond cleavage and protonation by E487 of the µ2-O2− bridge. Based on this, a pD potential energy surface plot was generated (Figure 172) where individual points on the grid correspond to varying O1-O2 and O2-H bond distances ranging from 1.45 and 1.85Å to 2.4 and 1.0Å, respectively. The 2D plot reveals a highly exothermic reaction. Two separate pathways can be identified, both with low activation barriers. Following the dashed line from PI + e− in the rear corner along the O-O bond cleavage coordinate leads to transition state 1 (TS1) (at ~1.70Å), with a low activation energy of ~5.9 kcal/mol, consistent with the experimentally estimated value. Subsequent proton transfer, results in NI formation with no additional activation barrier. Alternatively, following the H+-transfer coordinate leads to PI + e− + H+ formation, where the proton from E487 has been transferred to the T3 bridging oxygen, with no significant change in O1-O2 bond distance. Subsequent elongation of the O-O bond results in NI formation, via TS2, obtained at ~1.70Å, with a barrier of ~5.4kcal/mol relative to PI + e− + H+. It is interesting to note that no intermediate reaction pathway, with concurrent O-O elongation and O-H contraction, is observed in the 2D energy plot. This correlates well with experimental data, where the inverse SKIE observed at low pH is indicative of proton transfer before the transition state, resembling the PI + e− + H+ pathway, TS2, whereas a SKIE of 1, at high pH, is consistent with the PI + e− pathway, TS1, where proton transfer occurs after the transition state.889
Figure 171.

Schematic of calculated structures in reduction of PI to NI. (Reprinted with permission from Ref. 906. Copyright 2007 American Chemical Society.)
Figure 172.

2 Dimentional energy surface plots of proton assisted- and unassisted pathways, as well as intermediate pathways with concurrent elongation of the O-O bond and formation of the μ2-O-H bond. Proton unassisted pathway goes through TS1 and proton assisted pathway through TS2. (Reprinted with permission from Ref. 906. Copyright 2007 American Chemical Society.)
Geometry optimized structures of both pathways, highlight a molecular orbital picture of O-O bond cleavage, in MCOs, that leads to the low barriers at both high and low pH.906 First, evaluation of the spin densities of the TNC Cu’s (Figure 173) shows that the T3β Cu remains oxidized throughout the reaction, whereas the T2 and T3α Cu’s simultaneously gain spin density as the O-O bond is elongated, verifying that the reduction of PI occurs via a concerted two electron transfer mechanism. A closer look at the frontier molecular orbitals of the TNC involved in the O-O bond cleavage, shows how the site is optimized for facile electron transfer, due to significant overlap of the HOMO of the donors (T2/T3α), with the LUMO of the acceptor (peroxide σ*), Figure 174. The overlap is enhanced as the energy of the LUMO is lowered with O-O bond elongation, resulting in strong orbital mixing at the transition state. The energy lowering is also enhanced by interaction of the oxidized T3β Cu with the peroxide σ* orbital, thereby further lowering the barrier and defining a critical role for this Cu in the reductive cleavage of the O-O bond. These features emphasize the significance of the triangular topology of the TNC (Figure 174) in the reductive cleavage of the O-O bond resulting in an effective four electron transfer in the native enzyme.
Figure 173.

Calculated spin densities of the three trinuclear cluster Cu’s in the conversion of PI to NI with elongation of the O-O bond. (Reprinted with permission from Ref. 906. Copyright 2007 American Chemical Society.)
Figure 174.

Schematic of the FMOs involved in O-O bond cleavage by the TNC. HOMO’s on T2/T3α overlap with LUMO’s on O22−. The half occupied dx2-y2 helps stabilizing the energy of the LUMO’s. (Reprinted with permission from Ref. 906. Copyright 2007 American Chemical Society.)
3.7.1.5.5 Decay of NI to resting enzyme
The analysis of O-O bond cleavage, obtained from experimental as well as computational studies, concludes the description of the O2 reductive part of the catalytic cycle of MCOs. Now we address the decay of NI to the resting enzyme. This occurs in the dioxygen reaction of the fully reduced enzyme in the absence of an electron from a reducing substrate, see Figure 161. As for the PI to NI conversion, spectroscopically defined structures of NI and resting oxidized enzyme, provide the scaffold for computational evaluation of this process.900 This process includes two proton transfers and release of one water molecule from the TNC, with the second oxygen from O2 bound to the T2 in the resting form (Figure 175A). Two different starting structures of NI were evaluated, only differing in the protonation state of the T2 Cu bound water derived ligand (NIH2O and NIOH). These structures include both the µ3-oxo and the T3 µ2-OH bridge, as dictated by spectroscopy and computations (vide supra). The first step of NI decay involves protonation (from solvent) of either the µ3-O or the µ2-OH. Protonation of the µ3-O was found to be energetically favored by 17 and 25 kcal/mol for NIH2O and NIOH, respectively. Also, protonation of the µ2-OH results in loss of the bridging interaction, thereby generating a ferromagnetic structure, inconsistent with spectroscopic observations (vide supra). A second proton can then be transferred, either to the µ3-OH or to the µ2-OH. Both lead to the same result; protonative decoupling of the µ2-OH bridge, generating an isolated T3β Cu with a water molecule bound, with the T2 and T3α Cu’s still bridged via the µ-OH (Figure 175A). The T3β Cu-bound water molecule is subject to facile exchange with solvent water molecules, while the second oxygen atom of the original dioxygen remains bound to the T2 and T3α Cu’s of the TNC. The subsequent steps in the decay of NI, involve rearrangement of this oxygen from its position inside the cluster to outside the cluster, terminally at the T2 Cu, as suggested from 17O experiments911 (vide supra). As shown in Figure 175B, this rearrangement occurs via proton transfer from the T3β Cu-bound water molecule to the rotating OH−, allowing for regeneration of the µ2-OH bridge between the two T3 Cu’s. Transfer of this H2O from inside to outside the cluster has a significant activation barrier, with a lower limit of 8.5 kcal/mol, consistent with the experimental value of 8.8–13.9 kcal/mol,876 making this step rate determining in the conversion of NI to resting oxidized enzyme. As mentioned earlier, this process is too slow to be in the catalytic cycle and therefore NI reduction must be catalytically relevant.
Figure 175.

(A) Model for decay of NI to resting oxidized enzyme, including two H+ transfer steps and release of one water molecule. (B) Calculated relative energies of the last step in (A) for NIH2O (red) and NIOH (blue). (Reprinted with permission from Ref. 900, copyright 2007 National Academy of Sciences, USA.)
3.7.1.5.6 Reduction of NI
Recently, the first report of kinetics on the reduction of NI showed that the rate of intramolecular electron transfer from the T1 to the TNC is > 700 s−1, consistent with turnover.926 Additionally, and under identical conditions, the rate of intramolecular electron transfer from the T1 to the TNC in the reduction of the resting enzyme was found to be 0.11 s−1, consistent with the aforementioned slow kinetics in section 3.7.1.2.866 The reduction of the resting TNC also exhibits a deuterium solvent kinetic isotope effect, which implies that both the reduction of resting and NI are a proton coupled electron transfer (PCET) processes. Importantly, these results indicate that the reduction of the resting TNC that is observed crystallographically, is not in the catalytic cycle and establishes the reduction of NI as the relevant process in the rereduction of the MCOs.
This difference of more than three orders-of-magnitude in ET rate produces a unique opportunity to determine the molecular factors that control electron transfer rates in the MCOs.926 In Marcus Theory, these rates are dependent on the thermodynamic driving force, reorganization energy, and the electronic coupling matrix element between donor and acceptor.64 Calculations were performed on the reduction and protonation of these TNC active sites (resting and NI in Figure 176) to determine which of hese contributions account for the large rate difference. It was computed that the proton coupled electron transfer driving force was more favorable for NI than resting by 7 kcal/mol, while estimates of reorganization energy were comparable; since the T3a copper was reduced in both T1 to T3a ET processes, the electronic coupling matrix element (through the T1 Cys-His pathway) can be considered equivalent in both processes. Therefore, the kinetic difference originates from a more favorable driving force for proton-coupled electron transfer to the TNC of NI relevant to resting. On the basis of the structures (Figure 176), this is attributed to the µ3-oxo ligand of NI since this group is significantly more basic than the µ2-OH of the resting site.
Figure 176.

Experimentally determined structures of the trinuclear clustes in the Native Intermediate (left) and the resting state (right). (Reprinted with permission from Ref. 926 copyright 2013 American Chemical Society)
This new insight presents a unifying mechanism for both O2 reduction and enzyme rereduction since this µ3-oxo ligand originates from the reduction of O2 and the protonation of this group supplies the driving force for the rapid rereduction.926 Current studies focus on understanding the molecular mechanism of all the three ET steps in the reduction of NI to the fully reduced enzyme in the catalytic cycle.
3.7.2. Heme-copper respiratory oxidases
3.7.2.1. Enzymology
Heme-copper oxidases (HCOs), also referred to as heme-copper oxygen reductases, are a superfamily of membrane-bound enzymes that are located in the inner mitochondrial membrane of eukaryotes and in the cytoplasmic membrane of many prokaryotes. These catalyze the terminal step of respiration, the complete reduction of dioxygen to water. ~90–95% of all dioxygen is processed through HCO. During this process low energy electrons are removed from the respiratory chain. The overall dioxygen reduction is exergonic in nature. This reaction (O2 + 4H+ + 4e−→ 2H2O) at 815 mV versus NHE per e− coupled to the oxidation of the reducing agent (Fe2+-cytochrome c → Fe3+-cytochrome c + 1e− at 235 mV) provides an overall driving force of 580 mV per electron (13 kcal/mol). This driving force is used to pump protons across the cytoplasmic (or mitochondrial) membrane (~5 kcal/mol required per proton) from the negative to the positive side (Equation 37).
| [37] |
Thus, for every electron reduction of O2, two protons can be translocated. The resulting proton gradient is used by ATP synthase to convert ADP and inorganic phosphate to ATP. These dioxygen reduction, electron transfer and proton pumping functions performed by HCO are illustrated in Figure 177A.
Figure 177.

Schematic representation of subunit I/N showing the conserved redox centers common to all Heme-copper oxidases. A) Electrons are transferred to the binuclear heme-CuB site via the low-spin heme site (pink arrow). Proton transfer from the N-side of the membrane (grey arrow) leads to the heme a3/CuB binuclear site to produce H2O from reduced O2 (red arrows), and for pumping protons across the membrane (blue arrow). B) Dioxygen binding site in HCO (structure of the fully reduced bovine CcO Protein Data Bank number 1v55998).
In all HCO, the fast reduction of dioxygen to water takes place at a bimetallic heme-copper site (Figure 177B) without generating toxic partially reduced oxygen species. This site is uniquely designed to overcome the first, one electron reduction of dioxygen, which is uphill (−350 mV at pH 7.0 vs NHE). The copper center, known as CuB, is positioned ~4.3–.4 Å from the high-spin heme center depending on the exogenous ligation and oxidation states of the metals. The heme iron has a conserved axial histidine ligand. CuB is ligated to three histidines. Most HCO undergo a post-translational modification resulting in a covalent bond between one of the ligating histidines and a tyrosine residue. This cross-link is thought to be functionally relevant.
In addition to the bimetallic site, HCO contain between one to three other redox cofactors, which include a bimetallic CuA site and/or heme(s). These redox sites function in electron storage and transport from the external reductants to the heme-copper catalytic site. All HCO contain a second low-spin heme site (Figure 177A). In all HCO, this low-spin heme has two conserved axial histidines that are connected to the protein backbone. HCO may also contain a CuA center that can exist in an oxidized delocalized mixedvalent state.59 Each copper ion of CuA is bound to two bridging cysteines and one histidine. In addition, one copper has a weakly bound axial methionine whereas the other copper has an axial backbone carbonyl oxygen from a glutamate forming a long Cu-O ligand distance.
The HCO superfamily is quite diverse in terms of electron donors, heme types, and subunit composition leading to different electron and proton transfer channels. The HCO superfamily can be subdivided into three major functional and evolutionary families: A (containing subfamilies A1 and A2), B, and C (Figure 178).927 Mitochondria contain only type A1 oxidases, whereas prokaryotes contain all types of HCO. Among the prokaryotes, bacteria are known to contain all families of HCO, whereas archaea contain types A1 and B. Type C is observed only in two bacterial groups: 1) purple bacteria and 2) Flexibacter, Bacteroides and Cytophaga.927
Figure 178.

The minimal functional unit of Heme-copper Oxidases from the three families: types A, B and C.
The A and B HCO require in addition to the central subunit (I), at least one other subunit (II). The type C HCO contain a central subunit (N) and either one (O) or two (O, P) additional subunits that are completely different from type A and B subunits. HCO belonging to type A use at least two proton pathways (D- and K-channels), whereas type B and C HCO require only one (a modified K-channel). Type A is further divided into A1 and A2 subfamilies depending on the residues along the D-channel. The details of the proton pathways (channels) will be discussed later. The proton pumping stoichiometry is not 1 H+/e− for all families. Family A generally has a stoichiometry closer to 1 whereas families B and C have ~0.5 H+/e−. The lowered proton pumping stoichiometry in B and C families is energetically disadvantageous compared to the A family, requiring more O2 to be consumed to generate an equivalent membrane potential. Organisms encoding the B or C HCO have high apparent affinities for O2 and are usually expressed in organisms under low O2 or microaerobic conditions. It is not clear why nature would select for a less efficient enzyme in environments in which oxygen is limiting.
Nitric oxide reductases (NOR) have a close evolutionary link to HCO based on structural similarities. Subunit I in NOR is reminiscent of subunit I in HCO with the six histidines that bind the metal centers. The other subunit of NOR resembles subunit O (that contains a mono-heme) of the C type HCO (Figure 178). NOR’s, however, catalyze a different reaction—the reduction of NO to N2O. In addition, this enzyme has an Fe instead of CuB at the catalytic site. Also, there is no tyrosine crosslinked to a histidine of this non-heme iron center. Interestingly, type C cbb3 oxidase can also reduce NO to N2O. It is not surprising, therefore, that NOR’s have the closet homology with C type HCO.
In addition to the three families, the HCO can be further divided into two subgroups, cytochrome c oxidase (CcO or COX) and quinol oxidase (QO), depending on the source of the electrons required to reduce dioxygen. CcO, located in the mitochondrial membrane of all eukaryotes and in the cytoplasmic membrane of certain bacterial prokaryotes, use water soluble ferrocytochrome c as the source of electrons whereas QOs, present only in some bacterial and archaeal prokaryotes, use membrane soluble ubiquinol or menaquinol as their electron source. Ferrocytochrome c and ubiquinol are the most oxidizing electron carriers of the respiratory chain. CcO contain the mixed-valent CuA site that is not present in QO. CcO span across all three HCO families; QO is present in only type A1 and B families.
There are three types of heme sites present in HCO’s: heme a, heme b, and heme o (Figure 179). A subscript 3 denotes the O2-binding heme site whereas lower case letters denote protein-bound hemes. The high-spin heme can be a3, b3 or o3, whereas the low-spin heme can be either a or b. Heme a contains a formyl group in position 8 and a farnesyl tail of unsaturated isoprenoid groups in position 2, both of which are not present in heme b. Heme o has the same structure as heme a except for a methyl group in place of the formyl group.928 Only heme a is present in most mitochondrial CcO. Heme b has also been identified in submitochondrial particles. In bacteria, all three heme groups a, b and o can be present.929
Figure 179.

Structures of heme A, heme B and heme O. The numbering of the porphyrin carbons are demonstrated in heme A.
In addition to the structural subunits, a large number of accessory factors are involved in the assembly and maintenance of active HCO’s. Loss of function of some of these auxiliary proteins or mutations in the mitochondrially-encoded core subunits, although relatively rare, lead to CcO deficiency and are associated with a wide spectrum of clinical phenotypes ranging from isolated myopathy to multisystem disease. Most isolated CcO deficiencies are inherited as autosomal recessive disorders, which generally have a very early age of onset and a fatal outcome. Patients afflicted with these diseases present heterogeneous clinical phenotypes, including Leigh syndrome, hepatic failure and encephalomyopathy.
HCO’s are susceptible to inhibition by a variety of substrates including CO, sulfide (H2S), cyanide (HCN), azide and formate (HCOOH).930,931 Of these, H2S have been implicated in normal cellular signaling events because it can be readily metabolised by oxidative processes within CcO resulting in the enzyme acting as a physiological detoxifier of sulfide. Inhibition of CcO can also lead to toxic effects. Inhibition by cyanide and sulfide leads to acute respiratory failure, whereas with azide poisoning, the proximal cause of death is suggested to be circulatory collapse. CO is known to competitively bind to the reduced cytochrome a3 and prevent its oxidation by oxygen; azide and formate un-competitively bind to the oxidized forms and prevent the reduction of this group; cyanide and sulfide produce non-competitive inhibition towards oxygen. The five inhibitors all compete for the same or different oxidized forms of the enzyme, which are reversibly connected.
The endogenous production of NO in cells is also known to inhibit CcO activity.932 Low concentrations of NO for a short period of time has been proposed to be involved in the physiological and/or pathological regulation of respiration rate by extending the availability of O2 either to cells at different distances from capillaries or within the mitochondrion. Higher NO levels and prolonged exposure, or conversion of NO to one of its more reactive oxides (peroxynitrite, nitrogen dioxide or nitrosothiols) results in the irreversible inhibition of respiration and other damage to mitochondria. It is known that NO inhibition of mitochondrial respiration has a role in cell death, by either necrotic or apoptotic mechanisms.
Two alternative pathways have been identified for the reaction of NO with CcO that depend on the rate of electron flux through the respiratory chain.932 At high electron reflux (i.e. high ferrocytochrome c concentrations), NO undergoes heme binding at the binuclear center in competition with O2, whereas at low electron reflux, NO binds to oxidized CuB. Both pathways lead to effective, fully reversible inhibition of respiration and can be discriminated on the basis of the differential photosensitivity of the inhibited state. The oxygen sensitive NO binding to the reduced heme Fe to form a six-coordinated structure causes immediate inhibition of O2 consumption and the formation of a light-sensitive nitrosyl derivative (Fe2+-NO). The inhibition of O2 consumption is greater at lower O2 levels. The process is reversed when the NO is dissociated as a free, reactive radical. This pathway has been proposed to function both in regulating the formation of hydrogen peroxide from the respiratory chain and in signal transduction and controlling O2 gradients in complex organs such as the liver or heart. Maladaptation in this pathway, in the presence of normal or enhanced levels of O2, leads to a mitochondrial dysfunction that has some of the characteristics of hypoxia, including a deficit in ATP. NO binding to the oxidized CuB site of resting CcO, and to the CuB site of intermediates P, F and O formed during turnover (see section 3.7.2.2.3) yields a light-insensitive Cu(I) nitrosonium (NO+) complex. This Cu(I) nitrosonium can be oxidized to give nitrite, which can in turn inhibit the oxidase. The oxidase then recovers activity upon reduction, releasing nitrite into the bulk. Therefore, of relevance to cell pathophysiology, this pathway involving the oxidative degradation mechanism, disposes toxic NO in the form of less toxc nitrite.
3.7.2.2. Kinetics and Thermodynamics
3.7.2.2.1 Resting versus pulsed
The as-isolated, fully oxidized CcO has been shown to be different from the fully oxidized species formed after the four electron oxidation of the fully reduced enzyme.933–935 These species are commonly referred to as the resting and the pulsed forms, respectively. The interconversion between pulsed and resting forms at low pH (pH<8) is fairly slow.933,935 Armstrong and colleagues have shown that the pulsed form is converted to the resting enzyme within ~3 hrs at pH 7.2 (half-life of 40 min at 2 °C).935 Complete reduction of the resting form followed by complete oxidation produces the pulsed form. O2 is physiologically involved but not necessary for the production of the pulsed state. The reduction potential of cytochrome a3 in the resting enzyme is lower than that of the more physiologically relevant pulsed enzyme with the rate of intramolecular reduction of a3 being significantly faster in the latter.934 The initial velocity for the steady-state reaction at pH 7.4, starting from the pulsed form is 4 to 5 fold faster than with the resting form with roughly stoichiometric additions of CcO and reduced Cyt c.933 Thus, the pulsed enzyme reaches steady state turnover sooner than the resting enzyme (pH 7.4).936 When Cyt c is in excess, the two forms proceed with roughly the same overall velocity.933 These observations are consistent with the model that the resting enzyme is not an intermediate in catalysis but is transformed into an active species after being fully reduced in the presence of O2. Thus, the pulsed enzyme is the catalytically competent form that slowly decays to the resting form in the absence of additional reducing equivalents.
3.7.2.2.2 Slow versus fast
The resting form was originally taken to be the enzyme as-isolated. The as-isolated form can be inhomogeneous and contain a mixture of a fast and a slow form.937 Some authors have equated the resting form only with the slow form.937,938 The fast and slow forms are defined according to their rate of reaction with exogenous anionic ligands such as cyanide (CN−), fluoride (F−), and formate (HCOO−).939 Alternately, the resting form has also been equated to the chloride-ligated fast form, which binds cyanide at a rate slower than the fast form but faster than the slow form. The term resting has thus become ambiguous. A fast form predominates when the enzyme is isolated under mildly alkaline conditions, whereas a slow form dominates in preparations at low pH. The fast form can be converted to the slow form upon incubation at low pH (pH <8) or with prolonged dilution of the enzyme.940 The reversal of the process is controversial. The slow form of bovine CcO exhibits a weak derivative shaped EPR signal with a g' = 12 in X-band that is not observed for the fast form,938,941 the difference arising from different magnetic interactions between the CuB and heme a3 (the precise nature of the spin coupling in each case is not known). The slow form with the g' =12 EPR signal was not observed in the mitochondrial membrane and is suggested to have been produced as a consequence of one or more of the manipulations employed during purification. The slow form is, thus, considered an artifact of purification and not physiologically relevant. Spectroscopic properties of the fast and pulsed forms are very similar, which result in some authors incorrectly equating the two to be the same species.937 However, the pulsed form is metastable whereas the fast form is stable.942 The two forms also have different rates of reduction (discussed below). The metal ion ligation and coordination geometries of the fast and slow forms are not known. It appears that enzyme X-ray structural studies have not yet revealed differences between the two forms because all the crystal structures seem to be of the fast form (crystallographic studies, that do not explicitly mention whether they have a fast form, used enzyme purified at slightly alkaline conditions, which would suggest a fast form). Therefore, it is important to identify which form of the as-isolated enzyme, fast or slow, is present in a reaction, especially when dealing with single turnover kinetics. However, neither of these forms is the catalytically competent fully oxidized form that is the pulsed enzyme.
3.7.2.2.3 Single turnover kinetics
The catalytic cycle of HCO consists of two phases (Figure 180)—an oxidative phase where the reduced enzyme undergoes 4e− oxidation by O2, and a reductive phase where the oxidized enzyme is reduced before it can bind the next O2 molecule. Two protons are translocated during the oxidative phase while two more protons are translocated during the reductive phase.
Figure 180.

Catalytic cycle of Heme-copper Oxidases. Species entering and leaving the binuclear site (heme a3/CuB) are shown. Proton translocation/pumping is not shown here.
The four electron reduction of dioxygen has been extensively studied in two forms of CcO—the fully reduced (R or R4) enzyme and the two electron reduced mixedvalence (MV or R2) enzyme. The MV enzyme is formed by incubating the fully oxidized CcO with CO. The CO reduces the CuB and heme a3 sites of the enzyme by two electrons and binds to the binuclear site.943 Dioxygen reduction has also been studied in the three electron reduced (R3) enzyme, which is obtained by titrating the MV form with one electron equivalent of a reductant (such as TMPD, ascorbate, cytochrome c944 or NADH945). In the MV+e form, heme a and CuA are partially reduced and in an intramolecular redox equilibrium. Kinetic rates of the intermediate states formed in single turnover of the enzyme with O2 have been studied by flow-flash photolysis of the bound CO in the presence of O2 by a variety of biochemical and spectroscopic methods including Abs, rR and EPR.
Several kinetic intermediates have been resolved for the reaction of fully reduced, R-CcO with O2. Transient absorption spectroscopy in the visible region (830 nm) suggests that O2 first binds to the CuB site in the binuclear center with a rate constant of 108 M−1s−1.939,946,947 The O2 then weakly binds to heme a3 with KD of ~0.3 mM, forming intermediate A (Figure 181) with a pseudo-first-order microscopic rate constant, k1 = 1.2×10⁵ s−1 at [O2] = 625 µM.948
Figure 181.

Proposed mechanism for the reaction of fully reduced CcO with O2. Curved arrows represent species entering or leaving the binuclear site. Two additional electrons are needed to generate the fully reduced site, R, from OH, not shown here. Block arrows represent proton pumping. The references for the kinetic constants are given in the text.
When the CuA and heme a sites are reduced, as in R-CcO, intermediate A converts to PR with an electron transfer from heme a to the binuclear center with a rate constant k2 of 1–3×10⁴ s−1 (Figure 181).948–951 The formation of PR is independent of pH in the range 6.5–9.0, with no proton uptake. Nevertheless, the rate is slowed in D2O (kH/kD of 1.4–1.9), which suggests that transfer of an internal proton or hydrogen atom is involved in the rate-limiting step of PR formation.951
The decay of PR to form F is the first step that shows a pH dependence with lower rates observed at higher pH values with a pKa of 7.9 and kH/kD of 1.4 at pH 7.4. This suggests that a proton is taken up during this kinetic phase with a rate constant k3 of ~1×10⁴ s−1 (time constant τ = 80 µs) resulting in the formation of F.949,952 It appears likely that a proton is taken up by the tyrosinate covalently crosslinked to the histidine ligand of CuB, rather than by CuB2+-OH based on the higher pKa of the former.
The reaction proceeds via a fast electron transfer between CuA and cytochrome a with an apparent lifetime of F of ~50 µs (rate constant of 2×10⁴ s−1),953,954 to form intermediate F′. Earlier work by Gray and coworkers estimated a shorter lifetime for intermediate F of 1.2–25 µs.955 The equilibrium constant, K1, for the F↔F′ conversion is close to 2.948 A tryptophan residue (Trp272 for P. denitrificans) has also been suggested by de Vries and colleagues as an electron donor to the binuclear center after the formation of F to form FW* with a rate constant of ~8×10² s−1.956
The final intermediate is formed with the transfer of the second electron from the CuA/heme a site leading to the formation of OH (the pulsed form of the HCO discussed above) with k4 of ~6–9×10² s−1 (τ = 1.2 ms).949,954 The formation of OH is pH dependent, slower at higher pH, with a kH/kD of 2.5 measured at pH 7.4952 and is rate-limited by proton uptake. The transmembrane voltage generated is biphasic with rate constants of ~830 s−1 (coincident with electron transfer coupled to proton transfer) and 220 s−1 (associated with proton transfer) with relative amplitudes of 1:3.954 The second electron transfer to the binuclear center, thus, completes the oxidative phase of the enzyme in Figure 181. The OH intermediate can then be re-reduced to form R with the injection of four electrons from cytochrome c that is coupled to the uptake of four additional protons (two chemical and two pumped protons) as discussed in below.957
The overall proton pumping for the oxidative phase of the cycle starting from the fully reduced R state to OH has been measured by Hallén et al. at pH 7–8. They report that 2.6 protons were released on oxidation of the fully reduced CcO.952 Mitchell found a similar number of 2.4 protons in the pH range of 7.5–8.5, which is in reasonable agreement.958 0.4 of these protons have been associated with heme a/CuA, and the remaining two with the binuclear center. This proton pumping observed is now known to be coupled to the PR→F and F→OH steps.
Starting from the MV form of CcO (as well as the three electron reduced form), the fast O2 binding to CuB is again observed with a similar rate constant (108 M−1s−1) as with R (or R4). The O2 then proceeds to bind to heme a3 forming intermediate A. The amplitude of this phase has been shown to decrease with a decrease in the initial degree of reduction of CcO (R4 to R3 to R2/MV).946
Intermediate A decays to PM (in MV-CcO) with k`2 ~5×10³ s−1 where the O-O bond has been cleaved (Figure 182).959 The formation of PM is ~5–6 times slower than the formation of PR (formed from R4). Intermediate PM has been the subject of extensive controversy. Only three of the four electrons required to cleave the O-O bond are readily available in the binuclear site. In MV-CcO the source of the fourth electron has been suggested to be the tyrosine crosslinked to the CuB imidazole ligand or a highly conserved tryptophan residue that π-stacks with one of the CuB histidine ligands.959 Palmer and coworkers have provided arguments against the porphyrin ring of heme a3 being a potential electron donor.960 With MV-CcO, the reaction stops at PM that is found to decay with a rate constant of 1.5×10² s−1. No pH dependence is detected in any of the phases with MV-CcO.949 A kinetic isotope effect (kH/kD of 1.4–1.8) is observed during the A→PM conversion, which is similar to that observed in the formation of PR.951
Figure 182.
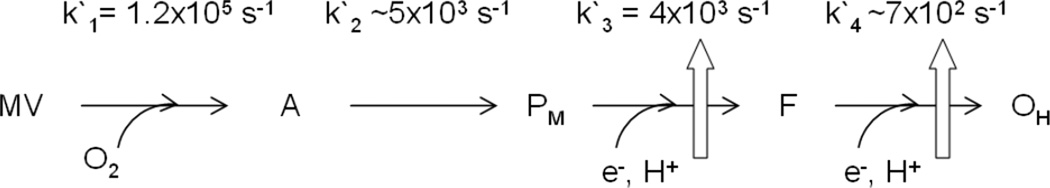
Proposed mechanism for the reaction of mixed valence CcO with O2. PM to F and OH are observed after injection of external electrons into CcO. Block arrows represent proton pumping. The references for the kinetic constants are given in the text.
For the fully reduced (R4) and three electron reduced (R3) forms of the enzyme, it is possible that the PM state also forms but is not observed because it is rapidly converted to PR. The rate constant for the conversion of PM to PR is then required to be significantly faster (half-life of 1 ns) than the rate constant for the formation of PM (half-life of 32 µs).956
Single electron reduction of the PM state (formed from MV-CcO) has been studied by laser-flash excitation of a ruthenium complex (e.g. tris(2,2'-bipyridyl)ruthenium(II)), which is a photo-activatable electron donor. The PM→F transition occurs upon rapid electron transfer from heme a to the binuclear center (presumably to the Y244 radical) with a time constant of 0.3 ms (rate constant of 4000 s−1).961 This electron delivery is coincident with the generation of a transmembrane voltage, which is triphasic with time constants of 0.3 ms, 1.3 ms, and 7 ms (rate constants 3300 s−1, 770 s−1, and 140 s−1, respectively). The relative amplitudes are 1:1.3.961 Hence, a portion of the voltage generation is coincident with electron transfer, while the rest of the charge transfer across the membrane occurs after the ET step. A charge movement from heme a to the binuclear site is parallel to the plane of the membrane and will, therefore, not directly result in the generation of a transmembrane voltage. It is proposed that electron transfer is accompanied by the transfer of a proton from residue E242 at the gate site (to be discussed in section 3.7.2.3.) to the active site (a chemical proton, vide infra) along with reprotonation of E242 during the 0.3 ms phase. In the slower 1.3 ms phase, it is proposed that a second proton is transferred from E242 to the proton loading site or translocated to the P-side of the membrane followed by a rapid second protonation of E242.
The PM→F conversion is significantly slower than the PR→F conversion in the fully reduced enzyme (0.3 ms for PM, ~80 µs for PR). The PR→F conversion has been assigned to a monophasic proton uptake.961 The final F state formed is identical in both cases. In the three electron reduced form of the enzyme, the PR→F conversion is also observed but to a lower extent.946
A second single electron transfer (by flash photolysis of tris(2,2'-bipyridyl)ruthenium(II)) from heme a to the binuclear site results in an F→OH conversion with a similar rate constant as seen for the fully reduced CcO.961 This electron transfer step (1.5 ms [~7×10² s−1]) is 4–5 fold slower than the electron transfer in the PM→F transition (0.3 ms). Associated with the F→OH transition there is an electrogenic proton transfer that occurs in two phases with time constants of 1.2 ms and 4.5 ms. The first protonic phase corresponds roughly to the electron transfer to the binuclear site (1.5 ms). The ratio of the amplitudes of the two phases is 1:1.2, which is close to the value for the PM→F transition.961
The second half of the catalytic cycle after the four electron oxidation of CcO by O2 is the four electron reduction of the fully oxidized enzyme OH. The OH, which is the pulsed form described above, formed at the end of the oxidative part of the catalytic cycle is metastable and decays to the resting form of the oxidized enzyme. Bloch et al estimated the lifetime of the OH state to be at least ~30 s at room temperature and at pH 8.0 for P. denitrificans to decay to the fast form.962 The reduction of the oxidized enzyme in the OH/pulsed form is different compared to the non-pulsed, fast form. Reduction of OH, but not of the resting form of the enzyme, leads to two successive proton-pumping events (Figure 183).
Figure 183.

Proposed reaction scheme showing the two possible pathways for the reduction of the oxidized pulsed form of the binuclear center in CcO. Block arrows represent proton pumping that is absent when OH decays to O and gets reduced.
Proton pumping has been best documented for PM→F and F→OH transitions as described above, where a large part of coupled proton transfer occurs after electron transfer is complete. The proton pumping process observed during the OH→EH and EH→MV steps (Figure 183) are less clear because the reduction kinetics depend on the way the oxidized enzyme was prepared. Only the OH/pulsed form pumps a proton coupled to electron transfer to the binuclear site.
Brand et al has demonstrated that photoinjection of an electron into the OH form of bovine CcO, results in rapid reduction of heme a (ET from CuA to heme a in bovine OH has a rate constant of 2×10⁴ s−1), followed by biphasic electron transfer from heme a to the binuclear center with rate constants of 750 s−1 and 110 s−1 (time constants of 1.3 ms and 9 ms, respectively), with relative amplitudes of 25% and 75%.954 The heme a and CuA are 63% reoxidized. It is proposed that the first phase of electron transfer is coupled to proton translocation while the second phase of electron transfer is coupled to the uptake of a chemical proton. The midpoint potential of CuB is significantly more positive in the OH state compared to the resting, fast form of the enzyme. The one electron injection results in the electron residing mostly on CuB. In contrast, when OH is allowed to decay to the fast, resting form, O (Figure 183), one electron injection leads to form E (Figure 183) by monophasic reoxidation of heme a with a slower rate constant of 90 s−1, with only 30% of heme a/CuA being reoxidized. In addition, no proton pumping is observed. Thus, there is a significant difference between the kinetics of the pulsed and fast resting forms of the bovine enzyme. It should be noted that in a separate study, Jancura et al observed no difference in the kinetic properties of the pulsed versus the fast oxidized bovine CcO.963 In addition, they saw a monophasic electron transfer from heme a to the binuclear center with a rate constant of 80 s−1 without the small fast phase at 750 s−1. The reason for the difference is not clear.
When the bacterial CcO’s from P. denitrificans and R. sphaeroides are used instead of bovine CcO, only a monophasic electron transfer from heme a to the binuclear center is observed during the OH→EH transition with rate constants of 3000 s−1 and 760 s−1 , respectively.954 The heme a reoxidation was only ~25% in both cases. The non-pulsed, fast resting form of these bacterial enzymes gave similar rate constants as their pulsed counterparts for the OH→EH transition.954 Belevich et al found a biphasic reduction of heme a during the OH→EH transition (rate constants of 6700 s−1 and 1250 s−1, with equal amplitudes) with bacterial P. denitrificans.964 The reason for the difference is not known. Ruitenberg et al found time constants of ~20 µs (50,000 s−1) associated with the reduction of heme a and a single slower phase of 175 µs (6000 s−1).965 The slower phase is deuterium sensitive with kH/kD of ~2 that is assigned to the uptake of a proton. They also provide evidence that this proton uptake occurs via the K pathway and not the D pathway (vide infra). A remaining question is whether electron transfer from CuA to heme a or the subsequent reduction of the binuclear center leads to proton uptake. The study by Ruitenberg et al on P. denitrificans suggests the former.965 Thus, there is some discrepancy about the exact electron transfer rates during the OH→EH transition and its coupling to proton uptake. In addition, the difference in rates between the pulsed (OH) and the non-pulsed fast (O) form of CcO is controversial. What is known is that only the pulsed form pumps a proton coupled to electron transfer. Further studies are needed to elucidate the structural basis for the functional difference observed between the two oxidized forms.
The one-electron reduction of state EH was studied by a stopped-flow flash technique. Single electron injection from a reduced ruthenium dimer results in biphasic electron transfer from heme a to heme a3 to form the MV state (Figure 183) with rate constants of 1100 s−1 and 90 s−1, and relative amplitudes of 11% and 89%.966 The second electron reduction of the binuclear site is also coupled to the uptake of one chemical proton and one pumped proton. This proton translocation is also not observed with the non-pulsed O enzyme (Figure 183). The two electron reduced MV form can then react with O2 to form PM (Figure 182).
Ruitenberg et al generated EH by chemical treatment. First, F was generated by adding excess H2O2 to O.967 After removing the excess H2O2, CO was added to reduce F by two electrons to generate state EH. Injection of a single electron to EH by laser-flash of a bound ruthenium complex, generated a membrane potential that had three phases: τ ~27 µs (40,000 s−1), ~0.2 ms (~5000 s−1), and ~1.5 ms (~700 s−1), with relative amplitudes of 0.26:0.25:0.49. The fast phase corresponds to electron transfer to heme a, the intermediate phase corresponds to the uptake of a charge-compensating proton, while the slow phase has been identified as pumping one proton across the membrane.967 There is also evidence that the charge-compensating proton is taken up via the K-pathway while the pumped proton is taken up via the D-pathway (discussed in section 3.7.2.3).
3.7.2.2.4 Thermodyanmics
Study of the thermodynamic properties of the different redox sites provides important information about the level of reduction of each site during steady-state turnover (considered below). This is challenging because the redox properties of the four metal sites in CcO interact with each other anticooperatively and do not exhibit the same redox potentials as the isolated sites. The Cyt a and a3, in particular, are influenced by more than one inter-site interaction.968 Spectroelectrochemical studies monitoring changes in absorbance, MCD and EPR features with changing potential have been commonly used to estimate the extents of reduction of Cyt c, a and a3, and CuA. CuB potentials have been more challenging to study because they cannot be monitored optically and thus, these potentials have been obtained indirectly by their effect on the absorption of hemes with changing amounts of charge injected.969 More recently, ATRFTIR has also been used to study the redox properties of all metal sites.970
Dutton and others have shown that the midpoint reduction potential (Em) of Cyt c is 235 mV at pH 7.2 when bound to phospholipid vesicles, inside mitochondria or in submitochondrial particles and increases to 283 mV when isolated and solubilized (Table 31).971,972 Thus, Cyt c binding inside beef heart submitochondrial particles was found to lower the Em by as much as 60 mV.971 Lindsay et al estimated the mean midpoint potential of CuB to be 340 ± 10 mV independent of pH (Table 31).973 Contrary to this alternatively, Mitchell et al reported that the potential of CuB has a pH dependence approaching −60 mV/pH.958 A pH dependence of −52 mV/pH was observed in the alkaline region with a midpoint redox potential of 366 mV at pH 8.0.970 Potentiometric titrations of the isolated CcO with Cyt c present by Tiesjema et al showed that the CuA, heme a and a3 sites titrate as single-electron acceptors with midpoint potentials of 280 mV, 230 mV and 370 mV, respectively, at pH 7.1 (Table 31).974 Dutton and others have reported that the hemes of CcO in intact mitochondria and in isolated CcO titrate with similar Em values (195–220 mV for heme a and 340–390 mV for a3 at pH 7.2) (Table 31).969,971,975–977 Note that these potentiometrically separable Em values of Cyt a and a3 may be influenced by heme-heme interactions.
Table 31.
Midpoint Potentials of Cyt c and the Metal Sites of CcO (Em values in mV).
| Cyt c | CuA | heme a | heme a3 | CuB | Ref | |
|---|---|---|---|---|---|---|
| Isolated | 283 | 971 | ||||
| In mitochondria | 235 | 205 | 390′ | 971 | ||
| Sub-mitochondria | 235 | 205 | 365′ | 971 | ||
| Sub-mitochondria | 340 | 973 | ||||
| In mitochondria | 195 | 975 | ||||
| In mitochondria | 220 | 380′ | 976 | |||
| Isolated, Cyt c present | 280 | 230 | 370′ | 974 | ||
| Isolated, Cyt c present | 210 | 340–350′ | 977 | |||
| Isolated, TMPD present | 215 | 340′ | 969 | |||
| In mitochondria | high 362, low 238* | 978 | ||||
When both heme sites are oxidized the Em values of Cyt a and a3 are similar (362 mV). Reduction of one heme lowers the Em of the other to 238 mV.978 ′ Assuming heme a3 gets reduced before heme a.
Higher levels of heme a reduction were obtained in studies using detergent-solubilized CcOs.979 Detergents, such as Triton give relatively slow enzyme turnover rates that lead to higher heme a redox potentials and result in a higher steady-state reduction of heme a compared to a3. In such cases, heme a appears to be approximately in equilibrium with Cyt c with an Em of 305 mV for pulsed CcO.975
Alternatively, stoichiometric reductive titrations performed in the absence of exogenous ligands under anaerobic conditions revealed that Cyt a and a3 are reduced to approximately the same extent at all points in the titration starting with the fully oxidized enzyme.980 Thus both hemes have similar redox potentials when both hemes are oxidized. EPR data of the half-reduced CcO (isolated CcO and submitochondrial particles) show two forms of high-spin ferric hemes with a ~1:1 ratio. These signals appears with a half-reduction potential of about 380 mV in anaerobic redox. This behavior agrees well with the appearance of the high potential component in optical titrations. The data have been interpreted in terms of an equilibrating 1:1 mixture of a3+a32+:a2+a33+ (Keq = a3+a3 2+/a2+a33+ = 1). The reduction of CuA initially lags the reduction of the two hemes but in the final stages of the titration is completely reduced prior to either heme a or a3. This indicates that reduction of one of the hemes lowers the redox potential of the second heme making the second heme harder to reduce, hence the buildup of reduced CuA.978,980 Further reduction of hemes take place with Em of ~220 mV. From these apparent Em values of 380 mV and 220 mV and the Keq of 1, the true Em values of heme a and a3 are calculated to initially be quite positive and similar (362 mV). Reduction of one of the hemes, decreases the redox of the other by ~124 mV to be 238 mV (Table 31).978
In addition to heme a-a3 interaction, heme a participates in anticooperative thermodynamic interactions which involve the two Cu sites.968 Spectroelectrochemical studies show that the interaction manifested at heme a is about 110 mV. The interaction between heme a and CuA is roughly 20–40 mV in CO adducts of the oxidase where heme a3 and CuB are stabilized in the reduced form.981 Thus, interaction between CuA, and heme a, causes the reduction potential for one of these sites to be decreased by approximately 40 mV upon reduction of the other.981 Studies with cyanide inhibited CcO, with heme a3 stabilized in the oxidized form, show 10–45 mV interaction between heme a and CuB. The remaining interaction manifested at heme a is from heme a3. The interaction evident at heme a3 is about 70 mV and involves the CuB and heme a sites.
The redox potential of heme a is only moderately dependent upon pH (less than - 30 mV/pH unit) when all other sites are oxidized.968 A 30 mV decrease with an increase of one pH unit implies that the reduction of heme a is linked to the uptake, on the average, of only about 0.5 protons at pH 7.0, and significantly less at the higher pH values relevant to the mitochondrial matrix. These values are similar when the enzyme is inhibited with cyanide where heme a3 is oxidized. When the other redox sites are reduced, the pH dependence is weak (less than −10 mV/pH unit, on average). This is similar to the value obtained with the CO-adduct where heme a3 and CuB are reduced. The thermodynamic properties of heme a3 decreased steeply with increasing pH (about - 56 mV/pH unit), indicating stoichiometric (1 H+/e−) coupling of protonation to reduction.978 The pH dependence of the heme a and a3 sites have important implications on the mechanism of proton pumping that will be discussed later.
3.7.2.2.5 Steady-state turnover
In turnover kinetic measurements, a reducing agent such as ascorbate or N,N,N’,N’-tetramethyl-1,4-phenylenediamine (TMPD) is commonly added to the reaction mixture containing reduced Cyt c and oxidized CcO in the presence of O2 to recycle oxidized Cyt c formed during reaction. The sequence of reduction is described by by the reaction sequence:
The general mechanism that is used to describe the kinetic data observed is given in Equation 38:
| [38] |
where, E is CcO, S is Cyt c2+, and P is Cyt c3+.982 The dissociation constants (KD = k−1/k1) for oxidized and reduced Cyt c from the enzyme are found to be roughly equal.983
The rate of enzyme turnover (Vmax) increases with the concentration of both the enzyme and Cyt c. At high enzyme concentrations, the overall activity is limited by the rate of re-reduction of Cyt c. The reaction between Cyt c2+ and CcO between pH 6.0–8.0 has an apparent first-order rate constant with respect to Cyt c. The KD (enzyme-substrate dissociation constant, Equation 38) calculated for the kinetics of the overall reaction was found to be 30 µM for isolated CcO and 30–40 µM for particulate CcO.984 Gibson and others found the reduction of CcO by Cyt c to be second-order giving a value for k1 of 106–7 M−1s−1 between pH 6.0–8.0.979,985 Using this value of k1, the values of k−1 and k2 for Equation 38 were found to be 1.2×10³ s−1 and 3×10² s−1, respectively.
Sinjorgo et al studied the steady-state reaction of detergent-solubilized CcO over a broad range of [Cyt c] (1–6 orders of magnitude in excess of [CcO]) at different pH values (pH 5.4–8.6) and ionic strengths (I = 25–200 mM).986 The concave Eadie-Hofstee plots obtained at low ionic strengths (I< 100 mM), pH 7.8 at 25 °C, were described by two reactions between Cyt c and CcO with apparent Km values of 40 µM (low-affinity reaction) and 40 nM (high-affinity reaction) with maximum velocities (Vmax) of 230 s−1 and 33 s−1, respectively. At high I (>100 mM), which is close to the physiological value, the Eadie-Hofstee plots were linear and reflect only one reaction (with Km = 20 µM and Vmax = 210 s−1 at I = 200 mM, pH 7.8). Both the values of Km and Vmax with excess Cyt c are sensitive to the enzyme concentration. Maximal turnover numbers along with the apparent Km were also affected by pH, with a decrease in both with increasing pH. With increasing ionic strength the apparent Km and Vmax values increased implying that the dissociation rate of Cyt c from CcO is enhanced. No optimum Km or Vmax is observed. These kinetic data are consistent with the presence of only one catalytic binding site for Cyt c with CcO.986
There are four ET steps relevant to the reduction of the O2 binding site summarized in Equation 39
| [39] |
Steady-state turnover experiments on intact mitochondria best capture physiological properties exhibited by the five redox sites in Cyt c and CcO. Andreasson and others have shown that the initial rate of electron transfer from Cyt c to CcO is ~1×10⁶–7 M−1s−1.983,985,987 The nature of the binding between Cyt c and CcO is unclear and may be ratelimiting. Heme c and CuA are found to be approximately in redox equilibrium in turnover (where ascorbate is employed as the reductant and TMPD as the redox mediator)975 while heme a remains relatively oxidized. The level of reduction of Cyt c and CuA do not increase linearly with enzyme turnover, whereas the reduction of heme a tracks the rate of enzyme turnover (k2 = 3×10² s−1, Equation 38). This suggests that the reduction of heme a is the rate-limiting step with a rate constant of about 2×10² s−1.975 The inherent ET from CuA to heme a in single turnover experiments is 2×10⁴ s−1. Therefore, the reduction of heme a is possibly rate-limited not by ET but by a structural change or a coupling to proton transfer during turnover.
The heme a ↔ heme a3 redox equilibrium constant is calculated to be roughly 4, with forward and reverse rate constants for electron transfer of kF = 2.4×10⁵ s−1 and kR = 6×10⁴ s−1.988 The equilibrium constant of electron transfer between the two hemes is pH-independent between pH 6.5–9.0.970 The forward rate constant (thought to be a lower limit of the true ET rate) is much faster than any observed process in the (flow-flash) reoxidation of the fully reduced enzyme by O2.946 Thus, electron transfer from heme a to the binuclear site cannot be significantly rate-determining during catalysis and heme a is not fully reduced during steady state turnover. This suggests that physiologically the enzyme reacts with O2 without reaching the fully reduced R4 state, has important implications regarding the O2 reduction mechanism and proton pumping.
3.7.2.3. Structure
A detailed description of the crystallography of the HCOs is given in this thematic issue by Yoshisawa et al. Here is presented a structural overview that enables correlation to electronic structure and mechanism in the next sections. To date X-ray crystallographic structures of HCO’s from six species have been determined (Table 32). The crystal structures along with amino acid sequence alignment studies show that there is close structural similarity among A and B family CcO’s from different organisms (mammalian versus bacterial) and between CcO and QO from these families. The eukaryotic enzyme is a dimer in its active form and is composed of seven (in Dictyostelium discoideum) to 13 (in mammals) subunits. The prokaryotic enzyme contains fewer subunits (generally 4 subunits). Subunits I-III (referred to as the core subunits) are present in most A and B type HCO’s. A CcO has been shown to be fully active with respect to O2 reduction to H2O and proton pumping with only subunits I and II, suggesting that these form the essential catalytic core. The type C HCO’s, comprising ~20% of all HCO’s, have very different amino acid sequence from types A and B. These contain two core subunits, N and O. In this section, we will present an overview of the structure of bovine heart CcO that has been most widely studied and where mutagenic studies have aided in elucidating electron and proton transfer pathways and compare and contrast this to the other classes of HCO’s.
Table 32.
X-ray crystallographic structures of HCO’s.
The overall structure of bovine heart CcO consists of 13 subunits (Figure 184A). There are four metal binding sites in bovine CcO. The binuclear center, heme a3 and CuB, and the third metal center, heme a, are in subunit I (yellow), whereas the fourth metal domain containing CuA is positioned in subunit II (green). The four metal sites and their ligation are shown in Figure 184B. CuB is ligated to three histidines (His240, His291 and His290). One of the histidines (His240) is covalently crosslinked at the epsilon nitrogen to a tyrosine residue (Tyr244). Heme a3 has an axial histidine ligand (His376). The second heme a site, where the Fe is low-spin, has two axial histidines (His61 and His378). Both the hemes are non-covalently bound to the protein. A similar binuclear center and a second low-spin Fe heme site are present in all HCO’s consisting of all the same coordinating ligands to the redox centers. The cytochrome c (substrate) docking site is located on the surface of subunit II relatively close to the CuA site. Each of the Cu sites in CuA is bound to one His and two Cys residues. In addition, one Cu is coordinated to one Met whereas the second Cu is ligated to the backbone carbonyl oxygen of a Glu residue. The overall CuA site is approximately symmetric with respect to its two His and the two Cys ligands. The two thiolate groups act as bridging ligands between the copper atoms. In place of CuA, cbb3 oxidase from P. stutzeri contains three heme c molecules each with two axial ligands—one His and one Met.
Figure 184.

Cytochrome c oxidase structure from bovine heart. (A) Overall structure where the 13 subunits are shown in different colors [subunit I (yellow), subunit II (green), subunit III (red), subunit IV (dark blue)]. (B) Expanded view of the redox active metal centers. CuA···Fea = 20.6 Å; CuA···Fea3 = 23.2 Å; Fea···Fea3 = 13.4 Å; CuB···Fea3 = 5.2 Å. Figure generated from PDB ID 2Y691006 coordinates using VMD.
The two hemes in bovine CcO are buried within the enzyme approximately 15 Å from the periplasmic surface. The hydroxyethylfarnesyl group of the high-spin heme is positioned into the lipid bilayer such that protons can enter the binuclear site from the cytoplasmic side of the membrane. The hydroxyehteylfarnesyl side chain of the low-spin heme points into a hydrophobic region that blocks access to the heme from the cytoplasm. In QO that contains a low-spin heme b, the space occupied by the hydroxyethylfarnesyl tail of heme a in CcO is filled with bulky hydrophobic residues.
3.7.2.3.1 Enzyme-substrate interactions
The HCO superfamily use two types of electron donating substrates—CcO uses a water soluble protein, cytochrome c, whereas QO use a membrane soluble ubiquinol as its electron donor. The binding of the substrate to HCO is thought to be due to the electrostatic interactions between the substrate and enzyme. There is still a lack of microscopic detail concerning these interactions and little is known about the orientation adopted by the substrate when it docks at the enzyme binding site and the number and identity of the intermolecular interactions formed.
The substrate docking site in bovine CcO is next to subunit II on top of subunit I (Figure 185, right). The acidic amino acid residues, Glu109, Asp119, Glu127, Asp139, Glu157, and Asp158 of subunit II (shown in green), in this region could interact with the basic cytochrome c, to stabilize the enzyme-substrate complex. Among these amino acids Glu109 and Asp139 are well conserved even in bacterial enzymes, suggesting a strong role in binding of cytochrome c.989 Residue Asp158 is thought to be the probable partner for cytochrome c Lys13.995 Site-directed mutagenesis of CcO isolated from Paracoccus dentirificans996 confirmed that a patch of negatively charged residues on subunit II are indeed critical for the catalytic activity of the enzyme. These studies detected two carboxylic residues (Glu246 and Asp206) corresponding to Glu198 and Asp158 respectively of subunit II of bovine CcO that are of particular significance. With regard to the substrate, cytochrome c, little is known about the identity of their electrostatic “partners” with the exception of Lys13.
Figure 185.

Structure of (left) ubiquinol oxidase from E. coli and (right) cytochrome c oxidase from P. denitrificans parallel to the membrane. Subunits I,II, III and IV are shown in yellow/green, green, blue and pink, respectively. Hemes b and o3 in subunit I are red and light blue, respectively. The blue spheres in subunits I and II are the CuB and CuA (two Cu atoms) centers, respectively. The dotted circle represents the location of the electron donating substrates—ubiquinol at the posterior of ubiquinol oxidase within the membrane and cytochrome c on the P-side of CcO. (Reprinted with permission from Macmillan Publishers Ltd: Nature Structural Biology Ref. 991, copyright 2000)
In contrast to the cytochrome c oxidases, subunit II of QO does not contain a substrate binding site. Instead, the membrane-spanning region of subunit I (Figure 185 left, yellow) contains a cluster of polar residues. Although a high degree of homology is observed between subunit I of CcO and QO, the sequence in this polar cluster is completely different. Mutation studies show Arg71 and Asp75 in the C-terminal half of helix I, and His98 and Gln101 in the N-terminal half of helix II (green), exposed to the interior of the lipid bilayer that is not present in the cytochrome c oxidase, form the quinone binding site.991 The presence of a second, lower affinity site in QO remains uncertain.
3.7.2.3.2 Active site
The crystal structure of CcO from bovine heart997 was determined in 1995 to a resolution of 2.8 Å and was later improved to 1.8 Å998. Yoshikawa et al also determined the structures of the bovine enzyme at different reduction states and with different ligands bound to the binuclear center.999 The binuclear center of bovine CcO, shown in Figure 177B, is located in subunit I and is 13 Å and 30 Å from the P- and N-sides, respectively. The epsilon nitrogen of His240 is covalently bonded to a tyrosine residue (Tyr244) at the ortho carbon of the ring as shown in Figure 177B. The CuA site is naturally present in CcO (except for in cbb3 from P. stutzeri) but not in QO (bo3 from E. coli). The CuA-heme a and CuA-heme a3 distances are 20.6 and 23.2 Å, respectively, when measured from the central point of the two copper atoms of the CuA to the iron atoms.997
3.7.2.3.3 Resting oxidized and reduced CcO
Crystal structures of resting oxidized CcO show a continuous electron density between the heme iron and CuB (Figure 186). There has been some controversy about the identity of this bridging species. Recent X-ray data have enabled interpretation of this density as a peroxide dianion (O22−) bridge between the two metals with a long O–O distance (1.7 Å).1000,1001 The CuB-O1 distance is 2.17 Å whereas the Heme a3 Fe-O2 distance is 2.24 Å.1000 Table 33 lists crystallographic parameters of all the oxidized and reduced bovine CcO characterized to date. The Cu···Fe distance in the oxidized enzyme is between 4.34–5.02 Å whereas in the reduced enzyme the distance increases to between 5.00–5.19 Å. No electron density is observed between the binuclear center in the reduced enzyme. Another notable change that occurs on reduction is a 4.5 Å movement of the carboxylic group of Asp 51 along with the segment from Gly49-Asn55 towards the cytosolic surface in bovine CcO.1002 Apart from these, no other significant changes are observed. In the case of CcO from R. sphaeroides, there is an additional redox change that is not apparent in bovine CcO. The O-O distance between the Y288-OH and the OH group of the heme a3 hydroxyl farnesyl tail decreases from 4.05 Å in the reduced state to 2.63 Å in the oxidized state (Figure 187. dotted [oxidized],1003 dashed [reduced])1004. The implications of this redox change to proton pumping will be discussed below.
Figure 186.

Resting oxidized structure of CcO. Left) Fo-Fc difference electron density maps calculated at 2.5 Å resolution. The datasets are depicted together with the structural model of heme a3 (red) and CuB (cyan). Right) Coordination geometries of the peroxide anion obtained from structural refinement calculated at 2.1 Å resolution. The interatomic distances are given in angstroms. Other distances and angles are Fea3-CuB = 4.87 Å; Nε2(H376)-Fea3-O1 = 168.5°; Fea3-O1-O2 = 144.1° and O1-O2-CuB = 90.5°. (Figure reprinted with permission from Ref. 1000.)
Table 33.
X-ray Crystallographic Structures of Bovine aa3 CcO.
| Redox State | PDB ID | Year | Resolution (Å) | Fe⋯Cu (Å) |
Ref |
|---|---|---|---|---|---|
| oxidized | 3ASN | 2011 | 3.00 | 4.67,4.69 | 1005 |
| oxidized | 3ASO | 2011 | 2.30 | 4.91–4.93 | 1005 |
| oxidized | 2Y69 | 2011 | 1.95 | 4.86–4.89 | 1006 |
| oxidized | 3ABL | 2009 | 2.10 | 4.83–4.87 | 1000 |
| oxidized | 3ABM | 2009 | 1.95 | 4.86–4.89 | 1000 |
| oxidized | 2ZXW | 2009 | 2.50 | 4.814.88 | 1000 |
| reduced | 2EIJ | 2007 | 1.90 | 5.12–5.16 | 1007 |
| reduced | 2EIK | 2007 | 2.10 | 5.11–5.12 | 1007 |
| oxidized | 2EIL | 2007 | 2.10 | 4.82–4.90 | 1007 |
| reduced | 2EIM | 2007 | 2.60 | 5.00–5.07 | 1007 |
| oxidized | 2EIN | 2007 | 2.70 | 4.34–4.60 | 1007 |
| oxidized | 2DYR | 2007 | 1.80 | 4.99 | 1008 |
| oxidized | 2DYS | 2007 | 2.20 | 4.59 | 1008 |
| oxidized | 1V54 | 2003 | 1.80 | 4.99–5.02 | 998 |
| reduced | 1V55 | 2003 | 1.90 | 5.13–5.16 | 998 |
| reduced | 1OCR | 1998 | 2.35 | 5.13–5.19 | 1002 |
| oxidized | 2OCC | 1998 | 2.30 | 4.85–4.86 | 1002 |
| oxidized | 1OCC | 1996 | 2.80 | 4.70 | 989 |
Figure 187.

Structural comparison of the active site and key residues involved in proton pumping between oxidized (PDB ID 2GSM1003) and reduced (PDB ID 2FYE1004) states of CcO from R. sphaeroides. Reduced (solid), oxidized (transparent).
X-ray crystallographic structures of several ligands bound to the binuclear active site have been solved.999,1000,1002 The main structural parameters are summarized in Table 34. These structures shed light into the possible motifs of O2 binding. Analyses of the fully reduced CO- and NO-bound CcO (with CO and NO bound to Fea3) reveal a close to linear coordination structure for CO (Fe-C-O angle is 164 degree) and a bent, end-on coordination structure for NO (Fe-N-O angle is 131 degree; Figure 188 A and C).999 After being photo-dissociated from Fea3, the X-ray structure of the CO derivative determined at 100 K indicates that CO is now bound to CuB in a side-on fashion (Figure 188 B). The Cu-C and Cu-O distances are 2.4 and 2.7 Å indicative of a weak CuB-CO bond. The 3.0 Å distance between CO and Fea3 suggests that no significant bonding interaction exists. The most dramatic change occurs upon binding cyanide to the binuclear center. The crystal structure of the fully reduced CN-bound form indicates that CN− is located roughly equidistant (2.3–2.4 Å) from Fea3 and CuB (Figure 188 D). Upon binding CN−, His290 is displaced and moves to a distance of 2.8 Å away from CuB.
Table 34.
X-ray Crystallographic Structures of Bovine aa3 CcO of the O2 Reduction Site in Different States.
| Distance (Å) | |||||||
|---|---|---|---|---|---|---|---|
| protein | PDB ID |
Resolution/Å |
Bridging Ligand |
Fea3-CuB | Fea3-X | CuB-Y | Ref |
| Fully oxidized | 2ZXW | 2.5 | O22− | 4.87 | 2.24 | 2.17 | 1000 |
| Fully reduced | 1OCR | 2.35 | 5.19 | 1002 | |||
| Fully oxidized Azide bound | 1OCO | 2.9 | N3− | 5.3 | 1.97 | 1.9 | 1002 |
| Fully reduced CO bound | 3AG1 | 2.2 | CO | 5.35 | 1.8 | 2.7 | 999 |
| Fully reduced CO bound | 3AG2 | 1.8 | CO | 4.97 | 3.0 | 2.4 | 999 |
| Fully reduced NO bound | 3AG3 | 1.8 | NO | 4.91 | 1.8 | 2.5 | 999 |
| Fully reduced CN-bound | 3AG4 | 2.05 | CN− | 4.99 | 2.4 | 2.3 | 999 |
Figure 188.

Schematic showing the crystallographic parameters of the (A, B) CO-, (C) NO-, and (D) CN−-bound forms of the binuclear center of fully reduced CcO. Adapted from reference 999
3.7.2.3.4 Electron transfer pathways
The crystal structures enable identification of possible electron transfer pathways between the metal active sites in CcO. The location of CuA is consistent with its role as the initial electron acceptor from cytochrome c. In aa3-type CcO’s from Paracoccus denitrificans, bovine heart, yeast, and Rhodobacter sphaeroides it is now generally accepted that electrons are transferred from cytochrome c to CuA and then from CuA to the low-spin heme a. The electron transfer pathway between cytochrome c and CcO is less well understood due to the absence of any enzyme-substrate crystal structure. The crystal structure of bovine heart CcO revealed two efficient, conserved possible electron transfer pathway between CuA and heme a.989 Pathway 1 through His204 via Arg438 to heme a, shown in Figure 189 blue, consists of 14 covalent and 2 hydrogen bonds (one short H bond at 1.87 Å and one longer H bond at 2.35 Å).1009 Pathway 2 (Cys200 to heme a), shown in Figure 189 green, involves a total of 17 covalent bonds and travels from Cys200 to Ile199, through a short 1.83 Å H-bond to Arg439, then through a 1.92 Å space jump to the propionate chain and into the heme. The covalent Cu-S bond activates this path making it ~20 fold more efficient and competitive with pathway 1.1009 A third pathway (pathway 3, Figure 189 red) through Cys196 via Tyr440 and Arg439 has also been explored.1009 This path involves 24 covalent bonds and 2 hydrogen bonds and has a calculated rate 270 times less efficient than that of pathway 1, indicating that this pathway is not a major contribution in the CuA to heme a ET path.
Figure 189.

Proposed ET pathways in bovine heart CcO based on pathways analysis. The Cys200 and His204 CuA-to-heme a pathways are comparable in rate whereas the Cys196 pathway is calculated to be two orders of magnitude less efficient. R438, R439 and Y440 belong to subunit I: the remaining resides belong to subunit II. Figure generated from PDB ID 2Y691006 coordinates using VMD.
The electron is subsequently transferred from heme a to heme a3. The proximity of heme a to heme a3, shown in the crystal structures of bovine heart and bacterial enzymes, suggests that heme a serves as an effective electron donor to heme a3. The two hemes are nearly perpendicular to one another, and while the Fe-Fe distance is ~13.4 Å, the edges of the hemes approach each other to ~4.5 Å (dashed line in Figure 190) with 14 covalent bonds between the two Fe’s. A fully covalent path also exists composed of 16 bonds between the two Fe’s through His378, Phe377 and His376. In addition, the phenyl plane of Phe377 observed half way between the two planes of the heme a3 and one of the imidazole ligands of heme a (His378) has been proposed as an electron transfer pathway (Figure 190). The distances between the phenyl plane and the two heme planes on both sides are as short as 3.5 Å. Any change in the orientation and position of the phenyl group, induced by changes in the oxidation state of hemes, could affect the electron transfer between Fe a and Fe a3.
Figure 190.

Residues forming a direct pathway between heme a and heme a3 centers. Figure generated from PDB ID 1OCC989 coordinates using Chem3D.
In the case of QO, the CuA site is not present and electrons are directly transferred from ubiquinol to low-spin heme b and subsequently to the heme-CuB binuclear center. The fast electron transfer from ubiquinol to heme b can be achieved through the conserved hydrophobic residues Phe103 and Met79 that are situated between the two moieties and within van der Waals contact distance of heme b (Figure 191).991
Figure 191.

A possible electron transfer pathway from the proposed ubiquinone binding site to heme b in ubiquinol oxidase. (Reprited by permission from M Ref. Publishers Ltd: Nature Structural Biology Ref. 991 copyright 2000)
3.7.2.3.5 Proton transfer pathways
Electron transfer and O2 reduction are coupled to proton pumping. The coupling mechanism will be considered in section 3.7.2.5.2. Here the proton transfer pathways are summarized. HCO’s pump protons from the cytoplasm or the inner matrix of mitochondrial membrane (negative N-side) to the periplasm or mitochondrial intermembrane space (positive P-side). The unidirectionality of proton transfer is thought to be achieved by a gating mechanism that prevents backflow of protons to the cytoplasm (Section 3.7.2.5.2). 1010,1011
The protons to be translocated (pump protons) as well as those used for the chemical reaction (chemical protons) are transported, to some extent, through common channels. Protons are transferred most effectively through H-bonded chains of water and amino acid residue systems via Grotthuss shuttling.1012 The water molecules are present inside cavities within the protein matrix. These cavities provide space for conformational changes of side chains that can induce a new H-bond system. Any conformation change induced by changes in redox or ligand binding states could control proton transfer. Thus a conformationally controlled network composed of hydrogen bonds could function as a proton pump coupled with dioxygen reduction.
X-ray structures, along with site-directed mutagenesis and sequence alignments have revealed two candidates for proton uptake, the D and K channels, for the mitochondria and mitochondria-like enzymes (Figure 192). Table 35 lists the important residues along the D and K proton pumping pathways for bovine CcO and will be summarized below. A third pathway has been identified in several HCO’s (H channel in bovine and P. denitrificans, E channel in P. denitrificans, and Q channel in T. thermophilus) but these are less well understood. Additionally, the proton exit pathway for pump protons en route to the outer periplasmic surface (P-side) remains enigmatic. This channel is thought to start from the site that accepts protons from the gate site. The likely candidates for the acceptor site are a cluster of heme propionates, two arginines, and associated waters.
Figure 192.

Schematic drawing showing the residues invoked in the K (green) and D (pink) proton pumping pathways. Figure generated from PDB ID 2Y691006 coordinates using VMD.
Table 35.
Key Residues in the K-, D- and H-Channels in Bovine CcO (Values in Parentheses are the Corresponding Residues in R. sphaeroides).
| D | K | H | |||||
|---|---|---|---|---|---|---|---|
| D | 91 | (D132) | K | 265 | (S299) | D | 51 |
| H | 503 | (N121) | K | 319 | (K362) | S | 205 |
| N | 11 | (N139) | T | 316 | (T359) | Y | 440 |
| N | 98 | (N207) | Y | 244 | (Y288) | S | 441 |
| - | (S142) | H | 240 | (H284) | Y | 54 | |
| Y | 19 | (Y33) | Y | 371 | |||
| S | 101 | (S201) | R | 38 | |||
| S | 156 | (S200) | S | 382 | |||
| S | 157 | (S197) | V | 386 | |||
| E | 242 | (E286) | M | 390 | |||
| Y | 413 |
The D-pathway is thought to be used for the transfer of all four pumped protons as well as the uptake of two chemical protons during reaction of the fully reduced CcO with O2.1013,1014 This pathway starts at residue Asp91 and ends at Glu242 in bovine CcO. Mutation of Asp91 to Asn has been shown to abolish enzyme activity suggesting that the D channel is involved in the uptake of chemical protons (Figure 192 left).1007,1015 Mutation of the E286 residue to Q in R. sphaeroides CcO, which is the equivalent of E242 in bovine CcO (at the end of the D pathway), results in almost total loss of activity and inhibition of proton transfer during oxygen reduction (reaction starting with O2 and the fully reduced enzyme stops at the PR intermediate).992 Chemical protons can flow from E242 to CuB, at a distance of ~10–12 Å, through a short series of waters that can be modeled into a hydrophobic cavity between E242 and the active site. E242 has been invoked to be a key residue and also function as the gate site that minimizes leakage of protons to the cytoplasm.1016
The K-channel in bovine CcO spanning from Lys265 at the entrance to the cytoplasmic N-side, via Tyr244 ends at His240, a ligand to CuB, and therefore is thought to be a channel for chemical protons (Figure 192 right). The K-pathway is not used during oxidation of the reduced enzyme with O2.1017 During the reduction of CcO (O→R), one to two chemical protons are taken up through the K-pathway.1013,1017 The strong hydrogen bonding between Y244-OH (corresponds to Y288 in R. sphaeroides) and heme a3 farnesyl-OH (Figure 187) is proposed to function as a closed K path gate, since its presence prohibits proton transport via this path to the active site.1018 The K-channel is considered to involve residues K319 and T316 of subunit I in bovine CcO (corresponds to K362 and T359, respectively, in R. sphaeroides, Figure 187) (Table 35). This is because the mutation of K362 and T359 in R. sphaeroides results in a major loss of activity (up to 99.95% for K362M).1019,1020 Despite important details that are now known, the mechanism by which ET is coupled to proton transfer at the molecular level remains unclear.
The H-pathway proposed in bovine CcO, defined first by crystallographically, conducts only pumped protons and extends from the N-side of the membrane surface to the P-side via a water channel and a H-bond network (Figure 193).1021–1025 The pathway starts with a water channel that allows access from the N-side. The pathway then extends to the formyl group of the low spin heme a, which is hydrogen bonded to R38. The hydrogen bond network from R38 extends to D51, which is located near the intermembrane surface of CcO, via the peptide bond between Y440 and S441. Blockage of either the water channel by a double mutation (V386L and M390W) or proton transfer through the peptide by a S441P and D51N mutation was found to abolish the proton pumping activity but not the O2 reduction activity. Mutation of D51 was also found to result in loss of pumping ability. Note that the amino acid residues of the hydrogen bond network and the structures of the low spin heme peripheral groups are not completely conserved amongst members of the HCO superfamily.
Figure 193.

Schematic drawing showing the residues invoked in the K (green) and D (pink) proton pumping pathways. Figure generated from PDB ID 2Y691006 coordinates using VMD.
3.7.2.4. Electronic Structure
Cytochrome oxidase (cytochrome aa3) contains three metal sites: 1) a binuclear copper electron transfer site (CuA, gz = 2.18, gy = 2.02, and gx = 1.99 in the oxidized state), 2) a bis-His ligated low-spin heme (heme a, gz = 3.0, gy = 2.2 and gx= 1.5 in the oxidized state), and 3) the hetero-binuclear heme-copper active site (heme a3 – CuB) in which the heme, with its open coordination site, is high-spin. As previously described, QO (cytochrome bo3) lacks the CuA site, transferring electrons from ubiquinol to the ET heme directly. The reaction of dioxygen with heme-copper oxidases is extremely fast, and thus definition of the early sequence of transient intermediates during the catalytic cycle comes from spectroscopic measurements on microsecond freeze-hyperquench prepared samples or from in situ time-resolved spectroscopic measurements based on the flash-flow method developed by Greenwood and Gibson.1026 The kinetic scheme developed in Section 3.7.2.2 is R → A → P → F → OH → EH → R, of which only a single state, fully (four electron) reduced state R4, has been crystallographically defined (Resting CcO has also been crystallographically characterized but is not on the catalytic pathway).
3.7.2.4.1 Compound R
The UV/Vis spectrum of fully reduced CcO is dominated by the heme spectral features at 443 and 605nm.1027 Reduced CcO is EPR silent. XAS has been performed on Compound R in both the cytochrome oxidases and the QOs (cytochrome bo3. and aa3-600) as a probe of the copper coordination environment and oxidation state.1028,1029 As the QOs contain a single copper ion, spectral interpretation is simpler. In the Cu K-edge XAS spectrum, a pre-edge feature was observed at 8983 eV, and was assigned as the diagnostic 1s → 4p transition, consistent with a Cu(I) oxidation state (Figure 194). The intensity of the Cu first shell scatterer in the EXAFS of Compound R is markedly decreased from that in the resting (oxidized) form of the enzyme, an observation that has been interpreted as significant weakening (or loss) of one of the Cu histidine ligands upon reduction. However, this observation has not been made in the crystallography of reduced forms of the enzyme (see Section 3.7.2.3) and thus possibly reflects some sample heterogeneity, with substoichiometric amounts of bound Cl− or CO having been observed in the A. ambivalens aa3 QO.1030
Figure 194.

Cu K-edge X-ray absorption edge spectra of oxidized (—) and reduced (- -) UbO; Inset: Fourier transform of the Cu EXAFS. (Reprinted with permission from Ref. 1029. Copyright 1999 American Chemical Society.)
3.7.2.4.2 Compound A
The primary intermediate observed upon exposure of reduced enzyme to dioxygen is compound A. Given its short lifetime, information on this state has come from time-resolved UV/Vis and resonance Raman measurements. In the UV/Vis difference spectrum, the Soret of compound A is shifted to ~422 nm from that observed in the fully reduced enzyme (443 nm).948,1031–1033 Time-resolved resonance Raman interrogation of this optical change results in enhancement of a feature at 568 cm−1, which downshifts to 547 cm−1 in the 18O2 isotopologue (Figure 195).1034–1038 Based on comparison of the energy and isotopic shift of this feature to those observed in oxymyoglobin and oxyhemoglobin, the feature was assigned as a νFe—O stretching mode of an analogous Fe-O2 intermediate.
Figure 195.

Resonance Raman spectra and difference spectra of the primary oxygen intermediate from the reaction of fully reduced CcO with dioxygen. Reacion of fully reduced with A) 16O2, B) 18O2, C) difference spectra showing the isotopic shift and D) difference spectra showing isotopic shift of prmary intermediate in the reaction of oxygen with the mixed-valence (Mixed Val) enzyme. Adapted from Reference1035 Proc Natl Acad Science USA
3.7.2.4.3 Compound P
Rapid decay of compound A yields compound P. While initially compound P was thought to have an intact O—O bond (P stood for peroxy), it is now known that the O—O bond has already broken in this state. This observation was first reported by Weng and Baker based on the comparison of UV/Vis spectral features in P to cytochrome c peroxidase compounds I and II,1039 and subsequently by room temperature MCD studies of Thomson and coworkers.1040,1041 The absorption spectrum of P (in cytochrome aa3) is dominated by a Soret band at 428 nm, and a 607 nm feature in the difference spectrum with resting. Resonance Raman spectral interrogation of P (in cytochrome aa3) produced either during catalysis (using time-resolved methodology), or artificially (by reaction with partially reduced MV-CO with dioxygen or fast oxidized with H2O2) results in observation of an isotope sensitive feature at 803 cm−1 (769 cm−1 in the 18O isotopologue) consistent with assignment as a ferryl-heme νFe-O (Figure 196).957,1042,1043 Unequivocal demonstration that the O—O bond was indeed broken in Compound P comes from reaction of fast oxidized with H216/18O2, in which no other oxygen isotope sensitive bands were observed.1044
Figure 196.

Resonance Raman spectrum (607 nm excitation) of a P state of bovine CcO.
Despite the similarities in the UV/Vis absorption and resonance Raman spectra of Compound P generated by different methods (differentiated as PR from the fully reduced enzyme plus dioxygen, PM from the mixed-valent enzyme plus dioxygen, and PH from the oxidized enzyme plus hydrogen peroxide), it is noteworthy that these states are in fact different, as they are generated from reactants with different redox states, and thus have different numbers of electrons available. Specifically, in the generation of PR, four electrons are available within the metal sites (1 in heme a, 2 in heme a3, 1 in CuB) to cleave the O—O bond. In contrast, the generation of PM (and PH) only has three electrons available and thus is deficient by one electron (PM: 0 in heme a, 2 in heme a3, 1 in CuB; PH:0 in heme a, 1 in heme a3, 0 in CuB, 2 in H2O2). Thus, PM (and PH) must obtain a fourth electron from a non-metal site of the protein in order to cleave the O—O bond. Careful analysis of the UV/Vis spectral features of PR and PM by principle component analysis (specifically by singular value decomposition) has revealed slight spectral differences.1045 One method that could potentially resolve the issue of the fourth electron is EPR. Indeed, a variety of tryptophan and tyrosine radicals have been observed in PH.1046,1047 However, the current consensus1048–1051 is that these radicals are related to generation of P with hydrogen peroxide, and that the on-pathway PM heme a3-CuB site is EPR silent due to magnetic coupling of the tyrosine radical with the copper ion, implying the His-Tyr crosslink functioning as a superexchange pathway for the antiferromagnetic interaction. A magnetically coupled Y•-Cu(II) state in PM is supported by the study of a model complex bearing a phenol functionalized imidazole ligand, [CuII(BIAIP)], that was demonstrated to be EPR silent;1052,1053 however, this proposal has been challenged by an alternate model study with a similar ligand architecture1054 wherein the Cu(II) and phenoxy radical were uncoupled.1055 We note that in our own computational studies, the coupling of a Cu(II) and the radical phenolate through an imidazole is dependent on the phenolate-imidazole dihedral angle, varying from anti- to ferromagnetic as the ring (and thus the magnetic orbital of the ligand) is oriented in and out of plane, an observation that perhaps could explain some of the empirical differences. While the PM state is EPR silent, the PR state has a characteristic Cu EPR signal, which definitively indicates the Cu is in the +2 oxidation state.1056
Chemical evidence for the Tyr as the origin of the fourth electron, and thus being a neutral radical in state PM, comes from a radioactive iodide experiment followed by degradative mass spectroscopic analysis of Babcock and coworkers.1057 In this experiment, reaction of PM with iodide led to the observation of labeled Tyr-His in state PM (albeit in 3 % yield) – the reaction of iodide with other states (F and O) did not lead to labeled tyrosine. The assertion of a Tyr244• radical in PM is further supported by FT-IR data of Wikström and coworkers,1058,1059 in which the difference spectrum of PM with O shows a band at 1519 cm−1, consistent with a neutral tyrosine radical (Figure 197). PM further lacks a band at 1311 cm−1, observed in PR, and attributed to a tyrosinate anion. The lack of the 1311 cm−1 band in PM also indirectly supports a neutral tyrosine in PM and directly suggests a deprotonated tyrosinate in PR.
Figure 197.

ATR-FTIR difference spectrum of P. denitrificans cytochrome c oxidase state PM minus state O. The feature at 1519 cm−1 is indicative of a tyrosyl radical.
3.7.2.4.4 Compound F
The rate of decay of Compound P is associated with isotope effects (Section 3.7.2.2) and thus a proton translocation is involved in the P → F conversion. The UV/Vis absorption spectrum of Compound F is quite different from that observed for Compound P, yet remains dominated by the heme spectral features with a Soret band at 428 nm and Q band features at 580 nm and 535 nm in the difference spectrum (cytochrome aa3). The resonance Raman spectrum of Compound F displays two oxygen isotope sensitive features at 786 cm−1 and 355 cm−1, which downshift to 749 cm−1 and 339 cm−1 in the 18O isotopologue. These features have been assigned as the νFe—O and δN—Fe—O of an Fe(IV)=O (Figure 198).957,1060 FT-IR of Compound F shows a feature at 1308 cm−1, which has been ascribed to a tyrosinate anion (analogous to the tyrosinate in PR) which suggests that the proton that is taken up (see Section 3.7.2.2) generates a copper-bound aquo ligand.
Figure 198.

Resonance Raman difference spectrum of the reaction of CcO with 16O2 and 18O2 at 520 μs using 427 nm excitation that displays two oxygen isotope sensitive features, a νFe—O at 786 cm−1 and a δN—Fe—O at 355 cm−1, consistent with an Fe(IV)=O in state F. (Figure reprinted with permission from Ref. 1035.)
3.7.2.4.5 Compound OH
The absorption spectrum of OH is dominated by heme features, and has a Soret at 424 nm, consistent with an oxidized ferric-heme cofactor. The resonance Raman spectrum of Compound OH is associated with an isotope sensitive feature at 450 cm−1 (under single turnover conditions in cytochrome aa3), which downshifts to 425 cm−1 in the 18O isotopologue.1037,1060–1062 This feature is sensitive to deuterium substitution and thus OH has been assigned as having a hydroxide bound to the heme a3.
3.7.2.5. Molecular Mechanism
Heme-copper oxidases catalyze the oxidation of cyt c using dioxygen as the terminal electron acceptor. This process is thermodynamically favorable, and some of the excess free energy gained from this redox process is used to pump protons. It has been shown in specific mutated CcO variants that the proton pumping function can be eliminated without loss of the oxygen reduction activity. Thus, the elementary kinetic steps of the mechanism of oxygen reduction can be studied decoupled from those of pumping.
3.7.2.5.1 Reductive cleavage of O2
The general landscape for O2 reduction that has been outlined in Section 3.7.2.2 comes from time resolved single turnover studies, which yield the following simplified sequence of intermediates R → A → P → F → OH. The identities of these intermediates have been explored spectroscopically in Section 3.7.2.4 and have been assigned as Y-Cu(I)-Fe(II) → Y-Cu(I)-Fe(III)-O2•− → Y•-Cu(II)OH-Fe(IV)=O → Y−-Cu(II)OH2-Fe(IV)=O → Y−-Cu(II)OH2-Fe(III)-OH (Figure 199). Thus, the O—O bond is broken in the A → P step concomitant with the proposed net H• abstraction from the crosslinked tyrosine. In CcO, this A → P transformation is generally considered from the O—O bond cleavage perspective. It is also interesting to consider the A → P step from the net H• perspective to draw insight into the factors required for O—O bond cleavage and parallels to other heme oxidases (i.e. cytochrome P450). Both CcO and cytochrome P450 react with dioxygen to form an early superoxo complex, which is followed in a subsequent step by a high-valent Fe(IV)=O with a ligand centered radical (PM in CcO and compound I in cytochrome P450). A major difference between these parallel reactions is that in cytochrome P450, an additional intermediate has been observed — a ferric-hydroperoxo called compound 0 — while no additional intermediate has been observed in CcO. This observation stimulates the question as to whether the ferric-superoxo in compound A of CcO is the oxidant or whether an unobserved intermediate peroxo functions as oxidant. The question can only be answered experimentally at present by model studies since no intermediate peroxo has been observed in CcO. While an emerging body of evidence suggests ferric-superoxo complexes may be competent for net H• reactions, it is noteworthy that only one ferric-heme-superoxo complex has been reported to be competent for reaction with phenols (Figure 200).1063 In this work of Collman and coworkers employing a picket fence porphyrin derivative with a copper binding site,1064,1065 the authors demonstrated both inter- and intra-molecular reactivity with phenols to yield high-valent Fe(IV)=O adducts and phenoxy radicals.1066,1067 The reaction requires copper to proceed, highlighting its parallels to the CcO active site.
Figure 199.

Simplified consensus mechanism of the reductive cleavage of O2 by hemecopper oxidases.
Figure 200.

Heme-copper models created by Collman and coworkers in which addition of dioxygen to the reduced precursor generates a Fe(III)-superoxide intermediate which is competent for inter- and intramolecular hydrogen atom abstraction to generate a phenoxy radical.
Alternatively, a system has recently been reported by Karlin and coworkers wherein a ferric-heme-peroxo-copper complex is competent for reaction with phenols to yield high-valent Fe(IV)=O and phenoxy radicals (Figure 201).1068 A common structural motif between the functional Collman and Karlin systems is the presence of an axial imidazole ligand, analogous to the axial His present in heme a3 of CcO. The axial ligand is essential because in the Karlin system, the spin of the heme is modulated by the presence or absence of the axial ligand,1069 and only the low-spin peroxo bridged Cu(II)-O22−-Fe(III) complex with the axial ligand bound is reactive, perhaps suggesting spin as a factor in catalysis. The effect of spin on O—O bond rupture has been assessed in studies on non-heme ferric-hydroperoxo complexes,1070–1072 and the higher reactivity of the LS versus the HS complex was attributed to kinetic control; during O—O bond rupture the reaction on the low-spin surface proceeds with a lower barrier as a result of good overlap of the redox active orbitals. It should be noted that while the heme of CcO is ligated by an axial His residue suggestive of a low-spin oxidant, it has been proposed that in the evolutionarily related NO reductases (see Section 3.7.2.1), the axial His dissociates from the heme during catalysis. This observation has not been addressed in CcO. Nonetheless, the issue of active oxidant has been explored theoretically. Calculations that reproduce both the barrier and driving force of O—O bond cleavage invoke intermediacy of a bridging peroxo level adduct (IP).1073,1074 Further calculations extended from a magnetostructural correlation observed in the low-spin functional heme-peroxo-copper model of Karlin and coworkers suggest that a bridging peroxide allows for O—O bond cleavage without spin surface crossing (Figure 202).1075 To break the O—O bond of a putative peroxide intermediate in CcO, a pair of electrons must be transferred into the σ* orbital of the peroxide. If the consensus mechanism in Figure 199 is correct, these electrons originate from the Fe and the tyrosine. The electron from the Fe must be spin down, to generate the S=1 Fe(IV)=O, and therefore the electron that comes from the tyrosine must be spin-up, thus the residual unpaired electron on the Tyr• is spin down. If the Tyr• and Cu(II) in PM are antiferromagnetically coupled (Section 3.7.2.4), the unpaired spin on the Cu(II) must then be spin up. Since the electrons on the copper would not be involved in a IP → PM transformation, the electron on the Cu(II) would start spin up, implying that the putative IP in CcO consists of a ferromagnetically coupled Fe—O—O—Cu core if the O—O bond is to be broken without a spin surface crossing. The origin of this expected ferromagnetic coupling comes from a magnetostructural correlation developed in the low-spin heme-peroxo-copper model complex. Specifically, if the protein enforces a Cu•••Fe distance of greater than 4.6 Å (Section 3.7.2.3), this would require that a putative intermediate Fe-O-O-Cu peroxo intermediate adopt a dihedral angle > ~150°. This large dihedral would result in a ferromagnetic (S = 1) ground state as a result of orthogonal magnetic orbitals leading to the lack of a superexchange pathway between the magnetic orbitals of the low-spin ferric heme and the Cu(II), in contrast to an unconstrained model complex, in which a more acute Fe-O-O-Cu is accessible and results in an antiferromagnetic (S = 0) ground state. A key question that remains is how large an effect this spin topology plays during catalysis. This is likely dependent on the magnitude of the coupling between the Cu(II) and Y•, a value which has not been measured at present.
Figure 201.

Addition of dicyclohexylimidazole to {[(F8)Fe]-O2-[Cu(AN)]}+ results in a distinct species in which the imidazole coordinates the iron axially, and the geometry of the peroxide ligand bridges changes from “side-on” to “end-on”. The spin of the heme also changes from high-spin to low-spin upon coordination of the imidazole.
Figure 202.

Schematic of the spin topology of the reductive cleavage of a putative peroxointeremdaite in CcO to generate PM. A spin down electron originates from the Fe, and a spin up electron originates from the crosslinked tyrosine to fill the σ* of the peroxide ligand. (Reprinted with permission from Ref. 1075. Copyright 2011 American Chemical Society).
While the balance of experimental and theoretical observations suggest an unobserved bridged peroxo as the key intermediate, it is paradoxical that the resting “as-isolated” form of CcO has been crystallographically defined as containing a peroxide group spanning the heme and copper,1000,1002,1076 as sufficient electrons are available to allow the O—O bond in this state to spontaneously cleave. This issue has not been resolved, but we note that in resting CcO, the heme a3 is high-spin (S = 5/2) based on 1) the λmax of the heme Soret band in the absorption spectrum of resting CcO that appears at 424 nm, indicative of a high-spin electronic structure,1077,1078 2) SQUID magnetization studies that have demonstrated that the heme a3—CuB pair is antiferromagnetically coupled to yield an overall S = 2 spin system,1079,1080 and 3) EPR and MCD on resting ubiquinol oxidase that further indicates a small, anisotropic superexchange parameter (J ≈ 1 cm−1) and a large positive zero-field splitting (D = 5 cm−1) for heme a3.1081 These spectroscopic observations are contradictory to those for the heme-peroxo-copper model complex, wherein the analogous end-on bridging peroxide causes the heme to be LS.1069 A HS peroxide in resting CcO would suggest a weak interaction of the peroxide with the heme which would necessitate poor overlap of the redox active orbitals needed to cleave the O—O bond. Alternatively, given the observation of a spin correlation to reactivity in the heme-peroxo-copper model complex, perhaps the spin state is the reason that the peroxo in resting CcO does not cleave. These issues of spin and active oxidant thus remain unresolved in understanding the O—O bond rupture process in CcO.
Given the lack of certainty regarding the active oxidant, it is difficult to ascertain the order in which protons and electrons enter the A → P transformation. Nonetheless, based on the evidence for a neutral Tyr• in PM,1057,1082 it is likely that the electron comes from the fully conserved Tyr, which makes the active site Tyr-His crosslink of central interest. Mutated CcO variants in which the Tyr244 was eliminated failed to bind copper in an appreciable amount, and thus the crosslink was believed to perform a structural role.1083 However an alternative role of the crosslink could be as an electron transfer pathway to get the fourth electron to the oxygen derived ligand to facilitate cleavage.1075
The crosslink functioning as an electron transfer pathway hypothesis only finds utility in the case of a bridging intermediate peroxo. In the case where the Fe(III)-superoxo is the active oxidant, it is more likely that to break the O—O bond the three electrons are taken from the heme, followed by electron backfilling from the crosslinked Tyr through the heme farnesyl substituent-crosslinked tyrosine hydrogen bond.1074 In either case, the factor that would determine the origin of the electron is the redox couple of the Tyr versus the redox couple of the heme, for which the protonation state of the tyrosine would be of central importance (i.e. a deprotonated tyrosine would have a more favorable redox couple for oxidation). Based on FT-IR, Compound P contains a deprotonated Tyr, which supports direct electron transfer from the Tyr. As the Tyr hydroxyl substituent would be greater than 5Å from a dioxygen bound to heme a3, an active site water relay may be needed as a means to transmit the proton. The issue is particularly relevant because it signifies the entry of protons into the O—O cleavage, and thus of the coupling of O—O cleavage to proton pumping.
3.7.2.5.2 Proton Pumping
A detailed description of the proton pumping mechanism is presented by Wickstrom et al. in this thematic issue. Here, we present a brief overview for correlation to the mechanism of dioxygen reduction. In general, proton pumping by CcO is driven by the alternating redox states of the cofactors coupled to protein motion.1084 The movement of electrons from site to site provides an electrostatic driving force for translocation of protons in order to compensate the charge of the electrons.1085 Thus, proton movement is strongly coupled to electron transfer. In order to move the large distances through the protein, the protons shuttle rapidly through hydrogen bonded chains of water and amino acid residues, called Grotthuss shuttling. Detailed mechanistic understanding of the factors in proton pumping is an area of significant active research and a diversity of scientific opinion. There are, however, a few concepts regarding the minimal requirements for pumping that have emerged:1086 1) the free energy to pump the protons comes from the large redox potential drop of the reduction of dioxygen to water relative to cyt c, which primarily provides an electrostatic driving force to maintain electroneutrality among high proton affinity sites, 2) the existence of a proton loading site in which the affinity for protons dramatically changes depending on redox states and protein conformations, 3) proton channels constructed of protein residues and water as a means to conduct the protons, and 4) a gating mechanism to prevent backflow of protons.
While the free energy used to pump protons in heme-copper oxidase comes from the large redox potential drop in the reduction of oxygen to water, it is nonetheless possible to decouple the pumping of protons from the oxidation of cyt c and concomitant reduction of oxygen to water, which allows for the study of electron transfer and proton translocation independently. One specific variant that highlights this feature of heme-copper oxidases is the N139D variant (R. sphaeroides), a mutation along the D- pathway that eliminates proton pumping and increases the rate of O2 reduction. The role of the dioxygen reduction is to provide a driving force for the stepwise transfer of electrons from heme a. The changes in the electrostatic environment by movement of the electrons between heme a and heme a3 drives the movement of protons. It is interesting to consider that the electron transfer from heme a to heme a3 is perpendicular to the translocation of pumped protons which indicates that sidechain and water reorganization during the modulation of the electrostatic environment must play a role. We note in passing that the area of decoupling of proton pumping from the oxygen reduction there is an emerging body of evidence that suggests that regulation of pumping by the organism is a viable aspect of catalysis, including variability in the number of protons pumped per electron. Two mechanisms under consideration for the attenuation of pumping are either via leakage of protons back across the membrane, or dissipation of the excess free energy from the oxygen reduction as heat. The regulation of proton pumping, while an area in early development, has significant physiological implications for organisms that have a need for heat as well as ATP.
The identity of the pump site within heme copper oxidases has not been resolved. Because pumping is driven by redox catalysis, it is likely that the pumping site is located in close proximity to redox sites. Current proposals implicate functional groups on the P side of the heme a3/CuB site, including the heme a propionates,1087 the heme a3 propionates, and residues in their immediate vicinity as the leading candidates. The key attribute of the proton loading/pump site is that the affinity for the proton must vary in order to either take up or release a proton at the appointed time during the sequence of electron transfer events. The local electrostatic environments over the series of redox states have been investigated computationally,1088–1090 and suggest that the dominant contributors to the change in proton affinity of a potential proton loading site is electrostatics and coupled protein motions.
Based on crystallography (see Section 3.6.2.3) and a variety of mutational studies, the proton entrance channels are moderately well defined (the K- and D-channels) while the other channels, in particular the H-channel, is somewhat less well understood. Early on, it was appealing to define the K- and D-channels as responsible for translocating pumped and chemical protons respectively. However, mutational studies of uncoupled variants indicate that the K-channel provides two chemical protons and the D-channel provides two chemical and all four pumped protons. It is not known what the advantage of two uptake channels would be. Current mechanistic thought requires barriers to separate chemical from pumped protons. The D-channel would appear to violate this idea, but does contain a residue believed to function as a branch point (E286 R. sphaeroides, Section 3.6.2.3) to separate the chemical and pumped proteins. There has further been discussion regarding the role that water plays in the channels to facilitate temporal separation of pumped versus chemical protons.1091,1092 While the description of the H-channel was based on crystallography (Section 3.6.2.3), recent mutagenesis work on the H-channel of bovine CcO has revealed that D51X variants turn off pumping while retaining the ability to reduce dioxygen.1023 This suggests that in bovine CcO the Hchannel plays a major role in proton pumping.
Much progress on the mechanism of gating has been made recently. The starting point of these studies of these studies comes from X-ray crystallography. Specifically, the E286 residue at the interior end of the D-channel that has been found in a “down” and “up” configuration (Figure 203),1093 with the “down” state preferred by 2 kcal/mol with a 6 kcal/mol barrier to interconversion.1094,1095 MD simulations of this residue are found to vary significantly depending on the hydration in the cavity and the choice of membrane environment around the enzyme in the model. Recent simulations by Voth and coworkers that explicitly allow for proton transport (multi-state empirical valence bond methodologies) reveal that deprotonation of the “up” conformer leads to rapid transition to the “down” state only when heme a and heme a3 are reduced and oxidized respectively, providing a means to reorient E286 into the proton channel to rapidly accept another proton and prevent back-leaking.1089 It should be noted an equivalent residue to E286 has not been identified in T. Thermophilus CcO (cytochrome ba3). Instead, it is thought that the ba3 and caa3 oxidases use a tyrosine and serine residue (called YS pair) to perform an equivalent gating function.1096 Alternative gating schemes have been proposed, one particularly intriguing recent suggestion is the dual gating proposed in bovine CcO along the H-channel,1087 in which the heme a farnesyl sidechain and formyl block proton exchange of the heme a priopionate on the negative side, and Y440-S441 peptide bond blocks the positive side. Oxidizing the heme a tautomerizes the Y440-S441 peptide bond to allow the proton to escape. Reduction opens the heme a farnesyl and formyl interactions to allow for protonation of the heme a priopionate. More general structural changes have also been observed experimentally, in particular in the crystal structures of oxidized and reduced states of CcO. In resting CcO, a tight hydrogen bond is present between the CuB bound His-Tyr ligand and the heme a3 farnesyl hydroxide (Figure 204A). This hydrogen bond is lacking in a reduced structure, and the lack of this hydrogen bond is correlated to increased hydration in the K-channel (Figure 204B).1004 The tight hydrogen bond in the oxidized form thus blocks entrance of protons into the heme a3/CuB from the K-channel, allowing for alternating access of protons from the K-and D-channel to the binuclear site. It should be noted however, that the fully reduced enzyme may not be an intermediate during catalysis (see Section 3.6.2.2).
Figure 203.

Overlay of the D-channel of wild-type (purple) and N131D (carbon atoms in yellow) variant of P. denitrificans cytochrome oxidase. Hydrogen bonds between waters and channel residues are shown in green (Ref 1093[Durr 2008]). E278 (E286 in R. Shpaeroides numbering) is at the top of the channel and is found in two different orientations, “up” and “down”.
Figure 204.

The reduction of resting CcO (A) to generate fully reduced CcO (B) causes breaking of the crosslinked tyrosine-porphryn farnesyl hydroxide hydrogen bond to break that is associated with water entering the active site. (Reprinted with permission from Ref. 1004. Copyright 2009 American Chemical Society).
The sequence of events of proton pumping are coupled to the electron transfer steps in the transitions of states P → F, F → O, O → E, and E → R. Fadda and coworkers have described a mechanism for each of the individual pumping events by three states defined by the charge on the heme cofactors written as [0|1], [1|0], and [1|1], where the digit on the left and right are the overall charge on heme a and heme a3 sites respectively (Figure 205).1097 Starting from the [0|1] state wherein the heme a is reduced thereby raising the pKa of the pump/proton loading site (PLS), a proton is delivered to the PLS which raises the redox couple of the binuclear site such that an electron is transferred from heme a to generate the [1|0] state. Next, a chemical proton is recruited to the binuclear site to generate a [1|1] state, in which the pKa of the PLS changed resulting in proton release from the PLS. Finally heme a is rereduced by CuA to generate a [0|1] state. This sequence of events is capable of describing the kinetics of ET and proton release. In the steady state P → F transition, examination by single-turnover studies reveals the transition occurs in two steps, PM → PR → F, in which an electron is transferred in PM → PR and the proton in PR → F. Immediately prior to O2 cleavage, the heme-copper site is electron rich, and drives the loading of a proton in the pump site. Dioxygen reacts to generate the superoxidized PM, a [0|1] state with a presumably loaded PLS site. Next, an electron is transferred from heme a to the heme-copper site to create PR, a [1|0] state. This electron rich PR state then recruits a chemical proton generating a [1|1] state, equivalent to state F, which then modulates the pKa of the PLS to eject the proton to yield intermediate F*. In a similar manner, these three states are repeated four times per pumped proton. This scenario also implies a rich set of protonation microstates during the F → O, O → E, and E → R transformations. However, while this overall mechanistic sequence provides a coarse picture of proton pumping, many of the molecular level details are still unresolved. In particular, aspects of the architecture of the binuclear site including the Tyr-His crosslink, heme a3 axial imidazole coordination, role of the copper, and identity of the proton loading site and gate sites remain among the open questions. Details are emerging regarding these structural components and their role for O2 reduction; presumably these structures are integral components for the coupling of oxygen reduction to proton pumping as well.
Figure 205.
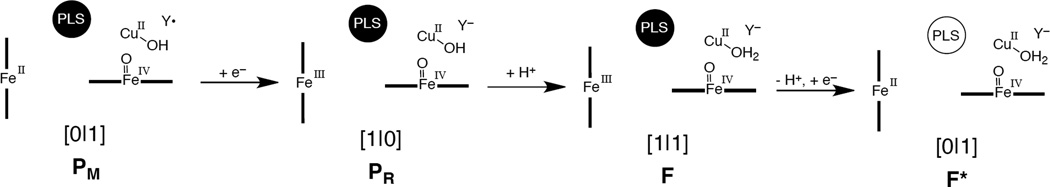
Illustration of the microscopic mechanism of proton pumping for the P → F proton pumping step. The proton loading site is loaded in PM, PR, and F.
3.8 Reduction of O2 to H2O
While many enzymes formally reduce O2 to H2O in their catalytic cycles (for example as presented in section 3.2-catechol oxidase couples O2 reduction to H2O to two, two-electron oxidations of catechol) only the MCOs and HCOs are capable of an effectively concerted four electron reduction of O2. In both classes, the second two-electron reduction (of peroxide) is fast indicating a low activation barrier for O-O bond cleavage; thus far only in the case of variants of the MCOs where electron transfer from the T1 is eliminated can a two electron peroxide intermediate be observed. The low barrier for this second two-electron reduction of O2, derives from the trinuclear nature of the catalytic sites in both classes (the TNC in the MCOs and the hemea3/CuB/Tyr in the HCOs, Figure 206). In the MCOs, the second two-electrons derive from two CuI’s that, in the triangular topology of the TNC, have good overlap with the peroxide σ* orbital, and the third CuII of the TNC acts like a proton in lowering the energy of the σ* LUMO. In the HCOs the second two-electrons derive from hemea3FeIII and the covalent Tyr (through a superexchange pathway involving the CuB) with oxidation of Tyr coupled to proton transfer to the peroxide to promote O-O bond cleavage. In both classes of oxidases there is thus a low intrinsic overpotential for O2 reduction, and ~800 mV/electron (at pH = 7) is available for either oxidizing high potential one-electron substrates (in MCOs), or low potential Cyt c with the excess energy used in proton pumping (in the HCOs).
Figure 206.

Comparison of trinuclear active site arrangements for the multicopper oxidases and Heme-copper oxidases depicted in the NI and PM forms, respectively.
A second parallel between these two classes is that the trinuclear centers are buried in the protein and electrons enter from the substrate via a T1 or CuA center near the surface of the oxidase and are transferred rapidly over 13–18Å to the catalytic site. A key difference is that Cu is only capable of one-electron redox while the heme-a3 FeII is capable of two-electron redox and the covalent Tyr is also redox active. Thus in the MCOs all four Cu’s are oxidized in the four-electron reduction of O2 to H2O which provides an efficient mechanism for substrate oxidation in that the T1 at the surface of the enzyme is immediately available for redox. Alternatively in the HCOs all four electrons derive from the catalytic site, therefore four holes are stored here for proton pumping. The HCOs therefore have the additional feature of the buried heme-a3 FeII for transfer of each of the four electrons that are coupled to the proton pumping in the reduction of the hemea3/CuB/Tyr active site.
A final interesting correlation is that in both classes of four-electron oxidases the oxidized form of the enzyme obtained in turnover (NI in the MCOs, the pulsed enzyme in the HCOs), but not the resting form, is catalytically active. In the MCOs it is clear that NI loses its µ3-oxo in going to the resting enzyme and this drastically slows electron transfer from the T1 Cu. Thus, the crystallographically defined resting TNC is not involved in catalysis. In the HCOs the crystallographically defined resting enzyme form has a peroxide bridging the hemea3-CuB center. It is important to understand the origin of this bridging peroxide and why it is inactive rather than spontaneously undergoing O-O bond cleavage to generate the four-hole hemea3 FeIV=O/CuII/Tyr• catalytic state.
4. Substrate Activation by CuII Sites
Reactions between triplet O2 and singlet organic substrates are spin-forbidden, leading to very slow rates despite the reactions being thermodynamically favorable. Two possible catalytic strategies for overcoming this barrier using a mononuclear metal center are observed in bioinorganic chemistry: O2 activation by a reduced metal and substrate activation by an oxidized metal. These complementary strategies are observed in mononuclear iron enzymes, where FeII-dependent enzymes such as the extradiol dioxygenases activate O2 while FeIII-dependent enzymes perform substrate activation in two possible ways: the intradiol dioxygenases by binding the substrate as a ligand and promoting the reaction with O2 via a concerted LMCT mechanism where FeIII acts as a spin buffer; the lipoxygenases by using an FeIII-OH site to perform H-atom abstraction from the substrate (to form an FeII-OH2), resulting in a substrate radical activated for reaction with O2.1098 A similar pattern is observed for the two different redox states of copper in mononuclear copper enzymes. In Sections 3.3 and 3.4, O2 activation by mononuclear copper sites in the reduced CuI state was discussed. The alternative strategy utilizing mononuclear CuII for substrate activation is employed by the enzyme quercetinase, in the cofactor biogenesis reaction of the copper-containing amine oxidases (including lysyl oxidase) and also in one possible biogenesis mechanism in the enzyme galactose oxidase as described in Section 3.3.4. In this section, what is known about the reactivity of CuII in quercetinase and in amine oxidase cofactor biogenesis will be discussed, concluding with thoughts on the nature of substrate activation by CuII active site.
4.1 Quercetinase
4.1.1 Enzymology
Quercetinase (quercetin 2,4-dioxygenase, 2,4-QD, EC 1.13.11.24 [named “quercetin 2,3-dioxygenase”, but this does not reflect the reaction done by the enzyme]) is an extracellular enzyme expressed by some microorganisms when grown on rutin, a quercetin precursor (Figure 207), as the sole carbon source.1099,1100 It catalyzes the degradation of quercetin and related flavonols to the depside (diphenolic ester) 2-protocatechuoylphloroglucinol and CO (Figure 207).1101 Quercetin and other flavonols are nutrients present in foods such as onions, red leaf lettuce, and tea and are of interest for their antioxidant and anti-inflammatory properties.1102 They are used as herbal medicines and as part of traditional Chinese medicine.1103 Quercetin is being investigated as a treatment for a variety of diseases,1104 including cardiovascular disease,1105 and a variety of cancers.1106,1107 The mechanism of action of fungal and bacterial quercetinases may be related to the metabolism of quercetin by microflora in the intestinal tract.1108 In addition, quercetinase has been investigated as a food preservative. 1109
Figure 207.

Enzymatic processes in fungi involving quercetin. A) Formation of quercetin from rutin by rutinase and 2) 2,4-dioxygenation of quercetin catalyzed by quercetin 2,4-dioxygenase, including ring and atom nomenclature for the quercetin ring.
Quercetinases have been isolated from the fungi Aspergillus flavus,1099 Aspergillus niger,1110 Aspergillus japonicus,1111 and Penicillium olsonii1112 and the prokaryotes Bacillus subtilis1113,1114 and Streptomyces sp. FLA.1115 All quercetinase enzymes are glycoproteins with 16–47% sugar content (w/w). Sequence data for the quercetinases from A. japonicus, P. olsonii, B. subtilis, and Streptomyces have been reported and there is a high degree of sequence similarity between enzymes from different source organisms (compared to P. olsonii, 61% similarity with A. niger, 58% with A. japonicus, but only 15% with B. subtillis and 30% with Streptomyces).1112 Despite this sequence similarity, there are large differences in quaternary structure between 2,4-QDs from different sources. All 2,4-QDs belong to the cupin superfamily, but 2,4-QDs from A. japonicus, P. olsonii, and B. subtillis are bicupins while Streptomyces 2,4-QD is a monocupin.1115 The 2,4-QDs from A. japonicus and B. subtilis are homodimers1111,1116 while the P. olsonii 2,4-QD is a monomeric protein1112 and the A. niger 2,4-QD is a heterotrimer.1110
The metal ion content of quercetinases from different organisms is a topic of ongoing research. All quercetinases isolated from fungal sources (the Aspergillus and Penicillium enzymes) contain ~ 1 Cu atom per monomer,1111,1112,1117 excepting A. niger 2,4-QD, which binds ~2 Cu per trimer.1110 The copper is in the CuII redox state, since a cuproine assay by Oka and Simpson detected very little CuI in the as isolated enzyme.1117 A. niger 2,4-QD is also isolated with variable Ni content in addition to CuII, but the amount of nickel present does not affect the enzyme activity.1110 In contrast, the prokaryote quercetinases from B. subtillis and Streptomyces are expressed in E. coli and bind many different divalent metals, depending on the metal content of the culture media. 1118,1119 B. subtilis 2,4-QD was originally isolated containing a mixture of FeII and FeIII, but bound Fe can be removed by DDTC and EDTA chelation and full activity is only restored by incubation with CuII or CoII (MnII and FeIII also show some activity).1116 Experiments to determine the divalent metal that gave the highest activity in crude cell extracts of B. subtilis and Streptomyces 2,4-QD indicate that MnII and CoII are most active in B. subtilis 2,4-QD1118 while NiII and CoII are most active in Streptomyces 2,4-QD.1119 When 2,4-QD is isolated with these metals, the metal stoichiometry is not consistent with tight binding to the proposed active site (1 site per subunit) as CoII and NiII bind in less than stoichiometric amounts (0.65 CoII per subunit in B. subtilis, ~0.5 CoII or 0.5 NiII per subunit in Streptomyces) and MnII binds in excess (1.8 MnII per subunit).1118,1119 Despite the work that has been done on the metal content and activity of the bacterial quercetinases, it is not clear which metal is bound in the native enzyme in these systems. Alternatively, it is clear that CuII is the native metal in the fungal quercetinases. Further arguments can be made from comparing the kinetics of quercetinases isolated with different metals (vide infra) that quercetinase should be considered to be a CuII enzyme and the incorporation of different metals is due to the E. coli expression system.
4.1.2 Kinetics
Early experiments on 2,4-QD by Simpson et al. used atom labelling to identify the precise reaction performed by 2,4-QD. Labelling the C3 carbon in rutin, which is transformed to quercetin in vivo by the enzyme rutinase, with 14C shows that the C3 carbon of quercetin is released as CO by 2,4-QD from A. niger (Figure 207).1101 When the reaction is carried out with 18O2 by A. flavus 2,4-QD, the CO produced does not contain 18O while the depside product contains both atoms from 18O2, incorporated at C2 and C4 (detected by MS and IR spectroscopy).1100 Performing the reaction in H2 18O resulted in no change in the amount of 18O in the water, so 18O from H2 18O is not incorporated into either product and the O of the CO released comes from the original C3-OH group of the substrate.1100 On the basis of these results, 2,4-QD can be identified as a 2,4-dioxygenase.
Experiments by Oka et al. show that 2,4-QD substrates bind to anaerobic resting 2,4-QD from A. flavus and react upon addition of O2.1120 Kooter et al. and Steiner et al. have reproduced this result for A. japonicus 2,4-QD.1121,1122 In contrast, Hund et al., using 2,4-QD from A. niger, find that no difference is observed in the EPR spectrum of the enzyme upon anaerobic incubation with a threefold excess of quercetin.1110 They propose that the presence of O2 may be required for substrate binding. This discrepancy may be related to the insolubility of quercetin in aqueous solutions, which was overcome in the experiments of Oka et al. and Kooter et al. by the addition of DMSO (10% (v/v) Oka, 5% (v/v) Kooter), an additive not present in the EPR experiment of Hund et al. Oka et al. have investigated the structural requirements for substrates of 2,4-QD. 2,4-QD will dioxygenate a variety of 3-hydroxyflavones where a C3-OH group, a double bond between C2 and C3, and a substituent on C2 are all found to be required for substrate reactivity.1120
Maximum specific activites and KM values have been reported for several copper containing 2,4-QDs (182 µmol min−1 mg−1, 5.2 µM quercetin, and 0.12 mM O2 for A. flavus,1099 73 µmol min−1 mg−1 and 6.6 µM quercetin for A. niger,1110 175 µmol min−1 mg−1 and 1.1 µM quercetin for P. olsonii1112) but full Michaelis-Menten kinetics with several different substrates are reported only for 2,4-QD from P. olsonii (Table 36). Various substitution patterns on the B and C rings of the flavonoid result in variations in the KM and relative rates of reaction, due to the structural constraints of binding the substrate in the active site pocket.
Table 36.
Various 2,4-QD substrates and steady-state kinetics parameters for 2,4-dioxygenation by P. olsonii 2,4-QD (obtained with 20% DMSO assay content).1112
| Substrate structure | kcat (s−1) | KM (µM) | kcat/KM (M−1 s−1) | |
|---|---|---|---|---|
| quercetin | 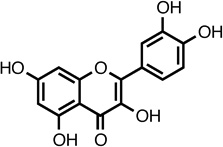 |
167±3 | 19±1 | 8.8×10⁶ |
| kaempferol | 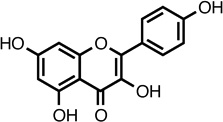 |
467±17 | 13±2 | 3.6×10⁷ |
| galangin |  |
33±5 | 20±4 | 1.7×10⁶ |
| fisetin | 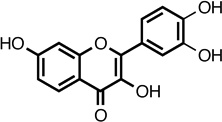 |
57±7 | 85±16 | 6.7×10⁵ |
The higher KM values reported for 2,4-QD from P. olsonii in Michaelis-Menten kinetics studies are due to a higher % DMSO used in the assay. Tranchimand et al. investigated the effect of % DMSO and found that it increases the apparent KM (19 µM with 20% DMSO v.s. 1.1 µM with 1% DMSO for quercetin).1112 There is also a pH effect on the enzyme activity that varies with the enzyme source: while A. flavus shows maximum activity pH 5.5–6.0,1123 P. olsonii shows an optimum pH of 6.51112 and A. niger shows no pH effect on activity pH 2.0–6.7.1110 The origin and significance of the pH profile of the enzyme activity of 2,4-QD remain to be studied. Single turnover experiments on the 2,4-QD ES complex with O2 have not been reported and are an interesting future direction for kinetics studies.
2,4-QD is inhibited by reducing agents such as sodium dithionite, 2-mercaptoethanol and dithiothreitol but recovers from this inhibition after exposure to air or mixing with air-saturated buffer. This reactivation is not retarded by p-chloromercuribenzoate, so it results from reduction of the copper site rather than from reduction of disulfide bonds in the protein.1120 This establishes that CuII is the active redox state in 2,4-QD. Pre-incubation of the enzyme with substrate prevents inactivation by a reducing agent, suggesting that substrate binding makes the copper site more difficult to reduce (either by decreasing E° or by blocking access to the metal site).1120 Various copper-specific chelating agents inhibit Cu-loaded 2,4-QD, most commonly ethylxanthate, diphenylthiocarbazone, toluene-3,4-dithiol, and diethyldithiocarbamate (DDC).1110,1120 Attempts to use copper chelators like DDC to remove the copper from quercetinase were unsuccessful. Reactivation of quercetinase by divalent metals after inactivation and attempted copper removal with DDC is ascribed to removal of the DDC inhibitor from the copper site by competitive binding to excess free divalent metal, rather than to reconstitution of the active site with another metal.1110
Several recent studies report activity for the bacterial quercetinases with alternative divalent metals, including FeII, NiII, CoII, and MnII. The initial studies of a bacterial 2,4-QD by Bowater et al. and Barney et al. identify 2,4-QD from B. subtillis as an iron-containing enzyme.1113,1114 However, the as-isolated Fe-loaded 2,4-QD has an activity that is 2–3 orders of magnitude lower than that observed for Cu-loaded 2,4-QD while having similar KM(substrate) values (3.8 µM and 0.8 µM respectively for quercetin).1118 This result could reflect the activity of Fe-loaded 2,4-QD being due to 1% or less copper present while the majority of the active sites contain iron and are inert. However, Barney et al. rule this out by showing that Fe-loaded 2,4-QD is not inhibited by copper-specific chelators (ethylxanthate, diethyldithiocarbamate, kojic acid) but instead by 1,10-phenanthroline and 2,2’-dipyridyl, which are better iron chelators.1118 2,4-QDs from B. subtillis and Streptomyces purified in E. coli could also be isolated containing MnII, CoII, or NiII.1118,1119 These enzymes show KM values in the µM range, kcat values at least an order of magnitude lower than those reported for Cu-loaded 2,4-QD, but kcat/KM values similar to those reported for P. olsonii 2,4-QD (8.8×10⁶ M−1 s−1 for Cu-loaded 2,4-QD from P. olsonii;1112 7.9×10⁶ M−1 s−1 and 7.0×10⁶ M−1 s−1 for Mn-loaded and Co-loaded 2,4-QD from Streptomyces1119 with quercetin as the substrate). However, since the KM for P. olsonii was artificially lowered by having a higher % DMSO than was used in the other studies, the correct comparison gives at least a 20 fold higher kcat/KM for Cu-loaded 2,4-QD.
Considering that copper is known to be the native metal in fungal quercetinases, that Cu-loaded 2,4-QD has higher activity, kcat and catalytic efficiency than 2,4-QDs containing other metals, and that in systems with other metals residual copper may be responsible for some of the activity, quercetinase should be regarded as a copper enzyme unless further work establishes the presence of another metal in a native enzyme system.
4.1.3 Structure
Crystal structures of 2,4-QD from A. japonicus have been solved for the resting enzyme at pH 5.2 (PDB ID: 1JUH),1111 the enzyme with the substrates quercetin and kaempferol (Table 36) bound anaerobically (PDB IDs: 1H1I, 1H1M)1124 and the enzyme with the inhibitors diethydithiocarbamate and kojic acid bound (PDB IDs: 1GQG, 1GQH).1125 The crystal structure of B. subtilis 2,4-QD with iron as the active site metal has also been reported, but will not be discussed here (PDB ID: 2H0V).1116
The crystal structure of resting A. japonicus 2,4-QD at pH 5.2 was determined at 1.6 Å resolution by Fusetti et al. after deglycosylation by endoglycosidase-H. 2,4-QD is a ~100 kDa homodimeric protein with 350 amino acid residues.1111 An ordered heptasaccharide chain that was not removed by deglycosylation treatments spans the dimer interface and forms significant surface contacts between the monomers. Each monomer is composed of two similarly structured domains, comprising 2 antiparallel β sheets, 8 strands forming a β sandwich and two α helices (Figure 208). The domains are joined by a linker of 60 amino acid residues, one part of which is disordered in the crystal structure. In each domain there is a large hydrophobic cavity, which in the N-terminal domain contains the copper site. The active site is 10 Å from the protein surface and is solvent-exposed, due to disorder in a 9 amino-acid stretch of the interdomain linker, which would otherwise act as a lid for the hydrophobic active site cavity. Consistent with elemental analysis, only the N-terminal domain of 2,4-QD binds Cu; in the C-terminal domain, the positions occupied by the three His residues which ligate copper in the N-terminal domain are replaced by other non-coordinating residues.1111
Figure 208.

Crystal structure of the A. japonicus quercetin 2,4-dioxygenase dimer. One monomer is colored in blue and one in yellow, with different shades showing the two domains in each monomer. Copper shown in green.
The protein-derived copper ligands are three histidine residues (His66, His68, and His112) and a glutamate residue (Glu73), the first known case of an endogenous carboxylate residue serving as a ligand in a copper protein. Two geometries are observed for the copper site in resting 2,4-QD (Figure 209A and B). The major form (70%, Figure 209A) is a tetrahedral site where the copper is ligated by His66, His68, His112 and a solvent-derived ligand at a bond distance of 2.2 Å from the copper, with Glu73 in an off-copper conformation and H-bonding to the solvent-derived ligand. The minor form (30%, Figure 209B) is a distorted 5 coordinate site in which Glu73 is an additional monodentate ligand to the copper center and the solvent derived ligand shifts to an equitorial position 2.4 Å from Cu and is H-bonded to the non-coordinating O of Glu73. The solvent derived ligand and His68 are the axial ligands of the 5 coordinate site and His66, His112 and Glu73 are the equatorial ligands. The presence of two different forms of the copper site is consistent with EPR studies of the resting enzyme, which show a mixture of two copper species in a pH-dependent equilibrium (vide infra).1121 Modeling quercetin into the active site cavity of quercetinase shows that the shape of the hydrophobic cavity imposes an orientation on quercetin that requires monodentate coordination to copper through its C3-OH group, rather than the bidentate coordination via the C3-OH and C4=O groups that is observed in model complexes.1111
Figure 209.

Structure of the mononuclear copper active site of A. japonicus quercetin 2,4-dioxygenase from X-ray structures. A) Resting quercetin 2,4-dioxygenase site, Glu73-off conformation (major form, 70%). B) Resting quercetin 2,4-dioxygenase site, Glu-on conformation (minor form, 30%). C) quercetin 2,4-dioxygenase enzyme-substrate complex with quercetin. Dotted lines represent hydrogen bonds.
The crystal structures obtained for the ES complex of 2,4-QD with the substrates quercetin (5,7,3’,4’-tetrahydroxy flavonol) and kaempferol (5,7,4’-trihydroxy flavonol) anaerobically bound confirm the binding mode proposed by modelling.1124 The substrates bind through the C3-OH group, displacing the solvent-derived copper ligand (Figure 209C). No disorder is observed in the coordination environment of the copper site in the ES complex. The copper site is a 5-coordinate distorted square pyramid, with His66, His68, His112, and Glu73 as protein-derived ligands (His68 is the axial ligand). The non-coordinating O of the Glu73 ligand is within H-bonding distance of the C3-OH group of the substrate (2.66 Å for quercetin and 2.43 Å for kaempferol), suggesting that the proton of the C3-OH group is retained in a hydrogen bond and that in addition to being a ligand Glu73 may have a mechanistic role as an active site base. Steiner et al. propose that the C3-OH proton is transferred to Glu73 upon substrate binding to quercetinase and this assignment is supported by a DFT calculation of the ES complex performed by Siegbahn.1126 While the pKa’s of the two groups – 4 for Glu and 7 for quercetin – are more consistent with the proton remaining on the quercetin hydroxyl group, that of the C3-OH would be lowered by coordination to the CuII. When bound to quercetinase, the B ring of the substrate is not coplanar with the rest of the molecule, but is instead bent out of the plane by 10–12°, consistent with some sp3 character on the C2 position.1124 While this could indicate radical character on the C2 carbon, EPR spectra of the ES complex do not show the presence of an organic radical or reduction of the copper site (vide infra). Instead, the shape of the active site cavity could account for this distortion, because positioning the B ring to be coplanar with the A and C rings would result in significant steric clashes with two protein sidechains, Phe75 and Phe114. DFT calculations on quercetin show that the bending observed in the crystal structure only costs 1 kcal/mol. The enzyme-substrate binding is further stabilized by van der Waals interactions with many residues in the active site pocket. Particularly, a van der Waals interaction between the A ring of the substrate and Pro164, part of the flexible interdomain linker, leads to ordering of the linker to form a lid on the active site cavity and further stabilize substrate binding. There are no protein-derived hydrogen bond donors in the hydrophobic active site pocket, but two ordered water molecules supply hydrogen bonds to the O7 and O4’ hydroxyl groups of quercetin.1124
Crystal structures of quercetinase with two different inhibitors have also been reported: diethyldithiocarbamate (DDC, KI ~ 10−7 M) and kojic acid (KOJ, KI ~ 10−3 M), the latter a weak inhibitor whose structure resembles the B ring of quercetin.1125 The overall structure of the protein, including the disorder of the linker region that covers the active site, is not changed by the binding of these inhibitors. As in the substrate-bound crystal structures, only one coordination environment for the copper site is observed in the inhibitor-bound structures, but the coordination observed depends on the inhibitor. Both inhibitors bind to the copper site as bidentate ligands, displacing the solvent-derived ligand. DDC coordination yields a 5-coordinate site, with copper ligated by His66, His68, His112 and the two sulfur atoms of DDC. DDC is bound asymmetrically (Cu-S1 2.2 Å, Cu-S2 2.9 Å) in a distorted square pyramidal geometry. Glu73 is rotated away from the copper site to H-bond to a conserved water molecule. In contrast, KOJ yields a 6-coordinate structure with His66, His68, His112, Glu73 (monodentate) and the two oxygens of KOJ as ligands. KOJ coordination is also asymmetric (Cu-O3 1.89 Å, Cu-O4 2.58 Å) due to differences in the nature of the two oxygen ligands (O3 being the alkoxide and O4 the carbonyl). Both inhibitors bind with their molecular planes perpendicular to the observed orientation for quercetin in the active site cavity, blocking access to the portion of the active site pocket that binds the B ring of quercetin. Blocking the active site pocket so that quercetin cannot bind to the enzyme is proposed as a common mode of inhibition for chelating inhibitors.1125
4.1.4 Spectroscopy and Electronic Structure
Absorption, EPR, and XAS spectroscopies have been used to investigate the copper-containing quercetinases from the Aspergillus sources in their resting forms, upon anaerobic substrate binding, and in the product-bound state observed after reaction of the substrate-bound enzyme with O2. As with the X-ray crystallography, the most complete studies have been performed on 2,4-QD from A. japonicus. The spectroscopy of these species in A. japonicus and A. flavus will be discussed first and then compared to the spectroscopy of A. niger, which has some spectroscopic differences.
The absorption spectrum of the resting form of 2,4-QD has been reported by Oka et. al for the A. flavus enzyme. The absorption spectrum contains no absorption peaks in the 350–800 nm range,1120 although very concentrated solutions of the enzyme (2.7 mM in protein) are faintly green colored.1117 This indicates that the resting copper site has no significant ligand to metal charge transfer transitions (Figure 210A), which is consistent with a normal copper site (Type 2) with the ligand set of histidine, water, and possibly a 30% contribution from a carboxylate as reported by X-ray crystallography. The EPR spectrum of the resting enzyme from A. japonicus, reported by Kooter et al., shows a mixture of two species in an approximate 70:30 ratio at pH 6.0 (Figure 211A).1121 The 70% component has g// = 2.330 and A// = 149×10−4 cm−1 while the 30% component has g// = 2.290 and A// = 134×10−4 cm−1. The g and A values of the minor species can be resolved by a pH perturbation of the resting enzyme, since at pH 10.0 the enzyme is reversibly converted to the minor form (Figure 211B, gz= 2.289(4), Az= 128×10−4 cm−1; gy= 2.178(5), Ay= 61×10−4 cm−1; gx= 2.011(3), Ax= 56×10−4 cm−1).1121 Kooter et al. compare these parameters to copper model complexes and suggest that the high pH form of the active site has a trigonal bipyramidal coordination geometry. However, this would have a dz2 ground state with a g⊥ > g// = 2.0, whereas the reported EPR parameters of the high pH site (gz > gy > gx ≈ 2) are characteristic of a distorted tetragonal site with significant dz2 mixing into a dx2-y2 ground state. This is consistent with the two active site geometries observed in the crystallography, performed at pH 6.0, where a tetrahedral form contributes 70% and a distorted 5 coordinate site contributes 30% (vida supra).1111 Cu K edge XAS spectroscopy performed by Steiner et al. is also consistent with this assignment.1122 The XAS spectrum of the resting enzyme at pH 6.0 shows no features in the pre-edge region. Steiner et al. fit the EXAFS spectrum to each of the two possible coordination models observed in the crystal structure (4 coordinate 3His+O at 2.00 Å or 5 coordinate 3His+2O at 2.01 Å) and determined that both models fit the EXAFS spectrum equally well. They use a valence bond sum analysis to suggest that a coordination number intermediate between four and five is consistent with the data, corresponding to a heterogeneous coordination environment with one four-coordinate and one five-coordinate component as observed in both the EPR spectroscopy and X-ray crystallography of resting A. japonicus 2,4-QD.1122
Figure 210.

Absorption spectra of A. flavus quercetin 2,4-dioxygenase: A) resting enzyme at pH 6, B) free quercetin, C) the ES complex of quercetin 2,4-dioxygenase with quercetin, and D) the product spectrum after exposing the ES complex, C, to O2.
Figure 211.

EPR spectra of different forms of quercetin 2,4-dioxygenase from A. japonicus. A) Resting quercetin 2,4-dioxygenase at pH 6 (solid lines represent the major, tetrahedral form and dashed lines represent the minor, 5 coordinate form). B) Resting quercetin 2,4-dioxygenase at pH 10 (only the trigonal bipyramidal form contributes). C) quercetin 2,4-dioxygenase enzyme-substrate complex with 1 eq. quercetin (2.5% DMSO). D) quercetin 2,4-dioxygenase enzyme-product complex observed after exposure of (C) to air.
Upon anaerobic incubation of the resting enzyme with the flavanol substrates: quercetin, morin, and 3-hydroxyflavone, the absorption spectrum is dominated by the absorption band of the substrate, shifted to lower energy into the 300–500 nm region due to binding to the enzyme (free quercetin absorption Figure 210 B, ES complex Figure 210C).1120 The shift in the wavelength of substrate absorption upon addition to the enzyme does not occur if the enzyme had been preincubated with a copper chelating agent (e.g. ethylxanthate). This is consistent with substrate binding to the copper site of A. flavus 2,4-QD under anaerobic conditions. Additionally, EPR spectra have been reported after anaerobic incubation of A. japonicus 2,4-QD with a variety of flavonol substrates: quercetin, kaempferol, galangin, myricetin, morin, datiscetin, fisetin, 7-hydroxy flavonol, and flavonol.1121 A single CuII species is observed in these EPR spectra with g// = 2.310–2.337 and A// = 110–142 G, depending on the substrate (quercetin yields g// = 2.336 and A// = 124×10−4 cm−1, Figure 211C). These parameters are similar to those observed for the dominant species in the resting enzyme, characterized by X-ray crystallography as a tetrahedral site without Glu73 bound to Cu. However, the substrate-bound site characterized by X-ray crystallography is 5-coordinate with Glu73 bound, nominally more similar to the minor component of the resting enzyme.1124 No reduction of CuII to CuI or evidence of an organic radical is observed upon substrate binding in EPR spectra recorded at 77 K, which contrasts a substrate radical suggestion based on the pyramidalization of the substrate C2 carbon in substrate-bound crystal structures.1121 Steiner et al. also report the XAS spectra of 2,4-QD with the substrates quercetin and myricetin bound.1122 The absence of a pre-edge feature at 8984 eV (characteristic of CuI complexes) and the consistent position and shape of the K-edge in the resting enzyme and the substrate-bound enzyme additionally demonstrate that there is no reduction of the copper site upon substrate binding, consistent with the EPR data. The EXAFS data for the substrate bound 2,4-QD are best fit as a single species with a single shell of 3 His and 2 O ligands with an average distance of 2.00 Å. Attempts to refine the fit to include two shells of ligands yielded a possible fit to shells at 1.96 Å and 2.05 Å, but Steiner et al. set aside these results because of insufficient resolution in their data.1122 These EXAFS results agree with the conclusions from X-ray crystallography and EPR spectroscopy of the ES complex that substrate coordination imposes order on the coordination environment of the copper site (vide supra).
When samples of the substrate-bound enzyme are exposed to oxygen, turnover occurs and the absorption band of the bound substrate decays, resulting in a featureless absorption spectrum similar to that of the resting enzyme (Figuer 210D).1120 However, the EPR spectrum of the product when EPR samples of the ES complex are exposed to O2 is different from that of the resting enzyme (Figure 211D, a single species with gz = 2.295(4), Az = 131×10−4 cm−1; gy = 2.169(5), Ay = 43×10−4 cm−1; gx = 2.014(3), Ax = 63×10−4 cm−1).1121 The spectrum after turnover is very similar to a spectrum of the product-bound enzyme obtained by adding the depside product to resting 2,4-QD and spectral features of the resting enzyme could be recovered by repeated buffer exchange. On this basis, Kooter et al. identify the species after turnover as the enzyme with the product bound at the copper site.1121 However, the spectrum after turnover is also very similar to the minor component of the resting site (observed cleanly at high pH) and this similarity should be investigated. A detailed spectroscopic study is required to elucidate the electronic structure of the resting, substrate-bound, and product-bound 2,4-QD.
There are large differences between the spectroscopic data reported for 2,4-QD from A. japonicus (discussed above) and those reported by Hund et al. for 2,4-QD from A. niger.1110 The EPR spectrum of resting 2,4-QD from A. niger shows contributions from only one species, which has g// = 2.293 and A// = 166×10−4 cm−1 and a superhyperfine contribution to the g⊥ region. Simulation of the g⊥ region without the superhyperfine contribution lead to values of gy = 2.055, gx = 2.01 and Ay = Ax = 9×10⁻⁴ cm−1. The superhyperfine contribution is a pattern of nine lines split by 13 G in the g⊥ region, indicating coupling with 4 equivalent nitrogen ligands. However, A. niger and A. japonicus 2,4-QD have 66% sequence similarity and there are no additional His residues in the vicinity of the A. niger 2,4-QD active site. Indeed, all the key active site residues (copper ligands and key second sphere residues involved in substrate binding) are conserved.1112 This raises the possibility that there may be an exogenous ligand bound in A. niger 2,4-QD. The EPR spectrum does not change upon anaerobic addition of substrate, which would be expected if the active site were blocked by the binding of an exogenous ligand.1110 Alternatively, the lack of change in the EPR spectrum upon anaerobic addition of quercetin may be due to substrate insolubility in the absence of added DMSO (vide supra). These differences in EPR spectroscopy between 2,4-QD from A. niger and A. japonicus have been previously interpreted by Kooter et al. as an indication that there is a significantly different coordination environment in the A. niger resting enzyme and an alternative mechanism for 2,4-QD activity may be required.1121 However, in view of the high degree of sequence similarity between the enzymes, the origin of the spectroscopic differences needs to be clarified further by structural and spectroscopic studies of A. niger 2,4-QD before any conclusions can be drawn about whether there are in fact significant structural or mechanistic differences from A. japonicus 2,4-QD.
4.1.5 Molecular Mechanism
A general mechanism has been proposed for quercetinase, on the basis of the structural and spectroscopic studies of the enzyme ES complex (Figure 212).1124 The resting copper site exists in equilibrium between a Glu73-off form (1A) and a Glu73-on form (1B). Substrate binds to the copper site as a monodentate ligand via the C3-OH group (2A), which is deprotonated and hydrogen bonds with Cu-on Glu73. The CuII-substrate complex is throught to be in an equilibrium with a CuI-substrate radical complex (2B) formed by an intramolecular electron transfer, but this equilibrium is shifted far to the left, so the CuI-substrate radical form is not experimentally observed (alternatively, this step has been described by Siegbahn as the formation of an excited state of the CuII-substrate complex, vide infra). After formation of the CuI-substrate radical, O2 could react at the substrate radical (3A) or at CuI, forming a CuII-superoxo species (3B). Formation of the C2-O bond is followed by formation of the second C-O bond at C4, forming an endoperoxide intermediate (4). This endoperoxide intermediate decays in a concerted step, which includes O-O bond cleavage and the release of CO, to form the depside product (5).
Figure 212.

Proposed mechanism for the 2,4-dioxygenation of quercetin by 2,4-QD.
Siegbahn has used DFT calculations to evaluate this reaction pathway and particularly distinguish between the two possible sites where O2 could react in a CuI-substrate radical complex.1126 His results show that the formation of the CuII-superoxide is 14 kcal/mol lower in energy than O2 attack on the substrate radical. Reaction between the ES complex and O2 is the rate limiting step of the reaction, with ΔH = 9.6 kcal/mol (a transition state and barrier for this step were not calculated). The entropy loss in this step is estimated to be ~5 kcal/mol, yielding ΔG = 14.6 kcal/mol (entropy contributions were not included in the calculations of the other steps of the reaction). Upon formation of the CuII-superoxo, the quercetin radical dissociates from the copper site (Figure 212 3B) and rotates relative to copper so that attack of the superoxide on C2 from the top becomes possible with ΔH‡ = 1.1 kcal/mol and ΔH = −18.3 kcal/mol. Formation of the second C-O bond to yield the endoperoxide intermediate then proceeds with ΔH‡ = 7.1 kcal/mol and ΔH = 1.7 kcal/mol. In this step, the hydrogen bond from Glu73 shifts from O3 to O4, stabilizing the extra charge on C4. The subsequent concerted O-O bond cleavage and CO release has ΔH‡ = 0.2 kcal/mol and is highly exothermic, with ΔH = −101.8 kcal/mol. The whole reaction is exothermic by 96.7 kcal/mol.1126 The point at which these calculations substantially disagree with experimental results is in the attack of the CuII-superoxo on the quercetin radical. The dissociation of the quercetin radical from CuII and its repositioning prior to superoxo attack may also not be possible given the constraints of the substrate binding pocket. Indeed, Steiner et al. suggest that the CuII-superoxo attack on C2 may not be geometrically possible if quercetin is constrained in the position observed in the crystal structure of the ES complex.1124
Some mechanistic insight into the reaction performed by 2,4-QD has been obtained from model complex studies. The dioxygenation of the simplest flavonol, 3-hydroxyflavone, occurs in the presence of O2 under many conditions, including base-catalyzed dioxygenation in protic and aprotic solvents,1127,1128 radical-initiated dioxygenation,1129,1130 stoichiometric dioxygenation of ZnII,1131 CoII,1132 CuII,1133 and CuI1134 flavonolate compounds, and dioxygenation catalyzed by CuII model complexes with nitrogen donor ligands.1133,1134 Several recent reviews cover this model chemistry.1132,1135 When the flavonol is deprotonated, the free flavonolate anion reacts with O2, yielding the same products as the enzymatic reaction. A study of the reaction of potassium flavonol with O2 has shown that in the absence of a redox-active metal this reaction proceeds by a single electron transfer pathway in which the deprotonated flavonolate directly transfers an electron to O2 in a rate-limiting outer sphere electron transfer step.1128 The reaction has a first order dependence on O2 and free superoxide has been detected by nitro blue tetrazolium in these reactions while the flavonolate radical has been observed by EPR. Radical coupling of the flavonolate radical and superoxide produces a peroxide which goes to the product via an endoperoxide intermediate, resulting in incorporation of both atoms of O2 into the depside product (verified by 18O2 labelling). However, the rate of the reaction of flavonolate with O2 is rather slow, as indicated by a second order rate constant for non-enzyme potassium flavonolate dioxygenation of 0.33±0.01 M−1 s−1 at 80°C in DMF.1128 This contrasts with a high catalytic efficiency for the enzyme reflected by a kcat/KM on the order of 1×10⁸ M−1 s−1 at room temperature and pH 6, where the flavonol rather than the flavonolate is present (in 20% DMSO, vide supra).1112 Thus the reaction catalyzed by 2,4-QD involves an activation of the flavonol substrate towards reaction with O2 rather than simple deprotonation of the flavonol by 2,4-QD followed by direct reaction of the flavonolate with O2.
Attempts have been made to obtain further insight into the CuII substrate activation process that is involved in enzymatic catalysis by studying CuII flavonolate complexes of the form CuIIL(fla), where L is a chelating nitrogen donor ligand. Interestingly, a comparison of the rates of dioxygenation for representative CuII, CuI and ZnII model complexes (Table 37) shows that the transition metal-containing complexes react with O2 three orders of magnitude slower than potassium flavonolate under similar conditions and that there is little difference between the rates observed for similar CuII, CuI, and ZnII complexes. For each of these reactions, a second order rate constant for the dioxygenation reaction was obtained from the rate law k2[fla][O2], showing that a bimolecular reaction with O2 is the rate-limiting step.
Table 37.
Representative kinetic parameters for the stoichiometric reduction of various flavonolate model complexes with O2
Thus, coordination of the flavonolate to a transition metal decreases its reactivity towards O2. This can be rationalized by considering that coordination to a metal will lower the energy of the flavonolate HOMO through bonding interactions with the metal (a Lewis acid interaction, in the case of ZnII or CuI), making the flavonolate harder to oxidize. Therefore, the coordinated flavonolate will be less reactive towards the single electron transfer mechanism that leads to dioxygenation of the free flavonolate. It is possible that the reported reactivity of these complexes is due to ligand dissociation, yielding a small amount of free flavonolate in solution which then reacts with O2, a mechanism that has not been directly tested.
This leads to an interesting issue as to the nature of the substrate activation performed by the 2,4-QD enzyme and how the enzyme differs from the CuII model complexes, such that coordination to CuII in the enzyme activates the flavonol substrate rather than deactivating it by making the flavonolate harder to oxidize. A key structural difference between the 2,4-QD ES complex and known CuII flavonolate model complexes may contribute to this difference. The model complexes all bind flavonolate as a bidentate ligand via the C3 hydroxyl and the C4 carbonyl groups, in contrast to the enzyme, which binds the substrate as a monodentate ligand. These different coordination modes will lead to different orbital interactions and monodentate coordination may lead to an electronic structure that is more favorable for O2 attack. Pap et al. argue that a monodentate or asymmetric bidentate coordination mode will increase the radical character on the flavonolate ligand, allowing direct reaction with O2 without requiring an initial slow outer-sphere electron transfer as in the free flavonolate reaction.1135
Additionally, some CuII flavonolate model complexes, typically those with phenanthroline or bipyridyl ligands or of the form CuIIL(fla)2, perform a different dioxygenation reaction from the enzyme.1137 These yield an O-benzoylsalicylic acid product, produced by a 2,3- rather than a 2,4-dioxygenation of 3-hydroxyflavone. This alternative dioxygenation proceeds through a 1,2-dioxetane intermediate which decays via chemiluminescence, rather than the endoperoxide intermediate proposed for the enzyme. Thus, there are two possible dioxygenation pathways from a proposed intermediate alkylperoxide: attack on the C4 carbonyl, leading to an endoperoxide intermediate, or peroxidation of the double bond by attack on C3 to form a 1,2-dioxetane intermediate (Figure 213). The factors in the active site of 2,4-QD that direct the enzymatic reaction toward the endoperoxide rather than the 1,2-dioxetane route (and therefore perform 2,4-dioxygenase rather than 2,3-dioxygenase chemistry) are an interesting topic for future study.
Figure 213.

Alternative 2,4 dioxygenation routes observed in CuII flavonolate model complexes.
4.2 Cofactor Biogenesis in the Copper Amine Oxidases
4.2.1 Enzymology
The copper-containing amine oxidases are a family of enzymes found in all forms of life excepting Archaea (EC 1.4.3.21 and EC 1.4.3.22; note that not all amine oxidases are copper-containing). Amine oxidase (AO) performs the oxidation of primary amines and diamines to aldehydes and ammonia, producing H2O2 as a byproduct (Figure 214). AO is a quinoprotein, containing a protein derived organic cofactor, 2,4,5-trihydroxyphenylalanine quinone (topaquinone, TPQ), which is the key reactive functionality of the active site. The active site also contains a Type 2 or normal copper site. A wide variety of roles have been discovered for AO in biochemical processes. In prokaryotes and yeast, AO allows the organism to use amines as the sole source of carbon and nitrogen for cell growth.1138 In plants, AO is associated with cell wall formation and wound healing.1139 In mammals, the role of AO is less clear and multiple roles are likely, including amine metabolism, cell signaling (via H2O2), and amine-promoted apoptosis.1140 High levels of AO in serum are associated with a variety of diseases, including type 1 and type 2 diabetes, liver disease, hypertension, atherosclerosis, and congestive heart failure.1141–1144 AO is being investigated as a treatment for anaphylaxis (for its anti-histamine properties) and has been considered as an antitumor agent (due to its role in apoptosis).1145,1146
Figure 214.
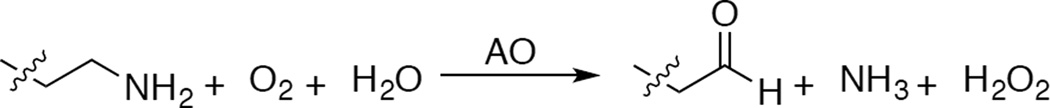
Oxidation of amines to aldehydes catalyzed by amine oxidase.
AO has been isolated from eubacteria (Escherichia coli ECAO;1147 Arthrobacter globiformis AGAO1148), yeasts (Hansenula polymorpha, HPAO;1149 Pichia pastoris, PPLO1150), plants (pea seedling, PSAO;1151 lentil seedling, LSAO1152), and mammals (bovine serum, BSAO;1153 pig kidney, PKAO;1154 human vascular adhesion protein-1, VAP-1;1155 human diamine oxidase, hDAO1156). AOs from different sources have relatively low sequence similarity, despite having similar tertiary and active site structures (vide infra). The sequence similarity typically falls in the range of 20–30% of residues identical, excepting BSAO and VAP-1, which have 84% of residues identical.1157 However, several key active site residues are strictly conserved in all AOs, including a consensus sequence containing the covalently bound cofactor (Thr-X-X-Asn-Tyr-(TPQ)-Asp/Glu-Tyr), an Asp proposed to be the active site base involved in catalysis, and a Tyr residue that hydrogen bonds to the cofactor.1158
It was recognized early in the study of AOs that the enzymes contain a novel chromophore, a cofactor that contains a carbonyl group that reacts with phenylhydrazine.1159 This chromophore was originally proposed to be the known cofactor pyridoxyl phosphate, but this was ruled out by comparison of the resonance Raman spectra of the phenylhydrazine derivatives.1160 Following the suggestion that the cofactor was a quinone, a covalently bound form of pyrroloquinoline quinone (PQQ) was proposed, since protein digestion of phenylhydrazine-derivatized protein gave a low molecular weight molecule identical by HPLC to the phenylhydrazine derivative of pyrroloquinoline quinone.1161,1162 However, attempts to confirm this identity for the cofactor were unsuccessful, and finally Janes et al. were able to isolate the cofactor-containing peptide fragment and show by MS and NMR that the cofactor was not PQQ but rather the wholly novel protein-derived cofactor 2,4,5-trihydroxyphenylalanine quinone (TPQ).1163 Subsequent work by Mu et al. showed that the cofactor is formed through a post-translational modification reaction (cofactor biogenesis) where a precursor Tyr residue is modified to TPQ.1164 It was further demonstrated that cofactor biogenesis of TPQ from the precursor Tyr occurs by a self-catalyzed reaction involving the mononuclear CuII site and O2 rather than by a chaperone protein.1165,1166
The active site of AO therefore performs two quite different reactions: the first turnover (the cofactor biogenesis reaction), which processes Tyr to TPQ, and, after the cofactor has been formed, the catalytic oxidation of amines.1167 The cofactor biogenesis reaction involves substrate activation by CuII, while in catalytic turnover the copper site plays a role in activating O2 for reduction during regeneration of the cofactor. A comprehensive review of cofactor biogenesis in a series of enzymes is presented in this thematic issue by Klinman et al. Here we focus on the biogenesis reaction as it relates to the broad theme of substrate activation by an oxidized CuII active site.
The catalytic turnover of AO proceeds in two half reactions, the reductive half reaction, in which amines are converted to aldehydes and the TPQ cofactor is reduced to an aminoquinol (TPQN-red, Figure 215A) and the oxidative half reaction, in which O2 reacts with the active site to regenerate the oxidized TPQ cofactor and release hydrogen peroxide and ammonia (Figure 215B).856 The mechanism of the reductive half reaction is well established.1168 The primary amine substrate reacts with the C5 carbonyl of TPQ, forming a Schiff base. Deprotonation of the α carbon of the amine substrate converts this to a product Schiff base, reducing the cofactor. Hydrolysis of this Schiff base releases the product aldehyde, leaving TPQN-red. There is continuing controversy, however, over the mechanism of the oxidative half reaction and the role that the copper site plays in this process.856 The resting TPQN-red site obtained after reduction of the protein by the substrate amine exists in equilibrium between a CuII-aminoquinol form and a CuI-semiquinone form (Figure 215B), which can be observed directly in the absorption and EPR spectra of the resting substrate reduced AO from certain sources (PSAO, AGAO)1169,1170 but is not observed in AOs from other sources (HPAO, BSAO).1171,1172 In AOs where the CuI-semiquinone form has been observed, a mechanism for the reductive half reaction has been proposed where O2 is activated by the CuI site in the CuI-semiquinone form of the reduced site and subsequently oxidizes the cofactor back to TPQox, releasing NH3. Single turnover kinetics experiments on the reaction of O2 with amine-reduced AGAO, performed by Shepard et al., confirm that the CuI-semiquinone reacts rapidly with O2 and oxidation of the aminoquinol cofactor proceeds through the CuI-semiquinone.1173 In contrast, the reaction of O2 with amine-reduced HPAO, where the CuI-semiquinone form is not observed, proceeds at the same rate in CuII-reconstituted and CoII-reconstituted enzyme.1174 This suggests that the oxidation of the cofactor proceeds by an outer sphere electron transfer to O2, with the metal site later involved in stabilizing the superoxide generated in this step. Thus, there is ongoing controversy as to whether the oxidative half-reaction in the catalytic turnover of AO proceeds by an inner sphere or an outer sphere mechanism and whether copper is involved in redox chemistry or just provides a charge stabilization effect.
Figure 215.

Amine oxidation catalyzed by TPQ-containing amine oxidases. A) Reductive half-reaction. B) Oxidative half reaction of AO, including the proposed equilibrium between CuII-aminoquinol and CuI-semiquinone forms of the amine-reduced site.
Lysyl oxidase (LOX) is a specific AO involved in the cross-linking of collagen and elastin during the maturation of connective tissue. LOX has been purified from Drosophilia.1175 LOX from Drosophilia has been shown to be a 38 kDa monomeric protein that contains a similar mononuclear copper active site to other AOs but contains a different covalently-bound cofactor, lysine tyrosylquinone (LTQ).1176,1177 As with other AOs, the biogenesis of the cofactor is a self-processing reaction requiring CuII and O2 to transform a Tyr and a Lys residue to LTQ.1175 The mechanism of LTQ biogenesis is closely related to that of TPQ biogenesis and very little independent study of it has been performed. Instead, the majority of studies have been done on TPQ biogenesis and can be related to LTQ biogenesis (vide infra).
Protein-derived cofactors have also been observed in other enzyme systems.1178 Most are crosslinked amino acid residues closely associated to a metal site, like the Cys-His crosslink found in some binuclear copper proteins (mollusc hemocyanin, plant catechol oxidase and fungal tyrosinase, mentioned above), the His-Tyr crosslink in the active site of CcO and the Tyr-Cys radical cofactor in GO (vide supra). These crosslinked cofactors can perform a structural role in the protein or perform redox chemistry in catalysis by donating or accepting an electron (CcO, GO). Quinone cofactors like TPQ and LTQ add an electrophilic site in the protein and are involved in the catalysis of reactions with amines. These are the only quinone cofactors that do not require an external mechanism but instead have self-catalyzed biogenesis reactions involving CuII. This copper dependent biogenesis reaction is the focus of this section.
4.2.2 Kinetics
Apo-AO (protein lacking TPQ and copper cofactors) can be prepared in metal free conditions and is isolated with the precursor Tyr instead of with TPQ. The apo enzyme can be reconstituted with divalent metals to study the kinetics of TPQ biogenesis (apoAO reconstituted anaerobically with CuII is referred to as “preprocessed AO” and contains the copper cofactor but lacks TPQ).1166 Defining the preprocessed CuII site and the initial reaction of this site with O2 are key to understanding the nature of the substrate activation involved in AO cofactor biogenesis.
The stoichiometry of the TPQ biogenesis reaction has been measured by Ruggiero et al. using a spectrophotometric assay to monitor H2O2 production (measuring formation of a quinoneimine dye) and monitoring O2 consumption using a Clark electrode.1179 These experiments confirmed that 2 moles O2 were consumed per TPQ produced and 1 mole H2O2 was generated in the process. Nakamura et al. have determined that the C2 carbonyl of TPQ is derived from solvent, because the stretching frequency of this carbonyl observed in the resonance Raman spectrum shifts when the biogenesis reaction is performed in H218O.1180 The origin of the C5 carbonyl could not be determined, because this oxygen undergoes exchange with the solvent, but it is presumed to come from O2. Ruggerio et al. have also demonstrated that the rate of TPQ biogenesis is not affected by the concentration of CuII above stoichiometric amounts, indicating that only copper bound in the active site participates in the biogenesis reaction.1181 In some biogenesis experiments reported in HPAO, only a third of the available sites are oxidized to TPQ. This may reflect incomplete copper loading in these experiments (vide infra).1182
Initially, it was assumed that CuII was the redox state active in TPQ biogenesis because, upon reconstitution of the apo-enzyme with CuII in the presence of O2, the TPQ biogenesis reaction proceeds spontaneously.1166 CuII has been confirmed to be the active redox state by Samuels and Klinman by comparing the rate of TPQ biogenesis in apo-HPAO reconstituted with CuII with the rate observed in apo-HPAO reconstituted with CuI.1183 When apo-HPAO is reconstituted with CuII and exposed to air, TPQ forms with kTPQ = 0.08±0.03 min−1, while when the apo enzyme is reconstituted with CuI, the rate of biogenesis is slower by a factor of 17, with kTPQ = (4.7±0.2)×10−3 min−1. Samuels and Klinman also used EPR spectroscopy to monitor the redox state of Cu during the biogenesis reaction of CuI-reconstituted HPAO. No CuII intermediate species is observed and the rate of oxidation to CuII obtained from the EPR experiment is identical to the rate of TPQ formation, indicating that oxidation of CuI to CuII is rate-limiting. At the end of the reaction, only 26% of the active site has been transformed to TPQ, which corresponds 1:1 with the amount of loaded CuI that has been oxidized to CuII. This result further confirms that oxidation from CuI to CuII is required for the biogenesis reaction to proceed. This definitively establishes that the biogenesis reaction involves a CuII substrate activation process.
During the biogenesis of preprocessed HPAO, an intermediate with an absorption band at 350 nm (ε≈3200 M−1 cm−1) is observed.1184 The intermediate forms with a rate constant of 0.51±0.01 min−1 and decays with a rate constant of 0.076±0.003 min−1, which is identical to the rate of TPQ formation in air (kTPQ = 0.08±0.03 min−1). An isosbestic point is observed between the 350 nm intermediate and the 480 nm band of the product TPQ, indicating that the decay of the 350 nm intermediate is rate-limiting in TPQ formation. The amount of the 350 nm intermediate that accumulates is greater by a factor of 3 when the biogenesis reaction is performed at pH 8.5 relative to when it is performed at pH 7. This is associated with a 5-fold increase in the rate of biogenesis going from pH 7 to pH 9, with a pKa of 8.45. The 350 nm intermediate has been tentatively assigned as a CuII-tyrosinate species (vide infra) and the pKa of 8.45 attributed to the precursor Tyr, deprotonation of which would lead to greater accumulation of a CuII-tyrosinate species. Despite this central role proposed for the 350 nm intermediate in biogenesis in HPAO (its decay is rate-limiting and it is assigned as the key intermediate in CuII substrate activation, see section 4.2.5), the 350 nm intermediate is not observed in biogenesis in AGAO.1181 The rate of biogenesis is also an order of magnitude slower in HPAO than in AGAO (kTPQ (HPAO) = 0.16±0.008 min−1, kTPQ (AGAO) = 1.5±0.2 min−1 at saturating O2). The dependence of kTPQ on the concentration of O2 (vide infra) accounts for the difference between the value of kTPQ(HPAO) = 0.08±0.03 min−1 reported above for experiments in air and the value for kTPQ(HPAO) reported for saturating O2 (kTPQ = 0.16±0.008 min−1). Since the rate of TPQ formation is faster in AGAO than in HPAO, DuBois and Klinman suggest that the 350 nm intermediate may occur in AGAO, but on a faster timescale that could potentially be observed with stop-flow techniques.1185 Another option is that the relative rates of different steps in the biogenesis reaction may differ between HPAO and AGAO, so that the 350 nm species does not accumulate in experiments with AGAO. The observation of this key intermediate in biogenesis in HPAO but not in other AOs is an issue that remains to be resolved in refining the mechanism for TPQ biogenesis.
The effect of a range of variables on the kinetics of TPQ formation has been evaluated in order to identify the nature of the rate-limiting step in TPQ biogenesis or at least rule out certain possibilities. The consumption of O2 during the reaction can be measured directly and exhibits single phase kinetics.1186 Since two molecules of O2 are consumed in this reaction, single phase kinetics for O2 consumption indicates that reaction of the first molecule of O2 is slow relative to reaction of the second O2. Deuteration of the precursor Tyr ring at the C3 and C5 positions has no effect on the rate of biogenesis, which rules out decay of a proposed aryl-peroxide intermediate as a possible rate-limiting step (since this would involve deprotonation of the ring at the C5 position).1182 The rate of biogenesis is not affected by buffer viscosity, so O2 binding to the protein is not rate-limiting.1186 These results are consistent with the proposal of Klinman et al. that the rate limiting step is attack of the first molecule of O2 on the preprocessed site, after prebinding of O2 to a binding pocket in the protein (required by a faster rate for O2 consumption than TPQ formation, vide infra).1182 A rate-limiting step of O2 attack on a CuII-tyrosinate species is also consistent with DFT calculations performed by Prabhakar and Siegbahn on the biogenesis reaction (see Section 4.2.5).1187 The temperature dependence of the rate of biogenesis has been measured by Schwartz et al., who obtain an Arrhenius activation energy of Ea = 8.4±0.5 kcal/mol for the rate-limiting step in TPQ biogenesis.1186 Definitive identification of the rate-limiting step is required in order to interpret the chemical significance of this activation energy.
In a variety of kinetic experiments performed on TPQ biogenesis, particularly those that measure the dependence of rates on the concentration of O2, the biogenesis reaction is initiated by adding CuII to a solution of the apo-enzyme that has been preequilibrated with a known concentration of O2.1182,1186 This contrasts with the method previously described for studying biogenesis (vide supra), in which apoAO is anaerobically pre-loaded with CuII and TPQ biogenesis is initiated by exposing the preprocessed enzyme to O2.1181,1184 Several kinetic studies directly compare rate constants and kinetic parameters obtained by these two methods, which requires the assumption that CuII binding to the active site of AO (an additional kinetic step in the aerobic CuII addition method) is fast. To establish that this assumption is valid, Schwartz et al. report identical rates for TPQ biogenesis measured using the two methods, which implies that CuII binding is fast relative to biogenesis.1186 However, in biogenesis experiments initiated with CuII addition, the 350 nm intermediate previously observed when preprocessed HPAO reacts with O2 does not accumulate, suggesting that the rate limiting step changes when biogenesis is initiated by adding CuII aerobically.
Instead, in experiments where TPQ biogenesis is initiated by adding CuII, a species with a 380 nm absorption band is observed to accumulate rapidly and decay with a rate constant of k380 = 0.06±0.01 min−1, which is identical to the rate of TPQ formation (kTPQ = 0.08±0.03 min−1 under these conditions).1184 However, this species is observed when copper is added to HPAO even when the active site is already occupied by CuII or ZnII. In addition, in mutated active site variants of HPAO in which the rate of biogenesis is significantly decreased, the kinetics of growth and decay of the 380 nm species are not altered. Therefore, Dove et al. conclude that the 380 nm species is not involved in the biogenesis reaction since it is not an active site copper species. DuBois and Klinman have subsequently proposed that the 380 nm absorption feature may be due to a transient copper binding site involved in Cu loading into the active site.1185 The rate of copper binding in AOs other than HPAO has also not been investigated and whether CuII binding contributes to the kinetic and spectroscopic data for TPQ biogenesis in AGAO is not known.
The rate of TPQ biogenesis is dependent on the concentration of O2. This dependence has been measured by DuBois and Klinman, enabling a comparison between the rates of TPQ formation and O2 consumption (CuII addition to apoHPAO was used to initiate biogenesis in these experiments).1182 The dependence of kTPQ on the concentration of O2 is hyperbolic with kmax = kTPQ(sat’d O2) = 0.16±0.008 min−1 and KM= 233±35 µM (these do not correspond to Michaelis-Menten kcat and KM values because the biogenesis reaction is a single-turnover process). The kinetics of O2 consumption during the biogenesis reaction have also been measured and saturation kinetics are observed with a kmax(O2) = kO2(sat’d O2) = 0.27±0.02 min−1 and KM= 216±45 µM. An interesting feature of these results is that O2 is consumed faster than TPQ is produced. DuBois and Klinman propose that O2 binds in an O2 binding pocket before reaction with the preprocessed active site during TPQ formation. Another interesting observation that can be made from comparison to previous experiments is that the 350 nm intermediate is formed faster than O2 is consumed. If the 350 nm species is formed without the participation of O2 but is triggered by O2 being present (as proposed by Dove et al.),1184 this suggests that the 350 nm intermediate is a CuII-tyrosinate complex formed due to an O2 triggered conformational change of the active site. However, the faster rate of 350 nm intermediate formation relative to O2 consumption could also be due to the different experimental conditions, since the O2 consumption was initiated by adding CuII to aerobic apoHPAO while the spectroscopic experiments were initiated by adding O2 to preprocessed HPAO with CuII preloaded.
Attempts to chemically trap a CuI-tyrosyl radical intermediate in biogenesis have been unsuccessful. Addition of DEANO (a reagent used to generate NO in situ) to the biogenesis reaction had no effect on TPQ formation, indicating that no tyrosyl radical accumulates during the reaction.1184
Several variants of first and second sphere active site residues have been used to gain insight into the cofactor biogenesis reaction. Mutation of His ligands at the CuII site (vide infra) to non-coordinating residues in AGAO (H431A, H433A, H592A) leads to no formation of TPQ, underlining the importance of the copper site in TPQ biogenesis.1188 A variant of one of these His ligands to Cys in HPAO (H624C) does perform TPQ biogenesis, but at a greatly reduced rate (kTPQ = 0.07±0.04 hr−1).1184 The intermediate previously observed in WT HPAO also accumulates in H624C, but the absorption band is shifted to 390 nm with an order of magnitude slower formation and decay (kform = 0.042±0.003 min−1, kdecay = kTPQ = 1.2×10⁻³ min−1). Interestingly, the mutation of a second sphere Met residue which forms part of the putative O2 binding pocket in the holo enzyme (M634) shifts the intermediate absorption maximum to energy as well as retarding the rate of biogenesis.1182 The magnitude of this effect on the rate is linearly related to volume of the hydrophobic sidechain that replaces M634, which DuBois and Klinman interpret to mean that M634 forms part of binding pocket for O2 in the active site. Finally, mutation of a conserved active site Tyr residue, which H-bonds to the TPQ cofactor in the holo enzyme (Y305A, Y305F), results in an alternative product for the biogenesis reaction, identified by an absorption feature at 400 nm.1189 The formation of TPQ relative to the alternative product is pH dependent, with TPQ primarily formed at low pH, while the 400 nm product forms at high pH. The 400 nm product exhibits no reactivity with phenylhydrazine and is, therefore, not a quinone. The 400 nm species was originally proposed to be an alkyl-peroxide and it has recently been confirmed by X-ray crystallography that the product is a doubly-peroxidated ring (see Section 4.2.3).1190
Contrary to early reports about TPQ biogenesis, metals other than copper are also competent to perform the reaction, albeit at greatly reduced rates. CoII, NiII, and ZnII bind tightly to apo-AO and cannot be displaced by subsequently added CuII.1191 ZnII is inert with respect to TPQ biogenesis, but TPQ is slowly formed in CoII-AGAO and NiII-AGAO in the present of saturating O2 with kTPQ(CoII) = 0.079±0.002 hr−1 and kTPQ(NiII) = 0.075±0.001 hr−1. Biogenesis with an alternate metal is also observed in NiII-HPAO with kTPQ(NiII) = 0.044±0.001 hr−1 and Ni remains EPR-silent throughout the reaction.1192 The rate for TPQ biogenesis with an alternate metal is over three orders of magnitude slower than the rate of biogenesis with CuII and thus could be due to trace copper in the metal salt. Okajima et al. address this by using high purity CoII and NiII salts and additionally showing that intentional doping of 5% CuII in the CoII or NiII does not perturb the rate of biogenesis, indicating that trace CuII is not responsible for the observed reaction.1191 Instead, the large difference in rates may indicate that biogenesis proceeds by a different mechanism with other metals. It is interesting to note that redox activity may not be necessary for cofactor biogenesis, since NiII and CoII will perform the reaction, but the metal must also be more than just a Lewis acid, since ZnII is inert. The nature of substrate activation by metals, and particularly by CuII, which is most active in this reaction, becomes an even more interesting question in light of these results.
To summarize, the kinetics studies that have been performed on TPQ biogenesis have shown that; a) CuII performs this reaction, not CuI, and CuII is significantly better than other divalent metals; b) an intermediate can be observed in biogenesis in HPAO that is proposed to be a tyrosinate CuII LMCT species; c) decay of this intermediate is the rate limiting step in biogenesis and d) O2 prebinding in an O2 binding pocket occurs during biogenesis. The rate-limiting step of biogenesis must involve the first equivalent of O2 but is not the decay of an aryl-peroxide. These kinetics suggest that the ratelimiting step of cofactor biogenesis is the step involving the CuII substrate activation process. Spectroscopic and structural studies that identify the observed intermediate and the rate-limiting step would be valuable in elucidating the mechanism. In addition, differences observed in the kinetics of biogenesis between HPAO and AGAO and between the two different methods for studying biogenesis in HPAO (CuII initiated and O2 initiated) need to be resolved. Additionally, CuII binding to the protein could have a significant effect on some of these kinetics results but has yet to be thoroughly investigated.
4.2.3 Structure
X-ray crystal structures of copper amine oxidases have been reported from a variety of organisms, including from eubacteria (e.g. AGAO), yeasts (e.g. HPAO), plants (e.g. PSAO) and mammals (BSAO and VAP-1). The majority of these crystal structures are of the processed enzyme, including wild-type and mutanted variant structures, inhibitor complexes, and structures with Xe to characterize potential O2 channels. Only the few crystal structures relevant to understanding the CuII substrate activation involved in cofactor biogenesis will be discussed here. A summary of the available crystal structures of processed copper amine oxidases is presented in Table 38.
Table 38.
Crystal structures of processed copper amine oxidases deposited in the Protein Data Bank as of October 10, 2012.
| Perturbation | Source Organism |
Coordination Sphere |
TPQ State | Resolution (Å) |
PDB ID |
|---|---|---|---|---|---|
| Native Active | |||||
| ---1193 | E. coli | 3His, H2O | quinone | 2.0 | 1dyu |
| ---1194 | A. globiformis | 3His, H2O | quinone | 2.3 | 1av4 |
| anaerobically Cu loaded exposed to O2 1195 | A. globiformis | 3His, H2O | quinone | 2.2 | 1ivx |
| ---1196 | A. globiformis | 3His, H2O | quinone | 2.2 | 1w6c |
| ---1197 | H. polymorpha | 3His, 2H2O | quinone | 2.4 | 1a2v |
| ---1198 | H. polymorpha | 3His, 2H2O | quinone | 2.0 | 3loy |
| ---1199 | P. sativum | 3His, 2H2O | quinone | 2.2 | 1ksi |
| ---1200 | H. sapiens | 3His, H2O | quinone | 2.5 | 2c10 |
| ---1201 | H. sapiens | 3His, H2O | quinone | 2.95 | 2y74 |
| ---1202 | H. sapiens | 3His | quinone | 2.9 | 3ala |
| ---1203 | B. taurus | 3His, H2O | quinone | 2.37 | 1tu5 |
| ---1204 | A. nidulans | 3His, H2O | quinone | 2.45 | 3pgb |
| Native Inactive | |||||
| ---1147 | E. coli | 3His, TPQ | quinone | 2.0 | 1oac |
| EDTA treated1205 | E. coli | 3His, TPQ | quinone | 2.6 | 2wo0 |
| EDTA treated1205 | E. coli | 3His, TPQ | quinone | 2.25 | 2wof |
| ---1194 | A. globiformis | 3His, TPQ His592 disordered |
quinone | 2.8 | 1avl |
| anaerobically Cu loaded exposed to O2 1195 | A. globiformis | 3His, TPQ | quinone | 1.9 | 1ivw |
| ---1196 | A. globiformis | 3His, TPQ, H2O | quinone | 1.55 | 1w6g |
| ---1206 | H. polymorpha | 3His, TPQ, H2O | quinone | 1.7 | 2oov |
| ---1207 | P. pastoris | 3His, TPQ | quinone | 1.23 | 1w7c |
| ---1208 | P. pastoris | 3His, TPQ | quinone | 1.65 | 1n9e |
| ---1209 | H. sapiens | 3His, TPQ | quinone | 2.9 | 1us1 |
| ---1209 | H. sapiens | 3His, TPQ | quinone | 3.2 | 1pu4 |
| ---1201 | H. sapiens | 3His, TPQ | quinone | 2.6 | 2y73 |
| ---1210 | H. sapiens | 3His, TPQ | quinone | 2.11 | 3k5t |
| ---1211 | H. sapiens | 3His, TPQ | quinone | 1.8 | 3hi7 |
| Variants | |||||
| H433A1188 | A. globiformis | 2His, Tyr, H2O | Tyr | 2.0 | 1ui7 |
| H592A1188 | A. globiformis | 2His, bidentate TPQ | quinone | 1.8 | 1ui8 |
| Y305A1190 | H. polymorpha | 3His, H2O | quinone | 2.5 | 3n9h |
| Y369F1212 | E. coli | 3His, 2H2O | quinone | 2.1 | 1jrq |
| D383A1193 | E. coli | 3His, TPQ | quinone | 2.0 | 1qak |
| D383E1193 | E. coli | 3His, 2H2O | quinone | 2.2 | 1qaf |
| D383N1193 | E. coli | 3His, H2O | quinone | 2.2 | 1qak |
| D298A1213 | A. globiformis | 3His, H2O | quinone | 1.82 | 2cwt |
| Substrate-reduced | |||||
| anaerobically substrate reduced1214 | E. coli | 3His, H2O | aminoquinol | 2.4 | 1d6u |
| anaerobically substrate reduced + NO1214 | E. coli | 3His, NO | aminoquinol | 2.4 | 1d6y |
| Substrate-bound | |||||
| 2-hydraxinopyridine1214 | E. coli | 3His, H2O | Schiff base | 2.0 | 1spu |
| ethylamine1215 | A. globiformis | 3His, H2O | Schiff base | 1.73 | 2zl8 |
| 5-phenoxy-2,3-pentadienylamine1216 | A. globiformis | 3His, H2O | Schiff base | 1.9 | 3kii |
| 6-phenyl-2,3-hexdienylamine1216 | A. globiformis | 3His, H2O | Schiff base | 2.05 | 3kn4 |
| D298A + 2PEA 1213 | A. globiformis | 3His, H2O | Schiff base | 1.85 | 2cwu |
| D298A + tyramine1217 | A. globiformis | 3His, 2H2O | Schiff base | 1.74 | 2d1w |
| Inhibitor Complexes | |||||
| tranylcypromine1218 | E. coli | 3His, H2O | Schiff base | 2.4 | 1lvn |
| tranylcypromine1219 | A. globiformis | 3His, 2H2O | Schiff base | 1.65 | 1w4n |
| phenylhydrazine1220 | A. globiformis | 3His, 2H2O | hydrazone | 2.05 | 2e2t |
| benzylhydrazine1219 | A. globiformis | 3His, 2H2O | hydrazone | 1.86 | 1w5z |
| benzylhydrazine1220 | A. globiformis | 3His, 2H2O | hydrazone | 1.80 | 2e2v |
| 4-hydroxybenzylhydrazine1220 | A. globiformis | 3His, H2O | hydrazone | 1.68 | 2e2u |
| MOBA1221 | A. globiformis | 3His, H2O | Schiff base | 1.73 | 1sih |
| NOBA1221 | A. globiformis | 3His | Schiff base | 1.70 | 1sii |
| Ru C4-racemic wire1222 | A. globiformis | 3His, 2H2O | quinone | 1.73 | 2bt3 |
| Ru C4-lambda wire1223 | A. globiformis | 3His, H2O | quinone | 1.60 | 2cfd |
| Ru C4-delta wire1223 | A. globiformis | 3His, H2O | quinone | 1.55 | 2cfg |
| Ru C5 wire1223 | A. globiformis | 3His, 2H2O | quinone | 1.8 | 2cfk |
| Ru C6 wire1223 | A. globiformis | 3His, 2H2O | quinone | 1.8 | 2cfl |
| Ru C7 wire1223 | A. globiformis | 3His, 2H2O | quinone | 1.74 | 2cfw |
| Ru C9 wire1223 | A. globiformis | 3His, 2H2O | quinone | 1.8 | 2cg0 |
| Ru C11 wire1223 | A. globiformis | 3His, 2H2O | quinone | 1.67 | 2cg1 |
| 2-hydrazinopyradine1200 | H. sapiens | 3His, H2O | hydrazone | 2.9 | 2c11 |
| aminoguanidine1211 | H. sapiens | 3His, H2O | Schiff base | 2.05 | 3mph |
| berenil1211 | H. sapiens | 3His, TPQ | quinone | 2.09 | 3hig |
| pentamidine1211 | H. sapiens | 3His, TPQ | quinone | 2.15 | 3hii |
| clonidine1224 | B. taurus | 3His, TPQ | quinone | 2.4 | 2pnc |
| Trapped Catalytic Intermediates | |||||
| aerobically trapped O2 equilibrium species1225 | E. coli | 3His | aminoquinol | 2.1 | 1d6z |
| time-resolved X-ray structure1226 | A. globiformis | 3His, H2O | Schiff base | 2.1 | 3amo |
| Alternative Metal Substituted | |||||
| Co-substituted1191 | A. globiformis | 3His, 3H2O | quinone | 1.8 | 1wmn |
| Co-substituted1227 | A. globiformis | 3His, 3H2O | quinone | 2.0 | 1iqx |
| Ni-substituted1191 | A. globiformis | 3His, 3H2O | quinone | 1.8 | 1iqy |
| Ni-substituted1227 | A. globiformis | 3His, 3H2O | quinone | 1.8 | 1wmo |
| Sr soaked1205 | E. coli | 3His, H2O | quinone | 2.7 | 2woh |
| Xe Complexes | |||||
| Xe complex1206 | H. polymorpha | 3His | quinone | 1.6 | 2oqe |
| Xe complex1228 | A. globiformis | 3His, H2O | quinone | 1.67 | 1rjo |
| Xe complex1228 | P. sativum | 3His, H2O | quinone | 2.24 | 1w2z |
| Xe complex1228 | P. pastoris | 3His, TPQ | quinone | 1.68 | 1rky |
| Xe complex1229 | E. coli | 3His, H2O | quinone | 2.48 | 2w0q |
The overall protein structure of AO is similar in all crystal structures, regardless of the state of the active site (apo, preprocessed, or processed). The significant sequence differences between AOs from different sources do not affect the overall fold of the enzyme or the structure of the active site. AO is a homodimer, with each monomer containing three subunits (Figure 216). The largest subunit, containing 394 residues in AGAO, is an 18-stranded β sandwich (colored in light blue and yellow).1194 The smaller subunits (100 and 82 residues in AGAO) pack on the surface of the large subunit, in slightly different positions depending on the source organism. Two β ribbon arms extend from each monomer to the surface of the large subunit of other monomer, stabilizing the dimer. The active site is buried in the large subunit, near to a large, solvent filled cavity on the dimer interface and close to where the β ribbon arm from the other monomer is positioned.
Figure 216.

X-ray crystal structure of holo AGAO.
In processed AO, two possible conformations of the TPQ cofactor are observed.1194 In the on-Cu conformation, TPQ is a ligand to the copper site through its C4-OH group and three His residues additionally coordinate to Cu, two Nε-coordinated and one Nδ-coordinated (Figure 217B). The geometry of the copper site in this conformation is tetrahedral distorted towards trigonal pyramidal (where the Cu-OTPQ bond length is long, 2.4 Å). AO obtained by dissolving these crystals is inactive. The alternative conformation of TPQ, observed in active enzyme, involves rotations around the Cα-Cβ and Cβ-Cγ bonds so that TPQ is positioned away from the copper into a pocket in the active site lined by Tyr284, Asp298, and Tyr296 (Figure 217A, residue numbers from AGAO). In this conformation, TPQ hydrogen bonds with Tyr284, a conserved residue which has been shown to be chemically important (vide infra), and the reactive C5=O carbonyl of TPQ is positioned towards the substrate entrance channel gated by Tyr296 and towards Asp298, the proposed active site base. In this active conformation, the copper site is bound by the same three His residues and additionally two solvent-derived ligands in a square pyramid. These general features of the active site of processed AO have been observed in AOs from all the source organisms studied, although the number of localized solvent molecules bound to the copper site varies between different structural determinations. In some AGAO structures, two conformations are observed for the residue His592, which is Nδ-coordinated to the copper.1194,1195 This conformational flexibility, which is not observed in AOs from other sources, is proposed to be due to incomplete occupancy of the site by copper and likely is not significant.
Figure 217.

Active site structure of holo amine oxidase with TPQ in the active conformation (A) and inactive conformation (B). Important second sphere residues pictured are Tyr284 (H-bonding partner of TPQ), Asp298 (the active site base), and Tyr296 (lid for substrate access channel).
Several crystal structures relevant to AO cofactor biogenesis have been obtained and are summarized in Table 39.
Table 39.
X-ray crystal structures of apo, preprocessed, metal-substituted and mutant copper amine oxidase varients relevant to TPQ biogenesis.
| Perturbation | Source Organism |
Coordination Sphere |
TPQ State | Resolution (Å) |
PDB ID |
|---|---|---|---|---|---|
| apo1194 | A. globiformis | --- | Tyr | 2.2 | 1avk |
| apo1230 | H. polymorpha | --- | Tyr | 1.73 | 3sx1 |
| anaerobically Cu loaded1195 | A. globiformis | 3His, Tyr at 2.58 Å His592 disordered |
Tyr | 1.9 | 1ivu |
| anaerobically Cu loaded + O2 1195 | A. globiformis | 3His, H2O, DPQ His592 disordered |
DPQ | 2.1 | 1ivv |
| Zn-substituted1231 | H. polymorpha | 3His, Tyr at 2.02 Å | Tyr | 2.5 | 1ekm |
| Zn-substituted1232 | E. coli | 3His, Tyr at 1.87 Å | Tyr | 2.5 | 2wgq |
| Co-substituted1230 | H. polymorpha | 3His, Tyr at 2.19 Å H2O |
Tyr | 1.27 | 3sxx |
| Co-substituted1191 | A. globiformis | 3His | Tyr | 2.0 | 1wmp |
| CuI-substituted1230 | H. polymorpha | 3His, Tyr at 2.8 Å | Tyr | 1.90 | 3tou |
| Y305F1190 | H. polymorpha | 3His, quinone | peroxy-quinone | 2.05 | 3nbb |
| Y305F1190 | H. polymorpha | 3His | peroxy-quinone | 1.9 | 3nbj |
| D298K1233 | A. globiformis | 3His, H2O | Schiff base | 1.68 | 2yx9 |
These include structures of apo AO (lacking both CuII and TPQ, from AGAO and HPAO)1194,1230 and of apo AO reconstituted with ZnII,1231 CoII,1191,1230 and CuI1230 (metals that do not catalyze the biogenesis reaction or, in the case of CoII, perform it slowly) showing the position of the precursor Tyr residue in the presence of a metal cation. Two different stages of the biogenesis reaction have been directly observed in crystals of preprocessed AGAO (containing CuII but prior to TPQ biogenesis); one of the preprocessed enzyme with CuII anaerobically bound and one of a dopaquinone (DPQ) intermediate in the biogenesis reaction.1195 In addition, crystal structures have been obtained of the HPAO variant Y305F, which reacts with O2 but does not form the mature TPQ cofactor and instead shows a unique partially processed form of the substrate Tyr residue where the ring is multiply-peroxidated,1190 and the AGAO variant D298K, which forms the LTQ cofactor that is present in lysyl oxidase.1233 The overall structure of the AO enzyme in these forms is the same and the only significant differences are observed at the active site.
The crystal structure of apoAO, lacking CuII and TPQ, was first reported by Wilce et al. and later by Klema et al. for HPAO (see Table 39).1194,1234 In these structures, the precursor Tyr residue (Tyr382 in AGAO) is pointing towards the site that will bind CuII (defined by the 3 His residues that are copper ligands in the processed enzyme, Figure 218A). From the apo structure, it appears that the ligands are positioned so that copper binding will result in a tetrahedral site in which the precursor Tyr residue is coordinated to CuII. This geometry is indeed observed in the active site of preprocessed AOs reconstituted with ZnII and CoII, where the metals are coordinated by the 3 His residues and the precursor Tyr in a tetrahedral geometry. In the ZnII and CoII structures, the metal-Tyr distances are clearly consistent with a MII-phenolate bond (2.02 Å and 1.87 Å for the two ZnII structures1231 and 2.19 Å for the CoII structure,1234 Table 39). However, in the sole available crystal structure of apo AGAO reconstituted anaerobically with CuII (1.9 Å resolution), the copper is bound to the three His residues and the precursor Tyr points towards CuII, but the Cu-O distance of 2.58 Å is too long to be described as a Cu-phenolate bond and the geometry of the site is not tetrahedral (Figure 218B).1195 Several explanations have been proposed for the long Cu-O distance observed in the anaerobic CuII bound structure. This may reflect reduction to CuI in the experiment, although at low temperature in the crystal the tyrosine should be limited in its ability to change position. This hypothesis is supported by a crystal structure obtained for a CuI loaded form of preprocessed HPAO, which shows a very similar site geometry to that reported by Kim et al. for CuII in preprocessed AGAO.1230 Alternatively, the long CuII-tyrosine distance may reflect the tyrosine remaining protonated at the pH used for crystallography (pH 6.8, pKa(Tyr) ≈ 10), resulting in a weak CuII-tyrosine interaction rather than a CuII-tyrosinate bond, although the presence of a bond with CuII would be expected to drive the deprotonation of Tyr. Finally, it could be that tyrosine is not a copper ligand in anaerobic preprocessed AO and only binds to copper after O2 is added to initiate cofactor biogenesis, a hypothesis supported by the possible assignment of the 350 nm intermediate observed by Klinman et al. as a CuII-tyrosinate species (vide supra). Further resolution of the structure of anaerobic CuII-bound preprocessed AO by complimentary spectroscopic studies is necessary to unambiguously determine the starting point of the biogenesis reaction, in which the tyrosine is activated for reaction with O2.
Figure 218.

X-ray snapshots of TPQ biogenesis. A) Apo Amine Oxidase. B) Anaerobic Cu-reconstituted preprocessed Arthrobacter globiformis Amine Oxidase. C) DPQ intermediate trapped in the crystal. D) TPQred on-Cu structure. E) Oxidized holo Arthrobacter globiformis Amine Oxidase containing off-Cu TPQox.
Further insight into TPQ biogenesis can be obtained from crystal structures that contain partially processed forms of the cofactor.1195 When crystals of the preprocessed Cu-bound enzyme from AGAO are briefly exposed to O2 and then frozen, it is observed that 50% monooxidation of the tyrosine ring has occurred (from 50% occupancy of an oxygen atom at C5 of the ring), generating a dihydroxyphenylalanine or dopaquinone intermediate (Figure 218C), the oxidation state of which cannot be determined due to the low resolution of the crystal structure (2.1 Å). The C4-O group of the intermediate is directed towards Cu, possibly indicating that it is bound to the copper site, but again the Cu-O distance is long for a bond (2.6 Å). After longer exposure to O2, the crystals contain a ring with oxygen atoms at the C2, C4, and C5 positions and coordinates to the CuII site in the geometry observed for the inactive conformation of TPQ with a Cu-O bond length of 2.3 Å (Figure 218D). A short distance is observed between the C2-O group of the ring and Thr403 (O-O 2.3 Å) that has been described as a hydrogen bond. This together with the absence of an absorption feature at 480 nm in this crystal suggest that the ring, while oxygenated, has not yet been oxidized from the reduced (TPQred) to oxidized (TPQox) form of the cofactor in this crystal. The crystals could be further incubated with O2 to generate the processed active site with the active off-Cu conformation of TPQ and the 480 nm absorption band corresponding to TPQox (Figure 218E). Therefore, Kim et al. propose that oxidation of the cofactor is required to promote the conformational change from the inactive on-Cu (Figure 218D) to the active off-Cu TPQ conformation (Figure 218E).1195 However, since independent evidence shows that the fully oxidized cofactor can adopt an on-Cu conformation and that enzyme exhibiting this structure is inactive,1194 this conformation may not be relevant to cofactor biogenesis.
Partially processed forms of TPQ have also been observed in some AO variants. A crystal structure of the Y305F variant of HPAO (Tyr305 in HPAO corresponds to Tyr284 in AGAO) has been reported showing that an alternative product is obtained in the biogenesis reaction.1190 Instead of the quinone ring formed in the native biogenesis reaction, a doubly peroxidated ring is present in this variant. The crystal structure data required the presence of two different peroxidated ring structures, each at 50% occupancy: 5-hydroxo-2,4-peroxophenylalanine and 5-hydroxo-3,4-peroxophenylalanine. In addition, a second sphere residue near the copper site, Met634, had been oxygenated. These results indicate that the absence of Y305 blocks cleavage of the O-O bond in biogenesis, leading to uncontrolled oxidation of the precursor Tyr. Another mutation performed in AGAO, D298K, allows trapping of covalet trapping of the dopaquinone intermediate in biogenesis.1233 Nucleophilic attack of the variant Lys residue on the dopaquinone intermediate leads to formation of a crosslink similar to the one present in lysyl oxidase. This is proposed to be the mechanism for formation of LTQ, the lysyl oxidase cofactor, since lysyl oxidase does contain a Lys residue at the appropriate position in its sequence.
4.2.4 Spectroscopy and Electronic Structure
Three key species in AO cofactor biogenesis are targets for spectroscopic study: anaerobic preprocessed AO, the 350 nm intermediate, and processed AO. Spectroscopy of the anaerobic preprocessed enzyme can give an electronic structure description of the species that reacts with O2 to initiate cofactor biogenesis. A key intermediate in the biogenesis reaction, defined by an absorption feature at 350 nm, can be characterized by spectroscopy to reveal its geometric structure and thus its role in the biogenesis reaction. Despite the importance of a spectroscopic and electronic structure definition of these early stages of biogenesis to define that nature of the activation of the precursor Tyr by CuII, relatively little spectroscopic characterization of these first two species has been performed. Alternatively, a large amount of spectroscopic characterization has been performed on the processed enzyme, which provides a starting point for understanding the limited spectroscopic data available for the preprocessed enzyme.
The copper site in processed AO had been elucidated by spectroscopy well before the first crystal structure of the enzyme was published. The EPR spectrum of the copper site in a resting processed AO was first reported by Yamada et al. in 1963.1235 The spectrum was further analyzed by Suzuki et al., who reported an axial EPR spectrum with g∥ = 2.29, g⊥ = 2.06, A∥ = 175×10−4 cm−1.1236 These results are consistent with more recently reported EPR parameters for processed AGAO (Figure 219C, red line, g∥ = 2.29, g⊥ = 2.07, A∥ = 187×10−4 cm−1), BSAO (g∥ = 2.28, g⊥ = 2.06, A∥ = 172×10−4 cm−1), and HPAO (g∥ = 2.30, g⊥ = 2.06, A∥ = 163×10−4 cm−1). The EPR spectrum of BSAO by Suzuki et al. also showed superhyperfine coupling in the g⊥ region with 2–3 14N donor ligands (5–7 lines, AN = 14 G). EXAFS studies on BSAO identified 3–4 histidine donor ligands based on a comparison to Cu(imid)4 2+, and a square pyramidal structure with three equatorial His ligands and two water ligands was proposed for the processed copper site.1237 Studies using pulsed EPR techniques (ENDOR and ESEEM) agreed with this structure and further determined that the equatorial water ligand is more tightly bound than the axial water ligand.1238 The optical absorption spectra of processed AO are dominated by contributions from the oxidized TPQ cofactor. The absorption feature at 460–480 nm (depending on the enzyme source) with ε ≈ 3300 M−1 cm−1 can be assigned to the first π→π* transition of the quinone cofactor and gives AO its characteristic pink color (Figure 219A, red).1236 The CD spectrum of processed AGAO has a positive band at 370 nm and a negative band at 430 nm which are associated with TPQox, while a broad negative band at 700 nm has been assigned as a d-d transition (Figure 219B, red).1181 This spectroscopic analysis accurately predicted the structure of the copper site in processed AO, which was later confirmed by X-ray crystallography.
Figure 219.

Spectral features of processed (red, a) and preprocessed (black, b) Arthrobacter globiformis Amine Oxidase. A) Room temperature absorption. B) Room temperature circular dichroism. C) 77 K EPR spectra.
Preprocessed AGAO has been studied by absorption, CD, and EPR spectroscopy.1181 The preprocessed site has no significant absorption feature (Figure 219A, black spectrum). The CD spectrum shows a negative band in the 700–800 nm region which has been assigned as a CuII d-d transition, but the other d-d transitions of the site have not been resolved (Figure 219B, black). A feature at 380 nm in the reported CD spectrum of preprocessed AGAO is not reproduced in our unpublished work. The EPR spectrum of the preprocessed site is axial with g∥ = 2.32, A∥ = 153×10−4 cm−1, g⊥ = 2.07 and superhyperfine coupling with 3 N donor ligands with AN = 14 G (Figure 219C, black). Spectroscopic work recently performed in our lab suggests that the features that have been reported for the preprocessed site in fact have a significant contribution from copper bound to a secondary copper binding site in the protein. Thus, the contributions of several copper species must be resolved to obtain the spectroscopic features of the active site copper in preprocessed AO. This work is the focus of ongoing study.
Very little spectroscopy has been performed on the 350 nm intermediate observed in HPAO.1184 The intermediate has been identified as a CuII LMCT species because the absorption maximum shifts from 350 nm to 390 nm when the copper ligand His624 is mutated to Cys, suggesting that the copper site contributes to the electronic structure of the intermediate. Dove et al. note that the absorption feature of the intermediate (λmax = 350 nm = 28,600 cm−1, ε ≈ 3200 M−1 cm−1) is consistent with a variety of chemically plausible CuII species, including a CuII-tyrosinate complex, a CuII-superoxide, and a CuII-aryl peroxide.1184 Attempts to perform resonance Raman into the 350 nm band to identify the species were unsuccessful and trapping of the intermediate for study by other spectroscopic techniques has not been reported. While a tentative assignment of this intermediate as a CuII-tyrosinate has been made by ruling out the other plausible options using kinetics data, further spectroscopic investigation to confirm its identity would be valuable.1185
In the absence of detailed spectroscopic and electronic structure information on either the anaerobic preprocessed site or the 350 nm intermediate, tetrahedral model complexes of the form [CuL(OPh-4-F)]+, where L represents a tridentate N-donor ligand (L1 = HB(3,5-iPr2pz)3 or L3 = HB(3-tBu-5-iPr2pz)3), have been studied (Figure 220A and B, respectively).1239 These models closely represent the tetrahedral [Cu(His)3Tyr]+ structure that has been proposed for the preprocessed site based on X-ray crystallography and for the 350 nm intermediate, but do not display reactivity with O2 (perhaps due to sterics). However, the Cu-phenolate bond lengths in these models are significantly shorter than what has been observed in the preprocessed enzyme1195 (L1 Cu-O 1.731 Å, L3 Cu-O 1.837 Å), confirming that the Cu-Tyr interaction in the preprocessed enzyme is not a tyrosinate-copper bond. The key difference between these two complexes is the orientation of the phenolate ring relative to the N-donor ligation (Figure 220). In the L1 complex the phenolate ring is oriented perpendicular to the Cu-O-C plane, which is close to the orientation of the Tyr ring in the crystal structure of preprocessed AGAO obtained by Kim et al.,1195 while for L3 the phenolate ring is approximately in the Cu-O-C plane. A summary of the spectroscopic features of these complexes is presented in Table 40 and the spectra are given in Figure 221 and Figure 222.
Figure 220.

Crystal structures of tetrahedral phenolate-copper model complexes for active site of Amine Oxidase. A) [Cu(OPh-F)(HB(3,5-i-Pr2Pz)3)] – L1. B) [Cu(OPh-F)(HB(3-tBu-5-i-Pr2Pz)3)] – L3.
Table 40.
Summary of the spectral features of tetrahedral CuL(OPh-4-F) model complexes, including gaussian resolved peak positions and band assignments from absorption (5 K), MCD (5 K, 7T) and TD-DFT, Cu-O stretching frequencies from resonance Raman excited at 647 nm (77 K), and EPR parameters from 77 K X-band EPR.1239
| Bands from LT Abs/MCD | Resonance Raman | EPR | ||||
|---|---|---|---|---|---|---|
| cm−1 | ε M−1 cm−1 | Assignment | (Cu-O cm−1) | ×10−4 cm−1 | ||
| CuL1(OPh-4-F) | 4869 | --- | dz2 | 569 | g1 2.320 | A1 5 |
| 6745 | --- | dxz-dyz | 1285 | g2 2.135 | A2 67 | |
| 11019 | 493 | dxz+dyz | g3 2.01 | A3 120 | ||
| 12409 | 575 | dxy | ||||
| 14727 | 2363 | oop CT | ||||
| 26147 | 842 | ip CT | ||||
| CuL3(OPh-4-F) | 5100 | --- | oop CT | 545 | g1 2.317 | A1 0 |
| 7499 | --- | dxz | 1290 | g2 2.125 | A2 20 | |
| 9483 | 162 | dyz | g3 2.005 | A3 143 | ||
| 10860 | 321 | dz2 | ||||
| 14576 | 890 | dxy | ||||
| 28216 | 1764 | ip CT | ||||
Figure 221.

77K EPR spectra of [Cu(OPh-4-F)(L)]+ model complexes (top L1, bottom L3).
Figure 222.

Low temperature absorption and MCD spectra of [Cu(OPh-4-F)(L)]+ model complexes (left site L1, right side L3).
The rhombic splittings of the g values observed in the EPR spectra (Figure 221) reflect significant dz2 mixing into the dx2-y2 ground states of these complexes (6.9% for L1, 11.5% for L3 from DFT calculations). The spin density found on the phenolate ring in the ground state wavefunctions, 14% for L1 and 9% for L3, reflect only a small amount of radical character on the phenolate ring resulting from binding to CuII. The different orientations of the phenolate ring lead to different orbital contributions to bonding in the L1 and L3 complexes. The LUMO of the L1 complex has a π-bonding interaction between the dx2-y2 orbital on CuII and the phenolate out-of-plane (oop) π valence HOMO (Figure 223A), while the L3 complex has a σ-bonding interaction between the dx2-y2 orbital and the phenolate in-plane (ip) π valence HOMO-2 (Figure 223B). Therefore, the nature of the phenolate-CuII bond depends on the orientation of the phenolate ring relative to the dx2-y2 orbital. This difference in bonding is reflected in the significant differences in the energies and intensities of the phenolate to CuII LMCT transitions in the two complexes. In the L1 complex, the two phenolate to CuII LMCT transitions are split by 11,420 cm−1 (bands 6 and 10 in Figure 222 left top) relative to a splitting of 23,166 cm−1 (band 8 and a band too low in energy to observe in Figure 222 right top) in the L3 complex. This large energy difference reflects the fact that in the L1 complex the phenolate oop orbital is lowered in energy by bonding, decreasing the energy splitting of the oop and ip phenolate orbitals, while in the L3 complex the energy of the phenolate ip orbital is lowered by bonding, increasing this energy splitting. The observed CT transitions (Figure 222) result from both of these phenolate donor interactions with the dx2-y2 acceptor orbital. In addition, in the L1 complex the lower energy oop LMCT is the more intense transition (ε = 2363 M−1 cm−1 compared to ε = 842 M−1 cm−1 for the ip LMCT) because of better overlap between the oop phenolate HOMO with the singly occupied dx2-y2 orbital, while in the L3 complex, the higher energy ip LMCT is more intense (from TD-DFT calculations, since the oop LMCT is predicted to be too low in energy to be experimentally observed in the L3 complex) due to better overlap of the ip phenolate HOMO-2 with the dx2-y2 acceptor orbital in the CT process (Figure 223B). Thus in the absorption spectrum of the L1 complex (Figure 222 left top) the most intense transition is band 6, the oop phenolate to Cu CT, while in the absorption spectrum of the L3 complex (Figure 222 right top) the most intense transition is the ip phenolate to Cu CT, band 8.1239
Figure 223.

β LUMOs of [Cu(OPh-4-F)(L)]+ model complexes. A) L1, B) L3. (Reprinted with permission from Ref. 1239. Copyright 2008 American Chemical Society.)
The electronic structure description obtained from these model complexes leads to the following conclusions about preprocessed AO and the nature of CuII substrate activation. First, the spectroscopy currently reported for preprocessed AO (vide supra) is not consistent with the Cu(His)3Tyr ligand set suggested by X-ray crystallography, since there is no intense LMCT feature in the preprocessed AO absorption spectrum and the EPR spectrum is axial rather than rhombic. This can also be deduced from the large difference in Cu-O bond length between the preprocessed site in the enzyme (2.58 Å) and the model complexes (1.731 Å and 1.837 Å). Insufficient spectroscopic information is available on the enzyme to fully evaluate whether this could be a reasonable structure for the 350 nm intermediate. However the similarity between the ring orientation of the L1 complex and the positioning of the precursor Tyr suggests that there should be an intense low energy phenolate to Cu CT in the enzyme, at an energy lower than the observed 350 nm band if this intermediate were a Cu(His)3 Tyr complex. Second, while some radical character is present in the ground state of CuII-phenolate complexes, this radical character in itself is insufficient to allow the complex to react with O2. A lack of reactivity was predicted using DFT calculations, which give a large, positive ΔG° value for the formation of the CuI-superoxoquinone complex, produced by O2 attack on the phenolate ring of the CuII complex (51 kcal/mol for the L1 complex and 80 kcal/mol for the L3 complex).1239 These large ΔG values reflect the energies of the phenolate to CuII CT transitions, which reduce CuII to CuI (L1 14,730 cm−1 = 42 kcal/mol, L3 27,850 cm−1 = 80 kcal/mol), and the reaction of the resultant phenoxyl radical with O2. Therefore, additional studies are necessary to understand the ability of the CuII site in preprocessed AO to catalyze a reaction between tyrosine and O2.
4.2.5 Molecular Mechanism
A mechanism for TPQ biogenesis in AO has been proposed based on the kinetic work of Klinman et al.1185 and the X-ray crystallography of Kim et al.1195 (Figure 224). Starting with the preprocessed site (1), O2 binds in a pocket in the protein (2) triggering a conformational change that causes the precursor Tyr to bind to CuII (3A). This CuII-tyrosinate complex is thought to have some tyrosyl radical character (3B), so O2 can react with the ring to form a CuII-coordinated peroxoquinone (4). O-O bond cleavage of this intermediate is promoted by Tyr305, and yields the crystallographically observed DPQ intermediate (5). Hydrolysis of DPQ is promoted by the CuII site (6), yielding the reduced form of the TPQ cofactor (7) which can react directly with O2 to generate fully oxidized TPQ (8).
Figure 224.

Proposed mechanism for TPQ and LTQ biogenesis.
Key steps of this mechanism have been evaluated by DFT calculations and studies of model complexes. Prabhakar and Siegbahn have calculated the reaction coordinate for this proposed mechanism, starting from the CuII-tyrosinate complex formed after O2 binding to the protein.1187 The complex has a spin population of 0.7 on the tyrosinate ring and only 0.3 on Cu, which suggests dominant tyrosyl radical character. O2 reaction at CuI in this species, forming a CuII-superoxide-tyrosyl radical complex, has a ΔG of 6.0 kcal/mol (including a loss of entropy upon binding O2 worth 8.4 kcal/mol), which is 11.7 kcal/mol more favorable than direct reaction with the tyrosyl radical to form the CuI-superoxoquinone (transition states and barriers for this step were not reported). The barriers calculated for the succeeding steps are 8.4 kcal/mol for formation of the CuII-coordinated peroxoquinone, 11.4 kcal/mol for O-O bond cleavage, 16.0 kcal/mol for the hydration of DPQ, 12.6 kcal/mol for aromatization of hydrated DPQ to form TPQred, and 2.1 kcal/mol for oxidation of TPQred to TPQox by O2. According to these results, hydration of DPQ should be the rate-limiting step, but Prabhakar and Siegbahn argue that the barrier for this step is overestimated because the step as calculated did not involve direct attack by the CuII-coordinated hydroxide on the DPQ ring, but instead a long range proton transfer through a chain of water molecules to form free hydroxide that attacks the C5 carbon of DPQ and B3LYP does not accurately calculate the barriers of long-range proton transfer reactions. Instead, it is argued that the first two steps calculated should be considered as a unit, making binding of O2 to Cu and attack by the superoxide product at the C5 carbon of the tyrosyl radical the rate limiting step with a barrier of 6+8.4 = 14.4 kcal/mol. Overall, the TPQ biogenesis reaction is calculated to be exothermic by 69 kcal/mol.1187 These calculations indicate that the key intermediate in the TPQ biogenesis reaction having an absorption band at 350 nm should have significant Tyr radical character and that reaction of O2 with this species should occur at the CuI rather than directly with the tyrosyl ring.
The calculations by Prabhakar and Siegbahn contrast recent calculations by Ghosh et al. inspired by [CuIIL(OPhen)]+ complexes which model the CuII(His)3(Tyr) structure proposed for the 350 nm intermediate.1239 These calculations show only a small amount of radical character on the phenolate ring (14%-9% spin density) relative to 70% in the calculations of Prabhakar and Siegbahn. This is not due to large differences in the structures of the models relative to the protein active site, but instead reflects the difference in the choice of functional (BP86 with 38% HF exchange for Ghosh et al. and B3LYP for Prabhakar and Siegbahn). The smaller amount of HF exchange in B3LYP (20%) is known to result in more spin density on the ligands of metal complexes, and this effect on the spin densities has in fact been observed in calculations on the L1 and L3 model complexes using B3LYP.1239 In Ghosh et al., a comparison of different functionals in the model systems was made and BP86 with 38% HF was selected as the functional that best reproduces the electronic structural parameters determined from spectroscopy, therefore giving the best description of these systems. In addition to the spin density differences, the ΔG for O2 attack on the phenolate ring to form a non-coordinating CuI-superoxoquinone species calculated by Ghosh et al. is at least 50 kcal/mol (depending on the phenolate ring orientation) compared to 17.7 kcal/mol for Prabhakar and Siegbahn. This large energy difference may be due to the spin density differences, to the differences in functional, or to other methodology differences. These differences between the two sets of calculations result in significantly different mechanistic conclusions in the two studies. While Prabhakar and Siegbahn favor formation of a CuII-superoxo as the initial reaction of the preprocessed site with O2 (ΔG = 6 kcal/mol),1187 Ghosh et al. favour a concerted attack of O2 on both the Cu and C5 of the phenolate ring to form a coordinated CuII-peroxoquinone (ΔG = 11kcal/mol, see Section 4.3).1239 Ultimately, a comparison of the electronic structures from calculations with the spectroscopy of the preprocessed active site is necessary to calibrate the calculation methodology before accurate mechanistic conclusions can be drawn about the nature of substrate activation by the CuII site.
The step in which DPQ is hydrated to form TPQred (6→7 in Figure 224) is proposed to be copper-catalyzed because hydration of o-quinones does not occur via general base catalysis in aqueous solution. To demonstrate that CuII can catalyze this step, model complexes have been studied by Ling et al. which have a MII site with a tethered catechol group that can be oxidized in situ to a DPQ-like functionality.1240 When MII is CuII, CoII, NiII or ZnII these complexes undergo a subsequent hydration to form a TPQ-like hydroxyquinone product (after further oxidation by periodate), albeit with an order of magnitude slower rates for NiII and ZnII compared to CuII. The rate-limiting step is proposed to be attack of a metal-coordinated hydroxide on the substrate quinone.
Attempts to chemically trap the DPQ intermediate in TPQ biogenesis by the mutation of the adjacent Asp residue to Lys (D298K) result in the formation of a cofactor identified by absorption, resonance Raman, and X-ray crystallography to be a tautomer of the LTQ cofactor observed in lysyl oxidase (LOX).1233 Stabilization of the iminoquinol tautomer of LTQ (Figure 224, 10) over the aminoquinone form (Figure 224, 9) is influenced by hydrogen bonding from another second sphere residue, Y284, and so some of the second sphere residues in LOX must also play a role in the stabilization of the active form of the cofactor. These results establish a mechanistic proposal for LTQ biogenesis, where the early steps of the cofactor biogenesis reaction (CuII substrate activation, O2 attack to form a CuII-peroxoquinone and O-O bond cleavage to form DPQ) are the same in both TPQ and LTQ biogenesis and the only difference is what nucleophile adds to the DPQ intermediate – CuII-coordinated hydroxide (TPQ) or a Lys residue (LTQ biogenesis pathway, Figure 224).
4.3 The Nature of CuII Substrate Activation
The proposed mechanisms for 2,4-dioxygenation in 2,4-QD and TPQ biogenesis in AO involve a common description of the nature of CuII substrate activation. Both mechanisms invoke a step in which CuII-coordinated substrate transfers an electron to CuII, forming a CuI-substrate radical species. Three descriptions of this step have been put forward which attempt to invoke the presence of a substrate radical even though reduction of the CuII site upon substrate binding is not observed: 1) The CuI-substrate radical is in equilibrium with the CuII-substrate site, via an intramolecular electron transfer, but the equilibrium is shifted far to the left (as per Steiner et al.1124); 2) The reaction is performed by a substrate→Cu CT excited state of the CuII-substrate complex (as per Seigbahn1126); 3) The ground state of the CuII-substrate complex contains radical character which makes the substrate reactive towards O2 (often written as a resonance hybrid of CuI-substrate radical with CuII-substrate complex1185). It is an open issue as to whether any of these descriptions for the activation of substrate as a radical is correct and there is evidence against each, primarily from the AO cofactor biogenesis reaction. In the case of the equilibrium description (1), addition of reagents that react with radicals or CuI (such as NO) might be expected to trap the substrate radical by driving the equilibrium, but no substrate radical has been observed in these systems by chemical trapping.1184 In the case of the excited state reactivity description (2), the LMCT energy is included in the activation barrier for the O2 attack step. The lowest energy determined for phenolate-CuII LMCT in a model complex, with a similar geometry to the active site of preprocessed AO, is 14,727 cm−1 (41 kcal/mol), which is significantly higher than the measured ΔH‡ for TPQ biogenesis (8.4 kcal/mol).1239 In the case of the ground state radical character description (3), only a small amount of radical character is observed on the rings of CuII-phenolate model complexes.1239 In addition, significant radical character would be expected to yield observable spectral effects. While there may be some evidence for this third description, given the pyramidalization of the C2 carbon of quercetin in the ES complex of quercetinase observed by X-ray crystallography,1124 even in this ES complex of 2,4-QD no reduction of CuII to CuI or CuI-radical species is observed by EPR and XAS.1121,1122
Given the lack of evidence for the CuI-substrate radical required by current proposals, alternative proposals for the nature of substrate activation by CuII coordination should be explored. Calculations inspired by the CuII-phenolate model complexes have shown that while direct attack by O2 on the phenolate ring at C2 has a high barrier (ΔG = 51 kcal/mol), concerted attack on both the phenolate C2 and CuII to form a coordinated peroxoquinone has a much lower barrier (ΔG = 11 kcal/mol).1239 In this concerted process, triplet O2 approaches the site oriented to bind bridging the CuII and the phenolate with an antiferromagnetic alignment of the spins as in Figure 225 right and α spins from both the phenolate HOMO and the Cu are transferred to the απ orbitals of O2. This is facilitated by the fact that one O2 π* orbital has σ overlap with the HOMO of the phenolate (Figure 225A) and the other O2 π* orbital has π overlap with the half occupied CuII dx2-y2 orbital (Figure 225B). The transfer of two α electrons to O2 occurs concertedly with the LMCT of an electron with β spin from the phenolate HOMO to CuII to maintain the electron density on CuII, effectively flipping the unpaired spin on CuII (Figure 225C). Thus the CuII acts as a spin buffer that overcomes the spin-forbiddenness of the reaction without reduction of CuII or the need to invoke a phenoxyl radical-CuI intermediate. This may be an attractive alternative to the current mechanistic proposals. Another possibility is that the resting CuII-OH could perform hydrogen atom abstraction from the Tyr, generating a tyrosyl radical that can react with O2. However, this mechanism would also involve a tyrosyl radical intermediate, which has not been observed. Further attempts to obtain evidence for a substrate radical in the course of a CuII substrate activation reaction and extension of the concerted CT spin-buffering proposal in Figure 225 to cofactor biogenesis in AO and the mechanism of quercetinase are required to understand the nature of CuII-substrate activation for the spin forbidden reaction of singlet organic substrates with triplet O2.
Figure 225.

Orbital overlap of key frontier molecular orbitals showing the electron transfer process during our proposed concerted mechanism for O2 attack on the [Cu(His)3(Tyr)]+ site in TPQ biogenesis. Blue indicates orbitals involved in the transfer of a beta spin electron, red indicates orbitals involved in the transfer of an alpha spin electron.
5.0 Copper Sites in Bacterial Denitrification
Thus far this review has focused on copper containing enzymes that exclusively use molecular O2 as the oxidant for performing redox chemistry. There are other important biochemical pathways involving copper enzymes that do not use O2 or its other redox states (such as peroxide) as oxidants. One such pathway is the global nitrogen cycle, which involves a number of important and unique metalloenzymes that perform redox chemistry on dinitrogen, ammonia, and nitrogen oxides (Figure 226).1241 Nitrogen fixation (N2 reduction to NH3) is catalyzed by nitrogenase, a binary protein system that involves an iron-sulfur cluster containing reductase and an enzyme containing two large clusters, the [Fe8S7] P-cluster implicated in electron transfer and the catalytic [MoFe7S9-Chomocitrate] FeMoco cluster. The Mo in this cluster can be substituted by V and Fe in other homologues of the nitrogenase enzyme. The six electron reductive process of ammonification (NO2− reduction to NH3) involves a multiheme enzyme known as cytochrome c nitrite reductase.1242 Alternatively, denitrification, the multi-step reductive pathway that completes the nitrogen cycle by reducing nitrogen oxides back to gaseous dinitrogen (Figure 226), involves four interesting metalloenzymes, two of which contain copper.1243 The two electron reduction of nitrate to nitrite is performed by a molybdopterin enzyme which can also contain an iron-sulfur cluster (for membrane-bound nitrate reductases) or heme site(s). The one electron reduction of nitrite to nitric oxide, the first dedicated step of denitrification, can be performed by two alternative nitrite reductases: a copper containing metalloenzyme with a type 1 (blue) copper electron transfer site and a type 2 (or normal) copper active site (CuNiR) and a heme cd1 metalloenzyme (heme NiR). Denitrifying organisms express exclusively either CuNiR or heme NiR depending on whether nitrite reduction is required under aerobic conditions (heme NiR is less sensitive to O2 than CuNiR). Nitric oxide reduction, which involves the two electron reductive coupling of two equivalents of nitric oxide to form nitrous oxide, is performed by an enzyme that contains a unique heme/non-heme iron binuclear active site closely structurally related to the active site in the heme-copper oxidases (but without the Tyr crosslink, see Section 3.7.2). Finally, the terminal step in denitrification, a two electron reduction which converts nitrous oxide to dinitrogen and water, is performed by nitrous oxide reductase, which contains two copper sites, a binuclear CuA electron transfer site and a tetranuclear copper sulfide cluster called CuZ.1243
Figure 226.

The nitrogen cycle.
Organisms are considered to be denitrifiers if they convert nitrogen oxides to a gaseous product.1244 Not all denitrifying organisms possess the complete denitrification pathway and some terminate denitrification by releasing gaseous nitrous oxide instead of dinitrogen. These organisms lack the gene cluster responsible for nitrous oxide reductase expression.1244 Denitrification can serve a number of cellular functions, including detoxification of nitrogen oxides, particularly nitrite, and redox balancing (taking up excess reducing equivalents when O2 and CO2 are not available).1245 However, the main purpose of denitrification in most bacterial denitrifiers is respiration, the use of nitrogen oxides as the terminal electron acceptors for the cell to concerve energy for growth in environments with little or no oxygen, like the soil or deep ocean. The reductive steps of denitrification occur in the periplasm of denitrifying bacteria and electron transport across the cytoplasmic membrane by the obligatory upstream source of electrons for all the denitrification enzymes, the cytochrome bc1 complex, translocates protons across the membrane and establishes the electrochemical gradient necessary to drive ATP synthesis.1245 This method of establishing a proton gradient is less efficient than O2 respiration using cytochrome c oxidase so denitrifying organisms have regulatory mechanisms to switch over to O2 respiration when O2 is available. Several enzymes in denitrification, including copper nitrite reductase and nitrous oxide reductase, are thought to be deactivated by O2.1244
In this review we will provide a brief summary of the chemistry of copper nitrite reductase (Section 5.1) and focus in more detail on nitrous oxide reductase because of its unique tetranuclear copper active site, unprecedented in either copper biochemistry or in synthetic copper-sulfur chemistry, and the number of remaining questions about how this site reduces N2O (Section 5.2).
5.1 Copper Nitrite Reductase
Copper nitrite reductase (CuNiR) performs the one electron reduction of nitrite to nitric oxide and water (with uptake of two protons). The enzyme contains two mononuclear copper sites, a type 1 (T1) or blue Cu site involved in electron transfer and a type 2 (T2) or normal copper site where substrate binding and reduction occurs. Three states of CuNiR - the resting state (both oxidized and reduced), the oxidized nitrite-bound state, and an NO bound state - are structurally and spectroscopically well characterized and a large number of X-ray crystal structures, including atomic resolution structures,1246 are available for all three states. In each of these states, the coordination of the T1 site is not perturbed and differences are due to ligand binding at the T2 site. While the physiological function of CuNiR is the reduction of nitrite to NO, CuNiR also catalyzes the reverse reaction, converting NO to nitrite.1247 The equilibrium constant for the conversion of nitrite to NO by CuNiR is pH dependent and nitrite reduction is thermodynamically favoured (i.e. Keq > 1) below pH 6.2 (pH 6.2 is also the optimum pH for nitrite reduction in steady-state kinetics studies). In addition, in the presence of excess NO, reduced CuNiR can catalyze the reductive coupling of two NO molecules to form N2O.1248 While this coupling reaction is unlikely to be relevant in vivo, it has been observed to complicate in vitro attempts to characterize a product bound T2 Cu-NO complex obtained by treating reduced CuNiR with excess NO (vide infra).
CuNiR is a homotrimer where each monomer contains a T1 and T2 copper site separated by 12.5 Å distance (one hexameric variant is known).1249 The T1 site is ligated by His95, His145, Cys136, and Met150 (Figure 227). The T2 copper site is located at the interface between the monomers and is ligated by three His ligands (Figure 227). Two His residues of the T2 site come from one monomer (His100 and His135) and the third from another monomer (His307), indicating that the trimer structure is necessary for function. Cys136, a ligand of the T1 site, is adjacent to His135, a ligand of the T2 site, forming a Cys-His pathway for rapid through-bond electron transfer as also present in the MCOs (Section 3.7.1). In the oxidized resting state of CuNiR, the T2 site is additionally coordinated by a solvent derived ligand and has a tetrahedral geometry (Figure 228A).1249 When the resting state of CuNiR is reduced, this solvent derived ligand is lost while the remainder of the coordination environment of the T2 site is not perturbed.1250 In the oxidized resting state, the solvent-derived ligand is hydrogen bonded to a second sphere residue Asp98 which additionally hydrogen bonds through a localized water molecule to another second sphere residue, His255.1250,1251 These two residues have been identified by mutagenesis studies as essential for enzyme activity.1252 They have also been implicated in the pH profile of the activity of CuNiR, which has a maximum at pH 6.2 and decreases at low pH with a pKa of 5 (assigned as the pKa of Asp98) and at high pH with a pKa of 7 (assigned as the pKa of His255).1253 Study of the pH dependence of the nitrite bound form of the T2 site has shown that the pKa of Asp98 is 6.4 when nitrite is coordinated (vide infra).1254 Mutation of a nearby hydrophobic residue, Ile289, decreases the rate of catalysis but does not totally eliminate nitrite reduction.1253 The redox potentials of the T1 and T2 sites have been measured in resting Alcaligenes xylosoxidans NiR as 255±3 mV and 244±18 mV, respectively, at pH 7.1255 The redox potential of the T2 site decreases to 137 mV at pH 8.4 (from 218 mV in NiR from Rhodobacter sphaeroides), turning off electron transfer between the T1 and the T2 sites at high pH, when Asp98 is deprotonated.1256 Additionally, site-directed mutagenesis has been used to create a variant of CuNiR in which electron transfer from the T1 to the T2 site is disrupted by mutation of one of the His ligands of the T1 site to alanine (H145A), resulting in a high potential T1 site that remains permanently reduced.1257 Thus, three strategies are available for studying nitrite binding to the T2 site without T1 to T2 electron transfer, which would lead to reduction of nitrite: 1) nitrite binding to fully oxidized CuNiR (where the T1 site is oxidized), 2) nitrite binding to CuNiR at high pH (pH > 8.4), where the T1 site can be selectively reduced, and 3) nitrite binding to the T2 site in the H145A variant, which contains a permanently reduced T1 site.
Figure 227.

The Type 1 and Type 2 sites of nitrite reductase with their ligands, showing the Cys-His pathway.
Figure 228.

The Type 2 site of copper nitrite reducatse with various ligands bound, including the key second sphere residues Asp98 and His255. A) Resting T2 site with hydroxide ligand. B) Nitrite bound oxidized T2 site. C) NO bound T2 site.
Almost all of the structural studies of the nitrite bound state of CuNiR have employed the first of these strategies: nitrite addition to fully oxidized resting CuNiR. A large number of available crystal structures show that nitrite binds to the oxidized T2 site, displacing the solvent derived ligand observed in resting and coordinating as a bidentate ligand with both oxygens bonding to Cu (Figure 228B).1246 Nitrite is asymmetrically bound to the T2 site, with the Cu-O bond closer to Asp98 being shorter by 0.2–0.6 Å (Table 41).
Table 41.
Selected parameters for crystallographically characterized nitrite-bound species in the Cu dependent nitrite reducases.
| Source Organism |
Mutations | Resolution (Å) |
pH | Cu-N Distance (Å) |
Cu-O Bond Lengths (Å) |
PDB ID |
|---|---|---|---|---|---|---|
| Oxidized CuNiR + Nitrite | ||||||
| A. xylosoxidans | WT | 2.80 | 6.0 | 2.484 | 1.732, 2.376 | 1nds1258 |
| A. xylosoxidans | N90S | 3.00 | 7.4 | 2.488 | 2.000, >2.367 | 2xx11255 |
| A. xylosoxidans | H313Q | 1.72 | 7.1 | 2.406 | 1.861, >2.419 | 1wa21259 |
| A. faecalis | WT | 1.40 | 7.0 | 2.360 | 2.039, >2.290 | 1sjm1260 |
| A. faecalis | WT | 1.80 | 7.0 | 2.351 | 2.165, >2.404 | 1as61250 |
| R. sphaeroides | WT | 1.85 | 8.4 | 2dws1256 | ||
| R. sphaeroides | WT | 1.90 | 6.0 | 2dwt1256 | ||
| N. gonorrhoeae | WT | 1.95 | 7.0 | 2.313 | 2.022, >2.678 | 1kbv1261 |
| A. cycloclastes | WT | 2.20 | 5.4 | 2.697 | 2.157, >2.530 | 1nid1262 |
| A. faecalis | D98N | 1.65 | 7.0 | 2.498 | 2.289, >2.475 | 1j9q1263 |
| A. faecalis | H255N | 1.90 | 7.0 | 3.2 | 2.111 | 1j9s1263 |
| A. faecalis | I257A | 1.70 | 7.0 | 3.3 | 1.935 | 1l9o1264 |
| A. faecalis | I257G | 1.75 | 7.0 | 2.285 3.3 |
2.036, >2.114 2.096 |
1l9p1264 |
| Reduced CuNiR + Nitrite | ||||||
| A. faecalis | WT | 1.85 | 7.0 | 2.458 | 2.229, >2.674 | 1as81250 |
| Reduced CuNiR + NO | ||||||
| A. faecalis | WT | 1.58 | 7.0 | 2.4 | 1.982, >2.4 | 2ppc1265 |
| Endogenous Nitrite | ||||||
| A. cycloclastes | WT | 1.15 | 6.5 | 2.154 | 1.978, >2.190 | 2bwi1246 |
There is a hydrogen bond between Asp98 and the closer oxygen of nitrite (O-O distance of 2.8–3.4 Å). There is also some degree of variability in the orientation of the nitrite ligand relative to the T2 copper (variable Cu-N distance, Table 41). In the one known crystal structure where nitrite is added to a crystal of reduced NiR, the coordination geometry of nitrite bound at the reduced T2 site does not differ substantially from the coordination observed to the oxidized T2 site, except that the Cu-O bond lengths are slightly longer (by 0.05 Å and 0.27 Å, Table 41).1250 Mutanted variants of CuNiR where the second sphere residues His255 or Ile257 are perturbed show a monodentate coordination geometry for nitrite, which coordinates to the T2 site through one oxygen atom.1264 Spectroscopic characterization of the nitrite-bound state of wild-type CuNiR has been performed at both low pH with the T1 site oxidized and at high pH with the T1 site either oxidized or reduced.1254 EPR spectroscopy of nitrite bound T2 site at pH 8.4 with the T1 site either oxidized (Figure 229B) or reduced (Figure 229C) shows that nitrite binding is not perturbed by the redox state of the T1 site. However, a significant change in the nitrite-bound T2 site is observed upon comparing EPR spectra at pH 8.4 and pH 5.5 (Figure 229B and Figure 229A, respectively). Thus, the low pH form of the nitrite bound T2 site, which is the species present at the pH of maximum enzyme activity, has one more proton than the high pH form. DFT calculations have been used to evaluate models for both the high pH and low pH nitrite-bound T2 sites to identify where these protons reside in the active site.1254 These calculations favor a model where at high pH His255 is protonated and Asp98 deprotonated while at low pH, both His255 and Asp98 are protonated, with a hydrogen bond between Asp98 and the coordinated nitrite. Thus, protonation of Asp98 triggers electron transfer from the T1 to the nitrite-bound T2 site. Further, when the T1 reduced, nitrite-bound oxidized T2 state at pH 8.4 is rapidly lowered to pH 5.6 (a pH drop experiment), NO is evolved and the absorption spectrum shows that the T1 site is rapidly oxidized.1254 This indicates that protonation of Aps98 upon going from high pH to low pH triggers electron transfer from the T1 to the nitrite-bound T2 site, resulting in turnover.
Figure 229.

EPR spectra of significant nitrite coordinated T2 species. A) Nitrite coordinated T2 with T1 oxidized, pH 5.5, 77 K EPR. B) Nitrite coordinated T2 with T1 oxidized, pH 8.4, 77 K EPR. C) Nitrite coordinated T2 with T1 reduced, pH 8.4, 77 K EPR.
The structure of CuNiR complexed with the product of nitrite reduction, NO, was first reported by Tocheva et al. in 2004 from crystals of reduced CuNiR that had been exposed to excess exogenous NO.1260 There are several unusual features of this structure. First, the NO molecule is bound side-on to the T2 copper site (Figure 228C). Second, the EPR spectrum reported after identical NO addition to reduced CuNiR in solution shows an oxidized T2 copper signal with a nine line pattern in the g⊥ region due to superhyperfine coupling with four nitrogen donor ligands (Figure 230A). A further study by Tocheva et al. shows that this side-on NO species with a putative CuII EPR spectrum is observed when starting from both wild-type CuNiR and the reduced and oxidized forms of the H136A variants (in which T1 to T2 ET does not occur).1265 This leads to an initial assignment of the CuNiR NO complex as a side-on CuII-NO− species,1260 different in both geometric and electronic structure from all known mononuclear Cu-NO complexes, which are end-on coordinated and have CuI-NO• radical EPR spectra. Subsequent spectroscopic investigations of this putative CuII-NO− species in wild type CuNiR by EPR, MCD, and 14N and 1H ENDOR show that in fact the CuII species observed in solution is identical to the nitrite-bound oxidized T2 site (with the T1 site reduced, Figure 230B).1248 At short times after NO addition to reduced CuNiR in solution, a CuI-NO• species is observed by EPR (Figure 230C), which subsequently converts to the nitrite-bound resting form of CuNiR. In wild-type CuNiR, this occurs via reductive coupling of two equivalents of NO forming N2O, which was detected directly by an assay using nitrous oxide reductase.1248 This process oxidizes the T1 and T2 sites and subsequently the reverse reaction of CuNiR proceeds, oxidizing NO to NO2−. This generates the observed nitrite-bound oxidized T2 site and a reduced T1 site. How this proceeds in CuNiR variants where T1 to T2 ET is affected has not been described, however identical CuII EPR spectra are observed in these variants as in wild type,1265 so formation of the nitrite-bound T2 site is likely the process that also occurs in solution. Thus, the NO adduct of CuNiR that forms in solution has a CuI- NO• electronic structure, not the CuII-NO− electronic structure that was initially proposed. This CuI-NO• species can also be observed upon nitrite reduction by CuNiR and has been characterized by EPR and ENDOR.1266 Analysis of the orientations of the g- and A-tensors obtained from the EPR indicate that the NO ligand is bound end-on with a ~160° Cu-N-O angle. 1H coupling features are observed in the ENDOR spectrum that arise from a magnetic interaction with the Cδ1 protons of the sidechain of Ile289, indicating that the end-on NO molecule is oriented towards Ile289 in the active site. These studies reveal an intriguing difference between how NO interacts with CuNiR in solution versus in crystals. In solution an end-on bound CuI-NO• species is formed that further reacts, eventually forming the nitrite bound oxidized T2 site, while in crystals a side-on NO bound T2 site is stable. Several computational studies have been undertaken to determine the interactions responsible for the stability of the side-on NO binding geometry observed in CuNiR crystals and all show that the end-on structure is energetically favoured by 3–10 kcal/mol. Recent calculations by Merkle and Lehnert which include the second sphere residues Asp98 and Ile289 show that the side-on bound geometry is a local minimum while the end-on geometry is the global minimum, with a small barrier of 1.0 kcal/mol required for conversion from the side-on to the end-on structure.1267 Interactions that contribute to stabilizing the side-on coordination geometry include hydrogen bonding from Asp98, which is 1–2 kcal/mol stronger in the side-on case, and steric constraints from Ile289, which restricts the geometry of the end-on NO complex. Thus, the side-on coordination of the CuNiR NO complex observed in crystals may represent a metastable form that relaxes to end-on coordination in solution when the positions of the sidechains of Ile289 and Asp98 are more flexible.
Figure 230.

EPR spectra of putative NO-bound CuNiR species and nitrite-bound CuNiR. A) Reported CuII-NO− solution EPR spectrum, 77 K. B) Nitrite-bound T2 EPR spectrum, 77 K. C) CuI-NO• EPR spectrum obtained upon freezing 30 s after addition of NO, 77 K.
A consensus mechanism for the reduction of nitrite by CuNiR is presented in Figure 231. The first two steps of the mechanism are binding of NO2− to the T2 site and electron transfer from the T1 to the T2 site (proudcing the T2 CuI Site). Whether these two steps are ordered or if a random-sequential mechanism operates has been a matter of long debate in the literature. However, both a recent single-molecule study1268 and a steady-state kinetics study considering the substrate dependence of turnover support a random-sequential mechanism,1269 where either ET or substrate binding could occur as the first step (Figure 231, pathways A and B) and this view has become generally accepted. When both nitrite binding and T1 to T2 ET have occurred, the mechanism converges at a T2 reduced nitrite bound intermediate. This is the active intermediate for N-O bond cleavage, which occurs via transfer of a proton from Asp98 and oxidation of the T2 site, resulting in NO formation. Computational studies of this step by Ghosh et al. suggest that the lowest energy pathway involves first protonation of the bound nitrite followed by electron transfer to break the N-O bond.1254 Computational investigations of three possible geometries for the CuI intermediate with a protonated nitrite ligand (bidentate η2, monodentate η1κN, and monodentate η1κO(H)) show that N-O bond cleavage only has a low barrier when the protonated nitrite is a bidentate ligand, similar to the crystallographically observed geometry for nitrite binding to the oxidized T2 site (Figure 230A). In this geometry, the reaction proceeds by direct release of NO with a calculated ΔE‡ of 16 kcal/mol, which agrees well with the experimental activation energy of 15 kcal/mol for nitrite reduction.1253 Thus the role of the experimentally observed NO bound species in the catalytic reactivity of NiR remains to be resolved. Possible roles of this species include as a product-inhibited form of the enzyme or as an intermediate not in nitrite reduction but in the reductive coupling reaction catalyzed by NiR in the presence of excess NO.
Figure 231.

Mechanism of nitrite reduction by Cu NiR, focused on the role of the T2 site.
5.2 Nitrous oxide reductase
5.2.1 Enzymology
Nitrous oxide reductase (N2OR) is the terminal enzyme of bacterial denitrification and reduces N2O by two electrons, breaking the N-O bond to release N2 and H2O. This reaction is exergonic by 81 kcal/mol1244 but has an activation barrier of 59 kcal/mol in the gas phase.1270 N2O release into the atmosphere is an environmental concern, since N2O is the primary source of NOx in the stratosphere, leading to ozone depletion,1271 and is a greenhouse gas with 300 times the global warming potential of CO2.1272 Agricultural use of nitrogen based fertilizers is the primary source of anthropogenic N2O emissions, as both nitrifying and denitrifying soil bacteria that lack a N2OR can generate N2O from these chemicals.1273 N2O is also released as a byproduct of industrial processes (particularly the production of adipic and nitric acids), by the combustion of biomass and fossil fuels, and from wastewater treatment.1271 Combined, anthropogenic sources of N2O account for 40% of all N2O emissions.1274 Capture and destruction of N2O through chemical catalysis is a possible strategy for mitigating the effects of N2O on the ozone layer and the global climate.1271,1273
The requirement of copper for nitrous oxide reduction in denitrifying bacteria was identified in 1980 when it was shown that copper is essential for growth of the denitrifier Alcaligenes faecalis under an N2O atmosphere, where N2O respiration is the sole source of energy for growth.1275 This was later confirmed when it was shown that in the absence of copper, N2O is the terminal product of nitrate-induced denitrification in Pseudomonas stutzeri.1276 The role of copper as a cofactor in nitrous oxide reductase was identified when a previously isolated copper protein from Pseudomonas stutzeri was shown to reduce N2O in vitro with reduced methyl viologen as the electron source.1277 Since this discovery, N2OR had been purified and biochemically characterized from 11 denitrifying bacteria: Pseudomonas stutzeri (PsN2OR),1278 Rhodopseudomonas sphaeroides f.sp. denitrificans,1279 Paracoccus denitrificans (PdN2OR),1280 Wolinella succinogenes (WsN2OR),1281 Achromobacter cycloclastes (AcN2OR),1282 Pseudomonas aeruginosa,1283 Paracoccus pantotrophus (PpN2OR),1284 Thiobacillus denitrificans (TdN2OR),1285 Alcaligenes xylosoxidans,1286, Hyphomicrobium denitrificans,1287 and Pseudomonas nautica (PnN2OR, later reclassified as Marinobacter hydrocarbonoclasticus).1288 A further 66 denitrifying prokaryotes have thus far been identified through genomic analysis to contain the NosZ gene associated with N2OR.1244
N2ORs are homodimers with molecular weights of 120–160 kDa, a copper content of ~12 Cu per dimer, and a sulfide content of ~2 S2− per dimer (Table 42).1289
Table 42.
Biochemical properties of nitrous oxide reductase purified from different organisms and their dependence on O2 during purification.
| Molecular Weight |
Structure | Cu Content per Dimer |
S2− Content per Dimer |
Sequence Similarity with PsN2OR |
|
|---|---|---|---|---|---|
| Aerobic Purifications | |||||
| P. stutzeri1278 | 120 kDa | homodimer | 6.6±0.4 | --- | --- |
| P. pantotrophus1290 | 140 kDa | homodimer | 7.2±1.2 | --- | 92% |
| A. cycloclastes (recombinant)1291 | 140 kDa | homodimer | 4.2±1.2 | --- | 70% |
| A. cycloclastes1282 | 72 kDa | monomer | 7.6±0.2 | --- | 70% |
| P. denitrificans1292 | 144 kDa | homodimer | 11.0 | 1.4 | 71% |
| P. nautica1288 | 130 kDa | homodimer | 10.7±1.7 | 2.1±0.1 | 86% |
| R. sphaeroides1279 | 95 kDa | monomer | 8.0±0.2 | --- | 75% |
| H. denitrificans1287 | 130 kDa | homodimer | 9.0±0.2 | --- | |
| T. denitrificans1285 | 160 kDa | homodimer | 1.6 | --- | 66% |
| W. succinogenes1281 | 162 kDa | homodimer | 5.8±0.6 | --- | 51% |
| Anaerobic Purifications | |||||
| P. stutzeri1278 | 120 kDa | homodimer | 7.3±0.4 | --- | --- |
| P. pantotrophus1290 | 140 kDa | homodimer | 10.5±2.6 | 1.7±0.4 | 92% |
| A. cycloclastes (recombinant)1291 | 140 kDa | homodimer | 9.0±1.2 | 2.4±0.4 | 70% |
| P. stutzeri1289 | 120 kDa | homodimer | 9.9±1.7 | 1.6±0.2 | --- |
| P. denitrificans1280 | 144 kDa | homodimer | 7.6±0.4 | --- | 71% |
| P. aeruginosa1283 | 120 kDa | homodimer | 8.2±0.4 | --- | 94% |
| A. xylosoxidans1286 | 130 kDa | homodimer | 7.1±0.4 | --- | 73% |
N2OR contains two copper sites: CuA, a binuclear copper site with two Cys, two His, one Met and the backbone carbonyl of a Trp residue as ligands, which acts as an electron transfer site (as in the heme-copper oxidases, see Section 3.7.2), and CuZ, a tetranuclear µ4- sulfide bridged cluster liganded by seven His residues, which is thought to be the site of N2O binding and reduction (see Section 5.2.3).1292 The ligands of the CuA site were identified from mutagenesis studies and its structure was determined by analogy to the structurally characterized CuA site in the heme-copper oxidases, which has close to identical properties to CuA in N2OR.58,1293,1294 In contrast, the structure of CuZ was determined by X-ray crystallography and is still a matter of active study (vide infra and discussion in Section 5.2.3). The residues binding the CuA and CuZ sites are strictly conserved in all the N2ORs, showing that the copper sites are present even in N2ORs which have not been structurally or spectroscopically characterized.1244 There is a high degree of similarity between N2ORs isolated from different sources (Table 42). The sequence similarity of all purified N2ORs with PsN2OR is greater than 70%, with the noted exceptions of TdN2OR and WsN2OR. TdN2OR is a membrane bound protein,1285 while other N2ORs are periplasmic, and WsN2OR contains an additional domain with a heme cofactor,1281 which accounts for the sequence differences. Despite the high sequence similarity between N2ORs, AcN2OR and RsN2OR were initially reported to be monomeric based on gel filtration results that did not show a band for the native dimer.1279,1282 However, in view of the conclusion drawn from X-ray crystallography that the dimerization is necessary for function (see Section 5.2.3), and a subsequent crystal structure showing that AcN2OR is in fact a dimer,1295 it is likely that both AcN2OR and RsN2OR are dimers. In fact, the largest biochemical difference between N2ORs from different sources is the large variability in their analytical copper content, which can vary significantly between sources and for the same source organism, depending on the protein purification conditions (vide infra). The initial purifications of N2OR reported a low copper content of 8 Cu per dimer1278,1280 compared to more recent results of ~10 Cu per dimer, but even these recent analytical results do not show full copper loading (12 Cu per dimer, based on X-ray crystallography).1288,1289 This is attributed to incomplete loading of CuZ in vivo or to loss of some CuZ during the protein purification. Analytical sulfide quantitation in N2OR does not show the same variability, although a sulfide concentration assay that is not susceptible to sulfide oxidation and using the copper content to account for CuZ occupancy is required to accurately determine the sulfide count per CuZ site.1289,1296
A gene cluster has been identified that is required for N2O reduction, which encodes the N2OR protein and several ancillary proteins required for its expression, maturation, and maintenance.1297,1298 The core of this cluster, which is the minimum required for N2O reduction, contains six genes (NosRZDFYL) and is sometimes associated with a further gene, NosX.1299 It is also associated with the Tat transporter system, which is responsible for transporting the N2OR apo-protein into the periplasm, where the maturation of N2OR is completed.1300 Preliminary investigations have described the characteristics and putative functions of the protein products of the Nos gene cluster. The NosZ gene encodes the N2OR apo protein.1301 In mutant strains that lack the NosDFY or NosL proteins or contain a modified form of the NosR protein, the biogenesis of the CuA site is unaffected.1244 CuA can be reconstituted in N2OR by exogenous copper in vitro while CuZ cannot be reconstituted,1278 underlining the importance of a chaperone assisted biogenesis mechanism for CuZ but not for CuA. CuA is thought to be loaded in vivo by the same route used for the loading of CuA in the hemecopper oxidases, by transfer of CuI from a ubiquitous copper chaperone.1244 The ancillary genes of the Nos gene cluster are therefore associated with the biogenesis of the CuZ site and its maintenance in vivo or with regulation of NosZ expression. NosDFY encodes an ABC type transporter where NosY is a membrane-spanning protein, NosF is a cytoplasmic ATPase, and NosD is a periplasmic protein from the carbohydrate binding and sugar hydrolase protein family.1298 Mutant strains lacking NosDFY express CuZ deficient N2OR, indicating that NosDFY is essential for CuZ biogenesis.1299,1302 The exact role of this transporter system is not known, but it is proposed to be the sulfur transporter that supplies the sulfide required for CuZ biogenesis.1244 NosL encodes a lipoprotein which preferentially binds a single CuI and is thought to be the copper transporter associated with CuZ assembly.1303,1304 However, active N2OR containing both copper sites can be obtained in the absence of NosL, so an alternative Cu chaperone must exist and NosL is not essential.1303 NosR encodes a transmembrane protein that contains a flavin binding site in the N-terminal (periplasmic) domain and two [4Fe-4S] ferrodoxintype iron-sulfur clusters in the C-terminal (cytoplasmic) domain.1305 In the absence of NosR, the NosZ protein is not expressed, indicating that NosR has a regulatory role. However, in the presence of modified forms of NosR where the flavin binding domain is deleted or the ferrodoxin sites are modified, N2OR is obtained that contains both CuA and CuZ, but the spectroscopic and redox properties of CuZ are modified (vide infra).1305 A similar phenotype is obtained in the absence of the NosX gene product for organisms that contain NosX, which codes for another periplasmic flavoprotein.1306 This suggests that NosR and NosX are not involved in CuZ biogenesis but play a role altering the state of the CuZ site during turnover and sustaining the catalytic activity of N2OR. If NosR and NosX are in fact required to sustain N2O reduction in vivo, further study of the process of CuZ biogenesis and maintenance will be necessary to define the full catalytic mechanism of N2OR.
Both whole cell and in vitro studies have been used to discover the identity of the physiological electron donor to N2OR, not least so that its reactivity can be studied with the native electron donor rather than with a non-physiological reductant. Whole cell studies in a variety of bacteria confirm that a periplasmic cytochrome c is oxidized with the initialization of N2O reduction.1307 In some cases the specific cytochrome c that is the physiological electron donor has been identified. Strains that knock out particular cytochrome c proteins in vivo have been used to identify cytochrome c2 as the electron donor to N2OR in R. capsulatus.1308 In vitro reactivity studies have identified the endogenous electron donor of PnN2OR as cytochrome c551 1309 and that of PpN2OR as cytochrome c552.1310 However, PpN2OR,1310 AcN2OR,1291 and WsN2OR1311 will also turn over in vitro with mammalian cytochrome c as the electron donor and PpN2OR1284 and AcN2OR1312 will also accept electrons from pseudoazurin.1312 In contrast, PnN2OR is only reactive with the native cytochrome c from P. nautica.1309 The interaction between cytochrome c and N2OR has been studied using molecular dynamics docking simulations.1313,1314 These show cytochrome c binding to a hydrophobic portion of the surface of N2OR near the CuA site, with a 10–14 Å distance between the heme and CuA.
An interesting issue is that N2OR is observed to have different spectroscopic features, redox properties, and reactivity depending on whether it is purified aerobically or anaerobically.1278,1290,1315 In the absence of the NosR and NosX proteins accessory proteins, N2OR purified under anaerobic conditions has identical characteristics to aerobically purified protein.1305,1306 These differences take on new significance with the recent publication of a crystal structure of anaerobically prepared PsN2OR which shows a different structure for the CuZ site than that observed for aerobically prepared protein (see Section 5.2.3).1296 Early biochemical studies and the recent X-ray structure agree that aerobically and anaerobically purified N2OR have identical molecular weights and protein structure.1278,1296 Instead the observed differences result from changes in the CuZ site. While most N2ORs have only been purified under one set of conditions, three different studies have performed parallel anaerobic and aerobic purifications.1278,1290,1291 These show that there is a lower copper content in aerobically isolated protein (first three preparations in Table 42). This is attributed to sensitivity of the CuZ site towards O2, leading to a loss of CuZ upon aerobic handling, which accounts for some differences in the relative reactivity and spectral features of aerobically and anaerobically prepared N2OR (see Sections 5.2.2 and 5.2.4).1291,1316 However, the majority of the differences cannot be explained only by changing relative occupancies of the CuA and CuZ sites. The CuZ site is also isolated in a different redox state depending on the purification conditions.1290 The CuII3CuI (1-hole) redox state is the resting state of the CuZ site obtained from aerobic purifications and the 2CuII2CuI (2-hole) redox state is obtained from anaerobic purifications (the assignment of these redox states will be discussed in Section 5.2.4). Further, the CuZ site has different redox properties in anaerobically and aerobically prepared N2OR. For anaerobically prepared N2OR, a reversible redox couple between the 2-hole and 1-hole states of the CuZ site can be observed with E’ = +60 mV versus NHE in addition to the CuAox (Cu1.5-Cu1.5) to CuAred (CuI-CuI) redox couple at E’ = +260 mV versus NHE.1290 However, for aerobically prepared N2OR the CuZ site is redox inert under all conditions except reduction with methyl viologen, which has been shown to reduce CuZ to the fully reduced 4CuI redox state (see Section 5.2.2).1317 These differences in redox properties lead several studies to propose that there are structurally different CuZ sites in anaerobically and aerobically prepared N2OR, which have been named CuZ and CuZ* respectively.1290,1318 CuZ* is then considered to be an inactive form of the catalytic center generated by reaction with O2. Prior to the recent crystal structure, this structural difference between CuZ and CuZ* was thought to be a minor perturbation, perhaps due to a second sphere residue interaction, since the spectroscopic properties of CuZ and CuZ* are very similar when they are compared in the 1-hole redox state (see Section 5.2.4).1290,1318 However, the recent X-ray crystal structure of anaerobic N2OR in fact indicates a significant structural difference, with CuZ containing two bridging sulfide ligands while the previously described structure of CuZ* contains only one.1296 These results will be discussed in Section 5.2.3. In light of this new structural information, interpretation of the spectral features and electronic structure of CuZ is required and the relationship between CuZ and CuZ* and their involvement in the catalytic cycle must be addressed. Additionally, the roles of CuZ and CuZ* in vivo require definition, since the relative abundance of these two forms of the cluster depends not only on O2 but also on the ancillary proteins NosR and NosX. With the recent definition of the structure of CuZ relative to CuZ*, the stage is set to address the questions that remain about the differences between anaerobically and aerobically purified N2OR and the relevance of these differences to N2OR reactivity.
5.2.2 Kinetics
N2OR reactivity is measured with a standard assay system that employs reduced methyl viologen or benzyl viologen as the electron donor, which is present in large excess.1319 The viologen can be reduced using clostridial hydrogenase,1277 a stoichiometric amount of dithionite or photochemically by a flavin and UV light.1278 The reaction is initiated either by adding N2OR to the reductant solution presaturated with N2O1309 or by injecting N2O into a mixture of the reductant and N2OR.1319 The reactivity can then be monitored spectrophotometrically by following the decay of the absorption of the reduced viologen or by GC analysis of the amount of N2O present over time. The rate of N2O consumption is reported as a specific activity in µmol N2O min−1 mg−1 N2OR. A summary of the activities of N2ORs isolated from various source organisms is presented in Table 43.
Table 43.
Specific activities of N2ORs from different source organisms and a comparison between as isolated values and activities after base activation or reductive activation (results from anaerobic purifications shaded).
| Source Organism |
Purification Conditions |
Specific Activity (µmol N2O min−1 mg−1) | ||
|---|---|---|---|---|
| as isolated |
methyl viologen activation |
base activation | ||
| P. stutzeri | aerobic | 1.8 (30°C, pH 7.1)1278 | 11 (30°C, pH 10)1278 | |
| anaerobic | 4.3 (30°C, pH 7.1)1278 | 60 (30°C, pH 10)1278 | ||
| R. sphaeroides | aerobic | 25 (pH 9)1279 | 63 (pH 9)1279 | |
| P. denitrificans | anaerobic | 122 (30°C, pH 7.1)1280 | ||
| W. succinogenes | aerobic | 160 (25°C)1281 | ||
| A. cycloclastes | aerobic | 86.4 (20°C, pH 7.1)1282 | ||
| A. cycloclastes (recombinant) | aerobic | 13 (25°C, pH 8)1291 | ||
| anaerobic | 7 (25°C, pH 8)1291 | 124 (25°C, pH 8)1291 | ||
| P. aeruginosa | anaerobic | 0.51283 | 27 (pH 10)1283 | |
| P. pantotrophus | aerobic | 81290 | 16 (pH 9)1284 | 3.7 (pH 9)1284 |
| anaerobic | 31290 | |||
| A. xylosoxidans | anaerobic | 6 (25°C, pH 7.1)1286 | 8 (pH 10)1286 | |
| P. nautica | aerobic | 55 (25°C, pH 7.1)1288 | ||
| 157 (pH 7.6)1309 | ||||
The specific activities of N2ORs isolated from different sources can be compared to the activity of N2OR in vivo. This activity has been estimated in P. stutzeri by measuring the consumption of N2O by whole cells and estimating the amount of N2OR in the cell immunochemically.1278 This yields an activity range of 48–72 µmol min−1 mg−1 as the minimum specific activity of PsN2OR in vivo. In comparison, the activity of N2ORs assayed as isolated is in the range of 1–10 µmol min−1 mg−1, well below the minimum activity in vivo, showing that N2OR from both aerobic and anaerobic preparations is obtained in an inactive state and a chemical activation step is necessary to restore N2OR to full activity.1317 Thus, comparisons of the activities of as isolated N2ORs have limited usefulness for understanding the kinetics and mechanism of N2OR. These values likely reflect the reactivity of a small amount of active N2OR present in the assay. Instead, considering the conditions required to activate the enzyme and its reactivity in an activated form are required to understand the kinetics and molecular mechanism of N2O reduction by N2OR. An exception to this is WsN2OR, which has a specific activity of 160 µmol min−1 mg−1 without prior activation.1281 The presence of the additional heme site in WsN2OR gives it unique reactivity, including the ability to perform turnover with dithionite as the sole electron donor, while other N2ORs are inactive unless methyl viologen or cytochrome c are used as the electron source.
Two procedures have been discovered that activate as isolated N2OR, increasing its specific activity by 1–2 orders of magnitude to values equal or greater than the minimum activity expected based on whole cells. The first is a base activation procedure in which as-isolated N2OR is dialyzed overnight against a high pH buffer (pH 9–10).1278 First reported for PsN2OR, base activation results in a 14-fold increase in the activity of anaerobically isolated PsN2OR but only a 6-fold increase in the activity of aerobically isolated PsN2OR. It has also been observed for anaerobically isolated PaN2OR (54-fold increase in activity)1283 and aerobically isolated PpN2OR (4-fold increase in activity).1284 The molecular basis for the activation process is not known and no structural or spectroscopic studies have been reported on N2OR after prolonged dialysis at high pH. Spectroscopic studies of anaerobically purified AcN2OR and aerobically purified PnN2OR at pH 10 show only small differences in the CuZ* site due to pH (see 5.2.4).1320 Whether there is a high pH effect on the CuZ site or on CuA has not been investigated. Further study of the base activation process has the potential to yield new insight into the reactivity of N2OR.
The second activation procedure is a reductive activation in which N2OR undergoes a prolonged preincubation with reduced methyl viologen (kactivation=0.07 min−1), which is already present in the activity assay.1317 This increases the activity of both anaerobically and aerobically isolated protein by 2 orders of magnitude over the asisolated values, to maximum values of 122 µmol min−1 mg−1 (anaerobic AcN2OR)1291 and 275 µmol min−1 mg−1 (aerobic PnN2OR).1317 The origin of this increase in activity was elucidated by Ghosh et al., who showed that the activation is correlated to a decrease in the EPR spin intensity observed for the 1-hole CuZ* site (Figure 233).1317 Thus, the mechanism of activation is reduction of the CuZ* site, initially in the resting 1-hole redox state (S=½, see Section 5.2.4), to the fully reduced 4CuI state (S=0), which is the active redox state for reaction with N2O. The 4CuI state can also react directly with N2O in the absence of additional reductant to generate a two electron oxidized CuAox 1-hole CuZ* state of N2OR, with the reduction of N2O to N2 confirmed by gas chromatography mass spectrometry detection of isotopically labeled 15N2 produced from 15N2O during the single turnover.1321 High steady-state activity with methyl viologen is not observed for any redox states of the CuZ site (with the 4Cu2S site rather than the CuZ* 4Cu1S site).1290 When the [CuAox CuZ 2-hole], [CuAred CuZ 2-hole], and [CuAred CuZ 1-hole] states are prepared from PpN2OR, their observed activities are low for all three redox states in both aerobically and anaerobically prepared enzyme (8 and 2 µmol min−1 mg−1, respectively).1290 Thus, the 4CuI redox state is the active state of CuZ* in the methyl viologen assay. It is likely that the small activities reported for other redox states of N2OR are a result of reduction of a small amount (1–5%) of the N2OR by the methyl viologen present in the activity assay, which then accounts for all of the observed activity.
Figure 233.

The increase in the specific activity of PnN2OR (blue) upon incubation with reduced methyl viologen correlates with a decrease in the EPR spin intensity (red) of 1-hole CuZ*. Inset: Intensity of the EPR spectra of 1-hole CuZ* decrease upon incubation with methyl viologen. (Reprinted with permission from Ref. 1317. Copyright 2003 American Chemical Society.)
Despite this evidence that the 4CuI state is the active redox state of CuZ*, the reduction of the resting 1-hole state of CuZ* to the 4CuI state is too slow to be part of the catalytic cycle (kred = 0.07 min−1 in the presence of a 500-fold excess of reduced methyl viologen,1317 compared to kcat = 275 s−1 in the steady state turnover of PnN2OR).1309 Several explanations for this discrepancy have been proposed, including that the slow rate and requirement for a non-physiological reductant rule out the involvement of the 4CuI redox state in vivo or that an alternative reduction step available in vivo rapidly converts resting 1-hole CuZ* to the fully reduced state. A more attractive explanation is that the resting 1-hole state of CuZ is itself not part of the catalytic cycle. Indeed, an alternative 1-hole intermediate state of CuZ* has been observed in the single turnover of PnN2OR when fully reduced [CuAred 4CuI CuZ*] N2OR is reacted with a stoichiometric amount of N2O.1322 CuA and CuZ* are rapidly oxidized, but while CuZ* is observed to be in a 1-hole redox state, its spectral features differ from those of the resting 1-hole state. In the absence of further reaction, this intermediate species, designated CuZo, slowly converts to resting 1-hole CuZ* (kobs = 0.3 min−1).1322 CuZo has high specific activity, equal to that of the 4CuI state, indicating that it is kinetically competent and can be rapidly reduced in turnover. The decay of this activity occurs with the same rate constant as the decay rate of CuZo obtained spectroscopically (kdecay = 0.3 min−1), indicating that N2OR activity is dependent on the presence of CuZo, not the resting 1-hole form of CuZ*.1322 This resolves the issue of the slow rate of reduction of the resting 1-hole state, since turnover can proceed from the 4CuI redox state through 1-hole CuZo without requiring a slow reduction step. It is important now to determine how the 1-hole form of CuZo relates to that of CuZ* to understand the effectiveness of this intermediate in turnover.
Steady state kinetic studies on reductively activated protein have been used to investigate the dependence of N2OR reactivity on substrate concentration, reductant concentration, pH and solvent deuteration.1291,1309,1323 Usually these have been done without controlling for the ratio of CuZ* to CuZ present, but the values reported for aerobically purified N2OR should correspond solely to CuZ* reactivity. The N2O concentration dependence of steady state turnover, performed for anaerobically isolated AcN2OR1291 and aerobically isolated PnN2OR,1309 yields similar kcat and KM value, with kcat on the order of 200 s−1 and KM(N2O) values on the order of 20 µM, indicating weak binding of N2O (Table 43).
The reductant concentration dependence gives a KM(methyl viologen) of 12 µM. For PnN2OR containing only CuZ*, the maximum specific activity is reported in the pH range of 8 to 9, with decreasing activity at low pHs with a pKa of 6.6.1309 Anaerobically isolated AcN2OR shows a more complex dependence on pH.1323 The pH profile of activity shows two maxima, indicating four separate pKa’s significant to turnover. The position and intensities of these maxima also shift depending on the pH used for the preceding reductive activation step. This complex dependence of N2OR reactivity on pH has not been fully explained and how it relates to the possible presence of CuZ due to anaerobic isolation is unclear. The dependence of the rate of the reductive activation step on pH has been separately investigated in aerobically isolated PnN2OR and is 4-fold slower at high pH (pKa = 9.0±0.2).1320 This pKa has been assigned to a Lys residue that protonates and hydrogen bonds to a hydroxide ligand on the CuI-CuIV edge, raising the reduction potential of the CuZ* site and making it easier to reduce (vide infra). A solvent deuterium isotope effect has also been observed for AcN2OR with kcat = 163 s−1 and KM= 25 µM in H2O and kcat = 97 s−1 and KM= 35 µM in D2O.1291 The isotope effect on kcat indicates the involvement of a solvent-exchangeable proton in the rate-determining step of N2O reduction, while the difference observed in KM is consistent with a role for hydrogen bonding in the N2O binding step.
Kinetic studies that use cytochrome c as the electron donor have been performed for AcN2OR,1291 PnN2OR,1309 PpN2OR1310 and WsN2OR.1311 These show that cytochrome c is indeed capable of reducing the CuA site and under appropriate conditions N2OR can turnover in vitro with a cytochrome c (either the native cytochrome1309 or mammalian cytochrome c1310) as the electron donor. However, significant kinetic differences are observed when cytochrome c is used as the electron donor instead of methyl viologen. Anaerobically isolated AcN2OR has a relatively high specific activity without prior reductive activation when two equivalents of horse heart cytochrome c are used as the electron donor (45 µmol min−1 mg−1 as isolated compared to 124 µmol min−1 mg−1 after reductive activation with methyl viologen).1291 However, for aerobically isolated PnN2OR turnover with cytochrome c551 requires prior reductive activation and occurs with a very low specific activity, comparable to the activities observed for the inactive state of N2OR (2 µmol min−1 mg−1 with cyt c551 compared to 157 µmol min−1 mg−1 with methyl viologen).1309 The rate of this turnover of PnN2OR with cyt c551 is independent of N2O concentration, indicating that there is a different rate limiting step than for turnover with methyl viologen, and the pH dependence of the activity also differs, showing a maximum at pH 7 (pKa’s 5.5 and 8.3).1309 The rate of electron transfer from cytochrome c551 to PnN2OR has been separately measured by cyclic voltammetry (k = 5.5±0.9 × 10⁵ M−1 s−1) and is consistent with the reported kcat, so under the conditions of the PnN2OR study electron transfer from cytochrome c551 to N2OR is rate-limiting.1322 Rate limiting intermolecular electron transfer from cytochrome c is also consistent with a study of anaerobically isolated PpN2OR which measured the rate of electron transfer from horse heart cytochrome c to PpN2OR in the [CuAox 2-hole CuZ] state to be 150 s−1 when saturating concentrations of cytochrome c are used.1310 Comparing this value to the kcat values for N2ORs with methyl viologen shows that kET(cyt c → N2OR) < kcat(methyl viologen) and thus electron transfer from cyt c should be rate-limiting in turnover when cyt c is the electron donor. Additionally, the [CuAred 2-hole CuZ] state of PpN2OR will react with N2O in the presence of stoichiometric reduced cytochrome c. A lag phase in this reaction may involve reduction of the [CuAred 2-hole CuZ] state and may indicate that an allosteric effect on N2OR, induced by cytochrome c binding, is necessary for reduction of CuZ.1310
Since there are significant differences between N2ORs purified anaerobically and aerobically, comparisons of the specific activities of N2ORs obtained under different purification conditions have been used to attempt to argue which form is physiologically relevant.1296 Studies comparing N2ORs that have been purified from the same organism under two sets of conditions and then assayed identically have been performed, but the results are ambiguous. When aerobic and anaerobic PsN2OR are assayed as isolated, the anaerobic enzyme is slightly more active than the aerobic enzyme, but both have only low activity.1278 After base activation, anaerobic PsN2OR has 10-fold higher activity than the aerobic form.1278 In contrast, PpN2OR assayed as isolated and in different redox states shows lower activity for the anaerobic enzyme, but again these activities were low compared to reductively activated PpN2OR.1290 Aerobically isolated AcN2OR is reported to have a tenth of the activity of anaerobically isolated AcN2OR after reductive activation, but this is attributed to a significantly lower copper content and active site occupancy in the aerobically isolated protein (4.2±1.2 Cu/dimer).1291 The maximum specific activities reported for anaerobic and aerobically purified N2ORs from any source organism following reductive activation are comparable (122 µmol min−1 mg−1 for anaerobic AcN2OR1291 and 157 µmol min−1 mg−1 for aerobic PnN2OR1309). In addition, all of these comparisons assume the same occupancy of the tetranuclear copper site in N2ORs after difference isolation procedures. A further assumption is the enzyme being studied is a pure species rather than a mixture of two active site forms, CuZ and CuZ*, present in different relative amounts depending on the purification conditions, as has been determined by spectroscopic study of anaerobically and aerobically purified PpN2OR.1290 Due to the absence of controls for active site occupancy and the ratio of CuZ to CuZ* present, it is not possible to distinguish the differential reactivity of the anaerobic and aerobic forms of N2OR from the currently available data and further study of the relative reactivities of anaerobically and aerobically purified N2OR is required.
A variety of small molecules that inhibit N2OR have been identified, both from in vitro and in vivo studies. Acetylene is a widely recognized inhibitor of N2OR activity in vivo 1324 but is only weakly inhibiting in vitro.1280 Other in vivo inhibitors, such as hydrogen sulfide 1325, have not been studied in purified N2OR so it is difficult to distinguish whether they directly inhibit N2O reduction by interaction with N2OR or through a regulatory process. Some inhibitors which have been tested in vitro include nitric oxide, nitrite, fluoride, isocyanate and carbon monoxide.1280 While these molecules have been shown to perturb the steady-state activity of N2OR, the type of inhibition, the mode of interaction of these molecules with the copper sites and which redox state they target has not been determined. Cyanide, 2-mercaptoethanol, azide and some chelators irreversibly inhibit N2OR due to decomposition of the active site.1278,1280 One crystallographic study indicates that iodide is an inhibitor of N2OR, but the kinetic data are not reported.1295
5.2.3 Structure
A key turning point in the study of N2OR came with the publication of crystal structures of PnN2OR and PdN2OR in 2000 by Brown et al., who discovered that the CuZ site is a tetranuclear copper cluster, rather than a binuclear copper site, as had been previously proposed (vide infra).1292,1326 Crystal structures for N2OR have since been reported from four sources, PnN2OR (PDB ID 1QNI),1292,1326 PdN2OR (PDB ID 1FWX),1327 AcN2OR (PDB ID 2IWF)1295 and PsN2OR (PDB ID 3SBP, 3SBQ).1296 The first three structures were obtained from aerobically purified and crystallized protein while the recent PsN2OR structure is the sole example of a structure for anaerobically purified and crystallized N2OR. In addition, two crystal structures have been reported with small molecules bound to the active site, a structure of AcN2OR with the inhibitor iodide bound to the CuZ* cluster (PDB ID 2IWK)1295 and a structure of PsN2OR showing the substrate N2O bound near CuZ (PDB ID 3SBR).1296
The initial crystal structure of resting PnN2OR, obtained at 2.4 Å resolution, shows that N2OR is a homodimer, with each monomer containing an N-terminal domain with a 7-bladed β-propeller fold, containing the CuZ* cluster, and a C-terminal domain with a cupredoxin fold, containing the CuA site (Figure 234).1326 The monomers are associated in a head-to-tail fashion, with the C-terminal domain of one monomer forming contacts with the N-terminal domain of the second monomer. The distance between the CuA and CuZ* sites in the same monomer is 40 Å, while the distance between the CuA site in one monomer and the CuZ* site in the second monomer is only 10 Å. This indicates a functional role for dimerization in N2OR, since the 40 Å distance is too great for electron transfer between CuA and CuZ* in the same subunit, but electron transfer across the dimer interface is possible.1326
Figure 234.

Protein structure of the N2OR homodimer (PdN2OR, 1.9 Å resolution) showing the head-to-tail association of the two monomers and the positions of the CuA and CuZ sites. One monomer is colored while the other is grey; copper is colored in green and sulfide in yellow.
The CuA site contains two copper atoms bridged by two Cys residues (Cys565, Cys561), with one copper further ligated by His526 and Met572 while the other is ligated by His569 and the backbone carbonyl of Trp563 (Figure 235). Both His526 and His569 are equitorial and Nδ-coordinated to Cu. The distance between the two copper atoms in CuA is 2.48 Å, consistent with a Cu-Cu bond. The CuA site in N2OR is highly similar the CuA electron transfer site in cytochrome c oxidase, as had previously been predicted by comparison of the spectroscopy of N2OR and CcO (see Section 5.2.4).1326,1328,1329
Figure 235.

The structure of CuA.
CuZ* has been shown to be a tetranuclear copper cluster, unprecedented in biology or in synthetic copper complexes.1326 The four copper atoms in the cluster are arranged in a butterfly structure with a single atom bridging all four coppers, leading to a cluster with approximate C2 symmetry where three of the coppers (CuI, CuII and CuIV) and the µ4 bridging ligand are coplanar (Figure 236A). In the initial report of the crystal structure of PnN2OR, the µ4 bridging ligand in the cluster was assigned as an oxo (O2−).1326 However, after spectroscopic and biochemical results that established that there are sulfur isotope sensitive stretches in the resonance Raman spectrum of the CuZ* site and inorganic sulfide quantification in N2OR giving a 1:6 ratio with Cu,1289 the structure of CuZ* was revised to be a µ4-sulfide bridged tetranuclear copper cluster. Subsequent higher resolution refinement of crystal structures from PdN2OR and AcN2OR (1.6 Å and 1.86 Å resolution, respectively) corroborated this assignment.1292,1295 The copper-copper distances in the CuZ* cluster are not equal, with shorter CuII-CuIV and CuII-CuIII distances than CuI-CuIV and CuI-CuIII distances (Table 44, copper numbering from Figure 236).
Figure 236.

A comparison of the structures of CuZ from different N2OR crystal structures. A) PdN2OR,1292 B) AcN2OR,1295 C) AcN2OR with iodide bound,1295 and D) anaerobically purified PsN2OR.1296 Copper is colored in green; sulfide in yellow; iodine in purple; and oxygen in red.
Table 44.
Bond lengths and angles for CuZ* for aerobically crystallized PdN2OR1327 and CuZ from anaerobically crystallized PsN2OR.1296
The cluster is ligated by seven histidine residues, with two His ligating each copper atom with the exception of CuIV, which has only one His ligand. Five of the seven ligating His residues are Nε-coordinated, while His437 and His79, bound to CuIV and CuII respectively, are Nδ-coordinated. An important difference between the known structures of the CuZ cluster is the number and identity of the ligands on the CuI-CuIV edge. In PnN2OR and PdN2OR, one solvent derived ligand is observed on the CuI-CuIV edge, occupying a bridging position in PdN2OR1327 (Figure 236A) but closer to CuIV in PnN2OR.1292 In AcN2OR, two solvent derived ligands are observed, one bound to CuI and the other to CuIV (Figure 236B).1295 The CuI-CuIV edge is the most open edge of the CuZ* cluster and therefore is proposed to be the site of N2O binding.1326,1330 The variability in solvent coordination at this edge is consistent with labile solvent derived ligands that can be easily replaced by N2O. A crystal structure of AcN2OR with the inhibitor iodide bound to CuZ* has also been reported (Figure 236C).1295 Iodide binds as a bridging ligand on the CuI-CuIV edge, displacing the solvent-derived ligands and blocking the proposed site of N2O binding. The proposed mechanism of inhibition for I− is thus competing with N2O for binding to the CuI-CuIV edge of the cluster.
The recent publication of a crystal structure of anaerobically purified and crystallized PsN2OR challenges the role of the CuI-CuIV edge as the N2O binding site and also sheds new light on the differences between anaerobically and aerobically purified N2OR (containing CuZ and CuZ*, respectively).1296 The overall protein fold and dimer structure of anaerobic PsN2OR does not differ significantly from previous crystal structures. However, significant changes are observed in the copper sites. The CuZ site has an additional sulfur ligand bridging the CuI-CuIV edge, blocking the proposed N2O binding site (Figure 236D). This edge ligand has been described as a sulfide but definitive assignment of its protonation state is beyond the scope of X-ray crystallography. The remainder of the structure of the site, including the bond lengths and angles between the copper atoms and the µ4-sulfide, is conserved relative to the previously described 4CuS site in aerobically purified N2OR (Table 45). This establishes the key structural difference between the copper sites in anaerobically and aerobically purified N2OR: CuZ is a 4Cu2S cluster while CuZ* is a 4Cu1S cluster with a solvent derived edge ligand. A change also occurs in the CuA site. His583, the His ligand of the Cu atom further from CuZ, is not bound to the CuA site in this structure but instead is swung away from the copper, leaving it three-coordinate. This difference is not observed in cytochrome c oxidase but has been proposed in N2OR to be a switching mechanism for triggering electron transfer from CuA to CuZ.1296
Table 45.
Energies and assignments of the electronic transitions of 1-hole CuZ* from simultaneous fit of its absorption, CD, and MCD spectra.1330
| band | assignment | νmax (cm-1) |
ε (abs) (M−1 cm−1) |
Δε (MCD) (mM−1 cm−1) |
Co/Do |
|---|---|---|---|---|---|
| 1 | z2 | 8015 | 1320 | −20 | −0.016 |
| 2 | IT | 10000 | 1760 | --- | --- |
| 3 | xz | 11140 | 1100 | −225 | −0.218 |
| 4 | yx | 12900 | 1075 | −196 | −0.194 |
| 5 | S pz’ | 14300 | 1455 | −446 | −0.327 |
| 6 | S px’ | 15675 | 3470 | 640 | 0.196 |
| 7 | S py’ | 16520 | 2135 | 182 | 0.091 |
| 8 | xy | 17980 | 740 | 119 | 0.170 |
| 9 | π1 | 19775 | 725 | −20 | −0.029 |
| 10 | π1 | 20985 | 930 | −39 | −0.045 |
| 11 | π1 | 22270 | 785 | 143 | 0.193 |
| 12 | π1 | 24030 | 1590 | −71 | −0.047 |
| 13 | π2 | 28055 | 3295 | −8 | −0.002 |
A structure has also been determined for anaerobic PsN2OR with N2O bound near the CuZ site, obtained by pressurizing the anaerobic crystal with 15 bar of N2O followed by flash freezing.1296 One localized N2O molecule is observed adjacent to the CuZ site, positioned above the CuIV- µ4S-CuII face of the cluster and hydrogen bonding to two second sphere residues, Met627 and through a localized water molecule to His626, which is also a CuA ligand (Figure 237). The shortest distance between N2O and the CuZ site is 3.1 Å (N2-CuII), which is too long to represent a coordination interaction. The N2O molecule is linear, indicating that there is no significant back-bonding from the CuZ cluster. It is possible that N2O is present in the protein channel through which it accesses the CuZ site but the redox state of CuZ present in the crystal is not the correct one to coordinate N2O and activate it for reduction. In an interesting detail, when N2O is bound between the CuA and CuZ sites the His583 residue again ligates the more distant Cu of CuA.1296 The significance of this conformational change of the CuA site to reactivity and how N2O binding can trigger this change on the side of CuA that is more distant from its binding site needs future investigation.
Figure 237.

The structure of N2O bound at the CuZ site in a crystal of anaerobic PsN2OR. Distances to CuZ and key residues labelled in Å.
5.2.4 Spectroscopy and Electronic Structure
N2OR is a protein for which a rich array of spectroscopic information is available. Early in the study of N2OR, different states of the protein were qualitatively differentiated based on their color (e.g. anaerobically isolated N2OR was identified as “the purple form” while aerobically isolated N2OR was identified as “the pink form”).1278 These colors reflect the rich absorption spectra of the CuA, CuZ* and CuZ sites, which contain intense absorption bands in the visible region due to S→Cu ligand to metal charge transfer transitions from the sulfide ligand in the CuZ and CuZ* clusters and the bridging Cys ligands in CuA. These intense LMCT transitions provide an opportunity to study the vibrations of these sites by resonance Raman spectroscopy and further result in increased intensity for the copper d-d transitions, which borrow intensity from the LMCT transitions. Significant insights have also been derived from electron paramagnetic resonance and X-ray absorption spectroscopy. Key insights that have been obtained by spectroscopy include the identification of the µ4 sulfide ligand in CuZ*,1289 the elucidation of the resting redox states of CuZ and CuZ*,1290,1331 and the role of a second sphere Lys residue that hydrogen bonds to the solvent derived ligand on the CuI-CuIV edge of CuZ*.1320 Some ongoing areas of study are the spectroscopic differences between Cu005A, CuZ*, and CuZo, the insight these give into the electronic structures of these sites given their different structures, and how these differences relate to reactivity.
The spectroscopic features and electronic structure of CuA have been extensively described through the study of the CuA containing domain of CcO,1332 spectroscopic studies of an N2OR mutant deficient in CuZ,1297 and synthetic constructs of CuA in azurin.62,1333 The key spectral features of CuAox contribute to the spectroscopy of resting N2OR prior to reduction and therefore are summarized here, while CuAred is spectroscopically silent. CuAox is a class III MV Cu1.5-Cu1.5 site with a σu* ground state and a low-lying πu excited state (Figure 238).59,1334,1335 CuAox exhibits an axial EPR signal with g// of 2.18 and g⊥ of 2.02 and a sharp 7 line hyperfine pattern in the g// region with A// = 44×10−4 cm−1 (Figure 239A, spectra shown from a CuZ deficient mutanted varient of PsN2OR known as N2OR V).1294,1336 The 7 line hyperfine pattern shows that the unpaired spin is delocalized over two equivalent Cu nuclei (ICu = 3/2) and the small A// value indicates high covalent delocalization of the unpaired spin onto the Cys thiolate ligands (26±3% S character by S K-edge XAS).1337 The g// value of 2.18 is achieved through mixing with the low-lying πu excited state at an energy ~3,500 cm−1 above the G.S.1335 CuAox has an absorption spectrum with three transitions at 20,800 cm−1 (480 nm, ε≈4000 M−1 cm−1), 18,500 cm−1 (540 nm, ε≈4000 M−1 cm−1), and 12,800 cm−1 (780 nm, ε≈3000 M−1 cm−1) (Figure 239B).1334 The absorption transitions at 20,800 cm−1 and 18,500 cm−1 correspond to an intense pseudo A feature in the MCD spectrum of CuAox (Figure 239C) and are assigned to the perpendicularly polarized S(px)→SOMO and S(py)→SOMO transitions. In a pure σu* G.S., only the S(px) orbital would have overlap with the SOMO, so the observation of two S(p)→SOMO transitions is another result of the πu mixing into the G.S. Upon laser excitation into the CysS(px,y)→SOMO CT transitions, dominant Cu-S(Cys) stretching modes at 259 cm−1 (mixed Cu-S(Cys)/Cu-N(His) stretching mode, Δ34S = −3.4 cm−1), 276 cm−1 (out of plane “twisting” Cu-S stretching mode, Δ34S = −1.9 cm−1) and 347 cm−1 (Cu2S2 core breathing mode, Δ34S = −1.6 cm−1) are enhanced.1318 In N2OR, the 347 cm−1 Cu2S2 stretch is split into seven total 34S isotope sensitive modes ranging from 323–408 cm−1 in energy, which arises from coupling with the Cys and His sidechain vibrations. The transition at 12,800 cm−1 in both the absorption and MCD spectra has been assigned as the intervalence ψ→ψ* CT transition associated with the mixed valent nature of the 2Cu1.5 site.62 Laser excitation into this transition resonance enhances the three vibrations discussed above and additionally enhances an ~130 cm−1 core “accordion” mode involving motions of the two Cu nuclei along the Cu-Cu bond vector, characteristic of a ψ→ψ* CT for a class III mixed valent site. The relatively high energy of this ψ→ψ* transition indicates direct Cu-Cu orbital overlap, due to the short 2.48 Å distance between the coppers in the CuAox site. The mixed valent σu* G.S. of CuAox with its direct Cu-Cu bonding (Figure 238) results in significant electronic delocalization that is essential for a low site reorganization energy, leading to rapid and efficient electron transfer.62
Figure 238.

DFT optimized ground state wavefunction (σu*) and low-lying excited state wavefunction (πu) of CuA modeled as [Cu2(SCH3)(imz)2]+ (B3LYP/TZVP(Cu,S)/6-31G*). (Reprinted with permission from Ref. 1335. Copyright 2003 American Chemical Society.)
Figure 239.

Spectral features of CuA from the N2OR V variant of PsN2OR (lacking the CuZ cluster). A) 77 K EPR spectrum. B) Room temperature absorption spectrum. C) Low temperature MCD spectrum.
All of the spectral features of CuAox can be observed in the absorption, MCD, and EPR spectra of resting N2OR (Figure 240), whether it is isolated anaerobically (A) or aerobically (B).1290 The 7 line hyperfine pattern of CuA appears significantly sharpened in N2OR that is prepared anaerobically. This sharper hyperfine pattern is also seen for the CuZ deficient variant N2OR V (Figure 240 A).1334 In both cases, the sharpness of the CuA signal is due to the absence of spectral overlap with an additional S=½ signal, assigned to resting CuZ*, that is present in aerobically isolated N2OR but absent in anaerobically isolated N2OR.1290 Thus, no significant differences in the spectroscopy of CuAox in resting N2OR are observable between anaerobically and aerobically isolated N2OR despite crystallographic evidence that in anaerobically isolated N2OR CuA has one less His ligand.1296 Absence of a His ligand, which is a strongly bound equatorial Cu ligand, would be expected to significantly perturb the spin distribution of the site, which should be reflected in the EPR spectrum (as has been observed for a His→Ala variant in a construct of CuA in azurin).716 The absence of such a perturbation of the CuAox EPR spectrum in resting anaerobically isolated N2OR has yet to be explained and developing an understanding of this is necessary to evaluate the effect of the His(off)→His(on) conformational change on electron transfer by CuA and thus its contribution to N2OR reactivity.
Figure 240.

Spectroscopic comparison of anaerobically and aerobically purified PsN2OR. A) Room temperature absorption, low temperature MCD (7T, 5K), and low temperature EPR (77 K) of anaerobically isolated N2OR in the fully oxidized state (black), ascorbate reduced state (red) and dithionite-reduced state (blue). B) Room temperature absorption, low temperature MCD (7T, 5K), and low temperature EPR (77 K) of aerobically isolated N2OR in the fully oxidized state (black), ascorbate reduced state (red) and dithionite-reduced state (blue).
Spectroscopic studies of the CuZ* site, which assigned the spectral features and used these to elucidate the electronic structure of the active site, were performed on the dithionite reduced state of resting aerobically isolated PnN2OR.1330,1331 Under these conditions, CuA is selectively reduced so it does not contribute and the remaining spectral features are due to CuZ*. Both the EPR spectrum and the magnetic saturation behavior of the MCD spectrum of CuZ* indicate that the resting state of this site has a total spin of ½.1331 Two redox states with S=½ are possible for a tetranuclear copper site: the 3-hole 3CuIICuI state (where two of the oxidized coppers are antiferromagnetically coupled) and the 1-hole CuII3CuI state. Fitting the intensity of the feature at 8984 eV in the pre-edge of the Cu K-edge X-ray absorption spectrum, a feature characteristic of CuI complexes, was used to distinguish between the two possibilities. The intensity at 8984 eV in the Cu K-edge XAS spectrum of dithionite reduced PnN2OR (Figure 241) establishes the 1-hole state (i.e. CuII3CuI) as the resting redox state of CuZ*.1331
Figure 241.

Copper K-edge X-ray absorption spectrum of N2OR, with fits predicted for a 3CuIICuI site (dashed) and a CuII3CuI site (dotted).
The dominant absorption feature of 1-hole CuZ* is a broad absorption band at 15,600 cm−1 (640 nm, ε ≈ 4000 M−1 cm−1) that gives dithionite-reduced N2OR its blue color (Figure 242A).1330 This corresponds to an intense pseudo-A feature in the LT MCD spectrum (bands 5 and 6 in Figure 242B).1330 The presence of a pseudo A feature requires two perpendicularly polarized transitions that can spin-orbit couple in a mutually perpendicular direction on a single center. In CuZ*, the only options that satisfy these conditions are the S→Cu CT transitions from the p orbitals of the µ4 S2− to different copper centers (Figure 243). Upon laser excitation into the 640 nm absorption band, three intense S isotope sensitive vibrational modes are resonance enhanced: 366 cm−1 (Δ34S = −2.1 cm−1), 386 cm−1 (Δ34S = −5.8 cm−1), and 415 cm−1 (Δ34S = −7 cm−1) (Figure 244A).1318 These vibrations profile differently (Figure 244C) and the profile of the 386 cm−1 vibration requires the presence of a third S→Cu CT transition (band 7 in Figure 242), in addition to the two S→Cu CT transitions in the MCD pseudo A (bands 5 and 6).1330 On the basis of the relative intensities of these three S→Cu CT transitions, band assignments rationalized from an orbital overlap model indicate that band 6 (the most intense) is the Spx→Cu CT transition, which has the greatest overlap between donor and acceptor MOs, band 5 is the Spz→Cu CT transition, and band 7 is the Spy→Cu CT transition (where the orientations of the different µ4 S2− p orbitals are given in Figure 243). The resonance enhanced vibrations can be assigned as mixtures of the four Cu-S stretching modes based on normal coordinate analysis and considerations of their enhancement profiles (Figure 244D). The 415 cm−1 is thus assigned as the CuI-S stretch, the 386 cm−1 vibration as the symmetric breathing mode of the cluster, and the 366 cm−1 as dominantly the CuII-S stretch. A total of thirteen electronic transitions are required for a simultaneous fit of the low temperature absorption, CD, and MCD spectra (Table 45).
Figure 242.

A) 10 K absorption spectrum of 1-hole CuZ* from PnN2OR. B) MCD spectrum of 1-hole CuZ* from PnN2OR (+7T, 5K).
Figure 243.

Orientation of the S p orbitals in CuZ*. Selected MOs from a DFT calculation on an early model of the CuZ* site (BP86 38%HF, 6-311G*/6-31G*). (Reprinted with permission from Ref. 1330. Copyright 2002 American Chemical Society.)
Figure 244.

Resonance Raman spectrum of 1-hole CuZ* with pH and H2O18 dependence. A) Resonance raman spectrum of 1-hole CuZ* from PnN2OR at pH 7 (77 K, 629 nm excitation).1320 B) Resonance raman spectrum at pH 10.5 (77 K, 629 nm excitation).1320 C) Excitation profiles of the three resonance enhanced vibrations of 1-hole CuZ* profiled at pH 7, revealing three S to Cu charge transfer transitions (5, 6, 7). D) Normal modes of the CuZ * core assigned by normal coordinate analysis. (Reprinted with permission from Ref. 1330. Copyright 2002 American Chemical Society.)
Six of these transitions, including the three S(p)→Cu charge transfer transitions (bands 5–7), have significant metal character based on their C/D ratios (bands 3–8 in Figure 242). The remaining transitions with high C/D ratios (bands 3–4, 8) are assigned as d-d transitions of the dominantly oxidized copper atom (vide infra) while the transitions with low C/D ratios are assigned as His→Cu CT transitions (bands 9–13) and the intravalence CuII→CuI CT transition (band 2).1330 The EPR spectrum of resting 1-hole CuZ*, determined at both X-band and Q-band, is axial with a g// of 2.16 and g⊥ of 2.04 and hyperfine contributions in the A// region from two copper nuclei in a ~5:2 ratio (A//1 = 61×10−4 cm−1, A//2 = 24×10−4 cm−1) (Figure 245).1331 The low g// value of 2.16 is due to the high energy of the dxy→dx2-y2 transition (18,000 cm−1, band 8).1330 The axial nature of the EPR spectrum shows that the unpaired electron spin is in an orbital with dominant Cu dx2-y2 character and the presence of two unequal A// values indicates that the unpaired spin is delocalized over two copper atoms in a 5:2 ratio.1331 Thus 1-hole CuZ* is a class II mixed-valent site. This correlates well with a ground state wavefunction determined from DFT using a model of the active site with hydroxide as the CuI-CuIV edge ligand (Figure 246) in which the unpaired spin is dominantly localized on CuI (33%) but there is a significant contribution from CuIV (10%).1320 The spin is more localized on CuI because it has a higher coordination number than CuIV (4 ligands rather than 3). The dominant bonding interaction in CuZ* involves the µ4 sulfide px orbital overlap with the dx2-y2 orbitals of CuI and CuII. This σ bonding interaction provides a superexchange pathway between CuI and CuII, which may be important for the ability of the CuZ* site to perform 2 electron chemistry.1330 CuII may also be on the electron transfer pathway between CuA and the CuZ* site, via a solvent bridge between His79, a CuII ligand, and His569, the proximal His ligand of CuA, which are 5.68 Å apart across a solvent-filled cavity.
Figure 245.

EPR spectra of 1-hole CuZ* from PnN2OR. A) X-band EPR at pH 7 and 77 K (simulated spectrum top, experimental bottom). B) Q-band EPR at pH 7 and 77 K (simulation top, experimental bottom). (Reprinted with permission from Ref. 1320. Copyright 2007 American Chemical Society.)
Figure 246.

Lowest unoccupied molecular orbital of 1-hole CuZ*, labeled with Mulliken Atomic Spin Density for core atoms (B3LYP/6-311++G** on Cu4SO/6-31G* on remaining atoms).
The effect of pH on 1-hole CuZ* was further studied to confirm the protonation states of the µ4 S ligand and the solvent derived ligand on the CuI-CuIV edge.1320 The pH dependence of the electronic structure of 1-hole CuZ* was studied by comparing the spectroscopy of dithionite reduced PnN2OR and AcN2OR at pH 6.0 and pH 10.5. The optical transitions of 1-hole CuZ*, determined from the LT absorption and MCD spectra, are not perturbed by pH. The EPR spectra at these two pHs are also virtually identical, indicating that the ground state wavefunction is not perturbed. Thus there is no change in the protonation states of the solvent derived CuI-CuIV edge ligand or the µ4 S ligand over this pH range, since protonating or deprotonating these ligands would significantly perturb the spin density distribution of the cluster. Additionally, the S K-edge XAS spectrum is unaffected by pH, confirming that the protonation state of the µ4 S does not change over this pH range. This strongly favors the assignment of the sulfur ligand as a µ4-sulfide and the CuI-CuIV edge ligand as hydroxide over the whole pH range.1320
While the electronic structure of the 1-hole CuZ* site is unaffected by pH, there is some perturbation of the resonance Raman spectrum of 1-hole CuZ* at high pH.1320 At pH 10.5 the CuI-S stretch shifts up in energy to 424 cm−1 (from 415 cm−1 at pH 6.0) and shows an H2 18O isotope shift of 9 cm−1, compared to pH 6.0 where all three Cu-S stretching vibrations show no solvent 18O isotope sensitivity (Figure 244B). This can be attributed to a shift in the position of the hydroxide ligand on the CuI-CuIV edge, leading to kinematic coupling between the CuI-S stretch and the CuI-OH stretch at high pH. This pH effect has a pKa of 9.2 and is attributed to the deprotonation of a second sphere Lys residue, Lys397, which is 3.6 Å from the CuI-CuIV edge. Either indirect hydrogen bonding, through a localized water molecule bridging between the hydroxide ligand and Lys397, or rotation of Lys397 to form a direct hydrogen bond to the hydroxide are possible. In the DFT optimized structure used to describe the ground state wavefunction of 1-hole CuZ* (vide supra), a direct hydrogen bond with Lys397 is included. With this hydrogen bonding interaction, the hydroxide ligand does not bridge the CuI-CuIV edge, but instead is only bound to CuI (CuI-O 1.95 Å, CuIV-O 3.30 Å).1320
While the electronic structure of the 4Cu2S CuZ site has yet to be defined, a number of previous studies have qualitatively described its spectral features, including the information necessary to deduce its resting redox state. Anaerobically purified N2OR contains an oxidized CuA site as well as the CuZ site. When CuA is selectively reduced with ascorbate, leaving only the spectral features of resting CuZ, the dominant spectral feature of the site is an intense absorption band at 17,900 cm−1 (~560 nm, ε ≈ 4000 M−1 cm−1) with a weaker shoulder at ~15,900 cm−1 (Figure 240A, red).1290 The MCD spectrum of anaerobically prepared N2OR after ascorbate reduction shows only the features of some amount of 1-hole CuZ* (30% CuZ* according to Rasmussen et al.)1290 and no new features due to CuZ, indicating that resting CuZ is diamagnetic. This is supported by EPR, which shows that the resting state of CuZ is EPR silent (Figure 240A, red; a weak, featureless residual signal that represents <2% of the spin of one CuII is again attributed to the presence of some CuZ*).1290 In principle, three redox states with S = 0 are available for a 4Cu2S site: fully oxidized 4CuII (where two pairs of oxidized coppers are antiferromagnetically coupled), 2-hole 2CuII2CuI (with two antiferromagnetically coupled Cu(II)’s), and fully reduced 4CuI. The fully reduced state can be ruled out because of the presence of intense absorption transitions for the site. While no spectroscopic method has yet been used to experimentally distinguish between the fully oxidized and 2-hole redox states (e.g. XAS), the 2-hole redox state is generally considered to be the resting redox state of CuZ, as it is likely to be more energetically accessible than the highly charged [4Cu2S]4+ fully oxidized state.1338
The reducing agent dithionite can be used to reduce anaerobically isolated N2OR to a state containing CuAred and 1-hole 4Cu2S CuZ. Its absorption spectrum is dominated by an intense, broad feature at 14,900 cm−1 (~670 nm, ε ≈ 4000 M−1 cm−1; Figure 240A, blue) that has a corresponding intense pseudo A feature at low temperature that is qualitatively similar to that of 1-hole CuZ* (Figure 240A, blue).1290 The EPR spectrum of 1-hole CuZ is axial with a g⊥ of 2.055 and a g// region that is poorly resolved in X band EPR (Figure 240A, blue). The resonance Raman spectrum obtained from laser excitation into the dominant band of 1-hole CuZ shows two intense S isotope sensitive vibrations at 363 cm−1 and 382 cm−1.1318 Thus the spectroscopic features reported for 1-hole CuZ are qualitatively quite similar to those of 1-hole CuZ*. Prior to the recent crystallographic definition of a 4Cu2S core structure for CuZ (see Section 5.2.3), this high degree of spectroscopic similarity between the 1-hole forms of CuZ and CuZ* led to the conclusion that the difference between the two sites was a matter of the protein environment or second sphere interactions.1290,1318 In light of the significant structural differences between CuZ and CuZ* that have recently been elucidated, further evaluation of the electronic structure of 1-hole CuZ is required to understand both the similarities and the differences between the clusters. Assignment of the protonation states of the two sulfur ligands in CuZ will be the necessary first step towards assigning its spectroscopic features and elucidating its geometric and electronic structure in both of its accessible redox states.
5.2.5 Molecular mechanism
On the basis of kinetic and spectroscopic studies of the reaction of N2O with CuZ* that have identified the active redox state of this site and rate information for a number of steps, a mechanistic proposal for the reaction of the 4Cu1S CuZ* site with N2O in turnover has been developed.1322 Since much of this information is not known for the 4Cu2S CuZ site, particularly its active redox state, a proposed mechanism for N2O reduction by the anaerobic CuZ enzyme is lacking. The mechanism for N2O reduction by CuZ* will be discussed here. Further work to develop a mechanistic understanding of the relative reactivity of the 4Cu2S CuZ site with N2O is an important future direction for N2OR research.
The proposed mechanism for N2O reduction by CuZ*-containing N2OR is presented in Figure 247.1322,1339 The active redox state of CuZ* has been identified as the fully reduced 4CuI state (see Section 5.2.2).1317 Thus, the reaction begins with the fully reduced state of N2OR, in which both CuA and CuZ* are reduced (A). N2O then binds to the 4CuI CuZ* site in a µ-1,3 bridging mode on the CuI-CuIV edge (B).1339 In the next step of N2O reduction, a 2 electron transfer from fully reduced CuZ* to N2O induces N-O bond cleavage, releasing N2 and leaving the oxygen as an O2− ligand bound bidentate on the CuI-CuIV edge of a putative 2-hole intermediate (C). This N-O bond cleavage is then followed by two electron transfer and two proton transfer steps to regenerate fully reduced CuZ* and complete the catalytic cycle. Based on DFT calculations (vide infra), alternating protonation and reduction steps are favored, yielding a possible hydroxobridged 2-hole intermediate (D) which is reduced by electron transfer from CuAred to generate the CuAox/CuZo 1-hole intermediate that is observed experimentally in single turnover (E).1339 The first protonation and reduction steps are rapid, since there is no observed accumulation of a 2-hole CuZ* intermediate (C or D).1322 After reduction of CuAox by the physiological reductant, cytochrome c, CuZo is rapidly reduced by CuAred to complete the catalytic cycle.1309 In the absence of an external reductant, a slower non-reductive decay converts CuZo to the inactive resting 1-hole state of CuZ* (F), which then must undergo a slow reductive activation process to re-enter the catalytic cycle (vide supra).1322 Given the kinetics of electron transfer to N2OR by cytochrome c (see Section 5.2.2),1309,1310 cytochrome c reduction of N2OR is thought to be the rate limiting step in vivo, while with a faster, non-physiological reductant such as methyl viologen the reduction of CuZo by CuAred is likely to be rate-limiting.
Figure 247.

Proposed molecular mechanism for N2O reduction by CuZ* containing N2OR. MV abbreviates methyl viologen.
A number of the details of the mechanism of N2O reduction have been evaluated using DFT calculations, including the binding mode of N2O to the fully reduced state of CuZ*, the role of backbonding in N-O bond cleavage, the role of hydrogen bonding in lowering the barrier for N-O bond cleavage, and the thermodynamics of protonation and reduction of potential CuZ* intermediate species.1339 DFT calculations using the BP86 functional and 6–311G* basis set show that µ-1,3 binding of N2O is the lowest energy structure for N2O coordination to 4CuI CuZ* (Figure 247, B).1339 In the optimized geometry (Figure 248A), the N2O ligand is bent, with a 139° N-N-O angle. This bent binding allows significant backbonding from the 4CuI site into the unoccupied π* orbital of N2O; the LUMO has 61% N2O π* character (mostly on N) and 22% Cu character (Figure 248B). Backbonding results in the elongation of the N-O bond from 1.184 Å in free N2O to 1.321 Å in the complex, indicating that N2O is activated for the key N-O bond cleavage step. These DFT calculations yield an upper limit for the activation barrier for N-O bond cleavage of 18 kcal/mol. This barrier could be further lowered to 9–13 kcal/mol by hydrogen bonding to the O atom of N2O, which carries significantly more charge in the transition state of N-O bond cleavage than in the initial N2O bound complex.1339 However, a model complex study by Bar-Nahum et al. suggests that a µ-1,1-O binding mode for N2O coordination to CuZ* might be relevant and this possibility should be compared to the µ-1,3 binding geometry.1340
Figure 248.

Computationally predicted geometry and electronic structure of N2O binding to fully reduced CuZ*. A) Optimized geometry of the lowest energy structure of N2O bound to 4CuI CuZ* (BP86, 6-311G*). B) LUMO of the N2O complex. (Reprinted with permission from Ref. 1339. Copyright 2006 American Chemical Society.)
DFT calculations have also been used to investigate the thermodynamics of protonation and reduction of potential CuZ* intermediates (Figure 249).1339 Protonation of an oxo-bridged 2-hole intermediate is thermoneutral (ΔG = 0 kcal/mol), which suggests that proton transfer could be concerted with N-O bond cleavage. Subsequent reduction of a hydroxide-bridged 2-hole intermediate is downhill, suggesting that sequential protonation and reduction steps are possible. In contrast, discrete protonation or reduction of a hydroxide-bridged 1-hole intermediate is uphill (ΔG = +17 kcal/mol or ΔG = +15 kcal/mol, respectively), indicating that PCET is required to generate the thermodynamic driving force for formation of the fully reduced state. In the absence of the exogenous electron donor required to perform the second reduction step (via reduction of CuAox, vide supra), a hydroxide-coordinated 1-hole intermediate would be thermodynamically favoured over an oxo-bridged 1-hole species (ΔG = +47 kcal/mol) or a water-coordinated 1-hole species (ΔG = +17 kcal/mol).1339 This suggests that the experimentally observed CuZo intermediate should be a hydroxide-coordinated 1-hole species. However, further spectroscopic characterization is required to definitively assign the structure of CuZo and determine the factors responsible for its rapid reduction in turnover.
Figure 249.

Computational evaluation of sequential protonation and reduction steps to reduce 2-hole oxo-bridged CuZ* to fully reduced aquo-CuZ* (B3LYP/6-311++G** on Cu4SL/6-31G* otherwise).
Four interesting issues must be clarified to fully understand the mechanism of N2O reduction: 1) determining which of CuZ (4Cu2S) and CuZ* (4Cu1S) is, in fact, the reactive form of the cluster in vitro and in vivo, thus evaluating the importance of the CuI-CuIV edge as an N2O binding site, 2) describing the mechanism by which the 4Cu2S CuZ site reacts with N2O, 3) clarifying the nature of the 1-hole CuZo intermediate in the turnover of CuZ* with N2O to elucidate its differences from resting CuZ* that account for its rapid reduction and role in turnover, and 4) determining the nature of the two electron reduction of N2O by trapping a 2-hole intermediate form of CuZ* in turnover before electron transfer from CuA, perhaps in an N2OR variant lacking the CuA site. Thus a number of important directions for research remain to fully understand nitrous oxide reductase and its unique tetranuclear CuZ cluster active site.
6.0 Concluding Comments
In the different sections presented above, we have attempted to define the present state of Cu active site catalysis and biogenesis. A number of topics in Cu biochemistry have not been presented here. The blue Cu and CuA sites are described in passing in the sections on the multicopper oxidases, nitrite reductases, N2O reductases, and cytochrome C oxidases but not presented in detail. Recent reviews are available on their geometric and electronic structures and their contributions to electron transfer.4,1341 Also, Cu/Zn superoxide dismutase, which plays a key role in detoxifying superoxide, and its mutations that can lead to amyotrophic lateral sclerosis (ALS) (also known as Lou Gehrig’s disease) has been the focus of a number of reviews and is presented in the Valentine et al chapter of this issue.1342–1344 We have also not covered the large field of copper homeostasis, transport, and storage which usually involves Cu(I) binding to Cys ligands, which have been thoroughly reviewed.1345,1346
Two particularly interesting areas of Cu bioinorganic chemistry are not explored here as present knowledge is too limited. The GH61 enzymes or polysaccharide monooxygenases (PMOs) have a single Cu center that activates O2 for H-atom abstraction from crystalline cellulose embedded in lignin to break it into smaller soluble saccharides that can be used as precursors for biofuel production (Figure 250A).1347 Crystal structures are now available which show a Cu active site with two His (one methylated at the N-ε position), a terminal amine, and a water-derived ligand.1348,1349 In one structure, the x-ray radiation has reduced the site which has reacted with O2 to form what is proposed to be an end-on bound superoxide (Figure 250B).1349 A mechanism parallel to that of the non-coupled binuclear Cu enzymes in section 3.3, where the Cu(II) superoxide H atom abstracts from the C1 or C4 carbons of cellulose has been invoked,1350 and it will be interesting to see how the ligation differences in GH61s relative to those of the CuM center in the non-coupled binuclear Cu enzymes relate to new reactivities. Also, Cu sites have been strongly correlated to neurodegenerative diseases.1351,1352 Cu(II)’s tightly bound to His, and perhaps deprotonated amide ligands, are present in the prion proteins related to transmissible spongiform encephalopathies, amyloid β proteins related to Alzheimer’s disease, and α-synuclein in Parkinson’s disease. The functional and misfunctional roles of the Cu(II) are unclear but appear to relate to protein folding, aggregation, and perhaps redox to generate reactive oxygen species.
Figure 250.

(A) Reaction of cellulose chain opening by the polysaccharide monooxygenases, via H-atom abstraction from the 1 position, as proposed by Phillips et al. (B) End-on bound superoxide structure of PMO-2 from Neurospora crassa (pdb: 4EIR). Gold sphere: Cu, Red spheres: oxygen. Second sphere residues Y168 and Q166 (<4Å from the Cu) are included
The field of Cu bioinorganic chemistry has developed far in the enzymology, modeling, spectroscopy, and geometric and electronic structure correlation with reactivity. However, as we have tried to emphasize throughout this review, there is still much to be understood in the different classes of Cu enzymes described above and in new areas that are ripe for exploration.
Figure 232.

Three possible geometries of HNO2 binding to the reduced T2 Cu site and the resulting reactions. A) η2 bidentate, B) η1κN, and C) η1κO(H).
Table 11.
Kinetic parameters for reversible O2 binding.
| Organism | Statea | kon (µM−1 s−1) | koff (s−1) |
|---|---|---|---|
| Panulirus interrputus199 | R | 30 to 44 | 13 to 80 |
| Panulirus interrputus199 | T | 20 to 44 | 280 to 2750 |
| Limulous polyphemus268 | C | 1.4 to 2.5 | 9 to 55 |
| Buccinum undatum305 | R | 8.5 | 80 |
| Helix pomatia303 | R | 3.8 | 10 |
| Helix pomatia303 | T | 1.3 | 300 |
| Lymnaea stagnalis203 | C | 25 to 31 | 44 to 188 |
R-state (R), T-state (T), or cooperative (C)
Acknowledgments
EIS would like to thank his past students and collaborators as indicated in the references cited for their outstanding contributions to this field and Dr. Ryan Cowley for thoughtful comments. The funding for this research by NIH grant DK31450 is gratefully acknowledged.
Abbreviations
- L-DOPA
3,4-dihydroxy-L-phenylalanine
- DOPAquinone
3-(3,4-dioxocyclohexa-1,5-dien-1-yl)-L-alanine
- DHI
5,6-dihydroxyindole
- DHICA
5,6-dihydroxyindole-2-carboxylic acid
- Abs
Absorption
- AO
Amine oxidase
- AF
Antiferromagnetic
- AGAO
Arthrobacter globiformis Amine Oxidase
- AOx
ascorbate oxidase
- BOD
Bilirubin Oxidase
- CaOx
catechol oxidase
- Cp
Ceruloplasmin
- CT
Charge Transfer
- CD
Circular Dichroism
- CI
Configuration Interaction
- CuNiR
Copper Nitrite Reductase
- CB-PPOs
Coupled Binuclear Polyphenol Oxidases
- CcO
Cytochrome c oxidase
- DFT
Density Functional Theory
- DβM
Dopamine β-monooxygenase
- DPQ
Dopaquinone
- ECP
Effective Core Potentials
- Zeff
Effective nuclear charge
- EPR
Electron Paramagnetic Resonance
- ESEEM
Electron Spin Echo Envelope Modulation
- ET
Electron Transfer
- ENDOR
Electron-Nuclear Double Resonance
- HAB
Electronic Coupling Matrix Element
- EAS
Electrophilic Aromatic Substitution
- EXAFS
Extended X-ray absorption fine structure
- FMOs
Frontier molecular orbitals
- FCI
Full Configuration Interaction
- GO
Galactose Oxidase
- GTO
Gaussian-Type orbital
- GGA
Generalized Gradient Approximation
- GLOX
Glyoxal oxidase
- ZFS
Zero Field Splitting
- HPAO
Hansenula polymorpha Amine Oxidase
- HF
Hartree-Fock
- HCOs
Heme-copper oxidases
- Hp
Hephaestin
- HOMO
Highest Occupied Molecular Orbital
- KIE
Kinetic Isotope Effect
- KS
Kohn-Sham
- LF
Ligand Field
- LFT
Ligand Field Theory
- LLCT
Ligand to Ligand Charge Transfer
- LMCT
Ligand to Metal Charge Transfer
- LDA
Local Density Approximation
- LT
Low Temperature
- LUMO
Lowest Occupied Molecular Orbital
- LTQ
Lysine Tyrosylquinone
- MCD
Magnetic Circular Dichroism
- MGGA
Meta-Generalized Gradient Approximation
- MMO
Methane monooxygenase
- MYA
million years ago
- MV
Mixed Valent
- MO
Molecular Orbitals
- MCO
Multicopper Oxidase
- IYT
N-acetyl-diiodotyrosyl-D-threonine
- dbed
N,N-di-tert-butylethylenediamine
- Ac-DiI-YG, IYG
N-R-acetyl-3,5-diiodotyrosylglycine
- NI
Native Intermediate
- NOR
Nitric oxide reductase
- N2OR
Nitrous oxide reductase
- PAL
peptidyl-α-hydroxylglycine-α-amidating lyase
- PAM
peptidylglycine α-amidating monooxygenase
- PHM
peptidylglycine α-hydroxylating monooxygenase
- PHMcc
peptidylglycine α-hydroxylating monooxygenase catalytic core
- PI
Peroxy Intermediate
- PHS
Phenoxazinone synthase
- PMOs
polysaccharide monooxygenases
- PES
Potential Energy Surface
- PLS
Proton loading site
- QM-MM
Quantum Mechanics-Molecular Mechanics
- 2,4-QD
Quercetin 2,4-dioxygenase
- QO
Quinol oxidase
- rR
Resonance Raman
- RvL
Rhus vernificera laccase
- RT
Room Temperature
- SKIE
Solvent kinetic isotope effect
- SOC
Spin-orbit Coupling
- SQUID
Superconducting Quantum Interference Device
- TD-DFT
Time-dependent Density Fcuntional Theory
- TPQ
Topaquinone
- TNC
Trinuclear Copper Cluster
- T1
Type 1
- T1D
Type 1 depleted
- T1Hg
Type 1 mercury
- T2
Type 2
- T2D
Type 2 Depleted
- T3
Type 3
- TβM
Tyramine β-Monooxygenase
- Ty
Tyrosinase
- VBCI
Valence bond configuration interaction
- VTVH
Variable temperature, variable field
- XAS
X-Ray Absorption Spectroscopy
- XMCD
X-ray magnetic circular dichroism
- XPS
X-ray photoelectron spectroscopy
- XANES
X-ray Absorption Near Edge Structure
- Xα-SW
Xα Scattered Wave
Biographies

EIS
Edward I. Solomon grew up in North Miami Beach, Florida, received his Ph.D. at Princeton (with D.S. McClure) and was a postdoctoral fellow at The Ørsted Institute (with C.J. Ballhausen) and then at Caltech (with H.B. Gray). He was a Professor at the Massachusetts Institute of Technology until 1982 when joined the faculty at Stanford University, where he is now the Monroe E. Spaght Professor of Humanities and Sciences and Professor of Photon Science at SLAC National Accelerator Lab. He has been an Invited Professor in Argentina, Australia, China, France, India and Japan. Professor Solomon’s research is in the fields of Physical-Inorganic and Bioinorganic Chemistry with emphasis on the application of a wide range of spectroscopic methods combined with QM calculations to elucidate the electronic structure of transition metal sites and its contribution to physical properties and reactivity. He has received a wide range of medals and awards and is a member of the National Academy of Sciences, the American Academy of Arts and Sciences and a Fellow in American Association for the Advancement of Science and the American Chemical Society.

DEH
David E. Heppner was born and raised in Chicago, Illinois. He earned a B.S. in Chemistry summa cum laude from the University of Minnesota pursuing computational and synthetic studies of copper-containing bioinorganic systems in the labs of Christopher J. Cramer and William B. Tolman. He is currently a doctoral candidate at Stanford University where he is advised by Edward I. Solomon, working on mechanistic studies of the multicopper oxidases.

EP
Esther M. Johnston received her B.Sc. from the University of Toronto. She did summer research at the Université de Montréal with Professor Christian Reber. She is currently working towards her Ph.D. in inorganic chemistry at Stanford University under the direction of Edward Solomon. Her research interests focus on using spectroscopy to understand substrate activation by oxidized copper sites in biology and characterizing the electronic structure and reactivity of the tetranuclear copper sulfide cluster in nitrous oxide reductase.

JWG
Jake W. Ginsbach grew up outside of Casper, WY. He attended Whitman College where he performed undergraduate research with Frank M. Dunnivant on the desorption kinetics of chlorinated pesticides from sediments. After graduating from Whitman in 2009, he began working on his Ph.D. at Stanford University with Edward I. Solomon. His research focuses on the reactivity and structure/function correlations of the coupled binuclear copper proteins family and related copper, dioxygen model compounds.

JC
Jordi Cirera (Barcelona, Spain, 1979) graduated in chemistry from the University of Barcelona (2002) and received his doctorate (with honors) from the same university in 2006 under the supervision of prof. Santiago Alvarez and prof. Eliseo Ruiz. After obtaining his degree, he made a postdoctoral stage at Stanford University in prof. Edward I. Solomon’s group working in copper mediated biogenesis in metalloenzymes. He has been visiting researcher at the Max-Planck Institute for solid state research, working with Prof. Jens Kortus in the field of Single Molecule Magnets. He is currently a postdoctoral fellow at University of California, San Diego, working in Prof. Francesco Paesani’s group in the computational modeling of electronic structure properties in Metal-Organic Frameworks. His research interests focus on the electronic structure of transition metal complexes and the implications that this has on the stereochemistry, spectroscopic parameters and reactivity of these molecules, using electronic structure methods combined with spectroscopic data

MQ
Munzarin F. Qayyum grew up in Dhaka, Bangladesh, received her B.A. in Chemistry and Economics from Wellesley College in Massachusetts in 2006. Her undergraduate research was done under the supervision of Nolan T. Flynn and focused on investigating the drug delivery properties of Poly(N-Isopropylacrylamide) hydrogels loaded with gold nanoparticles. She is currently working towards her Ph.D. in Chemistry at Stanford University under the direction of Edward I. Solomon and Keith O. Hodgson. Her research focuses on the use of different X-ray absorption techniques to investigate the geometric and electronic structure of copper-containing metalloproteins and correlating them to reactivity.

MTKE
Matthew T. Kieber-Emmons was born in 1980 in Buffalo, NY. He received a B.S. in 2002 from Saint Joseph’s University in Philadelphia, PA. He pursued graduate studies with C.G. Riordan at the University of Delaware receiving a Ph.D. in 2007 studying oxygen and sulfur activation by monovalent nickel, and was an NIH postdoctoral fellow at Stanford University with E.I. Solomon studying heme-copper oxidases and type III copper sites. He has accepted a faculty position in the Department of Chemistry at the University of Utah and will continue studies on problems in bioinorganic and bioinspired catalysis.

CK
Christian H. Kjaergaard was born in Copenhagen, Denmark. He earned a B.Sc. in Agricultural Science and a M.Sc. in Biology/ Biotechnology from the University of Copenhagen. He is currently doing his Ph.D. in Chemistry in Prof. Edward I. Solomon’s research group at Stanford University. His research focuses on the Multicopper Oxidases and how their unique active sites allow for the efficient reduction of dioxygen.

RGH
Ryan G. Hadt was born in Eau Claire, Wisconsin. He received his B.S. and M.S. in inorganic chemistry from the University of Minnesota Duluth (with Prof. Victor N. Nemykin). During this time he also worked on a summer research project at Tohoku University in Sendai, Japan (with Prof. Yoshiyuki Kawazoe). He is currently working toward his Ph.D. in inorganic chemistry at Stanford University (with Prof. Edward I. Solomon) as an ARCS scholar and Gerhard Casper Stanford Graduate Fellow. His current research uses a broad range of spectroscopic methods coupled to electronic structure calculations to elucidate structure-function relationships in transition metal ion mediated catalysis and biological electron transfer.

LT
Li Tian obtained her PhD degree with Prof. Richard Friesner on QM/MM study of P450 catalysis mechanism and developing empirical correction parameters in DFT calculation. She did her first postdoc with Prof. Edward Solomon on spectroscopy study and quantum chemistry simulation of Cu proteins and model complexes that mimic the protein active site. Her research was focused on the catalysis mechanism of the non-coupled binuclear copper enzymes. She is currently working for Dr. Eric Martin at Novartis on protein family based virtual screening methods.
References
- 1.Randall DW, Gamelin DR, LaCroix LB, Solomon EI. JBIC. 2000;5:16. doi: 10.1007/s007750050003. [DOI] [PubMed] [Google Scholar]
- 2.Solomon EI, Szilagyi RK, DeBeer George S, Basumallick L. Chem. Rev. 2004;104:419. doi: 10.1021/cr0206317. [DOI] [PubMed] [Google Scholar]
- 3.Lu Y. In: Biocoordination Chemistry, Comp. Chem. II: From Biology to Nanotech. McCleverty JA, Meyer TJ, Que L, Tolman WB, editors. Vol. 8. Oxford: Elsevier; 2004. pp. 91–122. [Google Scholar]
- 4.Solomon EI, Hadt RG. Coordination Chemistry Reviews. 2011;255:774. [Google Scholar]
- 5.Sawyer DT. Oxygen Chemistry. Oxford: Oxford University Press; 1991. [Google Scholar]
- 6.Koppenol WH, Stanbury DM, Bounds PL. Free Radical Biol. Med. 2010;49:317. doi: 10.1016/j.freeradbiomed.2010.04.011. [DOI] [PubMed] [Google Scholar]
- 7.Solomon EI, Basumallick L, Chen P, Kennepohl P. Coordination Chemistry Reviews. 2005;249:229. [Google Scholar]
- 8.Kau LS, Spira-Solomon DJ, Penner-Hahn JE, Hodgson KO, Solomon EI. J. Am. Chem. Soc. 1987;109:6433. [Google Scholar]
- 9.Glatzel P, Bergmann U. Coordination Chemistry Reviews. 2005;249:65. [Google Scholar]
- 10.Penner-Hahn JE, Ward JD. Personal communication.
- 11.Bergmann U, Horne CR, Collins TJ, Workman JM, Cramer SP. Chem. Phys. Lett. 1999;302:119. [Google Scholar]
- 12.Solomon EI, Lowery MD, Lacroix LB, Root DE. Metallobiochemistry,Part C. 1993;226:1. doi: 10.1016/0076-6879(93)26003-r. [DOI] [PubMed] [Google Scholar]
- 13.Solomon EI. In: Comments Inorg. Chem. Number 5. Sutin N, editor. Vol. III. New York: Gordon and Breach; 1984. [Google Scholar]
- 14.Wilcox DE, Porras AG, Hwang YT, Lerch K, Winkler ME, Solomon EI. J. Am. Chem. Soc. 1985;107:4015. [Google Scholar]
- 15.Ballhausen CJ. Introduction to ligand field theory. New York: McGraw-Hill; 1962. [Google Scholar]
- 16.Gerloch M, Miller JR. In: Prog. Inorg. Chem. Cotton FA, editor. Vol. 10. John Wiley& Sons, Inc.; 1968. [Google Scholar]
- 17.McGarvey BR. In: Transition-Metal Chemistry. Carlin RL, editor. Vol. 3. New York: MarcelDekker; 1967. [Google Scholar]
- 18.Abragam A, Pryce MHL. Proceedings of the Royal Society of London Series a-Mathematical and Physical Sciences. 1951;205:135. [Google Scholar]
- 19.Abragam A, Pryce MHL. Proceedings of the Royal Society of London Series a-Mathematical and Physical Sciences. 1951;206:164. [Google Scholar]
- 20.Goodman BA. Advances in Inorganic Chemistry Radiochemistry. 1970;13:135. [Google Scholar]
- 21.Feher G, Isaacson RA, Scholes CP, Nagel R. Ann. N.Y. Acad. Sci. 1973;222:86. doi: 10.1111/j.1749-6632.1973.tb15254.x. [DOI] [PubMed] [Google Scholar]
- 22.Hoffman BM, DeRose VJ, Doan PE, Gurbiel RJ, Houseman ALP, Telser J. In: Biological magnetic resonance. Berliner LJ, Reuben J, editors. Vol. 13. New York: Plenum Press; 1993. [Google Scholar]
- 23.Schweiger A. Struct. Bond. 1982;51:1. [Google Scholar]
- 24.Pilbrow JR. Transition ion electron paramagnetic resonance. Oxford: Clarendon Press; 1990. [Google Scholar]
- 25.Mims WB, Peisach J. In: Biological Magnetic Resonance. Berliner LJ, Reuben J, editors. Vol. 3. New York: Plenum Press; 1981. [Google Scholar]
- 26.Mims WB, Peisach J. In: Advanced EPR Applications in Biology and Biochemistry. Hoff AJ, editor. New York: Elsevier; 1989. [Google Scholar]
- 27.Mims WB, Peisach J. Biochemistry. 1976;15:3863. doi: 10.1021/bi00662a033. [DOI] [PubMed] [Google Scholar]
- 28.Britt RD. Current Opinion in Structural Biology. 1993;3:774. [Google Scholar]
- 29.Thomann H, Mims WB. In: Pulsed magnetic resonance--NMR, ESR, and optics : a recognition of E.L. Hahn. Hahn EL, Bloom M, Bagguley DMS, editors. Oxford England New York: Clarendon Press ;Oxford University Press; 1992. [Google Scholar]
- 30.Gillard RD. In: Physical Methods in Advanced Inorganic Chemistry. Hill HAO, Day P, editors. New York: Interscience; 1968. [Google Scholar]
- 31.Stephens PJ. In: Advances in chemical physics vol.35. Prigogine I, Rice S, editors. Wiley; 1976. [Google Scholar]
- 32.Schatz PN, Mowery RL, Krausz ER. Mol. Phys. 1978;35:1537. [Google Scholar]
- 33.Thomson AJ, Johnson MK. Biochem. J. 1980;191:411. doi: 10.1042/bj1910411. [DOI] [PMC free article] [PubMed] [Google Scholar]
- 34.Thomson AJ, Cheesman MR, George SJ. Metallobiochemistry, Part C. 1993;226:199. doi: 10.1016/0076-6879(93)26011-w. [DOI] [PubMed] [Google Scholar]
- 35.Neese F, Solomon EI. Inorganic chemistry. 1999;38:1847. doi: 10.1021/ic981264d. [DOI] [PubMed] [Google Scholar]
- 36.Gewirth AA, Solomon EI. J. Am. Chem. Soc. 1988;110:3811. [Google Scholar]
- 37.Gerstman BS, Brill AS. J. Chem. Phys. 1985;82:1212. [Google Scholar]
- 38.Solomon EI, Hanson MA. In: Inorganic electronic structure and spectroscopy. Solomon EI, Lever ABP, editors. Vol. 2. New York: Wiley; 1999. [Google Scholar]
- 39.Woertink JS, Smeets PJ, Groothaert MH, Vance MA, Sels BF, Schoonheydt RA, Solomon EI. Proc Natl Acad Sci USA. 2009;106:18908. doi: 10.1073/pnas.0910461106. [DOI] [PMC free article] [PubMed] [Google Scholar]
- 40.Tang J, Albrecht AC. Raman Spectroscopy. Vol. 2. New York: Plenum; 1970. [Google Scholar]
- 41.DuBois JL, Mukherjee P, Stack TDP, Hedman B, Solomon EI, Hodgson KO. J. Am. Chem. Soc. 2000;122:5775. [Google Scholar]
- 42.Pidcock E, DeBeer S, Obias HV, Hedman B, Hodgson KO, Karlin KD, Solomon EI. J. Am. Chem. Soc. 1999;121:1870. [Google Scholar]
- 43.Shadle SE, Penner-Hahn JE, Schugar HJ, Hedman B, Hodgson KO, Solomon EI. J. Am. Chem. Soc. 1993;115:767. [Google Scholar]
- 44.George SD, Brant P, Solomon EI. J. Am. Chem. Soc. 2005;127:667. doi: 10.1021/ja044827v. [DOI] [PubMed] [Google Scholar]
- 45.George SJ, Lowery MD, Solomon EI, Cramer SP. J. Am. Chem. Soc. 1993;115:2968. [Google Scholar]
- 46.Wang HX, Bryant C, Randall DW, LaCroix LB, Solomon EI, LeGros M, Cramer SP. J. Phys. Chem. B. 1998;102:8347. [Google Scholar]
- 47.Funk T, Friedrich S, Young AT, Arenholz E, Delano R, Cramer SP. Rev. Sci. Instrum. 2004;75:756. [Google Scholar]
- 48.Smith TD, Pilbrow JR. Coordination Chemistry Reviews. 1974;13:173. [Google Scholar]
- 49.Van Vleck JH. The theory of electric and magnetic susceptibilities. London: Oxford University Press; 1965. [Google Scholar]
- 50.Moriya T. Phys. Rev. 1960;120:91. [Google Scholar]
- 51.Moriya T. In: Magnetism. Rado GT, Suhl H, editors. Vol. 1. New York: Academic Press; 1963. [Google Scholar]
- 52.Kanamori J. In: Magnetism. Rado GT, Suhl H, editors. Vol. 1. New York: Academic Press; 1963. [Google Scholar]
- 53.Ross PK, Allendorf MD, Solomon EI. J. Am. Chem. Soc. 1989;111:4009. [Google Scholar]
- 54.Tuczek F, Solomon EI. J. Am. Chem. Soc. 1994;116:6916. [Google Scholar]
- 55.Tuczek F, Solomon EI. Coordination Chemistry Reviews. 2001;219:1075. [Google Scholar]
- 56.Chen P, Cabrito I, Moura JJG, Moura I, Solomon EI. Journal of the American Chemical Society. 2002;124:10497. doi: 10.1021/ja0205028. [DOI] [PubMed] [Google Scholar]
- 57.Westmoreland TD, Wilcox DE, Baldwin MJ, Mims WB, Solomon EI. J. Am. Chem. Soc. 1989;111:6106. [Google Scholar]
- 58.Antholine WE, Kastrau DHW, Steffens GCM, Buse G, Zumft WG, Kroneck PMH. Eur. J. Biochem. 1992;209:875. doi: 10.1111/j.1432-1033.1992.tb17360.x. [DOI] [PubMed] [Google Scholar]
- 59.Neese F, Zumft WG, Antholine WE, Kroneck PMH. J. Am. Chem. Soc. 1996;118:8692. [Google Scholar]
- 60.Robin MB, Day P. Advances in Inorganic Chemistry and Radiochemistry. 1967;10:247. [Google Scholar]
- 61.Piepho SB, Krausz ER, Schatz PN. J. Am. Chem. Soc. 1978;100:2996. [Google Scholar]
- 62.Gamelin DR, Randall DW, Hay MT, Houser RP, Mulder TC, Canters GW, de Vries S, Tolman WB, Lu Y, Solomon EI. J. Am. Chem. Soc. 1998;120:5246. [Google Scholar]
- 63.Brunold TC, Gamelin DR, Solomon EI. J. Am. Chem. Soc. 2000;122:8511. [Google Scholar]
- 64.Marcus RA, Sutin N. Biochimica Et Biophysica Acta. 1985;811:265. [Google Scholar]
- 65.Chen P, Solomon EI. Proceedings of the National Academy of Sciences of the United States of America. 2004;101:13105. doi: 10.1073/pnas.0402114101. [DOI] [PMC free article] [PubMed] [Google Scholar]
- 66.Yoon J, Solomon EI. Coordination Chemistry Reviews. 2007;251:379. [Google Scholar]
- 67.Szabo A, Ostlund NS. Modern Quantum Chemistry. Mineola,New York: Dover Publications; 1996. [Google Scholar]
- 68.Ema I, Garcia De La Vega JM, Ramirez G, Lopez R, Fernandez Rico J, Meissner H, Paldus J. J. Comput. Chem. 2003;24:859. doi: 10.1002/jcc.10227. [DOI] [PubMed] [Google Scholar]
- 69.Ditchfie R, Hehre WJ, Pople JA. J. Chem. Phys. 1971;54:724. [Google Scholar]
- 70.Hehre WJ, Ditchfie R, Pople JA. J. Chem. Phys. 1972;56:2257. [Google Scholar]
- 71.Woon DE, Dunning TH. J. Chem. Phys. 1995;103:4572. [Google Scholar]
- 72.Schafer A, Huber C, Ahlrichs R. J. Chem. Phys. 1994;100:5829. [Google Scholar]
- 73.Møller C, Plesset MS. Phys. Rev. 1934;46:0618. [Google Scholar]
- 74.Pople JA, Binkley JS, Seeger R. Int. J. Quantum Chem. 1976:1. [Google Scholar]
- 75.Pople JA, Seeger R, Krishnan R. Int. J. Quantum Chem. 1977:149. [Google Scholar]
- 76.Krishnan R, Pople JA. Int. J. Quantum Chem. 1978;14:91. [Google Scholar]
- 77.Raghavachari K, Pople JA, Replogle ES, Headgordon M. J. Phys. Chem. 1990;94:5579. [Google Scholar]
- 78.Roos BO, Taylor PR, Siegbahn PEM. Chem. Phys. 1980;48:157. [Google Scholar]
- 79.Gagliardi L, Roos BO. Chem. Soc. Rev. 2007;36:893. doi: 10.1039/b601115m. [DOI] [PubMed] [Google Scholar]
- 80.Andersson K, Malmqvist PA, Roos BO, Sadlej AJ, Wolinkski K. J. Phys. Chem. 1990;94:5483. [Google Scholar]
- 81.Malmqvist PA, Rendell A, Roos BO. J. Phys. Chem. 1990;94:5477. [Google Scholar]
- 82.Malmqvist PA, Pierloot K, Shahi ARM, Cramer CJ, Gagliardi L. J. Chem. Phys. 2008:128. doi: 10.1063/1.2920188. [DOI] [PubMed] [Google Scholar]
- 83.Cizek J. J. Chem. Phys. 1966;45:4256. [Google Scholar]
- 84.Raghavachari K, Trucks GW, Pople JA, Headgordon M. Chem. Phys. Lett. 1989;157:479. [Google Scholar]
- 85.Hohenberg P, Kohn W. Phys. Rev. B. 1964;136:B864. [Google Scholar]
- 86.Kohn W, Sham LJ. Phys. Rev. 1965;140:A1133. [Google Scholar]
- 87.Koch W, Holthausen MC. A Chemist's Guide to Density Functional Theory. Weinheim: Wiley-VCH; 2000. [DOI] [PubMed] [Google Scholar]
- 88.Vosko SH, Wilk L, Nusair M. Can. J. Phys. 1980;58:1200. [Google Scholar]
- 89.Becke AD. Phys Rev A. 1988;38:3098. doi: 10.1103/physreva.38.3098. [DOI] [PubMed] [Google Scholar]
- 90.Perdew JP. Phys. Rev. B. 1986;33:8822. doi: 10.1103/physrevb.33.8822. [DOI] [PubMed] [Google Scholar]
- 91.Perdew JP, Burke K, Ernzerhof M. Phys. Rev. Lett. 1996;77:3865. doi: 10.1103/PhysRevLett.77.3865. [DOI] [PubMed] [Google Scholar]
- 92.Lee CT, Yang WT, Parr RG. Phys. Rev. B. 1988;37:785. doi: 10.1103/physrevb.37.785. [DOI] [PubMed] [Google Scholar]
- 93.Tao JM, Perdew JP, Staroverov VN, Scuseria GE. Phys. Rev. Lett. 2003:91. doi: 10.1103/PhysRevLett.91.146401. [DOI] [PubMed] [Google Scholar]
- 94.Becke AD. J. Chem. Phys. 1993;98:5648. [Google Scholar]
- 95.Stephens PJ, Devlin FJ, Chabalowski CF, Frisch MJ. J. Phys. Chem. 1994;98:11623. [Google Scholar]
- 96.Schwabe T, Grimme S. PCCP. 2006;8:4398. doi: 10.1039/b608478h. [DOI] [PubMed] [Google Scholar]
- 97.Zhao Y, Lynch BJ, Truhlar DG. J. Phys. Chem. A. 2004;108:4786. [Google Scholar]
- 98.Ye SF, Neese F. Inorganic Chemistry. 2010;49:772. doi: 10.1021/ic902365a. [DOI] [PubMed] [Google Scholar]
- 99.Wu Q, Van Voorhis T. Phys. Rev. A. 2005:72. [Google Scholar]
- 100.Wu Q, Van Voorhis T. J. Chem. Theory Comput. 2006;2:765. doi: 10.1021/ct0503163. [DOI] [PubMed] [Google Scholar]
- 101.Grimme S. J. Comput. Chem. 2006;27:1787. doi: 10.1002/jcc.20495. [DOI] [PubMed] [Google Scholar]
- 102.Grimme S. Wiley Interdiscip. Rev.-Comput. Mol. Sci. 2011;1:211. doi: 10.1002/wcms.44. [DOI] [PMC free article] [PubMed] [Google Scholar]
- 103.Warshel A, Levitt M. J. Mol. Biol. 1976;103:227. doi: 10.1016/0022-2836(76)90311-9. [DOI] [PubMed] [Google Scholar]
- 104.Vreven T, Morokuma K, Farkas O, Schlegel HB, Frisch MJ. J. Comput. Chem. 2003;24:760. doi: 10.1002/jcc.10156. [DOI] [PubMed] [Google Scholar]
- 105.Maseras F, Morokuma K. J. Comput. Chem. 1995;16:1170. [Google Scholar]
- 106.Hillier IH. Theochem-J. Mol. Struct. 1999;463:45. [Google Scholar]
- 107.Lundberg M, Kawatsu T, Vreven T, Frisch MJ, Morokuma K. J. Chem. Theory Comput. 2009;5:222. doi: 10.1021/ct800457g. [DOI] [PubMed] [Google Scholar]
- 108.Solomon EI. Copper Coordination Chemistry: Biochemical & Inorganic Perspectives. Guilderland: New York: Adenine Press; 1982. [Google Scholar]
- 109.Solomon EI, Gerwirth AA, Cohen SL. In: Excited States and Reactive Intermediates Photochemistry, Photophysics, and Electrochemistry, ACS Symposium Series. Lever ABP, editor. Vol. 307. Washington, D.C.: American Chemical Society; 986. [Google Scholar]
- 110.Solomon EI, Gerwirth AA, Cohen SL. In: Understanding Molecular Properties. Avery J, Dahl JP, Hansen AE, editors. Dordrecht: Reidel Publ. Co; 1987. [Google Scholar]
- 111.Slater JC. The Self-Consistent Field for Molecular and Solids, Quantum Theory of Molecular and Solids. New York: McGraw-Hill; 1974. [Google Scholar]
- 112.Penfield KW, Gewirth AA, Solomon EI. J. Am. Chem. Soc. 1985;107:4519. [Google Scholar]
- 113.Szilagyi RK, Metz M, Solomon EI. J. Phys. Chem. A. 2002;106:2994. [Google Scholar]
- 114.Gewirth AA, Cohen SL, Schugar HJ, Solomon EI. Inorganic Chemistry. 1987;26:1133. [Google Scholar]
- 115.Didziulis SV, Cohen SL, Butcher KD, Solomon EI. Inorganic Chemistry. 1988;27:2238. [Google Scholar]
- 116.Colman PM, Freeman HC, Guss JM, Murata M, Norris VA, Ramshaw JAM, Venkatappa MP. Nature. 1978;272:319. [Google Scholar]
- 117.Solomon EI. Inorganic chemistry. 2006;45:8012. doi: 10.1021/ic060450d. [DOI] [PubMed] [Google Scholar]
- 118.Penfield KW, Gay RR, Himmelwright RS, Eickman NC, Norris VA, Freeman HC, Solomon EI. J. Am. Chem. Soc. 1981;103:4382. [Google Scholar]
- 119.Solomon EI, Hedman B, Hodgson KO, Dey A, Szilagyi RK. Coordination Chemistry Reviews. 2005;249:97. [Google Scholar]
- 120.Hadt RG, Sun N, Marshall NM, Hodgson KO, Hedman B, Lu Y, Solomon EI. J. Am. Chem. Soc. 2012;134:16701. doi: 10.1021/ja306438n. [DOI] [PMC free article] [PubMed] [Google Scholar]
- 121.Chen P, Root DE, Campochiaro C, Fujisawa K, Solomon EI. J. Am. Chem. Soc. 2003;125:466. doi: 10.1021/ja020969i. [DOI] [PubMed] [Google Scholar]
- 122.Aboelella NW, Kryatov SV, Gherman BF, Brennessel WW, Young VG, Sarangi R, Rybak-Akimova EV, Hodgson KO, Hedman B, Solomon EI, Cramer CJ, Tolman WB. J. Am. Chem. Soc. 2004;126:16896. doi: 10.1021/ja045678j. [DOI] [PubMed] [Google Scholar]
- 123.Woertink JS, Tian L, Maiti D, Lucas HR, Himes RA, Karlin KD, Neese F, Würtele C, Holthausen MC, Bill E, Sundermeyer J, Schindler S, Solomon EI. Inorganic Chemistry. 2010;49:9450. doi: 10.1021/ic101138u. [DOI] [PMC free article] [PubMed] [Google Scholar]
- 124.Würtele C, Gaoutchenova E, Harms K, Holthausen MC, Sundermeyer J, Schindler S. Angew. Chem. Int. Ed. 2006;45:3867. doi: 10.1002/anie.200600351. [DOI] [PubMed] [Google Scholar]
- 125.Prigge ST, Eipper BA, Mains RE, Amzel LM. Science. 2004;304:864. doi: 10.1126/science.1094583. [DOI] [PubMed] [Google Scholar]
- 126.Sarangi R, Aboelella N, Fujisawa K, Tolman WB, Hedman B, Hodgson KO, Solomon EI. J. Am. Chem. Soc. 2006;128:8286. doi: 10.1021/ja0615223. [DOI] [PMC free article] [PubMed] [Google Scholar]
- 127.Halfen JA, Mahapatra S, Wilkinson EC, Kaderli S, Young VG, Que L, Jr, Zuberbühler AD, Tolman WB. Science. 1996;271:1397. doi: 10.1126/science.271.5254.1397. [DOI] [PubMed] [Google Scholar]
- 128.Baldwin MJ, Root DE, Pate JE, Fujisawa K, Kitajima N, Solomon EI. J. Am. Chem. Soc. 1992;114:10421. [Google Scholar]
- 129.Henson MJ, Mukherjee P, Root DE, Stack TDP, Solomon EI. J. Am. Chem. Soc. 1999;121:10332. [Google Scholar]
- 130.Qayyum MF, Sarangi R, Fujisawa K, Stack TDP, Karlin KD, Hodgson KO, Hedman B, Solomon EI. J. Am. Chem. Soc. 2013 doi: 10.1021/ja4078717. 10.1021/ja4078717. [DOI] [PMC free article] [PubMed] [Google Scholar]
- 131.Lewin JL, Heppner DE, Cramer CJ. Journal of biological inorganic chemistry. 2007;12:1221. doi: 10.1007/s00775-007-0290-2. [DOI] [PubMed] [Google Scholar]
- 132.Neese F, Liakos DG, Ye SF. Journal of Biological Inorganic Chemistry. 2011;16:821. doi: 10.1007/s00775-011-0787-6. [DOI] [PubMed] [Google Scholar]
- 133.Nakamura T, Mason HS. Biochem. Biophys. Res. Commun. 1960;3:297. doi: 10.1016/0006-291x(60)90244-8. [DOI] [PubMed] [Google Scholar]
- 134.Gatsogiannis C, Markl J. J. Mol. Biol. 2009;385:963. doi: 10.1016/j.jmb.2008.10.080. [DOI] [PubMed] [Google Scholar]
- 135.Gatsogiannis C, Moeller A, Depoix F, Meissner U, Markl J. J. Mol. Biol. 2007;374:465. doi: 10.1016/j.jmb.2007.09.036. [DOI] [PubMed] [Google Scholar]
- 136.Meissner U, Gatsogiannis C, Moeller A, Depoix F, Harris J, Markl J. Micron. 2007;38:754. doi: 10.1016/j.micron.2006.11.005. [DOI] [PubMed] [Google Scholar]
- 137.Gielens C, Idakieva K, Van den Bergh V, Siddiqui NI, Parvanova K, Compernolle F. Biochem. Biophys. Res. Commun. 2005;331:562. doi: 10.1016/j.bbrc.2005.03.217. [DOI] [PubMed] [Google Scholar]
- 138.Kurokawa T, Wuhrer M, Lochnit G, Geyer H, Markl J, Geyer R. Eur. J. Biochem. 2002;269:5459. doi: 10.1046/j.1432-1033.2002.03244.x. [DOI] [PubMed] [Google Scholar]
- 139.Lommerse JP, Thomas-Oates JE, Gielens C, Préaux G, Kamerling JP, Vliegenthart JF. Eur. J. Biochem. 1997;249:195. doi: 10.1111/j.1432-1033.1997.00195.x. [DOI] [PubMed] [Google Scholar]
- 140.Van Kuik JA, Sijbesma RP, Kamerling JP, Vliegenthart JF, Wood EJ. European journal of biochemistry / FEBS. 1987;169:399. doi: 10.1111/j.1432-1033.1987.tb13626.x. [DOI] [PubMed] [Google Scholar]
- 141.Velkova L, Dolashka P, Lieb B, Dolashki A, Voelter W, Beeumen J, Devreese B. Glycoconjugate J. 2011;28:385. doi: 10.1007/s10719-011-9337-2. [DOI] [PubMed] [Google Scholar]
- 142.Harris JR, Markl J. Micron. 1999;30:597. doi: 10.1016/s0968-4328(99)00036-0. [DOI] [PubMed] [Google Scholar]
- 143.Volbeda A, Hol WG. J. Mol. Biol. 1989;209:249. doi: 10.1016/0022-2836(89)90276-3. [DOI] [PubMed] [Google Scholar]
- 144.Dolashka-Angelova P, Beltramini M, Dolashki A, Salvato B, Hristova R, Voelter W. Arch. Biochem. Biophys. 2001;389:153. doi: 10.1006/abbi.2000.2015. [DOI] [PubMed] [Google Scholar]
- 145.Van Kuik JA, Breg J, Kolsteeg CEM, Kamerling JP, Vliegenthart JFG. FEBS LETTERS. 1987;221:150. [Google Scholar]
- 146.Tseneklidou-Stoeter D, Gerwig GJ, Kamerling JP, Spindler KD. Biol. Chem. Hoppe-Seyler. 1995;376:531. doi: 10.1515/bchm3.1995.376.9.531. [DOI] [PubMed] [Google Scholar]
- 147.Telfer WH, Kunkel JG. Annual review of entomology. 1991 doi: 10.1146/annurev.en.36.010191.001225. [DOI] [PubMed] [Google Scholar]
- 148.Burmester T. European Journal of Entomology. 1999;96:213. [Google Scholar]
- 149.Kusche K, Ruhberg H, Burmester T. Proceedings Of The National Academy Of Sciences Of The United States Of America. 2002;99:10545. doi: 10.1073/pnas.152241199. [DOI] [PMC free article] [PubMed] [Google Scholar]
- 150.Jaenicke E, Decker H, Gebauer WA, Markl J, Burmester T. Journal Of Biological Chemistry. 1999;274:29071. doi: 10.1074/jbc.274.41.29071. [DOI] [PubMed] [Google Scholar]
- 151.Hagner-Holler S, Schoen A, Erker W, Marden JH, Rupprecht R, Decker H, Burmester T. Proceedings Of The National Academy Of Sciences Of The United States Of America. 2004;101:871. doi: 10.1073/pnas.0305872101. [DOI] [PMC free article] [PubMed] [Google Scholar]
- 152.Burmester T. Molecular Biology And Evolution. 2001;18:184. doi: 10.1093/oxfordjournals.molbev.a003792. [DOI] [PubMed] [Google Scholar]
- 153.Burmester T, Scheller K. Journal Of Molecular Evolution. 1996;42:713. doi: 10.1007/BF02338804. [DOI] [PubMed] [Google Scholar]
- 154.Lieb B, Altenhein B, Markl J. Journal Of Biological Chemistry. 2000;275:5675. doi: 10.1074/jbc.275.8.5675. [DOI] [PubMed] [Google Scholar]
- 155.Lieb B, Altenhein B, Markl J, Vincent A, van Olden E, van Holde KE, Miller KI. Proceedings Of The National Academy Of Sciences Of The United States Of America. 2001;98:4546. doi: 10.1073/pnas.071049998. [DOI] [PMC free article] [PubMed] [Google Scholar]
- 156.Van Holde KE, Miller KI. Advances In Protein Chemistry, Vol 47. 1995;47:1. doi: 10.1016/s0065-3233(08)60545-8. [DOI] [PubMed] [Google Scholar]
- 157.Cuff ME, Miller KI, van Holde KE, Hendrickson WA. J. Mol. Biol. 1998;278:855. doi: 10.1006/jmbi.1998.1647. [DOI] [PubMed] [Google Scholar]
- 158.Hughes AL. Immunogenetics. 1999;49:106. doi: 10.1007/s002510050469. [DOI] [PubMed] [Google Scholar]
- 159.Stenkamp RE. Chem. Rev. 1994;94:715. [Google Scholar]
- 160.Sanders NK, Arp AJ, Childress JJ. Respiration Physiology. 1988;71:57. doi: 10.1016/0034-5687(88)90115-6. [DOI] [PubMed] [Google Scholar]
- 161.Sanders NK, Childress JJ. Biological Bulletin. 1990;178:286. doi: 10.2307/1541830. [DOI] [PubMed] [Google Scholar]
- 162.Seibel BA, Chausson F, Lallier FH, Zal F, Childress JJ. Experimental Biology Online. 1999;4:1. [Google Scholar]
- 163.Taylor AC, Morris S, Bridges CR. Journal of Comparative Physiology B. 1985;155:733. [Google Scholar]
- 164.Burggren WW. Journal of Experimental Zoology. 1981;218:53. [Google Scholar]
- 165.Mauro NA, Mangum CP. Journal of Experimental Zoology. 1982;219:179. [Google Scholar]
- 166.Mauro NA, Mangum CP. Journal of Experimental Zoology. 1982;219:189. [Google Scholar]
- 167.Johansen K, Lenfant C. Zeitschrift für vergleichende Physiologie. 1970;70:1. [Google Scholar]
- 168.Bridges CR. Comparative Biochemistry and Physiology Part A. 1986;83:261. [Google Scholar]
- 169.Taylor AC, Spencer Davies P. Journal of experimental biology. 1981;93:197. [Google Scholar]
- 170.Morris S, Greenaway P, McMahon BR. Physiological Zoology. 1996;69:839. [Google Scholar]
- 171.Greenaway P, Morris S, Sanders N, Adamczewska A. Marine and Freshwater Research. 1992;43:1573. [Google Scholar]
- 172.Burnett LE. Journal of Experimental Zoology. 1979;210:289. [Google Scholar]
- 173.Jokumsen A, Weber RE. Journal of Experimental Zoology. 1982;221:389. [Google Scholar]
- 174.Angersbach D, Decker H. Journal Of Comparative Physiology B. 1978;123:105. [Google Scholar]
- 175.Wilkes PRH, McMahon BR. Journal of experimental biology. 1982;98:139. [Google Scholar]
- 176.Rutledge PS. The American journal of physiology. 1981;240:R93. doi: 10.1152/ajpregu.1981.240.1.R93. [DOI] [PubMed] [Google Scholar]
- 177.Jokumsen A, Wells RMG, Ellerton HD, Weber RE. Comparative Biochemistry And Physiology A-Molecular & Integrative Physiology. 1981;70:91. [Google Scholar]
- 178.Brix O, Borgund S, Barnung T, Colosimo A, Giardina B. FEBS LETTERS. 1989;247:177. [Google Scholar]
- 179.Morris S, Oliver S. Comparative Biochemistry And Physiology A-Molecular & Integrative Physiology. 1999;122:309. [Google Scholar]
- 180.Zainal KAY, Taylor AC, Atkinson RJA. Comparative Biochemistry And Part A: Physiology. 1992;101:557. [Google Scholar]
- 181.Miller KI, Vanholde KE. Journal Of Comparative Physiology. 1981;143:253. [Google Scholar]
- 182.Taylor AC, Astall CM, Atkinson RJA. Journal Of Experimental Marine Biology And Ecology. 2000;244:265. [Google Scholar]
- 183.Taylor AC, Fungesmith SJ. Physiological Zoology. 1994;67:639. [Google Scholar]
- 184.Redmond JR. Physiological Zoology. 1962;35:304. [Google Scholar]
- 185.Johansen K, Brix O, Lykkeboe G. The Journal of experimental biology. 1982;99:331. [Google Scholar]
- 186.Zielinski S, Sartoris FJ, Portner HO. Biological Bulletin. 2001;200:67. doi: 10.2307/1543086. [DOI] [PubMed] [Google Scholar]
- 187.Johansen K, Redmond JR, Bourne GB. Journal of Experimental Zoology. 1978;205:27. [Google Scholar]
- 188.Miller KI. Biochemistry. 1985;24:4582. doi: 10.1021/bi00338a015. [DOI] [PubMed] [Google Scholar]
- 189.Johansen K, Lenfant C. The American journal of physiology. 1966;210:910. doi: 10.1152/ajplegacy.1966.210.4.910. [DOI] [PubMed] [Google Scholar]
- 190.Houlihan DF, Duthie G, Smith PJ, Wells MJ, Wells J. Journal of Comparative Physiology B-Biochemical Systemic and Environmental Physiology. 1986;156:683. [Google Scholar]
- 191.Brix O, Lykkeboe G, Johansen K. Journal of Comparative Physiology B. 1979;129:97. [Google Scholar]
- 192.Mangum CP, Lykkeboe G. Journal of Experimental Zoology. 1979;207:417. [Google Scholar]
- 193.Redmond JR. Helgoländer wissenschaftliche Meeresuntersuchungen. 1964;9:303. [Google Scholar]
- 194.Behrens JW, Elias JP, Taylor HH, Weber RE. The Journal of experimental biology. 2002;205:253. doi: 10.1242/jeb.205.2.253. [DOI] [PubMed] [Google Scholar]
- 195.Portner HO. The Journal of experimental biology. 1990;150:407. [Google Scholar]
- 196.Portner HO, Webber DM, Boutilier RG, Odor RK. The American journal of physiology. 1991;261:R239. doi: 10.1152/ajpregu.1991.261.1.R239. [DOI] [PubMed] [Google Scholar]
- 197.Loewe R. Journal Of Comparative Physiology. 1978;128:161. [Google Scholar]
- 198.Miller K, Vanholde KE. Biochemistry. 1974;13:1668. [Google Scholar]
- 199.Antonini E, Brunori M, Colosimo A, Kuiper HA, Zolla L. Biophys. Chem. 1983;18:117. doi: 10.1016/0301-4622(83)85005-4. [DOI] [PubMed] [Google Scholar]
- 200.van Driel R. Biochemistry. 1973;12:2696. doi: 10.1021/bi00738a023. [DOI] [PubMed] [Google Scholar]
- 201.Van Holde KE, Brenowitz M. Biochemistry. 1981;20:5232. doi: 10.1021/bi00521a021. [DOI] [PubMed] [Google Scholar]
- 202.Lamy J, Lamy J, Bonaventura J, Bonaventura C. Biochemistry. 1980;19:3033. doi: 10.1021/bi00554a031. [DOI] [PubMed] [Google Scholar]
- 203.Dawson A, Wood EJ. Biochem. J. 1982;207:145. doi: 10.1042/bj2070145. [DOI] [PMC free article] [PubMed] [Google Scholar]
- 204.Mangum CP, Johansen K. The Journal of experimental biology. 1975;63:661. doi: 10.1242/jeb.63.3.661. [DOI] [PubMed] [Google Scholar]
- 205.Monod J, Wyman J, Changeux JP. J. Mol. Biol. 1965;12:88. doi: 10.1016/s0022-2836(65)80285-6. [DOI] [PubMed] [Google Scholar]
- 206.Johnson BA, Bonaventura C, Bonaventura J. Biochemistry. 1988;27:1995. doi: 10.1021/bi00406a028. [DOI] [PubMed] [Google Scholar]
- 207.Morris S, McMahon BR. Physiological Zoology. 1989;62:654. [Google Scholar]
- 208.Dainese E, Di Muro P, Beltramini M, Salvato B, Decker H. Eur. J. Biochem. 1998;256:350. doi: 10.1046/j.1432-1327.1998.2560350.x. [DOI] [PubMed] [Google Scholar]
- 209.Weber RE, Behrens JW, Malte H, Fago A. The Journal of experimental biology. 2008;211:1057. doi: 10.1242/jeb.013433. [DOI] [PubMed] [Google Scholar]
- 210.Klarman A, Daniel E. J. Mol. Biol. 1977;115:257. doi: 10.1016/0022-2836(77)90102-4. [DOI] [PubMed] [Google Scholar]
- 211.Richey B, Decker H, Gill SJ. Biochemistry. 1985;24:109. doi: 10.1021/bi00322a016. [DOI] [PubMed] [Google Scholar]
- 212.Menze MA, Hellmann N, Decker H, Grieshaber MK. Biochemistry. 2005;44:10328. doi: 10.1021/bi050507s. [DOI] [PubMed] [Google Scholar]
- 213.Makino N. Eur. J. Biochem. 1987;163:35. doi: 10.1111/j.1432-1033.1987.tb10733.x. [DOI] [PubMed] [Google Scholar]
- 214.Decker H. Biophys. Chem. 1990;37:257. doi: 10.1016/0301-4622(90)88025-n. [DOI] [PubMed] [Google Scholar]
- 215.Brouwer M, Bonaventura C, Bonaventura J. Biochemistry. 1978;17:2148. doi: 10.1021/bi00604a019. [DOI] [PubMed] [Google Scholar]
- 216.Hellmann N, Paoli M, Giomi F, Beltramini M. Arch. Biochem. Biophys. 2010;495:112. doi: 10.1016/j.abb.2009.12.025. [DOI] [PubMed] [Google Scholar]
- 217.Bannister JV, Galdes A, Bannister WH. In: Structure and Function of Haemocyanin. Bannister J, editor. Berlin Heidelberg: Springer; 1977. [Google Scholar]
- 218.Shaklai N, Klarman A, Daniel E. Biochemistry. 1975;14:105. doi: 10.1021/bi00672a018. [DOI] [PubMed] [Google Scholar]
- 219.Van Holde KE, Miller KI, van Olden E. Biophys. Chem. 2000;86:165. doi: 10.1016/s0301-4622(00)00154-x. [DOI] [PubMed] [Google Scholar]
- 220.For a hypothetical case where P1/2 = 6 and 11 torr at 10° and 20° C, respectfully, in a solution at 32‰ salinity, equation(3.1.1) determines that ΔH = −10.0kcal/mol. When only the temperature dependence of O2 solubility is accountedfor, ΔH = −6.4 kcal/mol. Accounting for both temperature and salinity gives themost accurate value of −6.7 kcal/mol.
- 221.To convert salt concentrations to salinity, 1‰ salinity was assumed to beequivalent to 1 gram of salt per liter.
- 222.Benson BB. Limnology and oceanography. 1984;29:620. [Google Scholar]
- 223.Brix O, Bardgard A, Cau A, Colosimo A, Condo SG, Giardina B. Journal of Experimental Zoology. 1989;252:34. [Google Scholar]
- 224.Chausson F, Bridges CR, Sarradin PM, Green BN, Riso R, Caprais JC, Lallier FH. Proteins-Structure Function And Genetics. 2001;45:351. doi: 10.1002/prot.10014. [DOI] [PubMed] [Google Scholar]
- 225.Chausson F, Sanglier S, Leize E, Hagège A, Bridges CR, Sarradin PM, Shillito B, Lallier FH, Zal F. Micron. 2004;35:31. doi: 10.1016/j.micron.2003.10.010. [DOI] [PubMed] [Google Scholar]
- 226.Lallier FH, Truchot JP. Journal of Experimental Zoology. 1997;277:357. [Google Scholar]
- 227.Zolla L, Kuiper HA, Brunori M, Antonini E. In: Invertegrate Oxygen- Binding Proteins: Structure, Active Site, and Function. Lamy J, Lamy J, editors. New York, New York: Marcel Dekker, Inc.; 1979. [Google Scholar]
- 228.Er-el Z, Shaklai N, Daniel E. J. Mol. Biol. 1972;64:341. doi: 10.1016/0022-2836(72)90502-5. [DOI] [PubMed] [Google Scholar]
- 229.Morris S, Greenaway P, McMahon BR. Journal of experimental biology. 1988;140:477. [Google Scholar]
- 230.Olianas A, Sanna MT, Messana I, Castagnola M, Masia D, Manconi B, Cau A, Giardina B, Pellegrini M. J. Biochem. 2006;139:957. doi: 10.1093/jb/mvj110. [DOI] [PubMed] [Google Scholar]
- 231.Burnett LE, Scholnick DA, Mangum CP. Biological Bulletin. 1988;174:153. [Google Scholar]
- 232.Morris S, Bridges CR. Physiological Zoology. 1986;59:606. [Google Scholar]
- 233.Podda G, Manconi B, Olianas A, Pellegrini M, Messana I, Mura M, Castagnola M, Giardina B, Sanna MT. J. Biochem. 2008;143:207. doi: 10.1093/jb/mvm210. [DOI] [PubMed] [Google Scholar]
- 234.Adamczewska AM, Morris S. Journal of Experimental Biology. 1998;201:3233. doi: 10.1242/jeb.201.23.3233. [DOI] [PubMed] [Google Scholar]
- 235.Eshky A. Comparative Biochemistry and Physiology Part A: Physiology. 1996;114:297. [Google Scholar]
- 236.Morris S, Bridges CR. Journal of experimental biology. 1985;117:119. [Google Scholar]
- 237.Molon A, Di Muro P, Bubacco L, Vasilyev V, Salvato B, Beltramini M, Conze W, Hellmann N, Decker H. Eur. J. Biochem. 2000;267:7046. doi: 10.1046/j.1432-1327.2000.01803.x. [DOI] [PubMed] [Google Scholar]
- 238.Powell ML, Watts SA. Comparative Biochemistry And Physiology AMolecular & Integrative Physiology. 2006;144:211. doi: 10.1016/j.cbpa.2006.02.032. [DOI] [PubMed] [Google Scholar]
- 239.Mangum CP. Marine Biology Letters. 1983;4:139. [Google Scholar]
- 240.Larimer JL, Riggs AF. Comparative Biochemistry And Physiology. 1964;13:35. doi: 10.1016/0010-406x(64)90082-9. [DOI] [PubMed] [Google Scholar]
- 241.Redfield AC, Ingalls EN. Journal of Cellular and Comparative Physiology. 1933;3:169. [Google Scholar]
- 242.Kuiper HA, Gaastra W, Beintema JJ, van Bruggen EF, Schepman AM, Drenth J. J. Mol. Biol. 1975;99:619. doi: 10.1016/s0022-2836(75)80176-8. [DOI] [PubMed] [Google Scholar]
- 243.Sanna MT, Olianas A, Castagnola M, Sollai L, Manconi B, Salvadori S, Giardina B, Pellegrini M. Comparative Biochemistry And Physiology BBiochemistry & Molecular Biology. 2004;139:261. doi: 10.1016/j.cbpc.2004.08.005. [DOI] [PubMed] [Google Scholar]
- 244.Morris S, Taylor AC, Bridges CR, Grieshaber MK. THE JOURNAL OF EXPERIMENTAL ZOOLOGY. 1985;233:175. [Google Scholar]
- 245.Terwilliger RC, Terwilliger NB. Comparative Biochemistry And Physiology A-Molecular & Integrative Physiology. 1987;87:683. [Google Scholar]
- 246.Lenfant C, Johansen K. The American journal of physiology. 1965;209:991. doi: 10.1152/ajplegacy.1965.209.5.991. [DOI] [PubMed] [Google Scholar]
- 247.Wells RMG, Baldwin J, Speed SR, Weber RE. Marine and Freshwater Research. 1998;49:143. [Google Scholar]
- 248.Mikkelsen FF, Weber RE. Physiological Zoology. 1992;65:1057. [Google Scholar]
- 249.Brix O, Condo SG, Colosimo A, Giardina B. The Journal of experimental biology. 1990;149:417. [Google Scholar]
- 250.Karlin KD, Hayes JC, Gultneh Y, Cruse RW, McKown JW, Hutchinson JP, Zubieta J. J. Am. Chem. Soc. 1984;106:2121. [Google Scholar]
- 251.Karlin KD, Tyeklar Z, Farooq A, Haka MS, Ghosh P, Cruse RW, Gultneh Y, Hayes JC, Toscano PJ, Zubieta J. Inorganic Chemistry. 1992;31:1436. [Google Scholar]
- 252.Karlin KD, Haka MS, Cruse RW, Meyer GJ, Farooq A, Gultneh Y, Hayes JC, Zubieta J. J. Am. Chem. Soc. 1988;110:1196. [Google Scholar]
- 253.Palavicini S, Granata A, Monzani E, Casella L. J. Am. Chem. Soc. 2005;127:18031. doi: 10.1021/ja0544298. [DOI] [PubMed] [Google Scholar]
- 254.Liang HC, Karlin KD, Dyson R, Kaderli S, Jung B, Zuberbuhler AD. Inorganic Chemistry. 2000;39:5884. doi: 10.1021/ic0007916. [DOI] [PubMed] [Google Scholar]
- 255.Liang HC, Zhang CX, Henson MJ, Sommer RD, Hatwell KR, Kaderli S, Zuberbuhler AD, Rheingold AL, Solomon EI, Karlin KD. J. Am. Chem. Soc. 2002;124:4170. doi: 10.1021/ja0125265. [DOI] [PubMed] [Google Scholar]
- 256.Obias HV, Lin Y, Murthy NN, Pidcock E, Solomon EI, Ralle M, Blackburn NJ, Neuhold YM, Zuberbuhler AD, Karlin KD. J. Am. Chem. Soc. 1998;120:12960. [Google Scholar]
- 257.Liang HC, Henson MJ, Hatcher LQ, Vance MA, Zhang CX, Lahti D, Kaderli S, Sommer RD, Rheingold AL, Zuberbuhler AD, Solomon EI, Karlin KD. Inorganic Chemistry. 2004;43:4115. doi: 10.1021/ic0498283. [DOI] [PubMed] [Google Scholar]
- 258.Bohr C, Hasselbalch K, Krogh A. Skand. Arch. Physiol. 1904;16:402. [Google Scholar]
- 259.Adamczewska AM, Morris S. Journal of experimental biology. 1994;188:235. doi: 10.1242/jeb.188.1.235. [DOI] [PubMed] [Google Scholar]
- 260.Booth CE, McMahon BR, Pinder AW. Journal of Comparative Physiology B. 1982;148:111. [Google Scholar]
- 261.Wood CM, Randall DJ. Journal of Experimental Zoology. 1981;218:23. [Google Scholar]
- 262.Graham RA, Mangum CP, Terwilliger RC, Terwilliger NB. Comparative biochemistry and physiology. A, Comparative physiology. 1983;74:45. [Google Scholar]
- 263.Smatresk NJ, Preslar AJ, Cameron JN. Journal of Experimental Zoology. 1979;210:205. [Google Scholar]
- 264.Zolla L, Kuiper HA, Vecchini P, Antonini E, Brunori M. Eur. J. Biochem. 1978;87:467. doi: 10.1111/j.1432-1033.1978.tb12397.x. [DOI] [PubMed] [Google Scholar]
- 265.Mangum CP. American Zoologist. 1980;20:19. [Google Scholar]
- 266.Barnhart MC. Physiological Zoology. 1986;59:725. [Google Scholar]
- 267.Wood EJ, Dalgleisdg Eur. J. Biochem. 1973;35:421. doi: 10.1111/j.1432-1033.1973.tb02854.x. [DOI] [PubMed] [Google Scholar]
- 268.Sullivan B, J B, C B. Proceedings Of The National Academy Of Sciences Of The United States Of America. 1974;71:2558. doi: 10.1073/pnas.71.6.2558. [DOI] [PMC free article] [PubMed] [Google Scholar]
- 269.Makino N. J. Biochem. 1989;106:418. doi: 10.1093/oxfordjournals.jbchem.a122867. [DOI] [PubMed] [Google Scholar]
- 270.Burton RF. Comparative Biochemistry And Physiology. 1969;29:919. doi: 10.1016/0010-406x(69)90994-3. [DOI] [PubMed] [Google Scholar]
- 271.Mangum CP, Shick JM. Comparative biochemistry and physiology. A, Comparative physiology. 1972;42:693. [Google Scholar]
- 272.Allender MC, Schumacher J, George R, Milam J, Odoi A. Journal of Zoo and Wildlife Medicine. 2010;41:193. doi: 10.1638/2008-0175R2.1. [DOI] [PubMed] [Google Scholar]
- 273.Minton AP. Proceedings Of The National Academy Of Sciences Of The United States Of America. 1974;71:1418. doi: 10.1073/pnas.71.4.1418. [DOI] [PMC free article] [PubMed] [Google Scholar]
- 274.Smith FR, Ackers GK. Proceedings Of The National Academy Of Sciences Of The United States Of America. 1985;82:5347. doi: 10.1073/pnas.82.16.5347. [DOI] [PMC free article] [PubMed] [Google Scholar]
- 275.Brouwer M, Serigstad B. Biochemistry. 1989;28:8819. doi: 10.1021/bi00448a021. [DOI] [PubMed] [Google Scholar]
- 276.Reiber CL, Birchard GF. Journal of Thermal Biology. 1993;18:49. [Google Scholar]
- 277.Howell BJ, Gilbert DL. Comparative biochemistry and physiology. A, Comparative physiology. 1976;55:287. doi: 10.1016/0300-9629(76)90145-6. [DOI] [PubMed] [Google Scholar]
- 278.Taiwo FA. Comparative Biochemistry And Physiology A-Molecular & Integrative Physiology. 1992;102:225. [Google Scholar]
- 279.Klarman A, Daniel E. Biochemistry. 1980;19:5176. doi: 10.1021/bi00564a004. [DOI] [PubMed] [Google Scholar]
- 280.Arisaka F, Vanholde KE. J. Mol. Biol. 1979;134:41. doi: 10.1016/0022-2836(79)90413-3. [DOI] [PubMed] [Google Scholar]
- 281.Olianas A, Manconi B, Masia D, Sanna MT, Castagnola M, Salvadori S, Messana I, Giardina B, Pellegrini M. Journal of Comparative Physiology B. 2009;179:193. doi: 10.1007/s00360-008-0302-8. [DOI] [PubMed] [Google Scholar]
- 282.Kuiper HA, Forlani L, Chiancone E, Antonini E, Brunori M, Wyman J. Biochemistry. 1979;18:5849. doi: 10.1021/bi00593a015. [DOI] [PubMed] [Google Scholar]
- 283.Lallier F, Boitel F, Truchot JP. Comparative Biochemistry And Physiology A. 1987;86:255. [Google Scholar]
- 284.Wilder MN, Do Thi Thanh H, Jasmani S, Jayasankar V, Kaneko T, Aida K, Hatta T, Nemoto S, Wigginton A. Aquaculture. 2009;292:104. [Google Scholar]
- 285.Parado-Estepa FD, Ladja JM, Jesus EG, Ferraris RP. Mar. Biol. 1989;102:189. [Google Scholar]
- 286.Truchot JP. Respiration Physiology. 1975;24:173. doi: 10.1016/0034-5687(75)90112-7. [DOI] [PubMed] [Google Scholar]
- 287.Brouwer M, Bonaventura C, Bonaventura J. Biochemistry. 1977;16:3897. doi: 10.1021/bi00636a027. [DOI] [PMC free article] [PubMed] [Google Scholar]
- 288.Taylor AC, Morris S, Bridges CR. Journal Of Experimental Marine Biology And Ecology. 1985;94:167. [Google Scholar]
- 289.Mangum CP. Comparative Biochemistry And Physiology A-Molecular & Integrative Physiology. 1991;99:159. [Google Scholar]
- 290.Spicer JI, Hodgson E. Physiol. Biochem. Zool. 2003;76:843. doi: 10.1086/378913. [DOI] [PubMed] [Google Scholar]
- 291.Mangum CP. The Biological Bulletin. 1988;174:77. doi: 10.2307/1541761. [DOI] [PubMed] [Google Scholar]
- 292.Lallier F, Truchot JP. Respiration Physiology. 1989;77:323. doi: 10.1016/0034-5687(89)90120-5. [DOI] [PubMed] [Google Scholar]
- 293.Lallier F, Truchot JP. Journal of experimental biology. 1989;147:133. [Google Scholar]
- 294.Defur PL, Mangum CP, Reese JE. The Biological Bulletin. 1990;178:46. doi: 10.2307/1541536. [DOI] [PubMed] [Google Scholar]
- 295.Lallier FH, Walsh PJ. Journal of experimental biology. 1990;154:581. [Google Scholar]
- 296.Greenaway P, Morris S, McMahon BR. Journal of experimental biology. 1988;140:493. [Google Scholar]
- 297.Zeis B, Nies A, Bridges CR, Grieshaber MK. The Journal of experimental biology. 1992;168:93. [Google Scholar]
- 298.Morris S, Bridges CR, Grieshaber MK. Journal of Experimental Zoology. 1985;235:135. [Google Scholar]
- 299.Bridges CR. The Journal of experimental biology. 2001;204:1021. doi: 10.1242/jeb.204.5.1021. [DOI] [PubMed] [Google Scholar]
- 300.Sneddon LU, Taylor AC, Huntingford FA, Watson DG. The Journal of experimental biology. 2000;203:537. doi: 10.1242/jeb.203.3.537. [DOI] [PubMed] [Google Scholar]
- 301.Petrovich DP, Morris S, McMahon BR. Comparative Biochemistry And Physiology B-Biochemistry & Molecular Biology. 1990;97:745. [Google Scholar]
- 302.Pequeux A, Le Bras P, Cann-Moisan C, Caroff J, Sebert P. Crustaceana. 2002;75:567. [Google Scholar]
- 303.van Driel R, Kuiper HA, Antonini E, Brunori M. J. Mol. Biol. 1978;121:431. doi: 10.1016/0022-2836(78)90392-3. [DOI] [PubMed] [Google Scholar]
- 304.Hirota S, Kawahara T, Beltramini M, Di Muro P, Magliozzo RS, Peisach J, Powers LS, Tanaka N, Nagao S, Bubacco L. J Biol Chem. 2008;283:31941. doi: 10.1074/jbc.M803433200. [DOI] [PMC free article] [PubMed] [Google Scholar]
- 305.Wood EJ, Cayley GR, Pearson JS. J. Mol. Biol. 1977;109:1. doi: 10.1016/s0022-2836(77)80042-9. [DOI] [PubMed] [Google Scholar]
- 306.Magnus KA, Hazes B, Tonthat H, Bonaventura C, Bonaventura J, Hol WGJ. Proteins-Structure Function And Genetics. 1994;19:302. doi: 10.1002/prot.340190405. [DOI] [PubMed] [Google Scholar]
- 307.Jaenicke E, Buechler K, Markl J, Decker H, Barends TRM. Biochem. J. 2010;426:373. doi: 10.1042/BJ20091501. [DOI] [PubMed] [Google Scholar]
- 308.Arnesano F, Banci L, Bertini I, Thompsett AR. Structure. 2002;10:1337. doi: 10.1016/s0969-2126(02)00858-4. [DOI] [PubMed] [Google Scholar]
- 309.Hazes B, Magnus KA, Bonaventura C, Bonaventura J, Dauter Z, Kalk KH, Hol WG. Protein Sci. 1993;2:597. doi: 10.1002/pro.5560020411. [DOI] [PMC free article] [PubMed] [Google Scholar]
- 310.Perbandt M, Guthohrlein EW, Rypniewski W, Idakieva K, Stoeva S, Voelter W, Genov N, Betzel C. Biochemistry. 2003;42:6341. doi: 10.1021/bi020672x. [DOI] [PubMed] [Google Scholar]
- 311.Kitajima N, Fujisawa K, Morooka Y, Toriumi K. J. Am. Chem. Soc. 1989;111:8975. [Google Scholar]
- 312.Mirica LM, Ottenwaelder X, Stack TDP. Chem. Rev. 2004;104:1013. doi: 10.1021/cr020632z. [DOI] [PubMed] [Google Scholar]
- 313.Brenowitz M, Bonaventura C, Bonaventura J. Arch. Biochem. Biophys. 1984;230:238. doi: 10.1016/0003-9861(84)90105-x. [DOI] [PubMed] [Google Scholar]
- 314.Tan G, Kau L, Hodgson K, Solomon EI. Physica B: Condensed Matter. 1989;158:110. [Google Scholar]
- 315.Woolery GL, Powers L, Winkler M, Solomon EI, Spiro TG. J. Am. Chem. Soc. 1984;106:86. doi: 10.1016/0167-4838(84)90257-7. [DOI] [PubMed] [Google Scholar]
- 316.Telfer SG, McLean TM, Waterland MR. Dalton Trans. 2011;40:3097. doi: 10.1039/c0dt01226b. [DOI] [PubMed] [Google Scholar]
- 317.Freedman TB, Loehr JS, Loehr TM. J. Am. Chem. Soc. 1976;98:2809. doi: 10.1021/ja00426a023. [DOI] [PubMed] [Google Scholar]
- 318.Loehr JS, Freedman TB, Loehr TM. Biochem. Biophys. Res. Commun. 1974;56:510. doi: 10.1016/0006-291x(74)90872-9. [DOI] [PubMed] [Google Scholar]
- 319.Pate JE, Cruse RW, Karlin KD, Solomon EI. J. Am. Chem. Soc. 1987;109:2624. [Google Scholar]
- 320.Dooley DM, Scott RA, Ellinghaus J, Solomon EI, Gray HB. Proc Natl Acad Sci U S A. 1978;75:3019. doi: 10.1073/pnas.75.7.3019. [DOI] [PMC free article] [PubMed] [Google Scholar]
- 321.Kitajima N, Fujisawa K, Fujimoto C, Moro-oka Y, Hashimoto S, Kitagawa T, Toriumi K, Tatsumi K, Nakamural A. J. Am. Chem. Soc. 1992;114:1277. [Google Scholar]
- 322.Henson MJ, Mahadevan V, Stack TD, Solomon EI. Inorganic chemistry. 2001;40:5068. doi: 10.1021/ic015539s. [DOI] [PubMed] [Google Scholar]
- 323.Eickman NC, Himmelwright RS, Solomon EI. Proc Natl Acad Sci U S A. 1979;76:2094. doi: 10.1073/pnas.76.5.2094. [DOI] [PMC free article] [PubMed] [Google Scholar]
- 324.Pidcock E, Obias HV, Abe M, Liang HC, Karlin KD, Solomon EI. J. Am. Chem. Soc. 1999;121:1299. [Google Scholar]
- 325.Himmelwright R, Eickman N, LuBien C, Solomon EI. J. Am. Chem. Soc. 1980;102:5378. [Google Scholar]
- 326.Ghiretti F. Arch. Biochem. Biophys. 1956;63:165. doi: 10.1016/0003-9861(56)90020-0. [DOI] [PubMed] [Google Scholar]
- 327.Solomon EI, Tuczek F, Root DE. Chem. Rev. 1994 [Google Scholar]
- 328.Tuczek F, Solomon EI. Inorg. Chem. 1993;32:2850. [Google Scholar]
- 329.Himmelwright RS, Eickman NC, Solomon EI. Biochem. Biophys. Res. Commun. 1978;81:237. doi: 10.1016/0006-291x(78)91655-8. [DOI] [PubMed] [Google Scholar]
- 330.Himmelwright RS, Eickman NC, Solomon EI. Biochem. Biophys. Res. Commun. 1978;84:300. doi: 10.1016/0006-291x(78)90170-5. [DOI] [PubMed] [Google Scholar]
- 331.Himmelwright RS, Eickman NC, Solomon EI. Biochem. Biophys. Res. Commun. 1978;81:237. doi: 10.1016/0006-291x(78)91655-8. [DOI] [PubMed] [Google Scholar]
- 332.Metz M, Solomon EI. J. Am. Chem. Soc. 2001;123:4938. doi: 10.1021/ja004166b. [DOI] [PubMed] [Google Scholar]
- 333.Yoon J, Fujii S, Solomon EI. Proceedings Of The National Academy Of Sciences Of The United States Of America. 2009;106:6585. doi: 10.1073/pnas.0902127106. [DOI] [PMC free article] [PubMed] [Google Scholar]
- 334.Lubien CD, Winkler ME, Thamann TJ, Scott RA, Co MS, Hodgson KO, Solomon EI. J. Am. Chem. Soc. 1981;103:7014. [Google Scholar]
- 335.Hwang YT, Solomon EI. Proceedings Of The National Academy Of Sciences Of The United States Of America. 1982;79:2564. doi: 10.1073/pnas.79.8.2564. [DOI] [PMC free article] [PubMed] [Google Scholar]
- 336.Makino N, McMahill P, Mason HS, Moss TH. Journal Of Biological Chemistry. 1974;249:6062. [PubMed] [Google Scholar]
- 337.Mason HS, Fowlks WL, Peterson E. J. Am. Chem. Soc. 1955;77:2914. [Google Scholar]
- 338.Hayaishi O, Katagiri M, Rothberg S. J. Am. Chem. Soc. 1955;77:5450. [Google Scholar]
- 339.Raper HS. Biochem. J. 1927;21:89. doi: 10.1042/bj0210089. [DOI] [PMC free article] [PubMed] [Google Scholar]
- 340.Mason HS. Journal Of Biological Chemistry. 1948;172:83. [PubMed] [Google Scholar]
- 341.Simon JD, Peles D, Wakamatsu K, Ito S. Pigment Cell & Melanoma Research. 2009;22:563. doi: 10.1111/j.1755-148X.2009.00610.x. [DOI] [PubMed] [Google Scholar]
- 342.Land EJ, Riley PA. Pigment Cell Research. 2000;13:273. doi: 10.1034/j.1600-0749.2000.130409.x. [DOI] [PubMed] [Google Scholar]
- 343.Land EJ, Ito S, Wakamatsu K, Riley PA. Pigment Cell Research. 2003;16:487. doi: 10.1034/j.1600-0749.2003.00082.x. [DOI] [PubMed] [Google Scholar]
- 344.Palumbo P, d'Ischia M, Prota G. Tetrahedron. 1987;43:4203. [Google Scholar]
- 345.Edge R, Dischia M, Land EJ, Napolitano A, Navaratnam S, Panzella L, Pezzella A, Ramsden CA, Riley PA. Pigment Cell Research. 2006;19:443. doi: 10.1111/j.1600-0749.2006.00327.x. [DOI] [PubMed] [Google Scholar]
- 346.Olivares C, Jiménez-Cervantes C, Lozano JA, F. S, García-Borrón JC. Biochem. J. 2001;354:131. doi: 10.1042/0264-6021:3540131. [DOI] [PMC free article] [PubMed] [Google Scholar]
- 347.Ito S, Wakamatsu K. Pigment Cell Research. 2003;16:523. doi: 10.1034/j.1600-0749.2003.00072.x. [DOI] [PubMed] [Google Scholar]
- 348.Naysmith L, Waterston K, Ha T, Flanagan N, Bisset Y, Ray A, Wakamatsu K, Ito S, Rees JL. Journal Of Investigative Dermatology. 2004;122:423. doi: 10.1046/j.0022-202X.2004.22221.x. [DOI] [PubMed] [Google Scholar]
- 349.Thody AJ, Higgins EM, Wakamatsu K, Ito S, Burchill SA, Marks JM. Journal Of Investigative Dermatology. 1991;97:340. doi: 10.1111/1523-1747.ep12480680. [DOI] [PubMed] [Google Scholar]
- 350.Prota G. In: Pigmentation: Its Genesis and Biological Control. Riley V, editor. New York, New York: Appelton Century Crofts; 1972. [Google Scholar]
- 351.Fujimoto K, Okino N, Kawabata S, Iwanaga S, Ohnishi E. Proceedings Of The National Academy Of Sciences Of The United States Of America. 1995;92:7769. doi: 10.1073/pnas.92.17.7769. [DOI] [PMC free article] [PubMed] [Google Scholar]
- 352.Morrison R, Mason K, Frostmason S. Pigment Cell Research. 1994;7:388. doi: 10.1111/j.1600-0749.1994.tb00066.x. [DOI] [PubMed] [Google Scholar]
- 353.Halaouli S, Asther M, Sigoillot JC, Hamdi M, Lomascolo A. Journal Of Applied Microbiology. 2006;100:219. doi: 10.1111/j.1365-2672.2006.02866.x. [DOI] [PubMed] [Google Scholar]
- 354.van Gelder CWG, Flurkey WH, Wichers HJ. Phytochemistry. 1997;45:1309. doi: 10.1016/s0031-9422(97)00186-6. [DOI] [PubMed] [Google Scholar]
- 355.Lerch K. Proceedings Of The National Academy Of Sciences Of The United States Of America. 1978;75:3635. doi: 10.1073/pnas.75.8.3635. [DOI] [PMC free article] [PubMed] [Google Scholar]
- 356.Fujieda N, Ikeda T, Murata M, Yanagisawa S, Aono S, Ohkubo K, Nagao S, Ogura T, Hirota S, Fukuzumi S, Nakamura Y, Hata Y, Itoh S. J. Am. Chem. Soc. 2011;133:1180. doi: 10.1021/ja108280w. [DOI] [PubMed] [Google Scholar]
- 357.Claus H, Decker H. Systematic and applied microbiology. 2006;29:3. doi: 10.1016/j.syapm.2005.07.012. [DOI] [PubMed] [Google Scholar]
- 358.Butler MJ, Day AW. Can. J. Microbiol. 1998;44:1115. [Google Scholar]
- 359.Bell AA, Wheeler MH. Annual Review of Phytopathology. 1986;24:411. [Google Scholar]
- 360.Nosanchuk JD, Casadevall A. Cellular microbiology. 2003;5:203. doi: 10.1046/j.1462-5814.2003.00268.x. [DOI] [PubMed] [Google Scholar]
- 361.Chen LY, Chen MY, Leu WM, Tsai TY, Lee YHW. Journal Of Biological Chemistry. 1993;268:18710. [PubMed] [Google Scholar]
- 362.Chen LY, Leu WM, Wang KT, Lee YHW. Journal Of Biological Chemistry. 1992;267:20100. [PubMed] [Google Scholar]
- 363.Schaerlaekens K, Lammertyn E, Geukens N, De Keersmaeker S, Anne J, Van Mellaert L. J. Biotechnol. 2004;112:279. doi: 10.1016/j.jbiotec.2004.05.004. [DOI] [PubMed] [Google Scholar]
- 364.Schaerlaekens K, Schierova M, Lammertyn E, Geukens N, Anne J, VanMellaert L. J. Bacteriol. 2001;183:6727. doi: 10.1128/JB.183.23.6727-6732.2001. [DOI] [PMC free article] [PubMed] [Google Scholar]
- 365.Leu WM, Chen LY, Liaw LL, Lee YHW. Journal Of Biological Chemistry. 1992;267:20108. [PubMed] [Google Scholar]
- 366.López-Serrano D, Solano F, Sanchez-Amat A. Microbiology. 2007;153:2241. doi: 10.1099/mic.0.2007/006833-0. [DOI] [PubMed] [Google Scholar]
- 367.Harel K, Mayer AM, Shain Y. Physiol. Plant. 1964;17:921. [Google Scholar]
- 368.Kahn V, Pomerantz SH. Phytochemistry. 1980;19:379. [Google Scholar]
- 369.Robb DA, Mapson LW, Swain T. Nature. 1964;201:503. [Google Scholar]
- 370.Martinez-Cayuela M, De Medina LS, Faus MJ, Gil A. J. Food Sci. 1988;53:1191. [Google Scholar]
- 371.Şakiroǧlu H, Küfrevioǧlu ÖI, Kocaçalişkan I, Oktay M, Onganer Y. J. Agric. Food. Chem. 1996;44:2982. [Google Scholar]
- 372.Pérez-Gilabert M, Garcia-Carmona F. J. Agric. Food. Chem. 2000;48:695. doi: 10.1021/jf990292r. [DOI] [PubMed] [Google Scholar]
- 373.Valero E, Varón R, GarcÍA-Carmona F. J. Food Sci. 1988;53:1482. [Google Scholar]
- 374.Park EY, Luh BS. J. Food Sci. 1985;50:678. [Google Scholar]
- 375.Sanchez-Ferrer A, Laveda F, GarcÍA-Carmona F. J. Agric. Food. Chem. 1993;41:1225. doi: 10.1021/jf001010m. [DOI] [PubMed] [Google Scholar]
- 376.Koussevitzky S, Ne'eman E, Sommer A, Steffens JC, Harel E. Journal Of Biological Chemistry. 1998;273:27064. doi: 10.1074/jbc.273.42.27064. [DOI] [PubMed] [Google Scholar]
- 377.Sommer A, Neeman E, Steffens JC, Mayer AM, Harel E. Plant Physiol. 1994;105:1301. doi: 10.1104/pp.105.4.1301. [DOI] [PMC free article] [PubMed] [Google Scholar]
- 378.Sherman TD, Legardeur T, Lax AR. Enzymatic Browning And Its Prevention. 1995;600:103. [Google Scholar]
- 379.Vaughn KC, Lax AR, Duke SO. Physiol. Plant. 1988;72:659. [Google Scholar]
- 380.Golbeck JH, Cammarata KV. Plant Physiol. 1981;67:977. doi: 10.1104/pp.67.5.977. [DOI] [PMC free article] [PubMed] [Google Scholar]
- 381.Marusek CM, Trobaugh NM, Flurkey WH, Inlow JK. J. Inorg. Biochem. 2006;100:108. doi: 10.1016/j.jinorgbio.2005.10.008. [DOI] [PubMed] [Google Scholar]
- 382.Kim JY, Seo YS, Kim JE, Sung SK, Song KJ, An G, Kim WT. Plant Science. 2001;161:1145. [Google Scholar]
- 383.Constabel CP, Yip L, Patton JJ, Christopher ME. Plant Physiol. 2000;124:285. doi: 10.1104/pp.124.1.285. [DOI] [PMC free article] [PubMed] [Google Scholar]
- 384.Constabel CP, Ryan CA. Phytochemistry. 1998;47:507. [Google Scholar]
- 385.Coetzer C, Corsini D, Love S, Pavek J, Tumer N. J. Agric. Food. Chem. 2001;49:652. doi: 10.1021/jf001217f. [DOI] [PubMed] [Google Scholar]
- 386.Yu HF, Kowalski SP, Steffens JC. Plant Physiol. 1992;100:1885. doi: 10.1104/pp.100.4.1885. [DOI] [PMC free article] [PubMed] [Google Scholar]
- 387.Thipyapong P, Melkonian J, Wolfe DW, Steffens JC. Plant Science. 2004;167:693. [Google Scholar]
- 388.Li L, Steffens J. Planta. 2002;215:239. doi: 10.1007/s00425-002-0750-4. [DOI] [PubMed] [Google Scholar]
- 389.Wang J, Constabel CP. Planta. 2004;220:87. doi: 10.1007/s00425-004-1327-1. [DOI] [PubMed] [Google Scholar]
- 390.Koussevitzky S, Ne'eman E, Harel E. Planta. 2004;219:412. doi: 10.1007/s00425-004-1240-7. [DOI] [PubMed] [Google Scholar]
- 391.Nakayama T, Yonekura-Sakakibara K, Sato T, Kikuchi S, Fukui Y, Fukuchi-Mizutani M, Ueda T, Nakao M, Tanaka Y, Kusumi T, Nishino T. Science. 2000;290:1163. doi: 10.1126/science.290.5494.1163. [DOI] [PubMed] [Google Scholar]
- 392.Gandia-Herrero F, Escribano J, Garcia-Carmona F. Planta. 2005;222:307. doi: 10.1007/s00425-005-1526-4. [DOI] [PubMed] [Google Scholar]
- 393.Cho MH, Moinuddin SGA, Helms GL, Hishiyama S, Eichinger D, Davin LB, Lewis NG. Proceedings Of The National Academy Of Sciences Of The United States Of America. 2003;100:10641. doi: 10.1073/pnas.1934562100. [DOI] [PMC free article] [PubMed] [Google Scholar]
- 394.Eleftherianos I, Revenis C. Journal Of Innate Immunity. 2011;3:28. doi: 10.1159/000321931. [DOI] [PubMed] [Google Scholar]
- 395.Cerenius L, Lee BL, Soderhall K. Trends In Immunology. 2008;29:263. doi: 10.1016/j.it.2008.02.009. [DOI] [PubMed] [Google Scholar]
- 396.Nagai T, Kawabata S. Journal Of Biological Chemistry. 2000;275:29264. doi: 10.1074/jbc.M002556200. [DOI] [PubMed] [Google Scholar]
- 397.Nagai T, Osaki T, Kawabata S. Journal Of Biological Chemistry. 2001;276:27166. doi: 10.1074/jbc.M102596200. [DOI] [PubMed] [Google Scholar]
- 398.Fujieda N, Yakiyama A, Itoh S. Dalton Transactions. 2010;39:3083. doi: 10.1039/c000760a. [DOI] [PubMed] [Google Scholar]
- 399.Zlateva T, DiMuro P, Salvato B, Beltramini M. FEBS LETTERS. 1996;384:251. doi: 10.1016/0014-5793(96)00326-2. [DOI] [PubMed] [Google Scholar]
- 400.Nillius D, Jaenicke E, Decker H. FEBS LETTERS. 2008;582:749. doi: 10.1016/j.febslet.2008.01.056. [DOI] [PubMed] [Google Scholar]
- 401.Decker H, Ryan M, Jaenicke E, Terwilliger N. Journal Of Biological Chemistry. 2001;276:17796. doi: 10.1074/jbc.M010436200. [DOI] [PubMed] [Google Scholar]
- 402.Pless DD, Aguilar MB, Falcon A, Lozano-Alvarez E, de la Cotera EPH. Arch. Biochem. Biophys. 2003;409:402. doi: 10.1016/s0003-9861(02)00615-x. [DOI] [PubMed] [Google Scholar]
- 403.Baird S, Kelly SM, Price NC, Jaenicke E, Meesters C, Nillius D, Decker H, Nairn J. Biochimica Et Biophysica Acta. 2007;1774:1380. doi: 10.1016/j.bbapap.2007.08.019. [DOI] [PubMed] [Google Scholar]
- 404.Suzuki K, Shimokawa C, Morioka C, Itoh S. Biochemistry. 2008;47:7108. doi: 10.1021/bi8002764. [DOI] [PubMed] [Google Scholar]
- 405.Decker H, Rimke T. Journal Of Biological Chemistry. 1998;273:25889. doi: 10.1074/jbc.273.40.25889. [DOI] [PubMed] [Google Scholar]
- 406.Lee SY, Lee BL, Soderhall K. Biochem. Biophys. Res. Commun. 2004;322:490. doi: 10.1016/j.bbrc.2004.07.145. [DOI] [PubMed] [Google Scholar]
- 407.Naraoka T, Uchisawa H, Mori H, Matsue H, Chiba S, Kimura A. Eur. J. Biochem. 2003;270:4026. doi: 10.1046/j.1432-1033.2003.03795.x. [DOI] [PubMed] [Google Scholar]
- 408.Fan T, Li M, Wang J, Yang L, Cong R. Acta biochimica et biophysica Sinica. 2009;41:865. doi: 10.1093/abbs/gmp078. [DOI] [PubMed] [Google Scholar]
- 409.Prota G, Ortonne JP, Voulot C, Khatchadourian C, Nardi G, Palumbo A. Comparative Biochemistry and Physiology Part B: Comparative Biochemistry. 1981;68:415. [Google Scholar]
- 410.Jackson IJ. Annual Review of Genetics. 1994;28:189. doi: 10.1146/annurev.ge.28.120194.001201. [DOI] [PubMed] [Google Scholar]
- 411.Solano F, Jiménez-Cervantes C, Martínez-Liarte JH, García-Borrón JC, Jara JR, Lozano JA. Biochem. J. 1996;313:447. doi: 10.1042/bj3130447. [DOI] [PMC free article] [PubMed] [Google Scholar]
- 412.Furumura M, Solano F, Matsunaga N, Sakai C, Spritz RA, Hearing VJ. Biochem. Biophys. Res. Commun. 1998;242:579. doi: 10.1006/bbrc.1997.8007. [DOI] [PubMed] [Google Scholar]
- 413.Jimenez M, Tsukamoto K, Hearing VJ. Journal Of Biological Chemistry. 1991;266:1147. [PubMed] [Google Scholar]
- 414.Jiménez-Cervantes C, García-Borrón JC, Valverde P, Solano F, Lozano JA. Eur. J. Biochem. 1993;217:549. doi: 10.1111/j.1432-1033.1993.tb18276.x. [DOI] [PubMed] [Google Scholar]
- 415.Jiménez-Cervantes C, Solano F, Kobayashi T, Urabe K, Hearing VJ, Lozano JA, García-Borrón JC. Journal Of Biological Chemistry. 1994;269:17993. [PubMed] [Google Scholar]
- 416.Kobayashi T, Urabe K, Winder A, Jiménez-Cervantes C, Imokawa G, Brewington T, Solano F, García-Borrón JC, Hearing VJ. The EMBO Journal. 1994;13:5818. doi: 10.1002/j.1460-2075.1994.tb06925.x. [DOI] [PMC free article] [PubMed] [Google Scholar]
- 417.Boissy RE, Sakai C, Zhao H, Kobayashi T, Hearing VJ. Experimental Dermatology. 1998;7:198. doi: 10.1111/j.1600-0625.1998.tb00324.x. [DOI] [PubMed] [Google Scholar]
- 418.Manga P, Sato K, Ye L, Beermann F, Lamoreux ML, Orlow SJ. Pigment Cell Research. 2000;13:364. doi: 10.1034/j.1600-0749.2000.130510.x. [DOI] [PubMed] [Google Scholar]
- 419.Orlow SJ, Zhou BK, Chakraborty AK, Drucker M, Pifko-Hirst S, Pawelek JM. Journal Of Investigative Dermatology. 1994;103:196. doi: 10.1111/1523-1747.ep12392743. [DOI] [PubMed] [Google Scholar]
- 420.Busca R, Ballotti R. Pigment Cell Research. 2000;13:60. doi: 10.1034/j.1600-0749.2000.130203.x. [DOI] [PubMed] [Google Scholar]
- 421.Vachtenheim J, Borovansky J. Experimental Dermatology. 2010;19:617. doi: 10.1111/j.1600-0625.2009.01053.x. [DOI] [PubMed] [Google Scholar]
- 422.Wang N, Hebert DN. Pigment Cell Research. 2006;19:3. doi: 10.1111/j.1600-0749.2005.00288.x. [DOI] [PubMed] [Google Scholar]
- 423.Setty SRG, Tenza D, Sviderskaya EV, Bennett DC, Raposo G, Marks MS. Nature. 2008;454:1142. doi: 10.1038/nature07163. [DOI] [PMC free article] [PubMed] [Google Scholar]
- 424.Database, TA. 2009;Vol. 2013 [Google Scholar]
- 425.Oetting WS. Pigment Cell Research. 2000;13:320. doi: 10.1034/j.1600-0749.2000.130503.x. [DOI] [PubMed] [Google Scholar]
- 426.Ray K, Chaki M, Sengupta M. Progress In Retinal And Eye Research. 2007;26:323. doi: 10.1016/j.preteyeres.2007.01.001. [DOI] [PubMed] [Google Scholar]
- 427.Schallreuter KU, Salem MMAEL, Hasse S, Rokos H. Pigment Cell & Melanoma Research. 2011;24:51. doi: 10.1111/j.1755-148X.2010.00794.x. [DOI] [PubMed] [Google Scholar]
- 428.Wood JM, Decker H, Hartmann H, Chavan B, Rokos H, Spencer JD, Hasse S, Thornton MJ, Shalbaf M, Paus R, Schallreuter KU. FASEB J. 2009;23:2065. doi: 10.1096/fj.08-125435. [DOI] [PubMed] [Google Scholar]
- 429.Tief K, Schmidt A, Beermann F. Brain research. Molecular brain research. 1998;53:307. doi: 10.1016/s0169-328x(97)00301-x. [DOI] [PubMed] [Google Scholar]
- 430.Xu Y, Stokes AH, Freeman WM, Kumer SC, Vogt BA, Vrana KE. Molecular Brain Research. 1997;45:159. doi: 10.1016/s0169-328x(96)00308-7. [DOI] [PubMed] [Google Scholar]
- 431.Hernandez EH. Medical Hypotheses. 2009;72:280. doi: 10.1016/j.mehy.2008.10.011. [DOI] [PubMed] [Google Scholar]
- 432.Ikemoto K, Nagatsu I, Ito S, King RA, Nishimura A, Nagatsu T. Neuroscience letters. 1998;253:198. doi: 10.1016/s0304-3940(98)00649-1. [DOI] [PubMed] [Google Scholar]
- 433.Tribl F, Arzberger T, Riederer P, Gerlach M. Journal Of Neural Transmission. 2007;72:51. doi: 10.1007/978-3-211-73574-9_8. [DOI] [PubMed] [Google Scholar]
- 434.Fedorow H, Tribl F, Halliday G, Gerlach A, Riederer P, Double KL. Progress In Neurobiology. 2005;75:109. doi: 10.1016/j.pneurobio.2005.02.001. [DOI] [PubMed] [Google Scholar]
- 435.Noguchi A, Kitamura T, Onaka H, Horinouchi S, Ohnishi Y. Nature Chemical Biology. 2010;6:641. doi: 10.1038/nchembio.418. [DOI] [PubMed] [Google Scholar]
- 436.Suzuki H, Furusho Y, Higashi T, Ohnishi Y, Horinouchi S. Journal Of Biological Chemistry. 2006;281:824. doi: 10.1074/jbc.M505806200. [DOI] [PubMed] [Google Scholar]
- 437.Toussaint O, Lerch K. Biochemistry. 1987;26:8567. doi: 10.1021/bi00400a011. [DOI] [PubMed] [Google Scholar]
- 438.Rodriguez-Lopez JN, Fenoll LG, Garcia-Ruiz PA, Varon R, Tudela J, Thorneley RNF, Garcia-Canovas F. Biochemistry. 2000;39:10497. doi: 10.1021/bi000539+. [DOI] [PubMed] [Google Scholar]
- 439.Tepper A, Bubacco L, Canters GW. Journal Of Biological Chemistry. 2004;279:13425. doi: 10.1074/jbc.M309367200. [DOI] [PubMed] [Google Scholar]
- 440.Hirota S, Kawahara T, Lonardi E, de Waal E, Funasaki N, Canters GW. J. Am. Chem. Soc. 2005;127:17966. doi: 10.1021/ja0541128. [DOI] [PubMed] [Google Scholar]
- 441.Jolley RL, Evans LH, Makino N, Mason HS. Journal Of Biological Chemistry. 1974;249:335. [PubMed] [Google Scholar]
- 442.Lerch K. In: Met. Ions Biol. Syst. Sigel H, editor. Vol. 13. New York, New York: Marcel Decker, Inc.; 1981. [Google Scholar]
- 443.Makino N, Mason HS. Journal Of Biological Chemistry. 1973;248:5731. [PubMed] [Google Scholar]
- 444.Kandaswac, Vaidyanacs Journal Of Biological Chemistry. 1973;248:4035. [Google Scholar]
- 445.Himmelwright R, Eickman N, LuBien C, Solomon EI, Lerch K. J. Am. Chem. Soc. 1980;102:7339. [Google Scholar]
- 446.Monder C, Williams JN, Waisman HA. Arch. Biochem. Biophys. 1957;72:255. doi: 10.1016/0003-9861(57)90203-5. [DOI] [PubMed] [Google Scholar]
- 447.Monder C, Williams JN, Waisman HA. Arch. Biochem. Biophys. 1957;72:271. doi: 10.1016/0003-9861(57)90204-7. [DOI] [PubMed] [Google Scholar]
- 448.Liu XQ, Zhang ZL, Cheng GJ, Dong SJ. Electroanalysis. 2003;15:103. [Google Scholar]
- 449.Duckworth HW, Coleman JE. Journal Of Biological Chemistry. 1970;245:1613. [PubMed] [Google Scholar]
- 450.Espin JC, Garcia-Ruiz PA, Tudela J, Garcia-Canovas F. Biochem. J. 1998;331:547. doi: 10.1042/bj3310547. [DOI] [PMC free article] [PubMed] [Google Scholar]
- 451.Fenoll LG, Rodriguez-Lopez JN, Varon R, Garcia-Ruiz PA, Garcia-Canovas F, Tudela J. International Journal Of Biochemistry & Cell Biology. 2002;34:1594. doi: 10.1016/s1357-2725(02)00076-6. [DOI] [PubMed] [Google Scholar]
- 452.Ingraham LL. J. Am. Chem. Soc. 1957;79:666. [Google Scholar]
- 453.Rodriguez Lopez JN, Ros JR, Varon R, Garcia-Canovas F. Biochem. J. 1993;293:859. doi: 10.1042/bj2930859. [DOI] [PMC free article] [PubMed] [Google Scholar]
- 454.Granata A, Monzani E, Bubacco L, Casella L. Chemistry-A European Journal. 2006;12:2504. doi: 10.1002/chem.200501097. [DOI] [PubMed] [Google Scholar]
- 455.Zhou P, Smith NL, Lee CY. J. Agric. Food. Chem. 1993;41:532. [Google Scholar]
- 456.Flurkey WH, Jen JJ. J. Food Biochem. 1980;4:29. [Google Scholar]
- 457.Raymond J, Rakariyatham N, Azanza JL. The International Journal of Plant Biochemistry. 1993;34:927. [Google Scholar]
- 458.Wesche-Ebeling P, Montgomery MW. J. Food Sci. 1990;55:1320. [Google Scholar]
- 459.Paul B, Gowda LR. J. Agric. Food. Chem. 2000;48:3839. doi: 10.1021/jf000296s. [DOI] [PubMed] [Google Scholar]
- 460.Lee CY, Smith NL, Pennesi AP. J. Sci. Food Agric. 1983;34:987. [Google Scholar]
- 461.Lerch K, Ettinger L. Eur. J. Biochem. 1972;31:427. doi: 10.1111/j.1432-1033.1972.tb02549.x. [DOI] [PubMed] [Google Scholar]
- 462.Bhatnagar V, Anjaiah S, Puri N, Darshanam BN, Ramaiah A. Arch. Biochem. Biophys. 1993;307:183. doi: 10.1006/abbi.1993.1577. [DOI] [PubMed] [Google Scholar]
- 463.Cheli Y, Luciani F, Khaled M, Beuret L, Bille K, Gounon P, Ortonne J-P, Bertolotto C, Ballotti R. Journal Of Biological Chemistry. 2009;284:18699. doi: 10.1074/jbc.M109.005819. [DOI] [PMC free article] [PubMed] [Google Scholar]
- 464.Fuller BB, Spaulding DT, Smith DR. Experimental Cell Research. 2001;262:197. doi: 10.1006/excr.2000.5092. [DOI] [PubMed] [Google Scholar]
- 465.Fenoll LG, Penalver MJ, Rodriguez-Lopez JN, Garcia-Ruiz PA, Garcia-Canovas F, Tudela J. Biochem. J. 2004;380:643. doi: 10.1042/BJ20040136. [DOI] [PMC free article] [PubMed] [Google Scholar]
- 466.Penalver MJ, Rodriguez-Lopez JNR, Garcia-Ruiz PA, Garcia-Canovas F, Tudela J. Biochimica Et Biophysica Acta-Proteins And Proteomics. 2003;1650:128. doi: 10.1016/s1570-9639(03)00208-5. [DOI] [PubMed] [Google Scholar]
- 467.Fenoll LG, Rodriguez Lopez JN, Garcia-Sevilla F, García-Ruiz PA, Varon R, Garcia-Canovas F, Tudela J. Biochimica Et Biophysica Acta. 2001;1548:1. doi: 10.1016/s0167-4838(01)00207-2. [DOI] [PubMed] [Google Scholar]
- 468.Rodriguez-Lopez JN, Tudela J, Varon R, Garciacarmona F, Garciacanovas F. Journal Of Biological Chemistry. 1992;267:3801. [PubMed] [Google Scholar]
- 469.Yamazaki S, Itoh S. J. Am. Chem. Soc. 2003;125:13034. doi: 10.1021/ja036425d. [DOI] [PubMed] [Google Scholar]
- 470.Battaini G, Monzani E, Casella L, Lonardi E, Tepper A, Canters GW, Bubacco L. Journal Of Biological Chemistry. 2002;277:44606. doi: 10.1074/jbc.M207829200. [DOI] [PubMed] [Google Scholar]
- 471.Lerner AB, Fitzpatrick TB. Journal Of Biological Chemistry. 1949;178:185. [PubMed] [Google Scholar]
- 472.Garcia-Canovas F, Garcia-Carmona F, Lozano JA. Phytochemistry. 1981;20:1215. [Google Scholar]
- 473.Satô M. Phytochemistry. 1969;8:353. [Google Scholar]
- 474.Kean EA. Biochemica et Biophysica Acta. 1964;92:602. doi: 10.1016/0926-6569(64)90020-3. [DOI] [PubMed] [Google Scholar]
- 475.Carmona FG, Pedreño E, Galindo JD, Cánovas FG. Anal. Biochem. 1979;95:433. doi: 10.1016/0003-2697(79)90751-6. [DOI] [PubMed] [Google Scholar]
- 476.Pomerantz SH, Warner MC. Journal Of Biological Chemistry. 1967;242:5308. [PubMed] [Google Scholar]
- 477.Cooksey CJ, Garratt PJ, Land EJ, Pavel S, Ramsden CA, Riley PA, Smit NP. Journal Of Biological Chemistry. 1997;272:26226. doi: 10.1074/jbc.272.42.26226. [DOI] [PubMed] [Google Scholar]
- 478.Fujieda N, Murata M, Yabuta S, Ikeda T, Shimokawa C, Nakamura Y, Hata Y, Itoh S. Journal of biological inorganic chemistry. 2012;18:19. doi: 10.1007/s00775-012-0945-5. [DOI] [PubMed] [Google Scholar]
- 479.Mirica LM, Vance MA, Rudd DJ, Hedman B, Hodgson KO, Solomon EI, Stack TDP. Science (New York, NY) 2005;308:1890. doi: 10.1126/science.1112081. [DOI] [PubMed] [Google Scholar]
- 480.Wood BJB, Ingraham LL. Arch. Biochem. Biophys. 1962;98:479. doi: 10.1016/0003-9861(62)90214-x. [DOI] [PubMed] [Google Scholar]
- 481.Pomerantz SH. Journal Of Biological Chemistry. 1966;241:161. [PubMed] [Google Scholar]
- 482.Olivares C, Garcia-Borron JC, Solano F. Biochemistry. 2002;41:679. doi: 10.1021/bi011535n. [DOI] [PubMed] [Google Scholar]
- 483.Ben-Yosef VS, Sendovski M, Fishman A. Enzyme Microb. Technol. 2010;47:372. [Google Scholar]
- 484.King RA, Mentink MM, Oetting WS. Molecular Biology & Medicine. 1991;8:19. [PubMed] [Google Scholar]
- 485.Tripathi RK, Hearing VJ, Urabe K, Aroca P, Spritz RA. Journal Of Biological Chemistry. 1992;267:23707. [PubMed] [Google Scholar]
- 486.Loizzo MR, Tundis R, Menichini F. Comprehensive Reviews in Food Science and Food Safety. 2012;11:378. [Google Scholar]
- 487.Chang TS. International Journal Of Molecular Sciences. 2009;10:2440. doi: 10.3390/ijms10062440. [DOI] [PMC free article] [PubMed] [Google Scholar]
- 488.Solano F, Briganti S, Picardo M, Ghanem G. Pigment cell research. 2006;19:550. doi: 10.1111/j.1600-0749.2006.00334.x. [DOI] [PubMed] [Google Scholar]
- 489.Kim YJ, Uyama H. Cellular and molecular life sciences. 2005;62:1707. doi: 10.1007/s00018-005-5054-y. [DOI] [PMC free article] [PubMed] [Google Scholar]
- 490.Conrad JS, Dawso SR, Hubbard ER, Meyers TE, Strothkamp KG. Biochemistry. 1994;33:5739. doi: 10.1021/bi00185a010. [DOI] [PubMed] [Google Scholar]
- 491.Schowen KB, Schowen RL. Methods Enzymol. 1982;87:551. [PubMed] [Google Scholar]
- 492.Tyeklár Z, Paul PP, Jacobson RR, Farooq A, Karlin KD, Zubieta J. J. Am. Chem. Soc. 1989;111:388. [Google Scholar]
- 493.Sorrell TN, Allen WE, White PS. Inorganic Chemistry. 1995;34:952. [Google Scholar]
- 494.Paul PP, Tyeklár Z, Jacobson RR, Karlin KD. J. Am. Chem. Soc. 1991;113:5322. [Google Scholar]
- 495.Cleland WW. Biochemistry. 1992;31:317. doi: 10.1021/bi00117a001. [DOI] [PubMed] [Google Scholar]
- 496.Salvato B, Santamaria M, Beltramini M, Alzuet G, Casella L. Biochemistry. 1998;37:14065. doi: 10.1021/bi980879j. [DOI] [PubMed] [Google Scholar]
- 497.Ginsbach JW, Kieber-Emmons MT, Nomoto R, Noguchi A, Ohnishi Y, Solomon EI. Proceedings Of The National Academy Of Sciences Of The United States Of America. 2012;109:10793. doi: 10.1073/pnas.1208718109. [DOI] [PMC free article] [PubMed] [Google Scholar]
- 498.Klabunde T, Eicken C, Sacchettini JC, Krebs B. Nature Structural Biology. 1998;5:1084. doi: 10.1038/4193. [DOI] [PubMed] [Google Scholar]
- 499.Virador VM, Reyes Grajeda JP, Blanco-Labra A, Mendiola-Olaya E, Smith GM, Moreno A, Whitaker JR. J. Agric. Food. Chem. 2010;58:1189. doi: 10.1021/jf902939q. [DOI] [PubMed] [Google Scholar]
- 500.Matoba Y, Kumagai T, Yamamoto A, Yoshitsu H, Sugiyama M. Journal Of Biological Chemistry. 2006;281:8981. doi: 10.1074/jbc.M509785200. [DOI] [PubMed] [Google Scholar]
- 501.Sendovski M, Kanteev M, Ben-Yosef V, Adir N, Fishman A. J. Mol. Biol. 2011;405:227. doi: 10.1016/j.jmb.2010.10.048. [DOI] [PubMed] [Google Scholar]
- 502.Ismaya WT, Rozeboom HJ, Weijn A, Mes JJ, Fusetti F, Wichers HJ, Dijkstra BW. Biochemistry. 2011;50:5477. doi: 10.1021/bi200395t. [DOI] [PubMed] [Google Scholar]
- 503.Li Y, Wang Y, Jiang H, Deng J. Proceedings Of The National Academy Of Sciences Of The United States Of America. 2009;106:17002. doi: 10.1073/pnas.0906095106. [DOI] [PMC free article] [PubMed] [Google Scholar]
- 504.Hearing VJ, Tsukamoto K. The FASEB Journal. 1991;5:2902. [PubMed] [Google Scholar]
- 505.Lerch K. Progress in clinical and biological research. 1988;256:85. [PubMed] [Google Scholar]
- 506.Cioaca D, Ghenea S, Spiridon LN, Marin M, Petrescu AJ, Petrescu SM. PloS one. 2011;6:e19979. doi: 10.1371/journal.pone.0019979. [DOI] [PMC free article] [PubMed] [Google Scholar]
- 507.Tepper AWJW, Bubacco L, Canters GW. J. Am. Chem. Soc. 2005;127:567. doi: 10.1021/ja0454687. [DOI] [PubMed] [Google Scholar]
- 508.Eicken C, Zippel F, Buldt-Karentzopoulos K, Krebs B. FEBS LETTERS. 1998;436:293. doi: 10.1016/s0014-5793(98)01113-2. [DOI] [PubMed] [Google Scholar]
- 509.Winkler ME, Lerch K, Solomon EI. J. Am. Chem. Soc. 1981;103:7001. [Google Scholar]
- 510.While the original report assigned the structure of A. bisporus as deoxy-Ty due tothe long Cu•••Cu distance, the lack of an intense 8984 eV feature in the XASspectra (Ismaya WT, Rozeboom HJ, Schurink M, Boeriu CG, Wichers H, Dijkstra BW. Acta crystallographica. Section F, Structural biology andcrystallization communications. 2011;67:575. doi: 10.1107/S174430911100738X.) of the crystals indicates that theCu’s are oxidized.
- 511.Cabanes J, Chazarra S, Garcia-Carmona F. J. Pharm. Pharmacol. 1994;46:982. doi: 10.1111/j.2042-7158.1994.tb03253.x. [DOI] [PubMed] [Google Scholar]
- 512.Espin JC, Wichers HJ. J. Agric. Food. Chem. 1999;47:2638. doi: 10.1021/jf981055b. [DOI] [PubMed] [Google Scholar]
- 513.Morrison JF, Walsh CT. Adv. Enzymol. Relat. Areas Mol. Biol. 1988;61:201. doi: 10.1002/9780470123072.ch5. [DOI] [PubMed] [Google Scholar]
- 514.Jiang H, Wang Y, Kanost MR. Proceedings Of The National Academy Of Sciences Of The United States Of America. 1998;95:12220. doi: 10.1073/pnas.95.21.12220. [DOI] [PMC free article] [PubMed] [Google Scholar]
- 515.Jiang H, Wang Y, Yu XQ, Kanost MR. Journal Of Biological Chemistry. 2003;278:3552. doi: 10.1074/jbc.M205743200. [DOI] [PubMed] [Google Scholar]
- 516.Morgan TD, Thomas BR, Yonekura M, Czapla TH, Kramer KJ, Hopkins TL. Insect Biochemistry. 1990;20:251. [Google Scholar]
- 517.Gerdemann C, Eicken C, Galla HJ, Krebs B. J. Inorg. Biochem. 2002;89:155. doi: 10.1016/s0162-0134(01)00399-3. [DOI] [PubMed] [Google Scholar]
- 518.Cong Y, Zhang Q, Woolford D, Schweikardt T, Khant H, Dougherty M, Ludtke SJ, Chiu W, Decker H. Structure. 2009;17:749. doi: 10.1016/j.str.2009.03.005. [DOI] [PMC free article] [PubMed] [Google Scholar]
- 519.Eickman NC, Solomon EI, Larrabee JA, Spiro TG, Lerch K. J. Am. Chem. Soc. 1978;100:6529. [Google Scholar]
- 520.Woolery GL, Powers L, Winkler M, Solomon EI, Lerch K, Spiro TG. Biochimica et biophysica acta. 1984;788:155. doi: 10.1016/0167-4838(84)90257-7. [DOI] [PubMed] [Google Scholar]
- 521.Casella and coworkers have claimed to observe the formation of oxy-T Ty basedon a small charge transfer band at ~410 nm. However, the result is controversial.
- 522.Meunier B, de Visser SP, Shaik S. Chem. Rev. 2004;104:3947. doi: 10.1021/cr020443g. [DOI] [PubMed] [Google Scholar]
- 523.Op't Holt BT, Vance MA, Mirica LM, Heppner DE, Stack TDP, Solomon EI. J. Am. Chem. Soc. 2009;131:6421. doi: 10.1021/ja807898h. [DOI] [PMC free article] [PubMed] [Google Scholar]
- 524.Cruse RW, Kaderli S, Karlin KD, Zuberbuehler AD. J. Am. Chem. Soc. 1988;110:6882. [Google Scholar]
- 525.Nasir MS, Cohen BI, Karlin KD. J. Am. Chem. Soc. 1992;114:2482. [Google Scholar]
- 526.Karlin KD, Nasir MS, Cohen BI, Cruse RW, Kaderli S, Zuberbuehler AD. J. Am. Chem. Soc. 1994;116:1324. [Google Scholar]
- 527.Siegbahn PEM, Wirstam M. J. Am. Chem. Soc. 2001;123:11819. doi: 10.1021/ja010829t. [DOI] [PubMed] [Google Scholar]
- 528.Cramer CJ, Włoch M, Piecuch P, Puzzarini C, Gagliardi L. The journal of physical chemistry A. 2006;110:1991. doi: 10.1021/jp056791e. [DOI] [PubMed] [Google Scholar]
- 529.Itoh S, Kumei H, Taki M, Nagatomo S, Kitagawa T, Fukuzumi S. J. Am. Chem. Soc. 2001;123:6708. doi: 10.1021/ja015702i. [DOI] [PubMed] [Google Scholar]
- 530.Mirica LM, Rudd DJ, Vance MA, Solomon EI, Hodgson KO, Hedman B, Stack TDP. J. Am. Chem. Soc. 2006;128:2654. doi: 10.1021/ja056740v. [DOI] [PubMed] [Google Scholar]
- 531.Osako T, Ohkubo K, Taki M, Tachi Y, Fukuzumi S, Itoh S. J. Am. Chem. Soc. 2003;125:11027. doi: 10.1021/ja029380+. [DOI] [PubMed] [Google Scholar]
- 532.Klinman JP. Chem. Rev. 1996;96:2541. doi: 10.1021/cr950047g. [DOI] [PubMed] [Google Scholar]
- 533.Klinman JP. Journal of Biological Chemistry. 2006;281:3013. doi: 10.1074/jbc.R500011200. [DOI] [PubMed] [Google Scholar]
- 534.Hess CR, McGuirl MM, Klinman JP. Journal of Biological Chemistry. 2008;283:3042. doi: 10.1074/jbc.M705911200. [DOI] [PubMed] [Google Scholar]
- 535.Skotland T, Ljones T. Biochimica et Biophysica Acta (BBA) - General Subjects. 1980;630:30. doi: 10.1016/0304-4165(80)90134-8. [DOI] [PubMed] [Google Scholar]
- 536.Diliberto EJ, Allen PL. Journal of Biological Chemistry. 1981;256:3385. [PubMed] [Google Scholar]
- 537.Kolhekar AS, Mains RE, Eipper BA. In: Methods Enzymol. Donald B, McCormick JWSCW, editors. Vol. Volume 279. Academic Press; 1997. [Google Scholar]
- 538.Prigge ST, Kolhekar AS, Eipper BA, Mains RE, Amzel LM. Science. 1997;278:1300. doi: 10.1126/science.278.5341.1300. [DOI] [PubMed] [Google Scholar]
- 539.Chen P, Bell J, Eipper BA, Solomon EI. Biochemistry. 2004;43:5735. doi: 10.1021/bi0362830. [DOI] [PubMed] [Google Scholar]
- 540.Brenner MC, Klinman JP. Biochemistry. 1989;28:4664. doi: 10.1021/bi00437a023. [DOI] [PubMed] [Google Scholar]
- 541.Winkler H, Apps DK, Fischer-Colbrie R. Neuroscience. 1986;18:261. doi: 10.1016/0306-4522(86)90154-5. [DOI] [PubMed] [Google Scholar]
- 542.Gary T, Robertson D. Physiology. 1994;9:35. [Google Scholar]
- 543.Thomas SA, Matsumoto AM, Palmiter RD. Nature. 1995;374:643. doi: 10.1038/374643a0. [DOI] [PubMed] [Google Scholar]
- 544.Hidaka H. Nature. 1971;231:54. doi: 10.1038/231054a0. [DOI] [PubMed] [Google Scholar]
- 545.Fuller RW, Ho PPK, Matsumoto C, Clemens JA. Adv. Enzyme Regul. 1977;15:267. doi: 10.1016/0065-2571(77)90020-6. [DOI] [PubMed] [Google Scholar]
- 546.Beliaev A, Ferreira H, Learmonth DA, Soares-da-Silva P. Current Enzyme Inhibition. 2009;5:27. [Google Scholar]
- 547.Colombo G, Rajashekhar B, Giedroc DP, Villafranca JJ. Journal of Biological Chemistry. 1984;259:1593. [PubMed] [Google Scholar]
- 548.May SW, Phillips. Robert S. J. Am. Chem. Soc. 1980;102:5981. [Google Scholar]
- 549.May SW, Herman HH, Roberts SF, Ciccarello MC. Biochemistry. 1987;26:1626. doi: 10.1021/bi00380a021. [DOI] [PubMed] [Google Scholar]
- 550.Padgette SR, Wimalasena K, Herman HH, Sirimanne SR, May SW. Biochemistry. 1985;24:5826. doi: 10.1021/bi00342a021. [DOI] [PubMed] [Google Scholar]
- 551.Friedman S, Kaufman S. Journal of Biological Chemistry. 1965;240:4763. [PubMed] [Google Scholar]
- 552.Weinshilboum R, Axelrod J. Circulation Research. 1971;28:307. doi: 10.1161/01.res.28.3.307. [DOI] [PubMed] [Google Scholar]
- 553.Fischer-Colbrie R, Schober M. J. Neurochem. 1987;48:262. doi: 10.1111/j.1471-4159.1987.tb13157.x. [DOI] [PubMed] [Google Scholar]
- 554.Slater EP, Zaremba S, Hogue-Angeletti RA. Arch. Biochem. Biophys. 1981;211:288. doi: 10.1016/0003-9861(81)90456-2. [DOI] [PubMed] [Google Scholar]
- 555.Klinman JP, Krueger M, Brenner M, Edmondson DE. Journal of Biological Chemistry. 1984;259:3399. [PubMed] [Google Scholar]
- 556.Roeder T. Annual Review of Entomology. 2004;50:447. doi: 10.1146/annurev.ento.50.071803.130404. [DOI] [PubMed] [Google Scholar]
- 557.Monastirioti M. Developmental Biology. 2003;264:38. doi: 10.1016/j.ydbio.2003.07.019. [DOI] [PubMed] [Google Scholar]
- 558.Monastirioti M, Linn J, Charles E, White K. The Journal of Neuroscience. 1996;16:3900. doi: 10.1523/JNEUROSCI.16-12-03900.1996. [DOI] [PMC free article] [PubMed] [Google Scholar]
- 559.Wallace BG. J. Neurochem. 1976;26:761. doi: 10.1111/j.1471-4159.1976.tb04449.x. [DOI] [PubMed] [Google Scholar]
- 560.Lehman HK, Murgiuc CM, Hildebrand JG. Insect Biochemistry and Molecular Biology. 2000;30:377. doi: 10.1016/s0965-1748(00)00011-4. [DOI] [PubMed] [Google Scholar]
- 561.Gray EE, Small SN, McGuirl MA. Protein Expression and Purification. 2006;47:162. doi: 10.1016/j.pep.2005.11.008. [DOI] [PubMed] [Google Scholar]
- 562.Prigge ST, Mains RE, Eipper BA, Amzel LM. CMLS, Cell. Mol. Life Sci. 2000;57:1236. doi: 10.1007/PL00000763. [DOI] [PMC free article] [PubMed] [Google Scholar]
- 563.Perkins SN, Husten EJ, Eipper BA. Biochem. Biophys. Res. Commun. 1990;171:926. doi: 10.1016/0006-291x(90)90772-f. [DOI] [PubMed] [Google Scholar]
- 564.Katopodis AG, May SW. Biochemistry. 1990;29:4541. doi: 10.1021/bi00471a006. [DOI] [PubMed] [Google Scholar]
- 565.Bousquet-Moore D, Mains RE, Eipper BA. J. Neurosci. Res. 2010;88:2535. doi: 10.1002/jnr.22404. [DOI] [PMC free article] [PubMed] [Google Scholar]
- 566.Mains RE, Eipper BA. Endocrinology. 1984;115:1683. doi: 10.1210/endo-115-5-1683. [DOI] [PubMed] [Google Scholar]
- 567.Glembotski CC. Arch. Biochem. Biophys. 1985;241:673. doi: 10.1016/0003-9861(85)90594-6. [DOI] [PubMed] [Google Scholar]
- 568.Kolhekar AS, Roberts MS, Jiang N, Johnson RC, Mains RE, Eipper BA, Taghert PH. The Journal of Neuroscience. 1997;17:1363. doi: 10.1523/JNEUROSCI.17-04-01363.1997. [DOI] [PMC free article] [PubMed] [Google Scholar]
- 569.Jiang N, Kolhekar AS, Jacobs PS, Mains RE, Eipper BA, Taghert PH. Developmental Biology. 2000;226:118. doi: 10.1006/dbio.2000.9832. [DOI] [PubMed] [Google Scholar]
- 570.Czyzyk TA, Ning Y, Hsu MS, Peng B, Mains RE, Eipper BA, Pintar JE. Developmental Biology. 2005;287:301. doi: 10.1016/j.ydbio.2005.09.001. [DOI] [PubMed] [Google Scholar]
- 571.Eipper BA, Perkins SN, Husten EJ, Johnson RC, Keutmann HT, Mains RE. Journal of Biological Chemistry. 1991;266:7827. [PubMed] [Google Scholar]
- 572.Kolhekar AS, Keutmann HT, Mains RE, Quon ASW, Eipper BA. Biochemistry. 1997;36:10901. doi: 10.1021/bi9708747. [DOI] [PubMed] [Google Scholar]
- 573.Jaron S, Blackburn NJ. Biochemistry. 2001;40:6867. doi: 10.1021/bi002849y. [DOI] [PubMed] [Google Scholar]
- 574.Reedy BJ, Blackburn NJ. J. Am. Chem. Soc. 1994;116:1924. [Google Scholar]
- 575.Xin X, Mains RE, Eipper BA. Journal of Biological Chemistry. 2004;279:48159. doi: 10.1074/jbc.M407486200. [DOI] [PubMed] [Google Scholar]
- 576.Brenner MC, Murray CJ, Klinman JP. Biochemistry. 1989;28:4656. doi: 10.1021/bi00437a022. [DOI] [PubMed] [Google Scholar]
- 577.Goldstein M, Joh TH, Garvey TQ. Biochemistry. 1968;7:2724. doi: 10.1021/bi00848a005. [DOI] [PubMed] [Google Scholar]
- 578.Francisco WA, Merkler DJ, Blackburn NJ, Klinman JP. Biochemistry. 1998;37:8244. doi: 10.1021/bi973004y. [DOI] [PubMed] [Google Scholar]
- 579.Francisco WA, Blackburn NJ, Klinman JP. Biochemistry. 2003;42:1813. doi: 10.1021/bi020592t. [DOI] [PubMed] [Google Scholar]
- 580.Miller SM, Klinman JP. Biochemistry. 1985;24:2114. doi: 10.1021/bi00330a004. [DOI] [PubMed] [Google Scholar]
- 581.McIntyre NR, Lowe EW, Belof JL, Ivkovic M, Shafer J, Space B, Merkler DJ. J. Am. Chem. Soc. 2010;132:16393. doi: 10.1021/ja1019194. [DOI] [PMC free article] [PubMed] [Google Scholar]
- 582.Mains RE, Glembotski CC, Eipper BA. Endocrinology. 1984;114:1522. doi: 10.1210/endo-114-5-1522. [DOI] [PubMed] [Google Scholar]
- 583.Siebert X, Eipper BA, Mains RE, Prigge ST, Blackburn NJ, Amzel LM. Biophysical Journal. 2005;89:3312. doi: 10.1529/biophysj.105.066100. [DOI] [PMC free article] [PubMed] [Google Scholar]
- 584.Prigge ST, Kolhekar AS, Eipper BA, Mains RE, Amzel LM. Nat Struct Mol Biol. 1999;6:976. doi: 10.1038/13351. [DOI] [PubMed] [Google Scholar]
- 585.Stewart LC, Klinman JP. Journal of Biological Chemistry. 1991;266:11537. [PubMed] [Google Scholar]
- 586.Ahn N, Klinman JP. Biochemistry. 1983;22:3096. doi: 10.1021/bi00282a012. [DOI] [PubMed] [Google Scholar]
- 587.Tian G, Berry JA, Klinman JP. Biochemistry. 1994;33:226. doi: 10.1021/bi00167a030. [DOI] [PubMed] [Google Scholar]
- 588.Roth JP, Klinman JP. In: Isotope Effects in Chemistry and Biology. Kohen A, Limbach H-H, editors. Boca Raton: CRC Press; 2006. p. 645. [Google Scholar]
- 589.Rudolph FB, Fromm HJ. In: Methods Enzymol. Daniel LP, editor. Vol. Volume 63. AcademicPress; 1979. [Google Scholar]
- 590.Klinman JP, Humphries H, Voet JG. Journal of Biological Chemistry. 1980;255:11648. [PubMed] [Google Scholar]
- 591.Miller SM, Klinman JP. In: Methods Enzymol. Daniel LP, editor. Vol. Volume 87 AcademicPress; 1982. [Google Scholar]
- 592.Miller SM, Klinman JP. Biochemistry. 1983;22:3091. doi: 10.1021/bi00282a011. [DOI] [PubMed] [Google Scholar]
- 593.Northrop DB. Biochemistry. 1975;14:2644. doi: 10.1021/bi00683a013. [DOI] [PubMed] [Google Scholar]
- 594.Francisco WA, Knapp MJ, Blackburn NJ, Klinman JP. J. Am. Chem. Soc. 2002;124:8194. doi: 10.1021/ja025758s. [DOI] [PubMed] [Google Scholar]
- 595.Evans JP, Ahn K, Klinman JP. Journal of Biological Chemistry. 2003;278:49691. doi: 10.1074/jbc.M300797200. [DOI] [PubMed] [Google Scholar]
- 596.Chen P, Fujisawa K, Solomon EI. J. Am. Chem. Soc. 2000;122:10177. [Google Scholar]
- 597.Solomon EI, Ginsbach JW, Heppner DE, Kieber-Emmons MT, Kjaergaard CH, Smeets PJ, Tian L, Woertink JS. Faraday Discuss. 2011;148:11. doi: 10.1039/c005500j. [DOI] [PMC free article] [PubMed] [Google Scholar]
- 598.Yoshizawa K, Kihara N, Kamachi T, Shiota Y. Inorganic Chemistry. 2006;45:3034. doi: 10.1021/ic0521168. [DOI] [PubMed] [Google Scholar]
- 599.Crespo A, Martí MA, Roitberg AE, Amzel LM, Estrin DA. J. Am. Chem. Soc. 2006;128:12817. doi: 10.1021/ja062876x. [DOI] [PubMed] [Google Scholar]
- 600.Chen P, Solomon EI. J. Am. Chem. Soc. 2004;126:4991. doi: 10.1021/ja031564g. [DOI] [PubMed] [Google Scholar]
- 601.Chufán EE, Prigge ST, Siebert X, Eipper BA, Mains RE, Amzel LM. J. Am. Chem. Soc. 2010;132:15565. doi: 10.1021/ja103117r. [DOI] [PMC free article] [PubMed] [Google Scholar]
- 602.Blackburn NJ, Hasnain SS, Pettingill TM, Strange RW. Journal of Biological Chemistry. 1991;266:23120. [PubMed] [Google Scholar]
- 603.Boswell JS, Reedy BJ, Kulathila R, Merkler D, Blackburn NJ. Biochemistry. 1996;35:12241. doi: 10.1021/bi960742y. [DOI] [PubMed] [Google Scholar]
- 604.Hess CR, Klinman JP, Blackburn NJ. Journal of Biological Inorganic Chemistry. 2010;15:1195. doi: 10.1007/s00775-010-0677-3. [DOI] [PMC free article] [PubMed] [Google Scholar]
- 605.Eipper BA, Quon ASW, Mains RE, Boswell JS, Blackburn NJ. Biochemistry. 1995;34:2857. doi: 10.1021/bi00009a016. [DOI] [PubMed] [Google Scholar]
- 606.Peterson RL, Himes RA, Kotani H, Suenobu T, Tian L, Siegler MA, Solomon EI, Fukuzumi S, Karlin KD. J. Am. Chem. Soc. 2011;133:1702. doi: 10.1021/ja110466q. [DOI] [PMC free article] [PubMed] [Google Scholar]
- 607.Maiti D, Fry HC, Woertink JS, Vance MA, Solomon EI, Karlin KD. J. Am. Chem. Soc. 2006;129:264. doi: 10.1021/ja067411l. [DOI] [PubMed] [Google Scholar]
- 608.Komiyama K, Furutachi H, Nagatomo S, Hashimoto A, Hayashi H, Fujinami S, Suzuki M, Kitagawa T. Bull. Chem. Soc. Jpn. 2004;77:59. [Google Scholar]
- 609.Kunishita A, Kubo M, Sugimoto H, Ogura T, Sato K, Takui T, Itoh S. J. Am. Chem. Soc. 2009;131:2788. doi: 10.1021/ja809464e. [DOI] [PubMed] [Google Scholar]
- 610.Chaudhuri P, Hess M, Weyhermüller T, Wieghardt K. Angew. Chem. Int. Ed. 1999;38:1095. doi: 10.1002/(SICI)1521-3773(19990419)38:8<1095::AID-ANIE1095>3.0.CO;2-I. [DOI] [PubMed] [Google Scholar]
- 611.Donoghue PJ, Gupta AK, Boyce DW, Cramer CJ, Tolman WB. J. Am. Chem. Soc. 2010;132:15869. doi: 10.1021/ja106244k. [DOI] [PMC free article] [PubMed] [Google Scholar]
- 612.Weitzer M, Schindler S, Brehm G, Schneider S, Hörmann E, Jung B, Kaderli S, Zuberbühler AD. Inorganic Chemistry. 2003;42:1800. doi: 10.1021/ic025941m. [DOI] [PubMed] [Google Scholar]
- 613.Fujisawa K, Tanaka M, Moro-oka Y, Kitajima N. J. Am. Chem. Soc. 1994;116:12079. [Google Scholar]
- 614.Schatz M, Raab V, Foxon SP, Brehm G, Schneider S, Reiher M, Holthausen MC, Sundermeyer J, Schindler S. Angew. Chem. Int. Ed. 2004;43:4360. doi: 10.1002/anie.200454125. [DOI] [PubMed] [Google Scholar]
- 615.Lanci MP, Smirnov VV, Cramer CJ, Gauchenova EV, Sundermeyer J, Roth JP. J. Am. Chem. Soc. 2007;129:14697. doi: 10.1021/ja074620c. [DOI] [PubMed] [Google Scholar]
- 616.Maiti D, Lee DH, Gaoutchenova K, Würtele C, Holthausen MC, Narducci Sarjeant AA, Sundermeyer J, Schindler S, Karlin KD. Angew. Chem. 2008;120:88. doi: 10.1002/anie.200704389. [DOI] [PubMed] [Google Scholar]
- 617.de la Lande A, Martí S, Parisel O, Moliner V. J. Am. Chem. Soc. 2007;129:11700. doi: 10.1021/ja070329l. [DOI] [PubMed] [Google Scholar]
- 618.Bell J, El Meskini R, D'Amato D, Mains RE, Eipper BA. Biochemistry. 2003;42:7133. doi: 10.1021/bi034247v. [DOI] [PubMed] [Google Scholar]
- 619.Francisco WA, Wille G, Smith AJ, Merkler DJ, Klinman JP. J. Am. Chem. Soc. 2004;126:13168. doi: 10.1021/ja046888z. [DOI] [PubMed] [Google Scholar]
- 620.Avigad G, Asensio C, Horecker BL, Amaral D. Journal of Biological Chemistry. 1962;237:2736. [PubMed] [Google Scholar]
- 621.Kosman DJ, Ettinger MJ, Weiner RE, Massaro EJ. Arch. Biochem. Biophys. 1974;165:456. doi: 10.1016/0003-9861(74)90271-9. [DOI] [PubMed] [Google Scholar]
- 622.Whittaker JW. COPPER-CONTAINING PROTEINS. SAN DIEGO: ACADEMIC PRESSINC; 2002. [Google Scholar]
- 623.Kelleher FM, Bhavanandan VP. Journal of Biological Chemistry. 1986;261:1045. [PubMed] [Google Scholar]
- 624.Mendonca MH, Zancan GT. Arch. Biochem. Biophys. 1987;252:507. doi: 10.1016/0003-9861(87)90058-0. [DOI] [PubMed] [Google Scholar]
- 625.Loken HF. Scand. J. Clin. Lab. Invest. 1966;S 18:99. [Google Scholar]
- 626.Carter JH, Deddens JA, Pullman JL, Colligan BM, Whiteley LO, Carter HW. Clin. Cancer Res. 1997;3:1479. [PubMed] [Google Scholar]
- 627.Rogers MS, Baron AJ, McPherson MJ, Knowles PF, Dooley DM. J. Am. Chem. Soc. 2000;122:990. [Google Scholar]
- 628.Thomas F. Eur. J. Inorg. Chem. 2007:2379. [Google Scholar]
- 629.Himo F, Eriksson LA, Maseras F, Siegbahn PEM. J. Am. Chem. Soc. 2000;122:8031. [Google Scholar]
- 630.Rokhsana D, Dooley DM, Szilagyi RK. Journal of Biological Inorganic Chemistry. 2008;13:371. doi: 10.1007/s00775-007-0325-8. [DOI] [PubMed] [Google Scholar]
- 631.Halfen JA, Jazdzewski BA, Mahapatra S, Berreau LM, Wilkinson EC, Que L, Jr, Tolman WB. J. Am. Chem. Soc. 1997;119:8217. [Google Scholar]
- 632.Wang Y, DuBois JL, Hedman B, Hodgson KO, Stack TDP. Science. 1998;279:537. doi: 10.1126/science.279.5350.537. [DOI] [PubMed] [Google Scholar]
- 633.Sokolowski A, Leutbecher H, Weyhermüller T, Schnepf R, Bothe E, Bill E, Hildebrandt P, Wieghardt K. JBIC. 1997;2:444. [Google Scholar]
- 634.Whittaker MM, Whittaker JW. Journal of Biological Chemistry. 1988;263:6074. [PubMed] [Google Scholar]
- 635.Kwiatkowski LD, Adelman M, Pennelly R, Kosman DJ. J. Inorg. Biochem. 1981;14:209. doi: 10.1016/s0162-0134(00)80001-x. [DOI] [PubMed] [Google Scholar]
- 636.Rogers MS, Hurtado-Guerrero R, Firbank SJ, Halcrow MA, Dooley DM, Phillips SEV, Knowles PF, McPherson MJ. Biochemistry. 2008;47:10428. doi: 10.1021/bi8010835. [DOI] [PMC free article] [PubMed] [Google Scholar]
- 637.Whittaker JW, Whittaker MM. Pure & Appl. Chem. 1998;70:903. [Google Scholar]
- 638.Firbank SJ, Rogers MS, Wilmot CM, Dooley DM, Halcrow MA, Knowles PF, McPherson MJ, Phillips SEV. Proceedings Of The National Academy Of Sciences Of The United States Of America. 2001;98:12932. doi: 10.1073/pnas.231463798. [DOI] [PMC free article] [PubMed] [Google Scholar]
- 639.Whittaker MM, Whittaker JW. J. Biol. Chem. 2003;278:22090. doi: 10.1074/jbc.M300112200. [DOI] [PubMed] [Google Scholar]
- 640.Whittaker MM, Whittaker JW. Journal of Biological Chemistry. 2003;278:22090. doi: 10.1074/jbc.M300112200. [DOI] [PubMed] [Google Scholar]
- 641.Rogers MS, Tyler EM, Akyumani N, Kurtis CR, Spooner RK, Deacon SE, Tamber S, Firbank SJ, Mahmoud K, Knowles PF, Phillips SEV, McPherson MJ, Dooley DM. Biochemistry. 2007;46:4606. doi: 10.1021/bi062139d. [DOI] [PMC free article] [PubMed] [Google Scholar]
- 642.Deacon SE, Mahmoud K, Spooner RK, Firbank SJ, Knowles PF, Phillips SEV, McPherson MJ. Chembiochem. 2004;5:972. doi: 10.1002/cbic.200300810. [DOI] [PubMed] [Google Scholar]
- 643.Wilkinson D, Akumanyi N, Hurtado-Guerrero R, Dawkes H, Knowles PF, Phillips SEV, McPherson MJ. Protein Eng. Des. Sel. 2004;17:141. doi: 10.1093/protein/gzh018. [DOI] [PubMed] [Google Scholar]
- 644.Ito N, Phillips SEV, Stevens C, Ogel ZB, McPherson MJ, Keen JN, Yadav KDS, Knowles PF. Nature. 1991;350:87. doi: 10.1038/350087a0. [DOI] [PubMed] [Google Scholar]
- 645.Liu HB, Zhu HN, Eggers DK, Nersissian AM, Faull KF, Goto JJ, Ai JY, Sanders-Loehr J, Gralla EB, Valentine JS. Biochemistry. 2000;39:8125. doi: 10.1021/bi000846f. [DOI] [PubMed] [Google Scholar]
- 646.van Amsterdam IMC, Ubbink M, van den Bosch M, Rotsaert F, Sanders-Loehr J, Canters GW. Journal of Biological Chemistry. 2002;277:44121. doi: 10.1074/jbc.M202977200. [DOI] [PubMed] [Google Scholar]
- 647.McGlashen ML, Eads DD, Spiro TG, Whittaker JW. J. Phys. Chem. 1995;99:4918. [Google Scholar]
- 648.Rokhsana D, Dooley DM, Szilagyi RK. J. Am. Chem. Soc. 2006;128:15550. doi: 10.1021/ja062702f. [DOI] [PubMed] [Google Scholar]
- 649.Olah GA. Angew. Chem. Int. Ed. 2005;44:2636. doi: 10.1002/anie.200462121. [DOI] [PubMed] [Google Scholar]
- 650.Tol RJ, Heintz R, Lammers PM. Climatic Change. 2003;57:71. [Google Scholar]
- 651.Hanson RS, Hanson TE. Microbiol. Rev. 1996;60:439. doi: 10.1128/mr.60.2.439-471.1996. [DOI] [PMC free article] [PubMed] [Google Scholar]
- 652.Park S, Brown KW, Thomas JC. Waste Management & Research. 2002;20:434. doi: 10.1177/0734242X0202000507. [DOI] [PubMed] [Google Scholar]
- 653.Lontoh S, Semrau JD. Appl. Environ. Microbiol. 1998;64:1106. doi: 10.1128/aem.64.3.1106-1114.1998. [DOI] [PMC free article] [PubMed] [Google Scholar]
- 654.Sullivan JP, Dickinson D, Chase HA. Crit. Rev. Microbiol. 1998;24:335. doi: 10.1080/10408419891294217. [DOI] [PubMed] [Google Scholar]
- 655.Merkx M, Kopp DA, Sazinsky MH, Blazyk JL, Muller J, Lippard SJ. Angew. Chem. Int. Ed. 2001;40:2782. doi: 10.1002/1521-3773(20010803)40:15<2782::AID-ANIE2782>3.0.CO;2-P. [DOI] [PubMed] [Google Scholar]
- 656.Lieberman RL, Rosenzweig AC. Crit. Rev. Biochem. Mol. Biol. 2004;39:147. doi: 10.1080/10409230490475507. [DOI] [PubMed] [Google Scholar]
- 657.Balasubramanian R, Rosenzweig AC. Acc. Chem. Res. 2007;40:573. doi: 10.1021/ar700004s. [DOI] [PubMed] [Google Scholar]
- 658.Hakemian AS, Kondapalli KC, Telser J, Hoffman BM, Stemmler TL, Rosenzweig AC. Biochemistry. 2008;47:6793. doi: 10.1021/bi800598h. [DOI] [PMC free article] [PubMed] [Google Scholar]
- 659.Balasubramanian R, Smith SM, Rawat S, Yatsunyk LA, Stemmler TL, Rosenzweig AC. Nature. 2010;465:115. doi: 10.1038/nature08992. [DOI] [PMC free article] [PubMed] [Google Scholar]
- 660.Holmes AJ, Costello A, Lidstrom ME, Murrell JC. FEMS Microbiol. Lett. 1995;132:203. doi: 10.1016/0378-1097(95)00311-r. [DOI] [PubMed] [Google Scholar]
- 661.Arp DJ, Sayavedra-Soto LA, Hommes NG. Arch. Microbiol. 2002;178:250. doi: 10.1007/s00203-002-0452-0. [DOI] [PubMed] [Google Scholar]
- 662.Bedard C, Knowles R. Microbiol Rev. 1989;53:68. doi: 10.1128/mr.53.1.68-84.1989. [DOI] [PMC free article] [PubMed] [Google Scholar]
- 663.Ensign SA, Hyman MR, Arp DJ. J. Bacteriol. 1993;175:1971. doi: 10.1128/jb.175.7.1971-1980.1993. [DOI] [PMC free article] [PubMed] [Google Scholar]
- 664.Zahn JA, Arciero DM, Hooper AB, DiSpirito AA. FEBS Lett. 1996;397:35. doi: 10.1016/s0014-5793(96)01116-7. [DOI] [PubMed] [Google Scholar]
- 665.Gilch S, Meyer O, Schmidt I. BioMetals. 2010;23:613. doi: 10.1007/s10534-010-9308-2. [DOI] [PubMed] [Google Scholar]
- 666.Dumont MG, Murrell JC. Methods Enzymol. 2005;397:413. doi: 10.1016/S0076-6879(05)97025-0. [DOI] [PubMed] [Google Scholar]
- 667.Trotsenko Y, Khmelenina V. Arch. Microbiol. 2002;177:123. doi: 10.1007/s00203-001-0368-0. [DOI] [PubMed] [Google Scholar]
- 668.Stanley SH, Prior SD, Leak DJ, Dalton H. Biotechnol. Lett. 1983;5:487. [Google Scholar]
- 669.Prior SD, Dalton H. J. Gen. Microbiol. 1985;131:155. [Google Scholar]
- 670.Choi DW, Kunz RC, Boyd ES, Semrau JD, Antholine WE, Han JI, Zahn JA, Boyd JM, de lMAM, DiSpirito AA. J. Bacteriol. 2003;185:5755. doi: 10.1128/JB.185.19.5755-5764.2003. [DOI] [PMC free article] [PubMed] [Google Scholar]
- 671.Theisen AR, Ali MH, Radajewski S, Dumont MG, Dunfield PF, McDonald IR, Dedysh SN, Miguez CB, Murrell JC. Mol. Microbiol. 2005;58:682. doi: 10.1111/j.1365-2958.2005.04861.x. [DOI] [PubMed] [Google Scholar]
- 672.Ali H, Murrell JC. Microbiology (Reading. U. K.) 2009;155:761. doi: 10.1099/mic.0.021816-0. [DOI] [PubMed] [Google Scholar]
- 673.Fitch MW, Graham DW, Arnold RG, Agarwal SK, Phelps P, Speitel GE, Jr, Georgiou G. Appl. Environ. Microbiol. 1993;59:2771. doi: 10.1128/aem.59.9.2771-2776.1993. [DOI] [PMC free article] [PubMed] [Google Scholar]
- 674.Phelps PA, Agarwal SK, Speitel GE, Jr, Georgiou G. Appl. Environ. Microbiol. 1992;58:3701. doi: 10.1128/aem.58.11.3701-3708.1992. [DOI] [PMC free article] [PubMed] [Google Scholar]
- 675.Zahn JA, DiSpirito AA. J. Bacteriol. 1996;178:1018. doi: 10.1128/jb.178.4.1018-1029.1996. [DOI] [PMC free article] [PubMed] [Google Scholar]
- 676.DiSpirito AA, Zahn JA, Graham DW, Kim HJ, Larive CK, Derrick TS, Cox CD, Taylor A. J. Bacteriol. 1998;180:3606. doi: 10.1128/jb.180.14.3606-3613.1998. [DOI] [PMC free article] [PubMed] [Google Scholar]
- 677.Tellez CM, Gaus KP, Graham DW, Arnold RG, Guzman RZ. Appl. Environ. Microbiol. 1998;64:1115. doi: 10.1128/aem.64.3.1115-1122.1998. [DOI] [PMC free article] [PubMed] [Google Scholar]
- 678.Kim HJ, Galeva N, Larive CK, Alterman M, Graham DW. Biochemistry. 2005;44:5140. doi: 10.1021/bi047367r. [DOI] [PubMed] [Google Scholar]
- 679.Choi DW, Zea CJ, Do YS, Semrau JD, Antholine WE, Hargrove MS, Pohl NL, Boyd ES, Geesey GG, Hartsel SC, Shafe PH, McEllistrem MT, Kisting CJ, Campbell D, Rao V, De lMAM, DiSpirito AA. Biochemistry. 2006;45:1442. doi: 10.1021/bi051815t. [DOI] [PubMed] [Google Scholar]
- 680.Hakemian AS, Tinberg CE, Kondapalli KC, Telser J, Hoffman BM, Stemmler TL, Rosenzweig AC. J. Am. Chem. Soc. 2005;127:17142. doi: 10.1021/ja0558140. [DOI] [PMC free article] [PubMed] [Google Scholar]
- 681.Kim HJ, Graham DW, DiSpirito AA, Alterman MA, Galeva N, Larive CK, Asunskis D, Sherwood PMA. Science (Washington, DC, U. S.) 2004;305:1612. doi: 10.1126/science.1098322. [DOI] [PubMed] [Google Scholar]
- 682.Choi DW, Antholine WE, Do YS, Semrau JD, Kisting CJ, Kunz RC, Campbell D, Rao V, Hartsel SC, DiSpirito AA. Microbiology (Reading,U. K.) 2005;151:3417. doi: 10.1099/mic.0.28169-0. [DOI] [PubMed] [Google Scholar]
- 683.Krentz BD, Mulheron HJ, Semrau JD, DiSpirito AA, Bandow NL, Haft DH, Vuilleumier S, Murrell JC, McEllistrem MT, Hartsel SC, Gallagher WH. Biochemistry. 2010;49:10117. doi: 10.1021/bi1014375. [DOI] [PMC free article] [PubMed] [Google Scholar]
- 684.El GA, Basle A, Firbank SJ, Knapp CW, Gray J, Graham DW, Dennison C. Inorg. Chem. (Washington, DC, U. S.) 2011;50:1378. doi: 10.1021/ic101965j. [DOI] [PubMed] [Google Scholar]
- 685.Lieberman RL, Rosenzweig AC. Nature. 2005;434:177. doi: 10.1038/nature03311. [DOI] [PubMed] [Google Scholar]
- 686.Culpepper MA, Rosenzweig AC. Crit. Rev. Biochem. Mol. Biol. 2012;47:483. doi: 10.3109/10409238.2012.697865. [DOI] [PMC free article] [PubMed] [Google Scholar]
- 687.Burrows KJ, Cornish A, Scott D, Higgins IJ. J. Gen. Microbiol. 1984;130:3327. [Google Scholar]
- 688.Smith DDS, Dalton H. Eur. J. Biochem. 1989;182:667. doi: 10.1111/j.1432-1033.1989.tb14877.x. [DOI] [PubMed] [Google Scholar]
- 689.Nguyen H-HT, Nakagawa KH, Hedman B, Elliott SJ, Lidstrom ME, Hodgson KO, Chan SI. J. Am. Chem. Soc. 1996;118:12766. [Google Scholar]
- 690.Elliott SJ, Zhu M, Tso L, Nguyen HHT, Yip JHK, Chan SI. J. Am. Chem. Soc. 1997;119:9949. [Google Scholar]
- 691.Miyaji A, Miyoshi T, Motokura K, Baba T. Biotechnol. Lett. 2011;33:2241. doi: 10.1007/s10529-011-0688-3. [DOI] [PubMed] [Google Scholar]
- 692.Baik MH, Newcomb M, Friesner RA, Lippard SJ. Chem. Rev. (Washington, DC, U. S.) 2003;103:2385. doi: 10.1021/cr950244f. [DOI] [PubMed] [Google Scholar]
- 693.Hakemian AS, Rosenzweig AC. Annu. Rev. Biochem. 2007;76:223. doi: 10.1146/annurev.biochem.76.061505.175355. [DOI] [PubMed] [Google Scholar]
- 694.Basu P, Katterle B, Andersson KK, Dalton H. Biochem. J. 2003;369:417. doi: 10.1042/BJ20020823. [DOI] [PMC free article] [PubMed] [Google Scholar]
- 695.Lieberman RL, Shrestha DB, Doan PE, Hoffman BM, Stemmler TL, Rosenzweig AC. Proc. Natl. Acad. Sci. U. S. A. 2003;100:3820. doi: 10.1073/pnas.0536703100. [DOI] [PMC free article] [PubMed] [Google Scholar]
- 696.Shiemke AK, Cook SA, Miley T, Singleton P. Arch. Biochem. Biophys. 1995;321:421. doi: 10.1006/abbi.1995.1413. [DOI] [PubMed] [Google Scholar]
- 697.Yu SSF, Wu LY, Chen KHC, Luo WI, Huang DS, Chan SI. J. Biol. Chem. 2003;278:40658. doi: 10.1074/jbc.M301018200. [DOI] [PubMed] [Google Scholar]
- 698.Wilkinson B, Zhu M, Priestley ND, Nguyen HHT, Morimoto H, Williams PG, Chan SI, Floss HG. J. Am. Chem. Soc. 1996;118:921. [Google Scholar]
- 699.Ng KY, Tu LC, Wang YS, Chan SI, Yu SSF. Chembiochem. 2008;9:1116. doi: 10.1002/cbic.200700628. [DOI] [PubMed] [Google Scholar]
- 700.Huang DS, Wu SH, Wang YS, Yu SSF, Chan SI. Chembiochem. 2002;3:760. doi: 10.1002/1439-7633(20020802)3:8<760::AID-CBIC760>3.0.CO;2-K. [DOI] [PubMed] [Google Scholar]
- 701.Chan SI, Yu SSF. Acc. Chem. Res. 2008;41:969. doi: 10.1021/ar700277n. [DOI] [PubMed] [Google Scholar]
- 702.Chan SI, Wang VCC, Lai JCH, Yu SSF, Chen PPY, Chen KHC, Chen CL, Chan MK. Angew. Chem. Int. Ed. 2007;46:1992. [Google Scholar]
- 703.Smith SM, Rawat S, Telser J, Hoffman BM, Stemmler TL, Rosenzweig AC. Biochemistry. 2011;50:10231. doi: 10.1021/bi200801z. [DOI] [PMC free article] [PubMed] [Google Scholar]
- 704.Maneg O, Malatesta F, Ludwig B, Drosou V. Biochimica et Biophysica Acta (BBA) - Bioenergetics. 2004;1655:274. doi: 10.1016/j.bbabio.2003.10.010. [DOI] [PubMed] [Google Scholar]
- 705.Behling LA, Hartsel SC, Lewis DE, DiSpirito AA, Choi DW, Masterson LR, Veglia G, Gallagher WH. J. Am. Chem. Soc. 2008;130:12604. doi: 10.1021/ja804747d. [DOI] [PMC free article] [PubMed] [Google Scholar]
- 706.Choi DW, Bandow NL, McEllistrem MT, Semrau JD, Antholine WE, Hartsel SC, Gallagher W, Zea CJ, Pohl NL, Zahn JA, DiSpirito AA. J. Inorg. Biochem. 2010;104:1240. doi: 10.1016/j.jinorgbio.2010.08.002. [DOI] [PubMed] [Google Scholar]
- 707.Choi DW, Do YS, Zea CJ, McEllistrem MT, Lee SW, Semrau JD, Pohl NL, Kisting CJ, Scardino LL, Hartsel SC, Boyd ES, Geesey GG, Riedel TP, Shafe PH, Kranski KA, Tritsch JR, Antholine WE, DiSpirito AA. J. Inorg. Biochem. 2006;100:2150. doi: 10.1016/j.jinorgbio.2006.08.017. [DOI] [PubMed] [Google Scholar]
- 708.Hung SC, Chen CL, Chen KHC, Yu SSF, Chan SI. J. Chin. Chem. Soc. (Taipei, Taiwan) 2004;51:1229. [Google Scholar]
- 709.Chen KHC, Chen CL, Tseng CF, Yu SSF, Ke SC, Lee JF, Nguyen HT, Elliott SJ, Alben JO, Chan SI. J. Chin. Chem. Soc. (Taipei, Taiwan) 2004;51:1081. [Google Scholar]
- 710.Lemos SS, Collins MLP, Eaton SS, Eaton GR, Antholine WE. Biophys. J. 2000;79:1085. doi: 10.1016/s0006-3495(00)76362-4. [DOI] [PMC free article] [PubMed] [Google Scholar]
- 711.Yuan H, Collins MLP, Antholine WE. J. Am. Chem. Soc. 1997;119:5073. [Google Scholar]
- 712.Yuan H, Collins MLP, Antholine WE. J. Inorg. Biochem. 1998;72:179. doi: 10.1016/s0162-0134(98)10078-8. [DOI] [PubMed] [Google Scholar]
- 713.Martinho M, Choi DW, DiSpirito AA, Antholine WE, Semrau JD, Muenck E. J. Am. Chem. Soc. 2007;129:15783. doi: 10.1021/ja077682b. [DOI] [PMC free article] [PubMed] [Google Scholar]
- 714.Lieberman RL, Kondapalli KC, Shrestha DB, Hakemian AS, Smith SM, Telser J, Kuzelka J, Gupta R, Borovik AS, Lippard SJ, Hoffman BM, Rosenzweig AC, Stemmler TL. Inorg. Chem. 2006;45:8372. doi: 10.1021/ic060739v. [DOI] [PMC free article] [PubMed] [Google Scholar]
- 715.Hwang HJ, Lu Y. Proc. Natl. Acad. Sci. U. S. A. 2004;101:12842. doi: 10.1073/pnas.0403473101. [DOI] [PMC free article] [PubMed] [Google Scholar]
- 716.Xie XJ, Gorelsky SI, Sarangi R, Garner DK, Hwang HJ, Hodgsont KO, Hedman B, Lu Y, Solornon EI. J. Am. Chem. Soc. 2008;130:5194. doi: 10.1021/ja7102668. [DOI] [PubMed] [Google Scholar]
- 717.Culpepper MA, Cutsail GE, Hoffman BM, Rosenzweig AC. J. Am. Chem. Soc. 2012;134:7640. doi: 10.1021/ja302195p. [DOI] [PMC free article] [PubMed] [Google Scholar]
- 718.Smeets PJ, Hadt RG, Woertink JS, Vanelderen P, Schoonheydt RA, Sels BF, Solomon EI. J. Am. Chem. Soc. 2010;132:14736. doi: 10.1021/ja106283u. [DOI] [PMC free article] [PubMed] [Google Scholar]
- 719.Shiota Y, Yoshizawa K. Inorganic Chemistry. 2009;48:838. doi: 10.1021/ic8003933. [DOI] [PubMed] [Google Scholar]
- 720.Chen PPY, Chan SI. J. Inorg. Biochem. 2006;100:801. doi: 10.1016/j.jinorgbio.2005.12.014. [DOI] [PubMed] [Google Scholar]
- 721.Yoshizawa K, Suzuki A, Shiota Y, Yamabe T. Bull. Chem. Soc. Jpn. 2000;73:815. [Google Scholar]
- 722.Nagababu P, Maji S, Kumar MP, Chen PPY, Yu SSF, Chan SI. Adv. Synth. Catal. 2012;354:3275. [Google Scholar]
- 723.Chan SI, Chien CYC, Yu CSC, Nagababu P, Maji S, Chen PPY. J. Catal. 2012;293:186. [Google Scholar]
- 724.Chan SI, Lu YJ, Nagababu P, Maji S, Hung MC, Lee MM, Hsu IJ, Minh PD, Lai JCH, Ng KY, Ramalingam S, Yu SSF, Chan MK. Angew. Chem. Int. Ed. 2013;52:3731. doi: 10.1002/anie.201209846. [DOI] [PubMed] [Google Scholar]
- 725.Groothaert MH, Smeets PJ, Sels BF, Jacobs PA, Schoonheydt RA. J. Am. Chem. Soc. 2005;127:1394. doi: 10.1021/ja047158u. [DOI] [PubMed] [Google Scholar]
- 726.Smeets PJ, Groothaert MH, Schoonheydt RA. Catal. Today. 2005;110:303. [Google Scholar]
- 727.Smeets PJ, Woertink JS, Sels BF, Solomon EI, Schoonheydt RA. Inorganic Chemistry. 2010;49:3573. doi: 10.1021/ic901814f. [DOI] [PMC free article] [PubMed] [Google Scholar]
- 728.Groothaert MH, Van BJA, Battiston AA, Weckhuysen BM, Schoonheydt RA. J. Am. Chem. Soc. 2003;125:7629. doi: 10.1021/ja029684w. [DOI] [PubMed] [Google Scholar]
- 729.Decker A, Clay MD, Solomon EI. J. Inorg. Biochem. 2006;100:697. doi: 10.1016/j.jinorgbio.2006.01.013. [DOI] [PubMed] [Google Scholar]
- 730.Solomon EI, Sundaram UM, Machonkin TE. Chem. Rev. 1996;96:2563. doi: 10.1021/cr950046o. [DOI] [PubMed] [Google Scholar]
- 731.Bertrand T, Jolivalt C, Briozzo P, Caminade E, Joly N, Madzak C, Mougin C. Biochemistry. 2002;41:7325. doi: 10.1021/bi0201318. [DOI] [PubMed] [Google Scholar]
- 732.Enguita FJ, Marcal D, Martins LO, Grenha R, Henriques AO, Lindley PF, Carrondo MA. Journal of Biological Chemistry. 2004;279:23472. doi: 10.1074/jbc.M314000200. [DOI] [PubMed] [Google Scholar]
- 733.Taylor AB, Stoj CS, Ziegler L, Kosman DJ, Hart PJ. Proceedings of the National Academy of Sciences of the United States of America. 2005;102:15459. doi: 10.1073/pnas.0506227102. [DOI] [PMC free article] [PubMed] [Google Scholar]
- 734.Bento I, Peixoto C, Zaitsev VN, Lindley PF. Acta Crystallogr. Sect. DBiol. Crystallogr. 2007;63:240. doi: 10.1107/S090744490604947X. [DOI] [PMC free article] [PubMed] [Google Scholar]
- 735.Kallio JP, Auer S, Janis J, Andberg M, Kruus K, Rouvinen J, Koivula A, Hakulinen N. J. Mol. Biol. 2009;392:895. doi: 10.1016/j.jmb.2009.06.053. [DOI] [PubMed] [Google Scholar]
- 736.Dayan J, Dawson CR. Biochem. Biophys. Res. Commun. 1976;73:451. doi: 10.1016/0006-291x(76)90728-2. [DOI] [PubMed] [Google Scholar]
- 737.Tanaka N, Murao S. Agricultural and Biological Chemistry. 1983;47:1627. [Google Scholar]
- 738.Huettermann A, Mai C, Kharazipour A. Appl. Microbiol. Biotechnol. 2001;55:387. doi: 10.1007/s002530000590. [DOI] [PubMed] [Google Scholar]
- 739.Sterjiades R, Dean JFD, Eriksson KEL. Plant Physiol. 1992;99:1162. doi: 10.1104/pp.99.3.1162. [DOI] [PMC free article] [PubMed] [Google Scholar]
- 740.Pourcel L, Routaboul JM, Kerhoas L, Caboche M, Lepiniec L, Debeaujon I. Plant Cell. 2005;17:2966. doi: 10.1105/tpc.105.035154. [DOI] [PMC free article] [PubMed] [Google Scholar]
- 741.Ranocha P, Chabannes M, Chamayou S, Danoun S, Jauneau A, Boudet AM, Goffner D. Plant Physiol. 2002;129:145. doi: 10.1104/pp.010988. [DOI] [PMC free article] [PubMed] [Google Scholar]
- 742.Bermek H, Li KC, Eriksson KEL. J. Biotechnol. 1998;66:117. [Google Scholar]
- 743.Claus H. Micron. 2004;35:93. doi: 10.1016/j.micron.2003.10.029. [DOI] [PubMed] [Google Scholar]
- 744.Hullo MF, Moszer I, Danchin A, Martin-Verstraete I. J. Bacteriol. 2001;183:5426. doi: 10.1128/JB.183.18.5426-5430.2001. [DOI] [PMC free article] [PubMed] [Google Scholar]
- 745.McKenney PT, Driks A, Eichenberger P. Nature Reviews Microbiology. 2013;11:33. doi: 10.1038/nrmicro2921. [DOI] [PMC free article] [PubMed] [Google Scholar]
- 746.Arakane Y, Muthukrishnan S, Beeman RW, Kanost MR, Kramer KJ. Proceedings of the National Academy of Sciences of the United States of America. 2005;102:11337. doi: 10.1073/pnas.0504982102. [DOI] [PMC free article] [PubMed] [Google Scholar]
- 747.Mertz D. American Journal of Botany. 1961;48:405. [Google Scholar]
- 748.Potters G, De Gara L, Asard H, Horemans N. Plant Physiol. Biochem. 2002;40:537. [Google Scholar]
- 749.Felton GW, Summers CB. J. Chem. Ecol. 1993;19:1553. doi: 10.1007/BF00984896. [DOI] [PubMed] [Google Scholar]
- 750.De Tullio MC, Liso R, Arrigoni O. Biologia Plantarum. 2004;48:161. [Google Scholar]
- 751.Sakasegawa S, Ishikawa H, Imamura S, Sakuraba H, Goda S, Ohshima T. Appl. Environ. Microbiol. 2006;72:972. doi: 10.1128/AEM.72.1.972-975.2006. [DOI] [PMC free article] [PubMed] [Google Scholar]
- 752.Kwok EY, Severance S, Kosman DJ. Biochemistry. 2006;45:6317. doi: 10.1021/bi052173c. [DOI] [PubMed] [Google Scholar]
- 753.Stoj CS, Augustine AJ, Solomon EI, Kosman DJ. Journal of Biological Chemistry. 2007;282:7862. doi: 10.1074/jbc.M609766200. [DOI] [PubMed] [Google Scholar]
- 754.Rensing C, Grass G. Fems Microbiology Reviews. 2003;27:197. doi: 10.1016/S0168-6445(03)00049-4. [DOI] [PubMed] [Google Scholar]
- 755.Tree JJ, Kidd SP, Jennings MP, McEwan AG. Biochem. Biophys. Res. Commun. 2005;328:1205. doi: 10.1016/j.bbrc.2005.01.084. [DOI] [PubMed] [Google Scholar]
- 756.Dick GJ, Torpey JW, Beveridge TJ, Tebo BA. Appl. Environ. Microbiol. 2008;74:1527. doi: 10.1128/AEM.01240-07. [DOI] [PMC free article] [PubMed] [Google Scholar]
- 757.Hilden K, Hakala TK, Lundell T. Biotechnol. Lett. 2009;31:1117. doi: 10.1007/s10529-009-9998-0. [DOI] [PubMed] [Google Scholar]
- 758.Witayakran S, Ragauskas AJ. Adv. Synth. Catal. 2009;351:1187. [Google Scholar]
- 759.Kunamneni A, Plou FJ, Ballesteros A, Alcalde M. Recent patents on biotechnology. 2008;2:10. doi: 10.2174/187220808783330965. [DOI] [PubMed] [Google Scholar]
- 760.Arora DS, Sharma RK. Appl. Biochem. Biotechnol. 2010;160:1760. doi: 10.1007/s12010-009-8676-y. [DOI] [PubMed] [Google Scholar]
- 761.Rodgers CJ, Blanford CF, Giddens SR, Skamnioti P, Armstrong FA, Gurr SJ. Trends Biotechnol. 2010;28:63. doi: 10.1016/j.tibtech.2009.11.001. [DOI] [PubMed] [Google Scholar]
- 762.Calvo AM, Copa-Patino JL, Alonso O, Gonzalez AE. Arch. Microbiol. 1998;171:31. doi: 10.1007/s002030050674. [DOI] [PubMed] [Google Scholar]
- 763.Galhaup C, Goller S, Peterbauer CK, Strauss J, Haltrich D. Microbiology- (UK) 2002;148:2159. doi: 10.1099/00221287-148-7-2159. [DOI] [PubMed] [Google Scholar]
- 764.Kiiskinen LL, Viikari L, Kruus K. Appl. Microbiol. Biotechnol. 2002;59:198. doi: 10.1007/s00253-002-1012-x. [DOI] [PubMed] [Google Scholar]
- 765.Chefetz B, Chen Y, Hadar Y. Appl. Environ. Microbiol. 1998;64:3175. doi: 10.1128/aem.64.9.3175-3179.1998. [DOI] [PMC free article] [PubMed] [Google Scholar]
- 766.Gunther H, Perner B, Gramss G. J. Basic Microbiol. 1998;38:197. [Google Scholar]
- 767.Dittmer JK, Patel NJ, Dhawale SW, Dhawale SS. FEMS Microbiol. Lett. 1997;149:65. [Google Scholar]
- 768.Ander P, Eriksson KE. Arch. Microbiol. 1976;109:1. [Google Scholar]
- 769.Morozova V, Shumakovich GP, Gorbacheva MA, Shleev SV, Yaropolov AI. Biochem.-Moscow. 2007;72:1136. doi: 10.1134/s0006297907100112. [DOI] [PubMed] [Google Scholar]
- 770.Bao W, Omalley DM, Whetten R, Sederoff RR. Science. 1993;260:672. doi: 10.1126/science.260.5108.672. [DOI] [PubMed] [Google Scholar]
- 771.Bligny R, Douce R. Biochem. J. 1983;209:489. doi: 10.1042/bj2090489. [DOI] [PMC free article] [PubMed] [Google Scholar]
- 772.LaFayette PR, Eriksson KEL, Dean JFD. Plant Mol.Biol. 1999;40:23. doi: 10.1023/a:1026437406859. [DOI] [PubMed] [Google Scholar]
- 773.Omura T. J. Biochem. 1961;50:264. doi: 10.1093/oxfordjournals.jbchem.a127442. [DOI] [PubMed] [Google Scholar]
- 774.McCaig BC, Meagher RB, Dean JFD. Planta. 2005;221:619. doi: 10.1007/s00425-004-1472-6. [DOI] [PubMed] [Google Scholar]
- 775.Nakamura W. J. Biochem. 1967;62:54. doi: 10.1093/oxfordjournals.jbchem.a128635. [DOI] [PubMed] [Google Scholar]
- 776.Weng JK, Chapple C. New Phytol. 2010;187:273. doi: 10.1111/j.1469-8137.2010.03327.x. [DOI] [PubMed] [Google Scholar]
- 777.Hoopes JT, Dean JFD. Plant Physiol. Biochem. 2004;42:27. doi: 10.1016/j.plaphy.2003.10.011. [DOI] [PubMed] [Google Scholar]
- 778.Givaudan A, Effosse A, Faure D, Potier P, Bouillant ML, Bally R. FEMS Microbiol. Lett. 1993;108:205. [Google Scholar]
- 779.Sharma P, Goel R, Capalash N. World Journal of Microbiology & Biotechnology. 2007;23:823. doi: 10.1007/BF01201886. [DOI] [PubMed] [Google Scholar]
- 780.Uthandi S, Saad B, Humbard MA, Maupin-Furlow JA. Appl. Environ. Microbiol. 2010;76:733. doi: 10.1128/AEM.01757-09. [DOI] [PMC free article] [PubMed] [Google Scholar]
- 781.Hoegger PJ, Kilaru S, James TY, Thacker JR, Kues U. Febs Journal. 2006;273:2308. doi: 10.1111/j.1742-4658.2006.05247.x. [DOI] [PubMed] [Google Scholar]
- 782.Sharma KK, Kuhad RC. Indian Journal of Microbiology. 2009;49:142. doi: 10.1007/s12088-009-0039-4. [DOI] [PMC free article] [PubMed] [Google Scholar]
- 783.Ausec L, van Elsas JD, Mandic-Mulec I. Soil Biology & Biochemistry. 2011;43:975. [Google Scholar]
- 784.Skalova T, Dohnalek J, Ostergaard LH, Osteryaard PR, Kolenko P, Duskova J, Stepankova A, Hasek J. J. Mol. Biol. 2009;385:1165. doi: 10.1016/j.jmb.2008.11.024. [DOI] [PubMed] [Google Scholar]
- 785.Endo K, Hosono K, Beppu T, Ueda K. Microbiology-(UK) 2002;148:1767. doi: 10.1099/00221287-148-6-1767. [DOI] [PubMed] [Google Scholar]
- 786.Sandman K, Kroos L, Cutting S, Youngman P, Losick R. J. Mol. Biol. 1988;200:461. doi: 10.1016/0022-2836(88)90536-0. [DOI] [PubMed] [Google Scholar]
- 787.Faure D, Bouillant ML, Bally R. Appl. Environ. Microbiol. 1994;60:3413. doi: 10.1128/aem.60.9.3413-3415.1994. [DOI] [PMC free article] [PubMed] [Google Scholar]
- 788.Whitehead DL, Brunet PCJ, Kent PW. Nature. 1960;185:610. doi: 10.1038/185610a0. [DOI] [PubMed] [Google Scholar]
- 789.Dittmer NT, Kanost MR. Insect Biochemistry and Molecular Biology. 2010;40:179. doi: 10.1016/j.ibmb.2010.02.006. [DOI] [PubMed] [Google Scholar]
- 790.He NJ, Botelho JMC, McNall RJ, Belozerov V, Dunn WA, Mize T, Orlando R, Willis JH. Insect Biochemistry and Molecular Biology. 2007;37:135. doi: 10.1016/j.ibmb.2006.10.011. [DOI] [PubMed] [Google Scholar]
- 791.Niu BL, Shen WF, Liu Y, Weng HB, He LH, Mu JJ, Wu ZL, Jiang P, Tao YZ, Meng ZQ. Insect Molecular Biology. 2008;17:303. doi: 10.1111/j.1365-2583.2008.00803.x. [DOI] [PubMed] [Google Scholar]
- 792.Yatsu J, Asano T. Insect Biochemistry and Molecular Biology. 2009;39:254. doi: 10.1016/j.ibmb.2008.12.005. [DOI] [PubMed] [Google Scholar]
- 793.Dittmer NT, Gorman MJ, Kanost MR. Insect Biochemistry and Molecular Biology. 2009;39:596. doi: 10.1016/j.ibmb.2009.06.006. [DOI] [PMC free article] [PubMed] [Google Scholar]
- 794.Szent-Gyorgyi A. Journal of Biological Chemistry. 1931;90:385. [Google Scholar]
- 795.Meiklejohn GT, Stewart CP. Biochem. J. 1941;35:755. doi: 10.1042/bj0350755. [DOI] [PMC free article] [PubMed] [Google Scholar]
- 796.Messerschmidt A, Rossi A, Ladenstein R, Huber R, Bolognesi M, Gatti G, Marchesini A, Petruzzelli R, Finazziagro A. J. Mol. Biol. 1989;206:513. doi: 10.1016/0022-2836(89)90498-1. [DOI] [PubMed] [Google Scholar]
- 797.Nicolai E, Di Venere A, Rosato N, Rossi A, Agro AF, Mei G. Febs Journal. 2006;273:5194. doi: 10.1111/j.1742-4658.2006.05515.x. [DOI] [PubMed] [Google Scholar]
- 798.Murao S, Itoh H, Yajima T, Ozaki Y, Fukuyasu S, Shin T. Biosci. Biotechnol. Biochem. 1992;56:847. doi: 10.1271/bbb.56.847. [DOI] [PubMed] [Google Scholar]
- 799.Maccarrone M, Dandrea G, Salucci ML, Avigliano L, Finazziagro A. Phytochemistry. 1993;32:795. [Google Scholar]
- 800.Porto TS, Porto CS, Cavalcanti MTH, Lima JL, Perego P, Porto ALF, Converti A, Pessoa A. Biotechnol. Progr. 2006;22:1637. doi: 10.1021/bp0602350. [DOI] [PubMed] [Google Scholar]
- 801.Lin LS, Varner JE. Plant Physiol. 1991;96:159. doi: 10.1104/pp.96.1.159. [DOI] [PMC free article] [PubMed] [Google Scholar]
- 802.Kato N, Esaka M. Physiol. Plant. 1999;105:321. [Google Scholar]
- 803.Sanmartin M, Drogoudi PD, Lyons T, Pateraki I, Barnes J, Kanellis AK. Planta. 2003;216:918. doi: 10.1007/s00425-002-0944-9. [DOI] [PubMed] [Google Scholar]
- 804.Mano N. Appl. Microbiol. Biotechnol. 2012;96:301. doi: 10.1007/s00253-012-4312-9. [DOI] [PubMed] [Google Scholar]
- 805.Shimizu A, Kwon JH, Sasaki T, Satoh T, Sakurai N, Sakurai T, Yamaguchi S, Samejima T. Biochemistry. 1999;38:3034. doi: 10.1021/bi9819531. [DOI] [PubMed] [Google Scholar]
- 806.Kataoka K, Kitagawa R, Inoue M, Naruse D, Sakurai T, Huang HW. Biochemistry. 2005;44:7004. doi: 10.1021/bi0476836. [DOI] [PubMed] [Google Scholar]
- 807.Kataoka K, Tsukamoto K, Kitagawa R, Ito T, Sakurai T. Biochem. Biophys. Res. Commun. 2008;371:416. doi: 10.1016/j.bbrc.2008.04.096. [DOI] [PubMed] [Google Scholar]
- 808.Mizutani K, Toyoda M, Sagara K, Takahashi N, Sato A, Kamitaka Y, Tsujimura S, Nakanishi Y, Sugiura T, Yamaguchi S, Kano K, Mikami B. Acta Crystallographica Section F-Structural Biology and Crystallization Communications. 2010;66:765. doi: 10.1107/S1744309110018828. [DOI] [PMC free article] [PubMed] [Google Scholar]
- 809.Le Roes-Hill M, Goodwin C, Burton S. Trends Biotechnol. 2009;27:248. doi: 10.1016/j.tibtech.2009.01.001. [DOI] [PubMed] [Google Scholar]
- 810.Barry CE, Nayar PG, Begley TP. Biochemistry. 1989;28:6323. doi: 10.1021/bi00441a026. [DOI] [PubMed] [Google Scholar]
- 811.Freeman JC, Nayar PG, Begley TP, Villafranca JJ. Biochemistry. 1993;32:4826. doi: 10.1021/bi00069a018. [DOI] [PubMed] [Google Scholar]
- 812.Mukherjee C, Weyhermuller T, Bothe E, Rentschier E, Chaudhuri P. Inorganic Chemistry. 2007;46:9895. doi: 10.1021/ic7012599. [DOI] [PubMed] [Google Scholar]
- 813.Jones GH. Antimicrob. Agents Chemother. 2000;44:1322. doi: 10.1128/aac.44.5.1322-1327.2000. [DOI] [PMC free article] [PubMed] [Google Scholar]
- 814.Holmberg CG, Laurell CB. Acta Chem. Scand. 1948;2:550. doi: 10.3891/acta.chem.scand.01-0944. [DOI] [PubMed] [Google Scholar]
- 815.Healy J, Tipton K. Journal of Neural Transmission. 2007;114:777. doi: 10.1007/s00702-007-0687-7. [DOI] [PubMed] [Google Scholar]
- 816.Zaitseva I, Zaitsev V, Card G, Moshkov K, Bax B, Ralph A, Lindley P. Journal of Biological Inorganic Chemistry. 1996;1:15. [Google Scholar]
- 817.Osaki S, Johnson DA, Frieden E. Journal of Biological Chemistry. 1966;241:2746. [PubMed] [Google Scholar]
- 818.Roeser HP, Lee GR, Nacht S, Cartwrig Ge. Journal of Clinical Investigation. 1970;49:2408. doi: 10.1172/JCI106460. [DOI] [PMC free article] [PubMed] [Google Scholar]
- 819.Fleming RE, Gitlin JD. Journal of Biological Chemistry. 1990;265:7701. [PubMed] [Google Scholar]
- 820.Klomp LWJ, Farhangrazi ZS, Dugan LL, Gitlin JD. Journal of Clinical Investigation. 1996;98:207. doi: 10.1172/JCI118768. [DOI] [PMC free article] [PubMed] [Google Scholar]
- 821.Syed BA, Beaumont NJ, Patel A, Naylor CE, Bayele HK, Joannou CL, Rowe PSN, Evans RW, Srai SKS. Protein Eng. 2002;15:205. doi: 10.1093/protein/15.3.205. [DOI] [PubMed] [Google Scholar]
- 822.Vulpe CD, Kuo YM, Murphy TL, Cowley L, Askwith C, Libina N, Gitschier J, Anderson GJ. Nature Genetics. 1999;21:195. doi: 10.1038/5979. [DOI] [PubMed] [Google Scholar]
- 823.Griffiths TAM, Mauk AG, MacGillivray RTA. Biochemistry. 2005;44:14725. doi: 10.1021/bi051559k. [DOI] [PubMed] [Google Scholar]
- 824.Frazer DM, Vulpe CD, McKie AT, Wilkins SJ, Trinder D, Cleghorn GJ, Anderson GJ. American Journal of Physiology-Gastrointestinal and Liver Physiology. 2001;281:G931. doi: 10.1152/ajpgi.2001.281.4.G931. [DOI] [PubMed] [Google Scholar]
- 825.Brookes MJ, Hughes S, Turner FE, Reynolds G, Sharma N, Ismail T, Berx G, McKie AT, Hotchin N, Anderson GJ, Iqbal T, Tselepis C. Gut. 2006;55:1449. doi: 10.1136/gut.2006.094060. [DOI] [PMC free article] [PubMed] [Google Scholar]
- 826.Qian ZM, Chang YZ, Zhu L, Yang L, Du JR, Ho KP, Wang Q, Li LZ, Wang CY, Ge X, Jing NL, Li L, Ke Y. J. Cell. Biochem. 2007;102:1225. doi: 10.1002/jcb.21352. [DOI] [PubMed] [Google Scholar]
- 827.Han O, Kim EY. J. Cell. Biochem. 2007;101:1000. doi: 10.1002/jcb.21392. [DOI] [PubMed] [Google Scholar]
- 828.Hudson DM, Krisinger MJ, Griffiths TAM, MacGillivray RTA. J. Cell. Biochem. 2008;103:1849. doi: 10.1002/jcb.21566. [DOI] [PubMed] [Google Scholar]
- 829.Stuerenburg HJ. Journal of Neural Transmission. 2000;107:321. doi: 10.1007/s007020050026. [DOI] [PubMed] [Google Scholar]
- 830.Hellman NE, Gitlin JD. Annual Review of Nutrition. 2002;22:439. doi: 10.1146/annurev.nutr.22.012502.114457. [DOI] [PubMed] [Google Scholar]
- 831.Texel SJ, Xu XY, Harris ZL. Biochem. Soc. Trans. 2008;36:1277. doi: 10.1042/BST0361277. [DOI] [PubMed] [Google Scholar]
- 832.Shukla N, Maher J, Masters J, D Angelini G, Jeremy JY. Atherosclerosis. 2006;187:238. doi: 10.1016/j.atherosclerosis.2005.11.035. [DOI] [PubMed] [Google Scholar]
- 833.Askwith C, Eide D, Vanho A, Bernard PS, Li LT, Daviskaplan S, Sipe DM, Kaplan J. Cell. 1994;76:403. doi: 10.1016/0092-8674(94)90346-8. [DOI] [PubMed] [Google Scholar]
- 834.Desilva DM, Askwith CC, Eide D, Kaplan J. Journal of Biological Chemistry. 1995;270:1098. doi: 10.1074/jbc.270.3.1098. [DOI] [PubMed] [Google Scholar]
- 835.Kosman DJ. Journal of Biological Chemistry. 2010;285:26729. doi: 10.1074/jbc.R110.113217. [DOI] [PMC free article] [PubMed] [Google Scholar]
- 836.Huston WM, Jennings MP, McEwan AG. Mol. Microbiol. 2002;45:1741. doi: 10.1046/j.1365-2958.2002.03132.x. [DOI] [PubMed] [Google Scholar]
- 837.deSilva D, DavisKaplan S, Fergestad J, Kaplan J. Journal of Biological Chemistry. 1997;272:14208. doi: 10.1074/jbc.272.22.14208. [DOI] [PubMed] [Google Scholar]
- 838.Yuan DS, Stearman R, Dancis A, Dunn T, Beeler T, Klausner RD. Proceedings of the National Academy of Sciences of the United States of America. 1995;92:2632. doi: 10.1073/pnas.92.7.2632. [DOI] [PMC free article] [PubMed] [Google Scholar]
- 839.Hassett RF, Yuan DS, Kosman DJ. Journal of Biological Chemistry. 1998;273:23274. doi: 10.1074/jbc.273.36.23274. [DOI] [PubMed] [Google Scholar]
- 840.Stearman R, Yuan DS, YamaguchiIwai Y, Klausner RD, Dancis A. Science. 1996;271:1552. doi: 10.1126/science.271.5255.1552. [DOI] [PubMed] [Google Scholar]
- 841.Singh A, Severance S, Kaur N, Wiltsie W, Kosman DJ. Journal of Biological Chemistry. 2006;281:13355. doi: 10.1074/jbc.M512042200. [DOI] [PubMed] [Google Scholar]
- 842.Wang TP, Quintanar L, Severance S, Solomon EI, Kosman DJ. Journal of Biological Inorganic Chemistry. 2003;8:611. doi: 10.1007/s00775-003-0456-5. [DOI] [PubMed] [Google Scholar]
- 843.Stoj C, Kosman DJ. Febs Letters. 2003;554:422. doi: 10.1016/s0014-5793(03)01218-3. [DOI] [PubMed] [Google Scholar]
- 844.Roberts SA, Weichsel A, Grass G, Thakali K, Hazzard JT, Tollin G, Rensing C, Montfort WR. Proceedings of the National Academy of Sciences of the United States of America. 2002;99:2766. doi: 10.1073/pnas.052710499. [DOI] [PMC free article] [PubMed] [Google Scholar]
- 845.Roberts SA, Wildner GF, Grass G, Weichsel A, Ambrus A, Rensing C, Montfort WR. Journal of Biological Chemistry. 2003;278:31958. doi: 10.1074/jbc.M302963200. [DOI] [PubMed] [Google Scholar]
- 846.Grass G, Rensing C. Biochem. Biophys. Res. Commun. 2001;286:902. doi: 10.1006/bbrc.2001.5474. [DOI] [PubMed] [Google Scholar]
- 847.Kataoka K, Komori H, Ueki Y, Konno Y, Kamitaka Y, Kurose S, Tsujimura S, Higuchi Y, Kano K, Seo D, Sakurai T. J. Mol. Biol. 2007;373:141. doi: 10.1016/j.jmb.2007.07.041. [DOI] [PubMed] [Google Scholar]
- 848.Djoko KY, Chong LX, Wedd AG, Xiao ZG. J. Am. Chem. Soc. 2010;132:2005. doi: 10.1021/ja9091903. [DOI] [PubMed] [Google Scholar]
- 849.Spiro TG, Bargar JR, Sposito G, Tebo BM. Acc. Chem. Res. 2010;43:2. doi: 10.1021/ar800232a. [DOI] [PubMed] [Google Scholar]
- 850.Johnson KS. Science. 2006;313:1896. doi: 10.1126/science.1133496. [DOI] [PubMed] [Google Scholar]
- 851.Soldatova AV, Butterfield C, Oyerinde OF, Tebo BM, Spiro TG. Journal of Biological Inorganic Chemistry. 2012;17:1151. doi: 10.1007/s00775-012-0928-6. [DOI] [PMC free article] [PubMed] [Google Scholar]
- 852.Petersen LC, Degn H. Biochimica et Biophysica Acta (BBA) - Enzymology. 1978;526:85. doi: 10.1016/0005-2744(78)90292-9. [DOI] [PubMed] [Google Scholar]
- 853.Singh SK, Grass G, Rensing C, Montfort WR. J. Bacteriol. 2004;186:7815. doi: 10.1128/JB.186.22.7815-7817.2004. [DOI] [PMC free article] [PubMed] [Google Scholar]
- 854.Koschorreck K, Richter S, Ene A, Roduner E, Schmid R, Urlacher V. Appl. Microbiol. Biotechnol. 2008;79:217. doi: 10.1007/s00253-008-1417-2. [DOI] [PubMed] [Google Scholar]
- 855.Mohammadian M, Fathi-Roudsari M, Mollania N, Badoei-Dalfard A, Khajeh K. Journal of Industrial Microbiology & Biotechnology. 2010;37:863. doi: 10.1007/s10295-010-0734-5. [DOI] [PubMed] [Google Scholar]
- 856.Agostinelli E, Belli F, Dalla Vedova L, Longu S, Mura A, Floris G. Eur. J. Inorg. Chem. 2005:1635. [Google Scholar]
- 857.Xu F. Biochemistry. 1996;35:7608. doi: 10.1021/bi952971a. [DOI] [PubMed] [Google Scholar]
- 858.Machczynski MC, Vijgenboom E, Samyn B, Canters GW. Protein Sci. 2004;13:2388. doi: 10.1110/ps.04759104. [DOI] [PMC free article] [PubMed] [Google Scholar]
- 859.Tadesse MA, D'Annibale A, Galli C, Gentili P, Sergi F. Organic & Biomolecular Chemistry. 2008;6:868. doi: 10.1039/b716002j. [DOI] [PubMed] [Google Scholar]
- 860.Stoj CS, Augustine AJ, Zeigler L, Solomon EI, Kosman DJ. Biochemistry. 2006;45:12741. doi: 10.1021/bi061543+. [DOI] [PubMed] [Google Scholar]
- 861.Quintanar L, Gebhard M, Wang TP, Kosman DJ, Solomon EI. J. Am. Chem. Soc. 2004;126:6579. doi: 10.1021/ja049220t. [DOI] [PubMed] [Google Scholar]
- 862.Machonkin TE, Quintanar L, Palmer AE, Hassett R, Severance S, Kosman DJ, Solomon EI. J. Am. Chem. Soc. 2001;123:5507. doi: 10.1021/ja003975s. [DOI] [PubMed] [Google Scholar]
- 863.Machonkin TE, Zhang HH, Hedman B, Hodgson KO, Solomon EI. Biochemistry. 1998;37:9570. doi: 10.1021/bi980434v. [DOI] [PubMed] [Google Scholar]
- 864.Andréasson LE, Reinhammar B. Biochimica et Biophysica Acta (BBA) - Enzymology. 1976;445:579. doi: 10.1016/0005-2744(76)90112-1. [DOI] [PubMed] [Google Scholar]
- 865.Andréasson LE, Reinhammar B. Biochimica et Biophysica Acta (BBA) - Enzymology. 1979;568:145. doi: 10.1016/0005-2744(79)90282-1. [DOI] [PubMed] [Google Scholar]
- 866.Farver O, Wherland S, Koroleva O, Loginov DS, Pecht I. FEBS Journal. 2011;278:3463. doi: 10.1111/j.1742-4658.2011.08268.x. [DOI] [PubMed] [Google Scholar]
- 867.Andréasson LE, Brändén R, Reinhammar B. Biochimica et biophysica acta. 1976;438:370. doi: 10.1016/0005-2744(76)90254-0. [DOI] [PubMed] [Google Scholar]
- 868.Blackburn NJ, Ralle M, Hassett R, Kosman DJ. Biochemistry. 2000;39:2316. doi: 10.1021/bi992334a. [DOI] [PubMed] [Google Scholar]
- 869.Palmer AE, Quintanar L, Severance S, Wang TP, Kosman DJ, Solomon EI. Biochemistry. 2002;41:6438. doi: 10.1021/bi011979j. [DOI] [PubMed] [Google Scholar]
- 870.Morie-Bebel MM, Morris MC, Menzie JL, McMillin DR. J. Am. Chem. Soc. 1984;106:3677. [Google Scholar]
- 871.Cole JL, Clark PA, Solomon EI. J. Am. Chem. Soc. 1990;112:9534. [Google Scholar]
- 872.Cole JL, Tan GO, Yang EK, Hodgson KO, Solomon EI. J. Am. Chem. Soc. 1990;112:2243. [Google Scholar]
- 873.Shin W, Sundaram UM, Cole JL, Zhang HH, Hedman B, Hodgson KO, Solomon EI. J. Am. Chem. Soc. 1996;118:3202. [Google Scholar]
- 874.Palmer AE, Lee SK, Solomon EI. J. Am. Chem. Soc. 2001;123:6591. doi: 10.1021/ja010365z. [DOI] [PubMed] [Google Scholar]
- 875.Graziani MT, Morpurgo L, Rotilio G, Mondovì B. FEBS Letters. 1976;70:87. doi: 10.1016/0014-5793(76)80732-6. [DOI] [PubMed] [Google Scholar]
- 876.Huang HW, Zoppellaro G, Sakurai T. Journal of Biological Chemistry. 1999;274:32718. doi: 10.1074/jbc.274.46.32718. [DOI] [PubMed] [Google Scholar]
- 877.Nakamura K, Go N. Cellular and Molecular Life Sciences. 2005;62:2050. doi: 10.1007/s00018-004-5076-x. [DOI] [PMC free article] [PubMed] [Google Scholar]
- 878.Zhukhlistova NE, Zhukova YN, Lyashenko AV, Zaitsev VN, Mikhailov AM. Crystallography Reports. 2008;53:92. [Google Scholar]
- 879.Mot AC, Silaghi-Dumitrescu R. Biochem.-Moscow. 2012;77:1395. doi: 10.1134/S0006297912120085. [DOI] [PubMed] [Google Scholar]
- 880.Piontek K, Antorini M, Choinowski T. Journal of Biological Chemistry. 2002;277:37663. doi: 10.1074/jbc.M204571200. [DOI] [PubMed] [Google Scholar]
- 881.Ducros V, Brzozowski AM, Wilson KS, Brown SH, Ostergaard P, Schneider P, Yaver DS, Pedersen AH, Davies GJ. Nature Structural Biology. 1998;5:310. doi: 10.1038/nsb0498-310. [DOI] [PubMed] [Google Scholar]
- 882.Lawton TJ, Sayavedra-Soto LA, Arp DJ, Rosenzweig AC. Journal of Biological Chemistry. 2009;284:10174. doi: 10.1074/jbc.M900179200. [DOI] [PMC free article] [PubMed] [Google Scholar]
- 883.Komori H, Miyazaki K, Higuchi Y. Febs Letters. 2009;583:1189. doi: 10.1016/j.febslet.2009.03.008. [DOI] [PubMed] [Google Scholar]
- 884.Allendorf MD, Spira DJ, Solomon EI. Proceedings of the National Academy of Sciences of the United States of America. 1985;82:3063. doi: 10.1073/pnas.82.10.3063. [DOI] [PMC free article] [PubMed] [Google Scholar]
- 885.Marshall NM, Garner DK, Wilson TD, Gao YG, Robinson H, Nilges MJ, Lu Y. Nature. 2009;462:113. doi: 10.1038/nature08551. [DOI] [PMC free article] [PubMed] [Google Scholar]
- 886.Matera I, Gullotto A, Tilli S, Ferraroni M, Scozzafava A, Briganti F. Inorg. Chim. Acta. 2008;361:4129. [Google Scholar]
- 887.Hakulinen N, Kiiskinen LL, Kruus K, Saloheimo M, Paananen A, Koivula A, Rouvinen J. Nature Structural Biology. 2002;9:601. doi: 10.1038/nsb823. [DOI] [PubMed] [Google Scholar]
- 888.Quintanar L, Stoj C, Wang TP, Kosman DJ, Solomon EJ. Biochemistry. 2005;44:6081. doi: 10.1021/bi047379c. [DOI] [PubMed] [Google Scholar]
- 889.Augustine AJ, Quintanar L, Stoj CS, Kosman DJ, Solomon EI. J. Am. Chem. Soc. 2007;129:13118. doi: 10.1021/ja073905m. [DOI] [PMC free article] [PubMed] [Google Scholar]
- 890.Brissos V, Chen ZJ, Martins LO. Dalton Transactions. 2012;41:6247. doi: 10.1039/c2dt12067d. [DOI] [PubMed] [Google Scholar]
- 891.Kataoka K, Sugiyama R, Hirota S, Inoue M, Urata K, Minagawa Y, Seo D, Sakurai T. Journal of Biological Chemistry. 2009;284:14405. doi: 10.1074/jbc.M808468200. [DOI] [PMC free article] [PubMed] [Google Scholar]
- 892.Chen ZJ, Durao P, Silva CS, Pereira MM, Todorovic S, Hildebrandt P, Bento I, Lindley PF, Martins LO. Dalton Transactions. 2010;39:2875. doi: 10.1039/b922734b. [DOI] [PubMed] [Google Scholar]
- 893.Ferraroni M, Matera I, Chernykh A, Kolomytseva M, Golovleva LA, Scozzafava A, Briganti F. J. Inorg. Biochem. 2012;111:203. doi: 10.1016/j.jinorgbio.2012.01.011. [DOI] [PubMed] [Google Scholar]
- 894.Komori H, Sugiyama R, Kataoka K, Higuchi Y, Sakurai T. Angewandte Chemie-International Edition. 2012;51:1861. doi: 10.1002/anie.201107739. [DOI] [PubMed] [Google Scholar]
- 895.Quintanar L, Yoon JJ, Aznar CP, Palmer AE, Andersson KK, Britt RD, Solomon EI. J. Am. Chem. Soc. 2005;127:13832. doi: 10.1021/ja0421405. [DOI] [PubMed] [Google Scholar]
- 896.Hakulinen N, Kruus K, Koivula A, Rouvinen J. Biochem. Biophys. Res. Commun. 2006;350:929. doi: 10.1016/j.bbrc.2006.09.144. [DOI] [PubMed] [Google Scholar]
- 897.Bento I, Silva CS, Chen ZJ, Martins LO, Lindley PF, Soares CM. Bmc Structural Biology. 2010;10 doi: 10.1186/1472-6807-10-28. [DOI] [PMC free article] [PubMed] [Google Scholar]
- 898.Bento I, Martins LO, Lopes GG, Carrondo MA, Lindley PF. Dalton Transactions. 2005:3507. doi: 10.1039/b504806k. [DOI] [PubMed] [Google Scholar]
- 899.Spira-Solomon DJ, Allendorf MD, Solomon EI. J. Am. Chem. Soc. 1986;108:5318. [Google Scholar]
- 900.Yoon J, Liboiron BD, Sarangi R, Hodgson KO, Hedman B, Solomona EI. Proc Natl Acad Sci U S A. 2007;104:13609. doi: 10.1073/pnas.0705137104. [DOI] [PMC free article] [PubMed] [Google Scholar]
- 901.Braenden R, Malmstrom BG, Vanngard T. Eur. J. Biochem. 1973;36:195. doi: 10.1111/j.1432-1033.1973.tb02901.x. [DOI] [PubMed] [Google Scholar]
- 902.Winkler ME, Spira DJ, Lubien CD, Thamann TJ, Solomon EI. Biochem. Biophys. Res. Commun. 1982;107:727. doi: 10.1016/0006-291x(82)91551-0. [DOI] [PubMed] [Google Scholar]
- 903.Cole JL, Ballou DP, Solomon EI. J. Am. Chem. Soc. 1991;113:8544. [Google Scholar]
- 904.Ueki Y, Inoue M, Kurose S, Kataoka K, Sakurai T. Febs Letters. 2006;580:4069. doi: 10.1016/j.febslet.2006.06.049. [DOI] [PubMed] [Google Scholar]
- 905.Silva CS, Damas JM, Chen ZJ, Brissos V, Martins LO, Soares CM, Lindley PF, Bento I. Acta Crystallogr. Sect. D-Biol. Crystallogr. 2012;68:186. doi: 10.1107/S0907444911054503. [DOI] [PubMed] [Google Scholar]
- 906.Yoon J, Solomon EI. J. Am. Chem. Soc. 2007;129:13127. doi: 10.1021/ja073947a. [DOI] [PMC free article] [PubMed] [Google Scholar]
- 907.Augustine AJ, Kjaergaard C, Qayyum M, Ziegler L, Kosman DJ, Hodgson KO, Hedman B, Solomon EI. J. Am. Chem. Soc. 2010;132:6057. doi: 10.1021/ja909143d. [DOI] [PMC free article] [PubMed] [Google Scholar]
- 908.Andréasson LE, Branden R, Malmstrom B, Vanngard T. Febs Letters. 1973;32:187. doi: 10.1016/0014-5793(73)80768-9. [DOI] [PubMed] [Google Scholar]
- 909.Lee SK, George SD, Antholine WE, Hedman B, Hodgson KO, Solomon EI. J. Am. Chem. Soc. 2002;124:6180. doi: 10.1021/ja0114052. [DOI] [PubMed] [Google Scholar]
- 910.Aasa R, Branden R, Deinum J, Malmstrom BG, Reinhammar B, Vanngard T. Febs Letters. 1976;61:115. doi: 10.1016/0014-5793(76)81016-2. [DOI] [PubMed] [Google Scholar]
- 911.Aasa R, Branden R, Deinum J, Malmstrom BG, Reinhammar B, Vanngard T. Biochem. Biophys. Res. Commun. 1976;70:1204. doi: 10.1016/0006-291x(76)91030-5. [DOI] [PubMed] [Google Scholar]
- 912.Goldberg M, Farver O, Pecht I. Journal of Biological Chemistry. 1980;255:7353. [PubMed] [Google Scholar]
- 913.Manabe T, Manabe N, Hatano H, Hiromi K. Febs Letters. 1972;23:268. doi: 10.1016/0014-5793(72)80358-2. [DOI] [PubMed] [Google Scholar]
- 914.Mirica LM, Stack TDP. Inorganic Chemistry. 2005;44:2131. doi: 10.1021/ic048182b. [DOI] [PubMed] [Google Scholar]
- 915.Suh MP, Han MY, Lee JH, Min KS, Hyeon C. J. Am. Chem. Soc. 1998;120:3819. [Google Scholar]
- 916.Yoon J, Mirica LM, Stack TDP, Solomon EI. J. Am. Chem. Soc. 2005;127:13680. doi: 10.1021/ja0525152. [DOI] [PubMed] [Google Scholar]
- 917.Yoon J, Solomon EI. Inorganic Chemistry. 2005;44:8076. doi: 10.1021/ic0507870. [DOI] [PMC free article] [PubMed] [Google Scholar]
- 918.Yoon J, Mirica LM, Stack TDP, Solomon EI. J. Am. Chem. Soc. 2004;126:12586. doi: 10.1021/ja046380w. [DOI] [PubMed] [Google Scholar]
- 919.Rulisek L, Solomon EI, Ryde U. Inorganic Chemistry. 2005;44:5612. doi: 10.1021/ic050092z. [DOI] [PubMed] [Google Scholar]
- 920.Chalupsky J, Neese F, Solomon EI, Ryde U, Rulisek L. Inorganic Chemistry. 2006;45:11051. doi: 10.1021/ic0619512. [DOI] [PubMed] [Google Scholar]
- 921.Solomon EI, Augustine AJ, Yoon J. Dalton Transactions. 2008:3921. doi: 10.1039/b800799c. [DOI] [PMC free article] [PubMed] [Google Scholar]
- 922.Solomon EI, Chen P, Metz M, Lee SK, Palmer AE. Angewandte Chemie-International Edition. 2001;40:4570. doi: 10.1002/1521-3773(20011217)40:24<4570::aid-anie4570>3.0.co;2-4. [DOI] [PubMed] [Google Scholar]
- 923.Andrieux CP, Saveant JM, Tardy C. J. Am. Chem. Soc. 1998;120:4167. [Google Scholar]
- 924.Wood PM. Biochem. J. 1988;253:287. doi: 10.1042/bj2530287. [DOI] [PMC free article] [PubMed] [Google Scholar]
- 925.Westheimer FH. Chem. Rev. 1961;61:265. [Google Scholar]
- 926.Heppner DE, Kjaergaard CH, Solomon EI. J. Am. Chem. Soc. 2013;135:12212. doi: 10.1021/ja4064525. [DOI] [PMC free article] [PubMed] [Google Scholar]
- 927.Pereira MM, Santana M, Teixeira M. Biochimica et biophysica acta. 2001;1505:185. doi: 10.1016/s0005-2728(01)00169-4. [DOI] [PubMed] [Google Scholar]
- 928.Michel H, Behr J, Harrenga A, Kannt A. Annu. Rev. Biophys. Biomol. Struct. 1998;27:329. doi: 10.1146/annurev.biophys.27.1.329. [DOI] [PubMed] [Google Scholar]
- 929.Calhoun MW, Thomas JW, Gennis RB. Trends Biochem. Sci. 1994;19:325. doi: 10.1016/0968-0004(94)90071-x. [DOI] [PubMed] [Google Scholar]
- 930.Petersen LC. Biochimica et biophysica acta. 1977;460:299. doi: 10.1016/0005-2728(77)90216-x. [DOI] [PubMed] [Google Scholar]
- 931.Cooper CE, Brown GC. JOURNAL OF BIOENERGETICS AND BIOMEMBRANES. 2008;40:533. doi: 10.1007/s10863-008-9166-6. [DOI] [PubMed] [Google Scholar]
- 932.Brunori M, Giuffrè A, Forte E, Mastronicola D, Barone MC, Sarti P. Biochimica et biophysica acta. 2004;1655:365. doi: 10.1016/j.bbabio.2003.06.008. [DOI] [PubMed] [Google Scholar]
- 933.Antonini E, Brunori M, Colosimo A, Greenwood C, Wilson MT. Proceedings Of The National Academy Of Sciences Of The United States Of America. 1977;74:3128. doi: 10.1073/pnas.74.8.3128. [DOI] [PMC free article] [PubMed] [Google Scholar]
- 934.Brunori M, Colosimo A, Rainoni G, Wilson MT, Antonini E. J Biol Chem. 1979;254:10769. [PubMed] [Google Scholar]
- 935.Armstrong F, Shaw RW, Beinert H. Biochimica et biophysica acta. 1983;722:61. doi: 10.1016/0005-2728(83)90157-3. [DOI] [PubMed] [Google Scholar]
- 936.Morgan JE, Blair DF, Chan SI. J. Inorg. Biochem. 1985;23:295. doi: 10.1016/0162-0134(85)85038-8. [DOI] [PubMed] [Google Scholar]
- 937.Moody AJ. Biochimica et biophysica acta. 1996;1276:6. doi: 10.1016/0005-2728(96)00035-7. [DOI] [PubMed] [Google Scholar]
- 938.Moody AJ, Cooper CE, Rich PR. Biochimica et Biophysica Acta (BBA) - Bioenergetics. 1991;1059:189. doi: 10.1016/s0005-2728(05)80204-x. [DOI] [PubMed] [Google Scholar]
- 939.Kim E, Chufán EE, Kamaraj K, Karlin KD. Chem. Rev. 2004;104:1077. doi: 10.1021/cr0206162. [DOI] [PubMed] [Google Scholar]
- 940.Baker GM, Noguchi M, Palmer G. J Biol Chem. 1987;262:595. [PubMed] [Google Scholar]
- 941.Moody AJ. Biochem. Soc. Trans. 1991;19:617. doi: 10.1042/bst0190617. [DOI] [PubMed] [Google Scholar]
- 942.Palmer G, Baker GM, Noguchi M. Chemica Scripta. 1988;28:41. [Google Scholar]
- 943.Greenwood C, Wilson MT, Brunori M. Biochem. J. 1974;137:205. doi: 10.1042/bj1370205. [DOI] [PMC free article] [PubMed] [Google Scholar]
- 944.Oliveberg M, Malmström BG. Biochemistry. 1991;30:7053. doi: 10.1021/bi00243a003. [DOI] [PubMed] [Google Scholar]
- 945.Morgan JE, Li PM, Jang DJ, el-Sayed MA, Chan SI. Biochemistry. 1989;28:6975. doi: 10.1021/bi00443a030. [DOI] [PubMed] [Google Scholar]
- 946.Oliveberg M, Malmström BG. Biochemistry. 1992;31:3560. doi: 10.1021/bi00129a002. [DOI] [PubMed] [Google Scholar]
- 947.Blackmore RS, Greenwood C, Gibson QH. J Biol Chem. 1991;266:19245. [PubMed] [Google Scholar]
- 948.Sucheta A, Szundi I, Einarsdóttir O. Biochemistry. 1998;37:17905. doi: 10.1021/bi981092w. [DOI] [PubMed] [Google Scholar]
- 949.Oliveberg M, Brzezinski P, Malmström BG. Biochimica et biophysica acta. 1989;977:322. doi: 10.1016/s0005-2728(89)80087-8. [DOI] [PubMed] [Google Scholar]
- 950.Oliveberg M, Hallén S, Nilsson T. Biochemistry. 1991;30:436. doi: 10.1021/bi00216a019. [DOI] [PubMed] [Google Scholar]
- 951.Karpefors M, Adelroth P, Namslauer A, Zhen Y, Brzezinski P. Biochemistry. 2000;39:14664. doi: 10.1021/bi0013748. [DOI] [PubMed] [Google Scholar]
- 952.Hallén S, Nilsson T. Biochemistry. 1992;31:11853. doi: 10.1021/bi00162a025. [DOI] [PubMed] [Google Scholar]
- 953.Nilsson T. Proceedings Of The National Academy Of Sciences Of The United States Of America. 1992;89:6497. doi: 10.1073/pnas.89.14.6497. [DOI] [PMC free article] [PubMed] [Google Scholar]
- 954.Brand SE, Rajagukguk S, Ganesan K, Geren L, Fabian M, Han D, Gennis RB, Durham B, Millett F. Biochemistry. 2007;46:14610. doi: 10.1021/bi701424d. [DOI] [PubMed] [Google Scholar]
- 955.Ramirez BE, Malmström BG, Winkler JR, Gray HB. Proceedings Of The National Academy Of Sciences Of The United States Of America. 1995;92:11949. doi: 10.1073/pnas.92.26.11949. [DOI] [PMC free article] [PubMed] [Google Scholar]
- 956.Wiertz FGM, Richter O-MH, Ludwig B, de Vries S. J Biol Chem. 2007;282:31580. doi: 10.1074/jbc.M705520200. [DOI] [PubMed] [Google Scholar]
- 957.Han S, Takahashi S, Rousseau DL. J Biol Chem. 2000;275:1910. doi: 10.1074/jbc.275.3.1910. [DOI] [PubMed] [Google Scholar]
- 958.Mitchell R, Rich PR. Biochimica et biophysica acta. 1994;1186:19. doi: 10.1016/0005-2728(94)90130-9. [DOI] [PubMed] [Google Scholar]
- 959.Wiertz FGM, Richter O-MH, Cherepanov AV, MacMillan F, Ludwig B, de Vries S. FEBS LETTERS. 2004;575:127. doi: 10.1016/j.febslet.2004.08.048. [DOI] [PubMed] [Google Scholar]
- 960.Fabian M, Palmer G. Biochemistry. 1995;34:13802. doi: 10.1021/bi00042a011. [DOI] [PubMed] [Google Scholar]
- 961.Siletsky SA, Han D, Brand S, Morgan JE, Fabian M, Geren L, Millett F, Durham B, Konstantinov AA, Gennis RB. Biochimica et biophysica acta. 2006;1757:1122. doi: 10.1016/j.bbabio.2006.07.003. [DOI] [PubMed] [Google Scholar]
- 962.Bloch D, Belevich I, Jasaitis A, Ribacka C, Puustinen A, Verkhovsky MI, Wikström M. Proceedings Of The National Academy Of Sciences Of The United States Of America. 2004;101:529. doi: 10.1073/pnas.0306036101. [DOI] [PMC free article] [PubMed] [Google Scholar]
- 963.Jancura D, Berka V, Antalik M, Bagelova J, Gennis RB, Palmer G, Fabian M. J Biol Chem. 2006;281:30319. doi: 10.1074/jbc.M605955200. [DOI] [PubMed] [Google Scholar]
- 964.Belevich I, Bloch DA, Belevich N, Wikström M, Verkhovsky MI. Proceedings Of The National Academy Of Sciences Of The United States Of America. 2007;104:2685. doi: 10.1073/pnas.0608794104. [DOI] [PMC free article] [PubMed] [Google Scholar]
- 965.Ruitenberg M, Kannt A, Bamberg E, Ludwig B, Michel H, Fendler K. Proceedings Of The National Academy Of Sciences Of The United States Of America. 2000;97:4632. doi: 10.1073/pnas.080079097. [DOI] [PMC free article] [PubMed] [Google Scholar]
- 966.Geren L, Durham B, Millett F. Methods Enzymol. 2009;456:507. doi: 10.1016/S0076-6879(08)04428-5. [DOI] [PMC free article] [PubMed] [Google Scholar]
- 967.Ruitenberg M, Kannt A, Bamberg E, Fendler K, Michel H. Nature. 2002;417:99. doi: 10.1038/417099a. [DOI] [PubMed] [Google Scholar]
- 968.Blair DF, Ellis WR, Wang H, Gray HB, Chan SI. J Biol Chem. 1986;261:11524. [PubMed] [Google Scholar]
- 969.Mackey LN, Kuwana T, Hartzell CR. FEBS LETTERS. 1973;36:326. doi: 10.1016/0014-5793(73)80402-8. [DOI] [PubMed] [Google Scholar]
- 970.Gorbikova EA, Vuorilehto K, Wikström M, Verkhovsky MI. Biochemistry. 2006;45:5641. doi: 10.1021/bi060257v. [DOI] [PubMed] [Google Scholar]
- 971.Dutton PL, Wilson DF, Lee CP. Biochemistry. 1970;9:5077. doi: 10.1021/bi00828a006. [DOI] [PubMed] [Google Scholar]
- 972.Kimelberg HK, Lee CP. Binding of cytochromec to phospholipid liquid crystals. 1970;2:252. doi: 10.1007/BF01869863. [DOI] [PubMed] [Google Scholar]
- 973.Lindsay JG, Owen CS, Wilson DF. Arch. Biochem. Biophys. 1975;169:492. doi: 10.1016/0003-9861(75)90192-7. [DOI] [PubMed] [Google Scholar]
- 974.Tiesjema RH, Muijsers AO, van Gelder BF. Biochimica et biophysica acta. 1973;305:19. doi: 10.1016/0005-2728(73)90227-2. [DOI] [PubMed] [Google Scholar]
- 975.Morgan JE, Wikström M. Biochemistry. 1991;30:948. doi: 10.1021/bi00218a010. [DOI] [PubMed] [Google Scholar]
- 976.Wilson DF, Lindsay JG, Brocklehurst ES. Biochimica et biophysica acta. 1972;256:277. doi: 10.1016/0005-2728(72)90058-8. [DOI] [PubMed] [Google Scholar]
- 977.Heineman WR, Kuwana T. Biochem. Biophys. Res. Commun. 1973;50:892. doi: 10.1016/0006-291x(73)91329-6. [DOI] [PubMed] [Google Scholar]
- 978.Wikström KF, Harmon HJ, Ingledew WJ, Chance B. FEBS LETTERS. 1976;65:259. doi: 10.1016/0014-5793(76)80127-5. [DOI] [PubMed] [Google Scholar]
- 979.Yonetani T. J Biol Chem. 1960;235:845. [PubMed] [Google Scholar]
- 980.Babcock GT, Vickery LE, Palmer G. J Biol Chem. 1978;253:2400. [PubMed] [Google Scholar]
- 981.Wang H, Blair DF, Ellis WR, Gray HB, Chan SI. Biochemistry. 1986;25:167. doi: 10.1021/bi00349a024. [DOI] [PubMed] [Google Scholar]
- 982.Minnaert K. Biochimica et biophysica acta. 1961;50:23. doi: 10.1016/0006-3002(61)91055-1. [DOI] [PubMed] [Google Scholar]
- 983.Yonetani T, Ray GS. J Biol Chem. 1965;240:3392. [PubMed] [Google Scholar]
- 984.van Buuren KJ, van Gelder BF, Eggelte TA. Biochimica et biophysica acta. 1971;234:468. doi: 10.1016/0005-2728(71)90213-1. [DOI] [PubMed] [Google Scholar]
- 985.Gibson QH, Greenwood C. J Biol Chem. 1965;240:888. [PubMed] [Google Scholar]
- 986.Sinjorgo KM, Steinebach OM, Dekker HL, Muijsers AO. Biochimica et biophysica acta. 1986;850:108. doi: 10.1016/0005-2728(86)90014-9. [DOI] [PubMed] [Google Scholar]
- 987.Andréasson LE. European journal of biochemistry / FEBS. 1975;53:591. doi: 10.1111/j.1432-1033.1975.tb04102.x. [DOI] [PubMed] [Google Scholar]
- 988.Verkhovsky MI, Morgan JE, Wikström M. Biochemistry. 1992;31:11860. doi: 10.1021/bi00162a026. [DOI] [PubMed] [Google Scholar]
- 989.Tsukihara T, Aoyama H, Yamashita E, Tomizaki T, Yamaguchi H, Shinzawa-Itoh K, Nakashima R, Yaono R, Yoshikawa S. Science (New York, N.Y.) 1996;272:1136. doi: 10.1126/science.272.5265.1136. [DOI] [PubMed] [Google Scholar]
- 990.Harrenga A, Michel H. J Biol Chem. 1999;274:33296. doi: 10.1074/jbc.274.47.33296. [DOI] [PubMed] [Google Scholar]
- 991.Abramson J, Riistama S, Larsson G, Jasaitis A, Svensson-Ek M, Laakkonen L, Puustinen A, Iwata S, Wikström M. Nature Structural Biology. 2000;7:910. doi: 10.1038/82824. [DOI] [PubMed] [Google Scholar]
- 992.Svensson-Ek M, Abramson J, Larsson G, Tornroth S, Brzezinski P, Iwata S. J. Mol. Biol. 2002;321:329. doi: 10.1016/s0022-2836(02)00619-8. [DOI] [PubMed] [Google Scholar]
- 993.Soulimane T, Buse G, Bourenkov GP, Bartunik HD, Huber R, Than ME. The EMBO Journal. 2000;19:1766. doi: 10.1093/emboj/19.8.1766. [DOI] [PMC free article] [PubMed] [Google Scholar]
- 994.Buschmann S, Warkentin E, Xie H, Langer JD, Ermler U, Michel H. Science (New York, N.Y.) 2010;329:327. doi: 10.1126/science.1187303. [DOI] [PubMed] [Google Scholar]
- 995.Bisson R, Steffens GC, Capaldi RA, Buse G. FEBS LETTERS. 1982;144:359. doi: 10.1016/0014-5793(82)80672-8. [DOI] [PubMed] [Google Scholar]
- 996.Witt H, Zickermann V, Ludwig B. Biochimica et biophysica acta. 1995;1230:74. doi: 10.1016/0005-2728(95)00050-s. [DOI] [PubMed] [Google Scholar]
- 997.Tsukihara T, Aoyama H, Yamashita E, Tomizaki T, Yamaguchi H, Shinzawa-Itoh K, Nakashima R, Yaono R, Yoshikawa S. Science (New York, N.Y.) 1995;269:1069. doi: 10.1126/science.7652554. [DOI] [PubMed] [Google Scholar]
- 998.Tsukihara T, Shimokata K, Katayama Y, Shimada H, Muramoto K, Aoyama H, Mochizuki M, Shinzawa-Itoh K, Yamashita E, Yao M, Ishimura Y, Yoshikawa S. Proceedings Of The National Academy Of Sciences Of The United States Of America. 2003;100:15304. doi: 10.1073/pnas.2635097100. [DOI] [PMC free article] [PubMed] [Google Scholar]
- 999.Muramoto K, Ohta K, Shinzawa-Itoh K, Kanda K, Taniguchi M, Nabekura H, Yamashita E, Tsukihara T, Yoshikawa S. Proceedings Of The National Academy Of Sciences Of The United States Of America. 2010;107:7740. doi: 10.1073/pnas.0910410107. [DOI] [PMC free article] [PubMed] [Google Scholar]
- 1000.Aoyama H, Muramoto K, Shinzawa-Itoh K, Hirata K, Yamashita E, Tsukihara T, Ogura T, Yoshikawa S. Proceedings Of The National Academy Of Sciences Of The United States Of America. 2009;106:2165. doi: 10.1073/pnas.0806391106. [DOI] [PMC free article] [PubMed] [Google Scholar]
- 1001.Koepke J, Olkhova E, Angerer H, Müller H, Peng G, Michel H. Biochimica et biophysica acta. 2009;1787:635. doi: 10.1016/j.bbabio.2009.04.003. [DOI] [PubMed] [Google Scholar]
- 1002.Yoshikawa S, Shinzawa-Itoh K, Nakashima R, Yaono R, Yamashita E, Inoue N, Yao M, Fei MJ, Libeu CP, Mizushima T, Yamaguchi H, Tomizaki T, Tsukihara T. Science. 1998;280:1723. doi: 10.1126/science.280.5370.1723. [DOI] [PubMed] [Google Scholar]
- 1003.Qin L, Hiser C, Mulichak A, Garavito RM, Ferguson-Miller S. Proceedings Of The National Academy Of Sciences Of The United States Of America. 2006;103:16117. doi: 10.1073/pnas.0606149103. [DOI] [PMC free article] [PubMed] [Google Scholar]
- 1004.Qin L, Liu J, Mills DA, Proshlyakov DA, Hiser C, Ferguson-Miller S. Biochemistry. 2009;48:5121. doi: 10.1021/bi9001387. [DOI] [PMC free article] [PubMed] [Google Scholar]
- 1005.Suga M, Yano N, Muramoto K, Shinzawa-Itoh K, Maeda T, Yamashita E, Tsukihara T, Yoshikawa S. Acta crystallographica. Section D, Biological crystallography. 2011;67:742. doi: 10.1107/S0907444911022803. [DOI] [PubMed] [Google Scholar]
- 1006.Kaila VRI, Oksanen E, Goldman A, Bloch DA, Verkhovsky MI, Sundholm D, Wikström M. Biochimica et biophysica acta. 2011;1807:769. doi: 10.1016/j.bbabio.2010.12.016. [DOI] [PubMed] [Google Scholar]
- 1007.Muramoto K, Hirata K, Shinzawa-Itoh K, Yoko-o S, Yamashita E, Aoyama H, Tsukihara T, Yoshikawa S. Proceedings Of The National Academy Of Sciences Of The United States Of America. 2007;104:7881. doi: 10.1073/pnas.0610031104. [DOI] [PMC free article] [PubMed] [Google Scholar]
- 1008.Shinzawa-Itoh K, Aoyama H, Muramoto K, Terada H, Kurauchi T, Tadehara Y, Yamasaki A, Sugimura T, Kurono S, Tsujimoto K, Mizushima T, Yamashita E, Tsukihara T, Yoshikawa S. The EMBO Journal. 2007;26:1713. doi: 10.1038/sj.emboj.7601618. [DOI] [PMC free article] [PubMed] [Google Scholar]
- 1009.DeBeer George S, Metz M, Szilagyi RK, Wang H, Cramer SP, Lu Y, Tolman WB, Hedman B, Hodgson KO, Solomon EI. J. Am. Chem. Soc. 2001;123:5757. doi: 10.1021/ja004109i. [DOI] [PubMed] [Google Scholar]
- 1010.Wikström M. Biochimica et biophysica acta. 2004;1655:241. doi: 10.1016/j.bbabio.2003.07.013. [DOI] [PubMed] [Google Scholar]
- 1011.Kim YC, Wikström M, Hummer G. Proceedings Of The National Academy Of Sciences Of The United States Of America. 2009;106:13707. doi: 10.1073/pnas.0903938106. [DOI] [PMC free article] [PubMed] [Google Scholar]
- 1012.Agmon N. Chem. Phys. Lett. 1995;244:456. [Google Scholar]
- 1013.Brändén M, Sigurdson H, Namslauer A, Gennis RB, Adelroth P, Brzezinski P. Proceedings Of The National Academy Of Sciences Of The United States Of America. 2001;98:5013. doi: 10.1073/pnas.081088398. [DOI] [PMC free article] [PubMed] [Google Scholar]
- 1014.Adelroth P, Ek MS, Mitchell DM, Gennis RB, Brzezinski P. Biochemistry. 1997;36:13824. doi: 10.1021/bi9629079. [DOI] [PubMed] [Google Scholar]
- 1015.Konstantinov AA, Siletsky S, Mitchell D, Kaulen A, Gennis RB. Proceedings Of The National Academy Of Sciences Of The United States Of America. 1997;94:9085. doi: 10.1073/pnas.94.17.9085. [DOI] [PMC free article] [PubMed] [Google Scholar]
- 1016.Kaila VRI, Verkhovsky M, Hummer G, Wikström M. Biochimica et biophysica acta. 2008;1777:890. doi: 10.1016/j.bbabio.2008.03.016. [DOI] [PubMed] [Google Scholar]
- 1017.Adelroth P, Gennis RB, Brzezinski P. Biochemistry. 1998;37:2470. doi: 10.1021/bi971813b. [DOI] [PubMed] [Google Scholar]
- 1018.Sharpe MA, Ferguson-Miller S. JOURNAL OF BIOENERGETICS AND BIOMEMBRANES. 2008;40:541. doi: 10.1007/s10863-008-9182-6. [DOI] [PMC free article] [PubMed] [Google Scholar]
- 1019.Fetter JR, Qian J, Shapleigh J, Thomas JW, García-Horsman A, Schmidt E, Hosler J, Babcock GT, Gennis RB, Ferguson-Miller S. Proceedings Of The National Academy Of Sciences Of The United States Of America. 1995;92:1604. doi: 10.1073/pnas.92.5.1604. [DOI] [PMC free article] [PubMed] [Google Scholar]
- 1020.Hosler JP, Shapleigh JP, Mitchell DM, Kim Y, Pressler MA, Georgiou C, Babcock GT, Alben JO, Ferguson-Miller S, Gennis RB. Biochemistry. 1996;35:10776. doi: 10.1021/bi9606511. [DOI] [PubMed] [Google Scholar]
- 1021.Kamiya K, Boero M, Tateno M, Shiraishi K, Oshiyama A. J. Am. Chem. Soc. 2007;129:9663. doi: 10.1021/ja070464y. [DOI] [PubMed] [Google Scholar]
- 1022.Tsukihara T, Shimokata K, Katayama Y, Shimada H, Muramoto K, Aoyama H, Mochizuki M, Shinzawa-Itoh K, Yamashita E, Yao M, Ishimura Y, Yoshikawa S. Proceedings of the National Academy of Sciences. 2003;100:15304. doi: 10.1073/pnas.2635097100. [DOI] [PMC free article] [PubMed] [Google Scholar]
- 1023.Shimokata K, Katayama Y, Murayama H, Suematsu M, Tsukihara T, Muramoto K, Aoyama H, Yoshikawa S, Shimada H. Proceedings of the National Academy of Sciences. 2007;104:4200. doi: 10.1073/pnas.0611627104. [DOI] [PMC free article] [PubMed] [Google Scholar]
- 1024.Yoshikawa S, Muramoto K, Shinzawa-Itoh K, Aoyama H, Tsukihara T, Shimokata K, Katayama Y, Shimada H. Biochimica et Biophysica Acta (BBA) - Bioenergetics. 2006;1757:1110. doi: 10.1016/j.bbabio.2006.06.004. [DOI] [PubMed] [Google Scholar]
- 1025.Muramoto K, Ohta K, Shinzawa-Itoh K, Kanda K, Taniguchi M, Nabekura H, Yamashita E, Tsukihara T, Yoshikawa S. Proceedings of the National Academy of Sciences. 2010;107:7740. doi: 10.1073/pnas.0910410107. [DOI] [PMC free article] [PubMed] [Google Scholar]
- 1026.Greenwood C, Gibson QH. J Biol Chem. 1967;242:1782. [PubMed] [Google Scholar]
- 1027.Stoutland PO, Lambry JC, Martin JL, Woodruff WH. The Journal of Physical Chemistry. 1991;95:6406. [Google Scholar]
- 1028.Fann YC, Ahmed I, Blackburn NJ, Boswell JS, Verkhovskaya ML, Hoffman BM, Wikstrom M. Biochemistry. 1995;34:10245. doi: 10.1021/bi00032a019. [DOI] [PubMed] [Google Scholar]
- 1029.Osborne JP, Cosper NJ, Stälhandske CMV, Scott RA, Alben JO, Gennis RB. Biochemistry. 1999;38:4526. doi: 10.1021/bi982278y. [DOI] [PubMed] [Google Scholar]
- 1030.Bandeiras TM, Pereira MM, Teixeira M, Moenne-Loccoz P, Blackburn NJ. Journal of Biological Inorganic Chemistry. 2005;10:625. doi: 10.1007/s00775-005-0012-6. [DOI] [PubMed] [Google Scholar]
- 1031.Hill BC, Greenwood C. Biochem. J. 1983;215:659. doi: 10.1042/bj2150659. [DOI] [PMC free article] [PubMed] [Google Scholar]
- 1032.Chance B, Saronio C, Leigh JS. Proceedings Of The National Academy Of Sciences Of The United States Of America. 1975;72:1635. doi: 10.1073/pnas.72.4.1635. [DOI] [PMC free article] [PubMed] [Google Scholar]
- 1033.Clore GM, Andréasson LE, Karlsson B, Aasa R, Malmström BG. The Biochemical journal. 1980;185:155. doi: 10.1042/bj1850155. [DOI] [PMC free article] [PubMed] [Google Scholar]
- 1034.Han S, Ching YC, Rousseau DL. Biochemistry. 1990;29:1380. doi: 10.1021/bi00458a006. [DOI] [PubMed] [Google Scholar]
- 1035.Han SW, Ching YC, Rousseau DL. Proceedings Of The National Academy Of Sciences Of The United States Of America. 1990;87:2491. doi: 10.1073/pnas.87.7.2491. [DOI] [PMC free article] [PubMed] [Google Scholar]
- 1036.Varotsis C, Woodruff WH, Babcock GT. J Biol Chem. 1990;265:11131. [PubMed] [Google Scholar]
- 1037.Varotsis C, Zhang Y, Appelman EH, Babcock GT. Proceedings Of The National Academy Of Sciences Of The United States Of America. 1993;90:237. doi: 10.1073/pnas.90.1.237. [DOI] [PMC free article] [PubMed] [Google Scholar]
- 1038.Ogura T, Yoshikawa S, Kitagawa T. Biochemistry. 1989;28:8022. doi: 10.1021/bi00446a008. [DOI] [PubMed] [Google Scholar]
- 1039.Weng L, Baker GM. Biochemistry. 1991;30:5727. doi: 10.1021/bi00237a014. [DOI] [PubMed] [Google Scholar]
- 1040.Cheesman MR, Watmough NJ, Gennis RB, Greenwood C, Thomson AJ. European journal of biochemistry / FEBS. 1994;219:595. doi: 10.1111/j.1432-1033.1994.tb19975.x. [DOI] [PubMed] [Google Scholar]
- 1041.Watmough NJ, Cheesman MR, Greenwood C, Thomson AJ. The Biochemical journal. 1994;300(Pt 2):469. doi: 10.1042/bj3000469. [DOI] [PMC free article] [PubMed] [Google Scholar]
- 1042.Ogura T, Kitagawa T. Biochimica et biophysica acta. 2004;1655:290. doi: 10.1016/j.bbabio.2003.10.013. [DOI] [PubMed] [Google Scholar]
- 1043.Proshlyakov DA, Pressler MA, Babcock GT. Proceedings Of The National Academy Of Sciences Of The United States Of America. 1998;95:8020. doi: 10.1073/pnas.95.14.8020. [DOI] [PMC free article] [PubMed] [Google Scholar]
- 1044.Proshlyakov DA, Ogura T, Shinzawa-Itoh K, Yoshikawa S, Appelman EH, Kitagawa T. J Biol Chem. 1994;269:29385. [PubMed] [Google Scholar]
- 1045.Einarsdóttir O, Szundi I, van Eps N, Sucheta A. J. Inorg. Biochem. 2002;91:87. doi: 10.1016/s0162-0134(02)00377-x. [DOI] [PubMed] [Google Scholar]
- 1046.MacMillan F, Kannt A, Behr J, Prisner T, Michel H. Biochemistry. 1999;38:9179. doi: 10.1021/bi9911987. [DOI] [PubMed] [Google Scholar]
- 1047.Budiman K, Kannt A, Lyubenova S, Richter O-MH, Ludwig B, Michel H, MacMillan F. Biochemistry. 2004;43:11709. doi: 10.1021/bi048898i. [DOI] [PubMed] [Google Scholar]
- 1048.Yu MA, Egawa T, Shinzawa-Itoh K, Yoshikawa S, Yeh SR, Rousseau DL, Gerfen GJ. Biochimica et biophysica acta. 2011;1807:1295. doi: 10.1016/j.bbabio.2011.06.012. [DOI] [PMC free article] [PubMed] [Google Scholar]
- 1049.Svistunenko DA. Biochimica et biophysica acta. 2005;1707:127. doi: 10.1016/j.bbabio.2005.01.004. [DOI] [PubMed] [Google Scholar]
- 1050.Svistunenko DA, Wilson MT, Cooper CE. Biochimica et Biophysica Acta (BBA) - Bioenergetics. 2004;1655:372. doi: 10.1016/j.bbabio.2003.06.006. [DOI] [PubMed] [Google Scholar]
- 1051.Rich PR, Rigby SEJ, Heathcote P. Biochimica et biophysica acta. 2002;1554:137. doi: 10.1016/s0005-2728(02)00228-1. [DOI] [PubMed] [Google Scholar]
- 1052.Nagano Y, Liu JG, Naruta Y, Kitagawa T. J. Mol. Struct. 2005;735:279. [Google Scholar]
- 1053.Nagano Y, Liu JG, Naruta Y, Ikoma T, Tero-Kubota S, Kitagawa T. J. Am. Chem. Soc. 2006;128:14560. doi: 10.1021/ja061507y. [DOI] [PubMed] [Google Scholar]
- 1054.White KN, Sen I, Szundi I, Landaverry YR, Bria LE, Konopelski JP, Olmstead MM, Einarsdóttir O. Chemical Communications. 2007:3252. doi: 10.1039/b703835f. [DOI] [PubMed] [Google Scholar]
- 1055.Offenbacher A, White KN, Sen I, Oliver AG, Konopelski JP, Barry BA, Einarsdóttir O. J. Phys. Chem. B. 2009;113:7407. doi: 10.1021/jp9010795. [DOI] [PMC free article] [PubMed] [Google Scholar]
- 1056.Morgan JE, Verkhovsky MI, Palmer G, Wikstrom M. Biochemistry. 2001;40:6882. doi: 10.1021/bi010246w. [DOI] [PubMed] [Google Scholar]
- 1057.Proshlyakov DA, Pressler MA, DeMaso C, Leykam JF, DeWitt DL, Babcock GT. Science. 2000;290:1588. doi: 10.1126/science.290.5496.1588. [DOI] [PubMed] [Google Scholar]
- 1058.Iwaki M, Puustinen A, Wikstrom M, Rich PR. Biochemistry. 2004;43:14370. doi: 10.1021/bi048545j. [DOI] [PubMed] [Google Scholar]
- 1059.Iwaki M, Puustinen A, Wikstrom M. Biochemistry. 2006 [Google Scholar]
- 1060.Ogura T, Takahashi S, Shinzawa-Itoh K. Bulletin of the Chemical …. 1991 [Google Scholar]
- 1061.Han SW, Ching YC, Rousseau DL. J Biol Chem. 1989;264:6604. [PubMed] [Google Scholar]
- 1062.Han S, Ching YC, Rousseau DL. Nature. 1990;348:89. doi: 10.1038/348089a0. [DOI] [PubMed] [Google Scholar]
- 1063.Collman JP, Sunderland CJ, Berg KE, Vance MA, Solomon EI. J. Am. Chem. Soc. 2003;125:6648. doi: 10.1021/ja034382v. [DOI] [PubMed] [Google Scholar]
- 1064.Collman JP, Boulatov R, Sunderland CJ, Fu L. Chem. Rev. 2004;104:561. doi: 10.1021/cr0206059. [DOI] [PubMed] [Google Scholar]
- 1065.Collman JP, Decreau RA, Zhang CX. The Journal of organic chemistry. 2004;69:3546. doi: 10.1021/jo0499625. [DOI] [PubMed] [Google Scholar]
- 1066.Collman JP, Devaraj NK, Decreau RA, Yang Y, Yan YL, Ebina W, Eberspacher TA, Chidsey CED. Science. 2007;315:1565. doi: 10.1126/science.1135844. [DOI] [PMC free article] [PubMed] [Google Scholar]
- 1067.Collman JP, Decreau RA, Yan Y, Yoon J, Solomon EI. J. Am. Chem. Soc. 2007;129:5794. doi: 10.1021/ja0690969. [DOI] [PMC free article] [PubMed] [Google Scholar]
- 1068.Halime Z, Kieber-Emmons MT, Qayyum MF, Mondal B, Gandhi T, Puiu SC, Chufan EE, Sarjeant AAN, Hodgson KO, Hedman B, Solomon EI, Karlin KD. Inorganic chemistry. 2010;49:3629. doi: 10.1021/ic9020993. [DOI] [PMC free article] [PubMed] [Google Scholar]
- 1069.Kieber-Emmons MT, Qayyum MF, Li Y, Halime Z, Hodgson KO, Hedman B, Karlin KD, Solomon EI. Angew. Chem. Int. Ed. 2012;51:168. doi: 10.1002/anie.201104080. [DOI] [PMC free article] [PubMed] [Google Scholar]
- 1070.Lehnert N, Neese F, Ho RYN, Que L, Jr, Solomon EI. J. Am. Chem. Soc. 2002;124:10810. doi: 10.1021/ja012621d. [DOI] [PubMed] [Google Scholar]
- 1071.Lehnert N, Ho RY, Que L, Jr, Solomon EI. J. Am. Chem. Soc. 2001;123:12802. doi: 10.1021/ja011450+. [DOI] [PubMed] [Google Scholar]
- 1072.Lehnert N, Ho RY, Que L, Jr, Solomon EI. J. Am. Chem. Soc. 2001;123:8271. doi: 10.1021/ja010165n. [DOI] [PubMed] [Google Scholar]
- 1073.Blomberg MR, Siegbahn PEM, Babcock GT, Wikstrom M. J. Inorg. Biochem. 2000;80:261. doi: 10.1016/s0162-0134(00)00080-5. [DOI] [PubMed] [Google Scholar]
- 1074.Blomberg MRA, Siegbahn PEM, Wikstrom M. Inorganic chemistry. 2003;42:5231. doi: 10.1021/ic034060s. [DOI] [PubMed] [Google Scholar]
- 1075.Kieber-Emmons MT, Li Y, Halime Z, Karlin KD, Solomon EI. Inorganic chemistry. 2011;50:11777. doi: 10.1021/ic2018727. [DOI] [PMC free article] [PubMed] [Google Scholar]
- 1076.von der Hocht I, van Wonderen JH, Hilbers F, Angerer H, MacMillan F, Michel H. Proceedings Of The National Academy Of Sciences Of The United States Of America. 2011;108:3964. doi: 10.1073/pnas.1100950108. [DOI] [PMC free article] [PubMed] [Google Scholar]
- 1077.Moody AJ, Cooper CE, Gennis RB, Rumbley JN, Rich PR. Biochemistry. 1995;34:6838. doi: 10.1021/bi00020a030. [DOI] [PubMed] [Google Scholar]
- 1078.Mitchell R, Mitchell P, Rich PR. FEBS LETTERS. 1991;280:321. doi: 10.1016/0014-5793(91)80321-s. [DOI] [PubMed] [Google Scholar]
- 1079.Day EP, Peterson J, Sendova MS, Schoonover J, Palmer G. Biochemistry. 1993;32:7855. doi: 10.1021/bi00082a003. [DOI] [PubMed] [Google Scholar]
- 1080.Tweedle MF, Wilson LJ, Garcia-Iniguez L, Babcock GT, Palmer G. Journal of Biological Chemistry. 1978 [Google Scholar]
- 1081.Cheesman MR, Oganesyan VS, Watmough NJ, Butler CS, Thomson AJ. J. Am. Chem. Soc. 2004;126:4157. doi: 10.1021/ja038858m. [DOI] [PubMed] [Google Scholar]
- 1082.Oganesyan VS, White GF, Field S, Marritt S, Gennis RB, Yap LL, Thomson AJ. Journal of biological inorganic chemistry. 2010;15:1255. doi: 10.1007/s00775-010-0683-5. [DOI] [PubMed] [Google Scholar]
- 1083.Das TK, Pecoraro C, Tomson FL, Gennis RB, Rousseau DL. Biochemistry. 1998;37:14471. doi: 10.1021/bi981500w. [DOI] [PubMed] [Google Scholar]
- 1084.Kaila VRI, Verkhovsky MI, Wikstrom M. Chem. Rev. 2010;110:7062. doi: 10.1021/cr1002003. [DOI] [PubMed] [Google Scholar]
- 1085.Pisliakov AV, Sharma PK, Chu ZT, Haranczyk M, Warshel A. Proceedings Of The National Academy Of Sciences Of The United States Of America. 2008;105:7726. doi: 10.1073/pnas.0800580105. [DOI] [PMC free article] [PubMed] [Google Scholar]
- 1086.Brzezinski P, Gennis RB. JOURNAL OF BIOENERGETICS AND BIOMEMBRANES. 2008;40:521. doi: 10.1007/s10863-008-9181-7. [DOI] [PMC free article] [PubMed] [Google Scholar]
- 1087.Egawa T, Yeh SR, Rousseau DL. PloS one. 2013;8:e63669. doi: 10.1371/journal.pone.0063669. [DOI] [PMC free article] [PubMed] [Google Scholar]
- 1088.Kaila VRI, Sharma V, Wikström M. Biochimica et Biophysica Acta (BBA) - Bioenergetics. 2011;1807:80. doi: 10.1016/j.bbabio.2010.08.014. [DOI] [PubMed] [Google Scholar]
- 1089.Xu J, Voth GA. Biochimica et Biophysica Acta (BBA) - Bioenergetics. 2008;1777:196. doi: 10.1016/j.bbabio.2007.11.008. [DOI] [PMC free article] [PubMed] [Google Scholar]
- 1090.Ferguson-Miller S, Hiser C, Liu J. Biochimica et Biophysica Acta (BBA) - Bioenergetics. 2012;1817:489. doi: 10.1016/j.bbabio.2011.11.018. [DOI] [PMC free article] [PubMed] [Google Scholar]
- 1091.Wikstrom M, Verkhovsky MI. Biochimica et biophysica acta. 2003 doi: 10.1016/s0005-2728(01)00220-1. [DOI] [PubMed] [Google Scholar]
- 1092.Lee HJ, Svahn E, Swanson JMJ, Lepp H, Voth GA, Brzezinski P, Gennis RB. J. Am. Chem. Soc. 2010 doi: 10.1021/ja107244g. [DOI] [PMC free article] [PubMed] [Google Scholar]
- 1093.Dürr KL, Koepke J, Hellwig P, Müller H, Angerer H, Peng G, Olkhova E, Richter O-MH, Ludwig B, Michel H. J. Mol. Biol. 2008;384:865. doi: 10.1016/j.jmb.2008.09.074. [DOI] [PubMed] [Google Scholar]
- 1094.Tuukkanen A, Kaila VRI, Laakkonen L, Hummer G, Wikstrom M. Biochimica et biophysica acta. 2007;1767:1102. doi: 10.1016/j.bbabio.2007.06.010. [DOI] [PubMed] [Google Scholar]
- 1095.Peng Y, Voth GA. Biochimica et biophysica acta. 2012;1817:518. doi: 10.1016/j.bbabio.2011.11.017. [DOI] [PMC free article] [PubMed] [Google Scholar]
- 1096.Lyons JA, Aragao D, Slattery O, Pisliakov AV, Soulimane T, Caffrey M. Nature. 2012;487:514. doi: 10.1038/nature11182. [DOI] [PMC free article] [PubMed] [Google Scholar]
- 1097.Fadda E, Yu CH, Pomès R. Biochimica et biophysica acta. 2008;1777:277. doi: 10.1016/j.bbabio.2007.11.010. [DOI] [PubMed] [Google Scholar]
- 1098.Solomon EI, Brunold TC, Davis MI, Kemsley JN, Lee SK, Lehnert N, Neese F, Skulan AJ, Yang YS, Zhou J. Chem. Rev. 2000;100:235. doi: 10.1021/cr9900275. [DOI] [PubMed] [Google Scholar]
- 1099.Oka T, Simpson FJ, Child JJ, Mills C. Can. J. Microbiol. 1971;17:111. doi: 10.1139/m71-019. [DOI] [PubMed] [Google Scholar]
- 1100.Krishnamurty HG, Simpson FJ. Journal of Biological Chemistry. 1970;245:1467. [PubMed] [Google Scholar]
- 1101.Simpson FJ, Talbot G, Westlake DWS. Biochem. Biophys. Res. Commun. 1960;2:15. doi: 10.1016/0006-291x(60)90255-2. [DOI] [PubMed] [Google Scholar]
- 1102.Baghel S, Baghel S Singh. World Journal of Pharmacy and Pharmaceutical Sciences. 2012;1:146. [Google Scholar]
- 1103.Bhattaram VA, Graefe U, Kohlert C, Veit M, Derendorf H. Phytomedicine. 2002;9:1. doi: 10.1078/1433-187x-00210. [DOI] [PubMed] [Google Scholar]
- 1104.Russo M, Spagnuolo C, Tedesco I, Bilotto S, Russo GL. Biochem. Pharmacol. 2012;83:6. doi: 10.1016/j.bcp.2011.08.010. [DOI] [PubMed] [Google Scholar]
- 1105.Vasanthi H. Current medicinal chemistry. 2012;19:2242. doi: 10.2174/092986712800229078. [DOI] [PubMed] [Google Scholar]
- 1106.Chirumbolo S. Integrative Cancer Therapies. 2013;12:97. doi: 10.1177/1534735412448215. [DOI] [PubMed] [Google Scholar]
- 1107.Dajas F. J. Ethnopharmacol. 2012;143:383. doi: 10.1016/j.jep.2012.07.005. [DOI] [PubMed] [Google Scholar]
- 1108.Kallianos AG, Petrakis PL, Shetlar MR, Wender SH. Arch. Biochem. Biophys. 1959;81:430. doi: 10.1016/0003-9861(59)90222-x. [DOI] [PubMed] [Google Scholar]
- 1109.Bruggeman YE. Organic Process Research & Development. 2002;6:562. [Google Scholar]
- 1110.Hund HK, Breuer J, Lingens F, Huttermann J, Kappl R, Fetzner S. Eur. J. Biochem. 1999;263:871. doi: 10.1046/j.1432-1327.1999.00574.x. [DOI] [PubMed] [Google Scholar]
- 1111.Fusetti F, Schroter KH, Steiner RA, van Noort PI, Pijning T, Rozeboom HJ, Kalk KH, Egmond MR, Dijkstra BW. Structure. 2002;10:259. doi: 10.1016/s0969-2126(02)00704-9. [DOI] [PubMed] [Google Scholar]
- 1112.Tranchimand S, Ertel G, Gaydou V, Gaudin C, Tron T, Iacazio G. Biochimie. 2008;90:781. doi: 10.1016/j.biochi.2007.12.004. [DOI] [PubMed] [Google Scholar]
- 1113.Bowater L, Fairhurst SA, Just VJ, Bornemann S. Febs Letters. 2004;557:45. doi: 10.1016/s0014-5793(03)01439-x. [DOI] [PubMed] [Google Scholar]
- 1114.Barney BM, Schaab MR, LoBrutto R, Francisco WA. Protein Expression and Purification. 2004;35:131. doi: 10.1016/j.pep.2004.01.005. [DOI] [PubMed] [Google Scholar]
- 1115.Merkens H, Sielker S, Rose K, Fetzner S. Arch. Microbiol. 2007;187:475. doi: 10.1007/s00203-007-0215-z. [DOI] [PubMed] [Google Scholar]
- 1116.Gopal B, Madan LL, Betz SF, Kossiakoff AA. Biochemistry. 2005;44:193. doi: 10.1021/bi0484421. [DOI] [PubMed] [Google Scholar]
- 1117.Oka T, Simpson FJ. Biochem. Biophys. Res. Commun. 1971;43:1. doi: 10.1016/s0006-291x(71)80076-1. [DOI] [PubMed] [Google Scholar]
- 1118.Schaab MR, Barney BM, Francisco WA. Biochemistry. 2006;45:1009. doi: 10.1021/bi051571c. [DOI] [PubMed] [Google Scholar]
- 1119.Merkens H, Kappl R, Jakob RP, Schmid FX, Fetzner S. Biochemistry. 2008;47:12185. doi: 10.1021/bi801398x. [DOI] [PubMed] [Google Scholar]
- 1120.Oka T, Simpson FJ, Krishnamurty HG. Can. J. Microbiol. 1972;18:493. doi: 10.1139/m72-076. [DOI] [PubMed] [Google Scholar]
- 1121.Kooter IM, Steiner RA, Dijkstra BW, van Noort PI, Egmond MR, Huber M. Eur. J. Biochem. 2002;269:2971. doi: 10.1046/j.1432-1033.2002.02973.x. [DOI] [PubMed] [Google Scholar]
- 1122.Steiner RA, Meyer-Klaucke W, Dijkstra BW. Biochemistry. 2002;41:7963. doi: 10.1021/bi015974y. [DOI] [PubMed] [Google Scholar]
- 1123.Simpson FJ, Narasimhachari N, Westlake DWS. Can. J. Microbiol. 1963;9:15. [Google Scholar]
- 1124.Steiner RA, Kalk KH, Dijkstra BW. Proceedings of the National Academy of Sciences of the United States of America. 2002;99:16625. doi: 10.1073/pnas.262506299. [DOI] [PMC free article] [PubMed] [Google Scholar]
- 1125.Steiner RA, Kooter IM, Dijkstra BW. Biochemistry. 2002;41:7955. doi: 10.1021/bi0159736. [DOI] [PubMed] [Google Scholar]
- 1126.Siegbahn PEM. Inorganic Chemistry. 2004;43:5944. doi: 10.1021/ic0498541. [DOI] [PubMed] [Google Scholar]
- 1127.Balogh-Hergovich E, Speier G. J. Org. Chem. 2001;66:7974. doi: 10.1021/jo015517n. [DOI] [PubMed] [Google Scholar]
- 1128.Barhacs L, Kaizer J, Speier G. J. Org. Chem. 2000;65:3449. doi: 10.1021/jo991926w. [DOI] [PubMed] [Google Scholar]
- 1129.Kaizer J, Speier G. Journal of Molecular Catalysis a-Chemical. 2001;171:33. [Google Scholar]
- 1130.Pap J, Kaizer J, Speier G. React. Kinet. Catal. Lett. 2005;85:115. [Google Scholar]
- 1131.Barhacs L, Kaizer J, Speier G. Journal of Molecular Catalysis a-Chemical. 2001;172:117. [Google Scholar]
- 1132.Kaizer J, Balogh-Hergovich E, Czaun M, Csay T, Speier G. Coordination Chemistry Reviews. 2006;250:2222. [Google Scholar]
- 1133.Barhacs L, Kaizer J, Pap J, Speier G. Inorg. Chim. Acta. 2001;320:83. [Google Scholar]
- 1134.Balogh-Hergovich E, Kaizer J, Speier G. Journal of Molecular Catalysis a- Chemical. 2000;159:215. [Google Scholar]
- 1135.Pap JS, Kaizer J, Speier G. Coordination Chemistry Reviews. 2010;254:781. [Google Scholar]
- 1136.Balogh-Hergovich E, Kaizer J, Speier G, Fulop V, Parkanyi L. Inorganic Chemistry. 1999;38:3787. [Google Scholar]
- 1137.Balogh-Hergovich E, Kaizer J, Pap J, Speier G, Huttner G, Zsolnai L. Eur. J. Inorg. Chem. 2002:2287. [Google Scholar]
- 1138.Pietrangeli P, Morpurgo L, Mondovì B, Luisa Di Paolo M, Rigo A. In: Copper Amine Oxidases: Structures, Catalytic Mechanism and Role in Pathophysiology. Mondovi BF, Giovanni, editors. Boca Raton: CRC Press; 2009. [Google Scholar]
- 1139.Medda R, Bellelli A, Pec P, Federico R, Cona A, Floris G. In: Copper Amine Oxidases: Structures, Catalytic Mechanism and Role in Pathophysiology. Mondovi BF, Giovanni, editors. Boca Raton: CRC Press; 2009. [Google Scholar]
- 1140.Boyce S, Tipton KF, O'Sullivan MI, Davey GP, Motherway Gildea M, McDonald AG, Olivieri A, O'Sullivan J. In: Copper Amine Oxidases: Structures, Catalytic Mechanism and Role in Pathophysiology. Mondovi BF, Giovanni, editors. Boca Raton: CRC Press; 2009. [Google Scholar]
- 1141.Boomsma F, van den Meiracker AH, Toninello A. In: Copper Amine Oxidases: Structures, Catalytic Mechanism and Role in Pathophysiology. Mondovi BF, Giovanni, editors. Boca Raton: CRC Press; 2009. [Google Scholar]
- 1142.Agnieszka Fogel W, Toporowska-Kowalska E, Stasiak A. In: Copper Amine Oxidases: Structures, Catalytic Mechanism and Role in Pathophysiology. Mondovi BF, Giovanni, editors. Boca Raton: CRC Press; 2009. [Google Scholar]
- 1143.Boor P, Unzeta M, Salmi M, Jalkanen S. In: Copper Amine Oxidases: Structures, Catalytic Mechanism and Role in Pathophysiology. Mondovi BF, Giovanni, editors. Boca Raton: CRC Press; 2009. [Google Scholar]
- 1144.Carpéné C. In: Copper Amine Oxidases: Structures, Catalytic Mechanism and Role in Pathophysiology. Mondovi BF, Giovanni, editors. CRC Press; 2009. [Google Scholar]
- 1145.Masini E, Raimondi L. In: Copper Amine Oxidases: Structures, Catalytic Mechanism and Role in Pathophysiology. Mondovi BF, Giovanni, editors. Boca Raton: CRCPress; 2009. [Google Scholar]
- 1146.Mateescu MA, Nadeau R. In: Copper Amine Oxidases: Structures, Catalytic Mechanism and Role in Pathophysiology. Mondovi BF, Giovanni, editors. Boca Raton: CRCPress; 2009. [Google Scholar]
- 1147.Parsons MR, Convery MA, Wilmot CM, Yadav KDS, Blakely V, Corner AS, Phillips SEV, McPherson MJ, Knowles PF. Structure. 1995;3:1171. doi: 10.1016/s0969-2126(01)00253-2. [DOI] [PubMed] [Google Scholar]
- 1148.Freeman HC, Guss JM, Kumar V, McIntire WS, Zubak VM. Acta Crystallogr. Sect. D-Biol. Crystallogr. 1996;52:197. doi: 10.1107/S0907444995007529. [DOI] [PubMed] [Google Scholar]
- 1149.Cai DY, Klinman JP. Biochemistry. 1994;33:7647. doi: 10.1021/bi00190a019. [DOI] [PubMed] [Google Scholar]
- 1150.Green J, Haywood GW, Large PJ. Biochem. J. 1983;211:481. doi: 10.1042/bj2110481. [DOI] [PMC free article] [PubMed] [Google Scholar]
- 1151.Mann PJG. Biochem. J. 1955;59:609. doi: 10.1042/bj0590609. [DOI] [PMC free article] [PubMed] [Google Scholar]
- 1152.Rinaldi A, Floris G, Finazziagro A. Eur. J. Biochem. 1982;127:417. doi: 10.1111/j.1432-1033.1982.tb06888.x. [DOI] [PubMed] [Google Scholar]
- 1153.Tabor CW, Tabor H, Rosenthal SM. Journal of Biological Chemistry. 1954;208:645. [PubMed] [Google Scholar]
- 1154.Mondovi B, Rotilio G, Costa MT, Finazzia A, Chiancon E, Hansen RE. Journal of Biological Chemistry. 1967;242:1160. [PubMed] [Google Scholar]
- 1155.Nymalm Y, Kidron H, Soderholm A, Viitanen L, Kaukonen K, Pihlavisto M, Smith D, Veromaa T, Airenne TT, Johnson MS, Salminen TA. Acta Crystallogr. Sect. D-Biol. Crystallogr. 2003;59:1288. doi: 10.1107/s090744490300979x. [DOI] [PubMed] [Google Scholar]
- 1156.Crabbe JC, Waight RD, Bardsley WG, Barker RW, Kelly ID, Knowles PF. Biochem. J. 1976;155:679. doi: 10.1042/bj1550679. [DOI] [PMC free article] [PubMed] [Google Scholar]
- 1157.Guss JM, Zanotti G, Salminen T. In: Copper Amine Oxidases: Structures, Catalytic Mechanism and Role in Pathophysiology. Mondovi BF, Giovanni, editors. Boca Raton: CRC Press; 2009. [Google Scholar]
- 1158.Janes SM, Palcic MM, Scaman CH, Smith AJ, Brown DE, Dooley DM, Mure M, Klinman JP. Biochemistry. 1992;31:12147. doi: 10.1021/bi00163a025. [DOI] [PubMed] [Google Scholar]
- 1159.Yasunobu KT, Ishizaki H, Minamiura N. Mol. Cell. Biochem. 1976;13:3. doi: 10.1007/BF01732392. [DOI] [PubMed] [Google Scholar]
- 1160.Moog RS, McGuirl MA, Cote CE, Dooley DM. Proceedings of the National Academy of Sciences of the United States of America. 1986;83:8435. doi: 10.1073/pnas.83.22.8435. [DOI] [PMC free article] [PubMed] [Google Scholar]
- 1161.Lobensteinverbeek CL, Jongejan JA, Frank J, Duine JA. Febs Letters. 1984;170:305. doi: 10.1016/0014-5793(84)81333-2. [DOI] [PubMed] [Google Scholar]
- 1162.Ameyama M, Hayashi M, Matsushita K, Shinagawa E, Adachi O. Agricultural and Biological Chemistry. 1984;48:561. [Google Scholar]
- 1163.Janes SM, Mu D, Wemmer D, Smith AJ, Kaur S, Maltby D, Burlingame AL, Klinman JP. Science. 1990;248:981. doi: 10.1126/science.2111581. [DOI] [PubMed] [Google Scholar]
- 1164.Mu D, Janes SM, Smith AJ, Brown DE, Dooley DM, Klinman JP. Journal of Biological Chemistry. 1992;267:7979. [PubMed] [Google Scholar]
- 1165.Cai DY, Klinman JP. Journal of Biological Chemistry. 1994;269:32039. [PubMed] [Google Scholar]
- 1166.Matsuzaki R, Fukui T, Sato H, Ozaki Y, Tanizawa K. Febs Letters. 1994;351:360. doi: 10.1016/0014-5793(94)00884-1. [DOI] [PubMed] [Google Scholar]
- 1167.Klinman JP. Biochimica Et Biophysica Acta-Proteins and Proteomics. 2003;1647:131. doi: 10.1016/s1570-9639(03)00077-3. [DOI] [PubMed] [Google Scholar]
- 1168.Mure M, Mills SA, Klinman JP. Biochemistry. 2002;41:9269. doi: 10.1021/bi020246b. [DOI] [PubMed] [Google Scholar]
- 1169.Dooley DM, McGuirl MA, Brown DE, Turowski PN, McIntire WS, Knowles PF. Nature. 1991;349:262. doi: 10.1038/349262a0. [DOI] [PubMed] [Google Scholar]
- 1170.Medda R, Padiglia A, Bellelli A, Pedersen JZ, Agro AF, Floris G. Febs Letters. 1999;453:1. doi: 10.1016/s0014-5793(99)00675-4. [DOI] [PubMed] [Google Scholar]
- 1171.Su QJ, Klinman JP. Biochemistry. 1998;37:12513. doi: 10.1021/bi981103l. [DOI] [PubMed] [Google Scholar]
- 1172.Mure M. Acc. Chem. Res. 2004;37:131. doi: 10.1021/ar9703342. [DOI] [PubMed] [Google Scholar]
- 1173.Shepard EM, Okonski KM, Dooley DM. Biochemistry. 2008;47:13907. doi: 10.1021/bi8011516. [DOI] [PMC free article] [PubMed] [Google Scholar]
- 1174.Mills SA, Klinman JP. J. Am. Chem. Soc. 2000;122:9897. [Google Scholar]
- 1175.Bollinger JA, Brown DE, Dooley DM. Biochemistry. 2005;44:11708. doi: 10.1021/bi0504310. [DOI] [PubMed] [Google Scholar]
- 1176.Wang SX, Mure M, Medzihradszky KF, Burlingame AL, Brown DE, Dooley DM, Smith AJ, Kagan HM, Klinman JP. Science. 1996;273:1078. doi: 10.1126/science.273.5278.1078. [DOI] [PubMed] [Google Scholar]
- 1177.Dove JE, Smith AJ, Kuchar J, Brown DE, Dooley DM, Klinman JP. Febs Letters. 1996;398:231. doi: 10.1016/s0014-5793(96)01245-8. [DOI] [PubMed] [Google Scholar]
- 1178.Davidson VL. Molecular Biosystems. 2011;7:29. doi: 10.1039/c005311b. [DOI] [PubMed] [Google Scholar]
- 1179.Ruggiero CE, Dooley DM. Biochemistry. 1999;38:2892. doi: 10.1021/bi9824994. [DOI] [PubMed] [Google Scholar]
- 1180.Nakamura N, Matsuzaki R, Choi YH, Tanizawa K, SandersLoehr J. Journal of Biological Chemistry. 1996;271:4718. doi: 10.1074/jbc.271.9.4718. [DOI] [PubMed] [Google Scholar]
- 1181.Ruggiero CE, Smith JA, Tanizawa K, Dooley DM. Biochemistry. 1997;36:1953. doi: 10.1021/bi9628836. [DOI] [PubMed] [Google Scholar]
- 1182.DuBois JL, Klinman JP. Biochemistry. 2005;44:11381. doi: 10.1021/bi0504759. [DOI] [PubMed] [Google Scholar]
- 1183.Samuels NM, Klinman JP. Journal of Biological Chemistry. 2006;281:21114. doi: 10.1074/jbc.M601501200. [DOI] [PubMed] [Google Scholar]
- 1184.Dove JE, Schwartz B, Williams NK, Klinman JP. Biochemistry. 2000;39:3690. doi: 10.1021/bi992225w. [DOI] [PubMed] [Google Scholar]
- 1185.DuBois JL, Klinman JP. Arch. Biochem. Biophys. 2005;433:255. doi: 10.1016/j.abb.2004.08.036. [DOI] [PubMed] [Google Scholar]
- 1186.Schwartz B, Dove JE, Klinman JP. Biochemistry. 2000;39:3699. doi: 10.1021/bi9922244. [DOI] [PubMed] [Google Scholar]
- 1187.Prabhakar R, Siegbahn PEM. J. Am. Chem. Soc. 2004;126:3996. doi: 10.1021/ja034721k. [DOI] [PubMed] [Google Scholar]
- 1188.Matsunami H, Okajima T, Hirota S, Yamaguchi H, Hori H, Mure M, Kuroda S, Tanizawa K. Biochemistry. 2004;43:2178. doi: 10.1021/bi0361923. [DOI] [PubMed] [Google Scholar]
- 1189.DuBois JL, Klinman JP. Biochemistry. 2006;45:3178. doi: 10.1021/bi052025m. [DOI] [PubMed] [Google Scholar]
- 1190.Chen ZW, Datta S, DuBois JL, Klinman JP, Mathews FS. Biochemistry. 2010;49:7393. doi: 10.1021/bi100643y. [DOI] [PMC free article] [PubMed] [Google Scholar]
- 1191.Okajima T, Kishishita S, Chiu YC, Murakawa T, Kim M, Yamaguchi H, Hirota S, Kuroda S, Tanizawa K. Biochemistry. 2005;44:12041. doi: 10.1021/bi051070r. [DOI] [PubMed] [Google Scholar]
- 1192.Samuels NM, Klinman JP. Biochemistry. 2005;44:14308. doi: 10.1021/bi051176m. [DOI] [PubMed] [Google Scholar]
- 1193.Murray JM, Saysell CG, Wilmot CM, Tambyrajah WS, Jaeger J, Knowles PF, Phillips SEV, McPherson MJ. Biochemistry. 1999;38:8217. doi: 10.1021/bi9900469. [DOI] [PubMed] [Google Scholar]
- 1194.Wilce MCJ, Dooley DM, Freeman HC, Guss JM, Matsunami H, McIntire WS, Ruggiero CE, Tanizawa K, Yamaguchi H. Biochemistry. 1997;36:16116. doi: 10.1021/bi971797i. [DOI] [PubMed] [Google Scholar]
- 1195.Kim M, Okajima T, Kishishita S, Yoshimura M, Kawamori A, Tanizawa K, Yamaguchi H. Nature Structural Biology. 2002;9:591. doi: 10.1038/nsb824. [DOI] [PubMed] [Google Scholar]
- 1196.Langley DB, Duff AP, Freeman HC, Guss JM. Acta Crystallographica Section F-Structural Biology and Crystallization Communications. 2006;62:1052. doi: 10.1107/S1744309106038814. [DOI] [PMC free article] [PubMed] [Google Scholar]
- 1197.Li RB, Chen LY, Cai DY, Klinman JP, Mathews FS. Acta Crystallogr. Sect. D-Biol. Crystallogr. 1997;53:364. doi: 10.1107/S0907444997000814. [DOI] [PubMed] [Google Scholar]
- 1198.Chang CM, Klema VJ, Johnson BJ, Mure M, Klinman JP, Wilmot CM. Biochemistry. 2010;49:2540. doi: 10.1021/bi901933d. [DOI] [PMC free article] [PubMed] [Google Scholar]
- 1199.Kumar V, Dooley DM, Freeman HC, Guss JM, Harvey I, McGuirl MA, Wilce MCJ, Zubak VM. Structure. 1996;4:943. doi: 10.1016/s0969-2126(96)00101-3. [DOI] [PubMed] [Google Scholar]
- 1200.Jakobsson E, Nilsson J, Ogg D, Kleywegt GJ. Acta Crystallogr. Sect. DBiol. Crystallogr. 2005;61:1550. doi: 10.1107/S0907444905028805. [DOI] [PubMed] [Google Scholar]
- 1201.Elovaara H, Kidron H, Parkash V, Nymalm Y, Bligt E, Ollikka P, Smith DJ, Pihlavisto M, Salmi M, Jalkanen S, Salminen TA. Biochemistry. 2011;50:5507. doi: 10.1021/bi200117z. [DOI] [PubMed] [Google Scholar]
- 1202.Ernberg K, McGrath AP, Peat TS, Adams TE, Xiao XW, Pham T, Newman J, McDonald IA, Collyer CA, Guss JM. Acta Crystallographica Section F-Structural Biology and Crystallization Communications. 2010;66:1572. doi: 10.1107/S1744309110041515. [DOI] [PMC free article] [PubMed] [Google Scholar]
- 1203.Lunelli M, Di Paolo ML, Biadene M, Calderone V, Battistutta R, Scarpa M, Rigo A, Zanotti G. J. Mol. Biol. 2005;346:991. doi: 10.1016/j.jmb.2004.12.038. [DOI] [PubMed] [Google Scholar]
- 1204.McGrath AP, Mithieux SM, Collyer CA, Bakhuis JG, van den Berg M, Sein A, Heinz A, Schmelzer C, Weiss AS, Guss JM. Biochemistry. 2011;50:5718. doi: 10.1021/bi200555c. [DOI] [PubMed] [Google Scholar]
- 1205.Smith MA, Pirrat P, Pearson AR, Kurtis CRP, Trinh CH, Gaule TG, Knowles PF, Phillips SEV, McPherson MJ. Biochemistry. 2010;49:1268. doi: 10.1021/bi901738k. [DOI] [PMC free article] [PubMed] [Google Scholar]
- 1206.Johnson BJ, Cohen J, Welford RW, Pearson AR, Schulten K, Klinman JP, Wilmot CM. Journal of Biological Chemistry. 2007;282:17767. doi: 10.1074/jbc.M701308200. [DOI] [PMC free article] [PubMed] [Google Scholar]
- 1207.Duff AP, Cohen AE, Ellis PJ, Hilmer K, Langley DB, Dooley DM, Freeman HC, Guss JM. Acta Crystallogr. Sect. D-Biol. Crystallogr. 2006;62:1073. doi: 10.1107/S0907444906026333. [DOI] [PubMed] [Google Scholar]
- 1208.Duff AP, Cohen AE, Ellis PJ, Kuchar JA, Langley DB, Shepard EM, Dooley DM, Freeman HC, Guss JM. Biochemistry. 2003;42:15148. doi: 10.1021/bi035338v. [DOI] [PubMed] [Google Scholar]
- 1209.Airenne TT, Nymalm Y, Kidron H, Smith DJ, Pihlavisto M, Salmi M, Jalkanen S, Johnson MS, Salminen TA. Protein Sci. 2005;14:1964. doi: 10.1110/ps.051438105. [DOI] [PMC free article] [PubMed] [Google Scholar]
- 1210.McGrath AP, Caradoc-Davies T, Collyer CA, Guss JM. Biochemistry. 2010;49:8316. doi: 10.1021/bi1010915. [DOI] [PubMed] [Google Scholar]
- 1211.McGrath AP, Hilmer KM, Collyer CA, Shepard EM, Elmore BO, Brown DE, Dooley DM, Guss JM. Biochemistry. 2009;48:9810. doi: 10.1021/bi9014192. [DOI] [PMC free article] [PubMed] [Google Scholar]
- 1212.Murray JM, Kurtis CR, Tambyrajah W, Saysell CG, Wilmot CM, Parsons MR, Phillips SEV, Knowles PF, McPherson MJ. Biochemistry. 2001;40:12808. doi: 10.1021/bi011187p. [DOI] [PubMed] [Google Scholar]
- 1213.Chiu YC, Okajima T, Murakawa T, Uchida M, Taki M, Hirota S, Kim M, Yamaguchi H, Kawano Y, Kamiya N, Kuroda S, Hayashi H, Yamamoto Y, Tanizawa K. Biochemistry. 2006;45:4105. doi: 10.1021/bi052464l. [DOI] [PubMed] [Google Scholar]
- 1214.Wilmot CM, Murray JM, Alton G, Parsons MR, Convery MA, Blakeley V, Corner AS, Palcic MM, Knowles PF, McPherson MJ, Phillips SEV. Biochemistry. 1997;36:1608. doi: 10.1021/bi962205j. [DOI] [PubMed] [Google Scholar]
- 1215.Taki M, Murakawa T, Nakamoto T, Uchida M, Hayashi H, Tanizawa K, Yamamoto Y, Okajima T. Biochemistry. 2008;47:7726. doi: 10.1021/bi800623f. [DOI] [PubMed] [Google Scholar]
- 1216.Nyugen YH, Ernberg KE, Guss JM. [Google Scholar]
- 1217.Murakawa T, Okajima T, Kuroda S, Nakamoto T, Taki M, Yamamoto Y, Hayashi H, Tanizawa K. Biochem. Biophys. Res. Commun. 2006;342:414. doi: 10.1016/j.bbrc.2006.01.150. [DOI] [PubMed] [Google Scholar]
- 1218.Wilmot CM, Saysell CG, Blessington A, Conn DA, Kurtis CR, McPherson MJ, Knowles PF, Phillips SEV. Febs Letters. 2004;576:301. doi: 10.1016/j.febslet.2004.09.031. [DOI] [PubMed] [Google Scholar]
- 1219.Langley DB, Trambaiolo DM, Duff AP, Dooley DM, Freeman HC, Guss JM. Acta Crystallographica Section F-Structural Biology and Crystallization Communications. 2008;64:577. doi: 10.1107/S174430910801556X. [DOI] [PMC free article] [PubMed] [Google Scholar]
- 1220.Murakawa T, Okajima T, Taki M, Yamamoto Y, Kuroda S, Hayashi H, Tanizawa K. [Google Scholar]
- 1221.O'Connell KM, Langley DB, Shepard EM, Duff AP, Jeon HB, Sun G, Freeman HC, Guss JM, Sayre LM, Dooley DM. Biochemistry. 2004;43:10965. doi: 10.1021/bi0492004. [DOI] [PubMed] [Google Scholar]
- 1222.Contakes SM, Juda GA, Langley DB, Halpern-Manners NW, Duff AP, Dunn AR, Gray HB, Dooley DM, Guss JM, Freeman HC. Proceedings of the National Academy of Sciences of the United States of America. 2005;102:13451. doi: 10.1073/pnas.0506336102. [DOI] [PMC free article] [PubMed] [Google Scholar]
- 1223.Langley DB, Brown DE, Cheruzel LE, Contakes SM, Duff AP, Hilmer KM, Dooley DM, Gray HB, Guss JM, Freeman HC. J. Am. Chem. Soc. 2008;130:8069. doi: 10.1021/ja801289f. [DOI] [PMC free article] [PubMed] [Google Scholar]
- 1224.Holt A, Smith DJ, Cendron L, Zanotti G, Rigo A, Di Paolo ML. Mol. Pharmacol. 2008;73:525. doi: 10.1124/mol.107.040964. [DOI] [PubMed] [Google Scholar]
- 1225.Wilmot CM, Hajdu J, McPherson MJ, Knowles PF, Phillips SEV. Science. 1999;286:1724. doi: 10.1126/science.286.5445.1724. [DOI] [PubMed] [Google Scholar]
- 1226.Kataoka M, Oya H, Tominaga A, Otsu M, Okajima T, Tanizawa K, Yamaguchi H. Journal of Synchrotron Radiation. 2011;18:58. doi: 10.1107/S0909049510034989. [DOI] [PMC free article] [PubMed] [Google Scholar]
- 1227.Kishishita S, Okajima T, Kim M, Yamaguchi H, Hirota S, Suzuki S, Kuroda S, Tanizawa K, Mure M. J. Am. Chem. Soc. 2003;125:1041. doi: 10.1021/ja017899k. [DOI] [PubMed] [Google Scholar]
- 1228.Duff AP, Trambaiolo DM, Cohen AE, Ellis PJ, Juda GA, Shepard EM, Langley DB, Dooley DM, Freeman HC, Guss JM. J. Mol. Biol. 2004;344:599. doi: 10.1016/j.jmb.2004.09.075. [DOI] [PubMed] [Google Scholar]
- 1229.Pirrat P, Smith MA, Pearson AR, McPherson MJ, Phillips SEV. Acta Crystallographica Section F-Structural Biology and Crystallization Communications. 2008;64:1105. doi: 10.1107/S1744309108036373. [DOI] [PMC free article] [PubMed] [Google Scholar]
- 1230.Klema VJ, Johnson BJ, Klinman JP, Wilmot CM. Acta Crystallographica Section F-Structural Biology and Crystallization Communications. 2012;68:501. doi: 10.1107/S1744309112012857. [DOI] [PMC free article] [PubMed] [Google Scholar]
- 1231.Chen ZW, Schwartz B, Williams NK, Li RB, Klinman JP, Mathews FS. Biochemistry. 2000;39:9709. doi: 10.1021/bi000639f. [DOI] [PubMed] [Google Scholar]
- 1232.Moody PCE, Cooper RA. [Google Scholar]
- 1233.Moore RH, Spies MA, Culpepper MB, Murakawa T, Hirota S, Okajima T, Tanizawa K, Mure M. J. Am. Chem. Soc. 2007;129:11524. doi: 10.1021/ja0731165. [DOI] [PubMed] [Google Scholar]
- 1234.Klema VJ, Wilmot CM. International Journal of Molecular Sciences. 2012;13:5375. doi: 10.3390/ijms13055375. [DOI] [PMC free article] [PubMed] [Google Scholar]
- 1235.Yamada H, Mason HS, Yasunobu K, Yamano T. Nature. 1963;198:1092. doi: 10.1038/1981092a0. [DOI] [PubMed] [Google Scholar]
- 1236.Suzuki S, Sakurai T, Nakahara A, Oda O, Manabe T, Okuyama T. FEBS LETTERS. 1980;116:17. doi: 10.1016/0014-5793(80)80519-9. [DOI] [PubMed] [Google Scholar]
- 1237.Scott RA, Dooley DM. J. Am. Chem. Soc. 1985;107:4348. [Google Scholar]
- 1238.McCracken J, Peisach J, Dooley DM. J. Am. Chem. Soc. 1987;109:4064. [Google Scholar]
- 1239.Ghosh S, Cirera J, Vance MA, Ono T, Fujisawa K, Solomon EI. J. Am. Chem. Soc. 2008;130:16262. doi: 10.1021/ja8044986. [DOI] [PMC free article] [PubMed] [Google Scholar]
- 1240.Ling KQ, Sayre LM. J. Am. Chem. Soc. 2005;127:4777. doi: 10.1021/ja0455603. [DOI] [PubMed] [Google Scholar]
- 1241.Rudolf M, Kroneck PMH. In: Biogeochemical Cycles of Elements. Sigel A, Sigel H, Sigel RKO, editors. Vol. 43 2005. [Google Scholar]
- 1242.Einsle O. Klotz MG, Stein LY. Methods in Enzymology, Vol 46: Research on Nitrification and Related Processes, Pt B. Vol. 496. 2011. [DOI] [PubMed] [Google Scholar]
- 1243.Tavares P, Pereira AS, Moura JJG, Moura I. J. Inorg. Biochem. 2006;100:2087. doi: 10.1016/j.jinorgbio.2006.09.003. [DOI] [PubMed] [Google Scholar]
- 1244.Zumft WG, Kroneck PMH. Advances in Microbial Physiology. 2007;52:107. doi: 10.1016/S0065-2911(06)52003-X. [DOI] [PubMed] [Google Scholar]
- 1245.Berks BC, Ferguson SJ, Moir JWB, Richardson DJ. Biochimica Et Biophysica Acta-Bioenergetics. 1995;1232:97. doi: 10.1016/0005-2728(95)00092-5. [DOI] [PubMed] [Google Scholar]
- 1246.Antonyuk SV, Strange RW, Sawers G, Eady RR, Hasnain SS. Proceedings of the National Academy of Sciences of the United States of America. 2005;102:12041. doi: 10.1073/pnas.0504207102. [DOI] [PMC free article] [PubMed] [Google Scholar]
- 1247.Wijma HJ, Canters GW, de Vries S, Verbeet MP. Biochemistry. 2004;43:10467. doi: 10.1021/bi0496687. [DOI] [PubMed] [Google Scholar]
- 1248.Ghosh S, Dey A, Usov OM, Sun Y, Grigoryants VM, Scholes CP, Solomon EI. J. Am. Chem. Soc. 2007;129:10310. doi: 10.1021/ja072841c. [DOI] [PMC free article] [PubMed] [Google Scholar]
- 1249.Godden JW, Turley S, Teller DC, Adman ET, Liu MY, Payne WJ, Legall J. Science. 1991;253:438. doi: 10.1126/science.1862344. [DOI] [PubMed] [Google Scholar]
- 1250.Murphy MEP, Turley S, Adman ET. Journal of Biological Chemistry. 1997;272:28455. doi: 10.1074/jbc.272.45.28455. [DOI] [PubMed] [Google Scholar]
- 1251.Boulanger MJ, Kukimoto M, Nishiyama M, Horinouchi S, Murphy MEP. Journal of Biological Chemistry. 2000;275:23957. doi: 10.1074/jbc.M001859200. [DOI] [PubMed] [Google Scholar]
- 1252.Kataoka K, Furusawa H, Takagi K, Yamaguchi K, Suzuki S. J. Biochem. 2000;127:345. doi: 10.1093/oxfordjournals.jbchem.a022613. [DOI] [PubMed] [Google Scholar]
- 1253.Zhao YW, Lukoyanov DA, Toropov YV, Wu K, Shapleigh JP, Scholes CP. Biochemistry. 2002;41:7464. doi: 10.1021/bi0256274. [DOI] [PubMed] [Google Scholar]
- 1254.Ghosh S, Dey A, Sun Y, Scholes CP, Solomon EI. J. Am. Chem. Soc. 2009;131:277. doi: 10.1021/ja806873e. [DOI] [PMC free article] [PubMed] [Google Scholar]
- 1255.Leferink NGH, Han C, Antonyuk SV, Heyes DJ, Rigby SEJ, Hough MA, Eady RR, Scrutton NS, Hasnain SS. Biochemistry. 2011;50:4121. doi: 10.1021/bi200246f. [DOI] [PubMed] [Google Scholar]
- 1256.Jacobson F, Pistorius A, Farkas D, De Grip W, Hansson O, Sjolin L, Neutze R. Journal of Biological Chemistry. 2007;282:6347. doi: 10.1074/jbc.M605746200. [DOI] [PubMed] [Google Scholar]
- 1257.Wijma HJ, Boulanger MJ, Molon A, Fittipaldi M, Huber M, Murphy MEP, Verbeet MP, Canters GW. Biochemistry. 2003;42:4075. doi: 10.1021/bi027270+. [DOI] [PubMed] [Google Scholar]
- 1258.Dodd FE, Hasnain SS, Abraham ZHL, Eady RR, Smith BE. Acta Crystallogr. Sect. D-Biol. Crystallogr. 1997;53:406. doi: 10.1107/S0907444997002667. [DOI] [PubMed] [Google Scholar]
- 1259.Barrett ML, Harris RL, Antonyuk S, Hough MA, Ellis MJ, Sawers G, Eady RR, Hasnain SS. Biochemistry. 2004;43:16311. doi: 10.1021/bi048682g. [DOI] [PubMed] [Google Scholar]
- 1260.Tocheva EI, Rosell FI, Mauk AG, Murphy MEP. Science. 2004;304:867. doi: 10.1126/science.1095109. [DOI] [PubMed] [Google Scholar]
- 1261.Boulanger MJ, Murphy MEP. J. Mol. Biol. 2002;315:1111. doi: 10.1006/jmbi.2001.5251. [DOI] [PubMed] [Google Scholar]
- 1262.Adman ET, Godden JW, Turley S. Journal of Biological Chemistry. 1995;270:27458. doi: 10.1074/jbc.270.46.27458. [DOI] [PubMed] [Google Scholar]
- 1263.Boulanger MJ, Murphy MEP. Biochemistry. 2001;40:9132. doi: 10.1021/bi0107400. [DOI] [PubMed] [Google Scholar]
- 1264.Boulanger MJ, Murphy MEP. Protein Sci. 2003;12:248. doi: 10.1110/ps.0224503. [DOI] [PMC free article] [PubMed] [Google Scholar]
- 1265.Tocheva EI, Rosell FI, Mauk AG, Murphy MEP. Biochemistry. 2007;46:12366. doi: 10.1021/bi701205j. [DOI] [PubMed] [Google Scholar]
- 1266.Usov OM, Sun Y, Grigoryants VM, Shapleigh JP, Scholes CP. J. Am. Chem. Soc. 2006;128:13102. doi: 10.1021/ja056166n. [DOI] [PubMed] [Google Scholar]
- 1267.Merkle AC, Lehnert N. Inorganic Chemistry. 2009;48:11504. doi: 10.1021/ic9018376. [DOI] [PubMed] [Google Scholar]
- 1268.Goldsmith RH, Tabares LC, Kostrz D, Dennison C, Aartsma TJ, Canters GW, Moerner WE. Proceedings of the National Academy of Sciences of the United States of America. 2011;108:17269. doi: 10.1073/pnas.1113572108. [DOI] [PMC free article] [PubMed] [Google Scholar]
- 1269.Wijma HJ, Jeuken LJC, Verbeet MP, Armstrong FA, Canters GW. Journal of Biological Chemistry. 2006;281:16340. doi: 10.1074/jbc.M601610200. [DOI] [PubMed] [Google Scholar]
- 1270.Johnston HS. J. Chem. Phys. 1951;19:663. [Google Scholar]
- 1271.Ravishankara AR, Daniel JS, Portmann RW. Science. 2009;326:123. doi: 10.1126/science.1176985. [DOI] [PubMed] [Google Scholar]
- 1272.Bates B, Kundzewicz ZW, Wu S, Arnell N, Burkett V, Döll P, Gwary D, Hanson C, Heij B, Jiménez B, Kaser G, Kitoh A, Kovats S, Kumar P, Magadza C, Martino D, Mata LJ, Medany M, Miller K, Oki T, Osman B, Palutikof J, Prowse T, Pulwarty R, Räisänen J, Renwick J, Tubiello F, Wood R, Zhao ZC, Arblaster J, Betts R, Dai A, Milly C, Mortsch L, Nurse L, Payne R, Pinskwar I, Wilbanks T. In: TECHNICALPAPER ON CLIMATE CHANGE AND WATER ed. Secretariat I, editor. 2008. [Google Scholar]
- 1273.Richardson D, Felgate H, Watmough N, Thomson A, Baggs E. Trends Biotechnol. 2009;27:388. doi: 10.1016/j.tibtech.2009.03.009. [DOI] [PubMed] [Google Scholar]
- 1274.Montzka SA, Dlugokencky EJ, Butler JH. Nature. 2011;476:43. doi: 10.1038/nature10322. [DOI] [PubMed] [Google Scholar]
- 1275.Iwasaki H, Saigo T, Matsubara T. Plant and Cell Physiology. 1980;21:1573. doi: 10.1093/pcp/21.8.1573. [DOI] [PubMed] [Google Scholar]
- 1276.Matsubara T, Frunzke K, Zumft WG. J. Bacteriol. 1982;149:816. doi: 10.1128/jb.149.3.816-823.1982. [DOI] [PMC free article] [PubMed] [Google Scholar]
- 1277.Zumft WG, Matsubara T. Febs Letters. 1982;148:107. [Google Scholar]
- 1278.Coyle CL, Zumft WG, Kroneck PMH, Korner H, Jakob W. Eur. J. Biochem. 1985;153:459. doi: 10.1111/j.1432-1033.1985.tb09324.x. [DOI] [PubMed] [Google Scholar]
- 1279.Michalski WP, Hein DH, Nicholas DJD. Biochimica Et Biophysica Acta. 1986;872:50. [Google Scholar]
- 1280.Snyder SW, Hollocher TC. Journal of Biological Chemistry. 1987;262:6515. [PubMed] [Google Scholar]
- 1281.Teraguchi S, Hollocher TC. Journal of Biological Chemistry. 1989;264:1972. [PubMed] [Google Scholar]
- 1282.Hulse CL, Averill BA. Biochem. Biophys. Res. Commun. 1990;166:729. doi: 10.1016/0006-291x(90)90870-s. [DOI] [PubMed] [Google Scholar]
- 1283.Soohoo CK, Hollocher TC. Journal of Biological Chemistry. 1991;266:2203. [PubMed] [Google Scholar]
- 1284.Berks BC, Baratta D, Richardson DJ, Ferguson SJ. Eur. J. Biochem. 1993;212:467. doi: 10.1111/j.1432-1033.1993.tb17683.x. [DOI] [PubMed] [Google Scholar]
- 1285.Hole UH, Vollack KU, Zumft WG, Eisenmann E, Siddiqui RA, Friedrich B, Kroneck PMH. Arch. Microbiol. 1996;165:55. doi: 10.1007/s002030050296. [DOI] [PubMed] [Google Scholar]
- 1286.Ferretti S, Grossmann JG, Hasnain SS, Eady RR, Smith BE. Eur. J. Biochem. 1999;259:651. doi: 10.1046/j.1432-1327.1999.00082.x. [DOI] [PubMed] [Google Scholar]
- 1287.Yamaguchi K, Kawamura A, Ogawa H, Suzuki S. J. Biochem. 2003;134:853. doi: 10.1093/jb/mvg211. [DOI] [PubMed] [Google Scholar]
- 1288.Prudencio M, Pereira AS, Tavares P, Besson S, Cabrito I, Brown K, Samyn B, Devreese B, Van Beeumen J, Rusnak F, Fauque G, Moura JJG, Tegoni M, Cambillau C, Moura I. Biochemistry. 2000;39:3899. doi: 10.1021/bi9926328. [DOI] [PubMed] [Google Scholar]
- 1289.Rasmussen T, Berks BC, Sanders-Loehr J, Dooley DM, Zumft WG, Thomson AJ. Biochemistry. 2000;39:12753. doi: 10.1021/bi001811i. [DOI] [PubMed] [Google Scholar]
- 1290.Rasmussen T, Berks BC, Butt JN, Thomson AJ. Biochem. J. 2002;364:807. doi: 10.1042/BJ20020055. [DOI] [PMC free article] [PubMed] [Google Scholar]
- 1291.Fujita K, Chan JM, Bollinger JA, Alvarez ML, Dooley DM. J. Inorg. Biochem. 2007;101:1836. doi: 10.1016/j.jinorgbio.2007.06.029. [DOI] [PubMed] [Google Scholar]
- 1292.Brown K, Djinovic-Carugo K, Haltia T, Cabrito I, Saraste M, Moura JJG, Moura I, Tegoni M, Cambillau C. Journal of Biological Chemistry. 2000;275:41133. doi: 10.1074/jbc.M008617200. [DOI] [PubMed] [Google Scholar]
- 1293.Zumft WG, Dreusch A, Lochelt S, Cuypers H, Friedrich B, Schneider B. Eur. J. Biochem. 1992;208:31. doi: 10.1111/j.1432-1033.1992.tb17156.x. [DOI] [PubMed] [Google Scholar]
- 1294.Kroneck PMH, Antholine WA, Riester J, Zumft WG. Febs Letters. 1989;248:212. doi: 10.1016/0014-5793(89)80464-8. [DOI] [PubMed] [Google Scholar]
- 1295.Paraskevopoulos K, Antonyuk SV, Sawers RG, Eady RR, Hasnain SS. J. Mol. Biol. 2006;362:55. doi: 10.1016/j.jmb.2006.06.064. [DOI] [PubMed] [Google Scholar]
- 1296.Pomowski A, Zumft WG, Kroneck PMH, Einsle O. Nature. 2011;477:234. doi: 10.1038/nature10332. [DOI] [PubMed] [Google Scholar]
- 1297.Viebrock A, Zumft WG. J. Bacteriol. 1987;169:4577. doi: 10.1128/jb.169.10.4577-4580.1987. [DOI] [PMC free article] [PubMed] [Google Scholar]
- 1298.Zumft WG. J. Mol. Microbiol. Biotechnol. 2005;10:154. doi: 10.1159/000091562. [DOI] [PubMed] [Google Scholar]
- 1299.Zumft WG, Viebrocksambale A, Braun C. Eur. J. Biochem. 1990;192:591. doi: 10.1111/j.1432-1033.1990.tb19265.x. [DOI] [PubMed] [Google Scholar]
- 1300.Heikkila MP, Honisch U, Wunsch P, Zumft WG. J. Bacteriol. 2001;183:1663. doi: 10.1128/JB.183.5.1663-1671.2001. [DOI] [PMC free article] [PubMed] [Google Scholar]
- 1301.Viebrock A, Zumft WG. J. Bacteriol. 1988;170:4658. doi: 10.1128/jb.170.10.4658-4668.1988. [DOI] [PMC free article] [PubMed] [Google Scholar]
- 1302.Dooley DM, McGuirl MA, Rosenzweig AC, Landin JA, Scott RA, Zumft WG, Devlin F, Stephens PJ. Inorganic chemistry. 1991;30:3006. [Google Scholar]
- 1303.Dreusch A, Burgisser DM, Heizmann CW, Zumft WG. Biochimica Et Biophysica Acta-Bioenergetics. 1997;1319:311. doi: 10.1016/s0005-2728(96)00174-0. [DOI] [PubMed] [Google Scholar]
- 1304.McGuirl MA, Bollinger JA, Cosper N, Scott RA, Dooley DM. Journal of Biological Inorganic Chemistry. 2001;6:189. doi: 10.1007/s007750000190. [DOI] [PubMed] [Google Scholar]
- 1305.Wunsch P, Zumft WG. J. Bacteriol. 2005;187:1992. doi: 10.1128/JB.187.6.1992-2001.2005. [DOI] [PMC free article] [PubMed] [Google Scholar]
- 1306.Wunsch P, Korner H, Neese F, van Spanning RJM, Kroneck PMH, Zumft WG. Febs Letters. 2005;579:4605. doi: 10.1016/j.febslet.2005.07.023. [DOI] [PubMed] [Google Scholar]
- 1307.Boogerd FC, Verseveld HWV, Stouthamer AH. FEBS LETTERS. 1980;113:279. doi: 10.1016/0014-5793(80)80609-0. [DOI] [PubMed] [Google Scholar]
- 1308.Richardson DJ, Bell LC, McEwan AG, Jackson JB, Ferguson SJ. Eur. J. Biochem. 1991;199:677. doi: 10.1111/j.1432-1033.1991.tb16170.x. [DOI] [PubMed] [Google Scholar]
- 1309.Dell'Acqua S, Pauleta SR, Monzani E, Pereira AS, Casella L, Moura JJG, Moura I. Biochemistry. 2008;47:10852. doi: 10.1021/bi801375q. [DOI] [PubMed] [Google Scholar]
- 1310.Rasmussen T, Brittain T, Berks BC, Watmough NJ, Thomson AJ. Dalton Transactions. 2005:3501. doi: 10.1039/b501846c. [DOI] [PubMed] [Google Scholar]
- 1311.Zhang CS, Hollocher TC. Biochimica Et Biophysica Acta. 1993;1142:253. doi: 10.1016/0005-2728(71)90038-7. [DOI] [PubMed] [Google Scholar]
- 1312.Fujita K, Hirasawa-Fujita M, Brown DE, Obara Y, Ijima F, Kohzuma T, Dooley DM. J. Inorg. Biochem. 2012;115:163. doi: 10.1016/j.jinorgbio.2012.07.013. [DOI] [PubMed] [Google Scholar]
- 1313.Mattila K, Haltia T. Proteins-Structure Function and Bioinformatics. 2005;59:708. doi: 10.1002/prot.20437. [DOI] [PubMed] [Google Scholar]
- 1314.Dell'Acqua S, Moura I, Moura JJG, Pauleta SR. Journal of Biological Inorganic Chemistry. 2011;16:1241. doi: 10.1007/s00775-011-0812-9. [DOI] [PubMed] [Google Scholar]
- 1315.Riester J, Zumft WG, Kroneck PMH. Eur. J. Biochem. 1989;178:751. doi: 10.1111/j.1432-1033.1989.tb14506.x. [DOI] [PubMed] [Google Scholar]
- 1316.Zumft WG, Coyle CL, Frunzke K. Febs Letters. 1985;183:240. [Google Scholar]
- 1317.Ghosh S, Gorelsky SI, Chen P, Cabrito I, Moura JJG, Moura I, Solomon EI. J. Am. Chem. Soc. 2003;125:15708. doi: 10.1021/ja038344n. [DOI] [PubMed] [Google Scholar]
- 1318.Alvarez ML, Ai JY, Zumft W, Sanders-Loehr J, Dooley DM. J. Am. Chem. Soc. 2001;123:576. doi: 10.1021/ja994322i. [DOI] [PubMed] [Google Scholar]
- 1319.Kristjansson JK, Hollocher TC. Journal of Biological Chemistry. 1980;255:704. [PubMed] [Google Scholar]
- 1320.Ghosh S, Gorelsky SI, George SD, Chan JM, Cabrito I, Dooley DM, Moura JJG, Moura I, Solomon EI. J. Am. Chem. Soc. 2007;129:3955. doi: 10.1021/ja068059e. [DOI] [PMC free article] [PubMed] [Google Scholar]
- 1321.Chan JM, Bollinger JA, Grewell CL, Dooley DM. J. Am. Chem. Soc. 2004;126:3030. doi: 10.1021/ja0398868. [DOI] [PubMed] [Google Scholar]
- 1322.Dell'Acqua S, Pauleta SR, Paes de Sousa PM, Monzani E, Casella L, Moura JJG, Moura I. Journal of Biological Inorganic Chemistry. 2010;15:967. doi: 10.1007/s00775-010-0658-6. [DOI] [PubMed] [Google Scholar]
- 1323.Fujita K, Dooley DM. Inorganic Chemistry. 2007;46:613. doi: 10.1021/ic061843f. [DOI] [PubMed] [Google Scholar]
- 1324.Yoshinari T, Knowles R. Biochem. Biophys. Res. Commun. 1976;69:705. doi: 10.1016/0006-291x(76)90932-3. [DOI] [PubMed] [Google Scholar]
- 1325.Sorensen J, Tiedje JM, Firestone RB. Appl. Environ. Microbiol. 1980;39:105. doi: 10.1128/aem.39.1.105-108.1980. [DOI] [PMC free article] [PubMed] [Google Scholar]
- 1326.Brown K, Tegoni M, Prudencio M, Pereira AS, Besson S, Moura JJ, Moura I, Cambillau C. Nature Structural Biology. 2000;7:191. doi: 10.1038/73288. [DOI] [PubMed] [Google Scholar]
- 1327.Haltia T, Brown K, Tegoni M, Cambillau C, Saraste M, Mattila K, Djinovic-Carugo K. Biochem. J. 2003;369:77. doi: 10.1042/BJ20020782. [DOI] [PMC free article] [PubMed] [Google Scholar]
- 1328.Kroneck PMH, Antholine WA, Riester J, Zumft WG. Febs Letters. 1988;242:70. doi: 10.1016/0014-5793(88)80987-6. [DOI] [PubMed] [Google Scholar]
- 1329.Kroneck PMH, Antholine WE, Kastrau DHW, Buse G, Steffens GCM, Zumft WG. FEBS LETTERS. 1990;268:274. doi: 10.1016/0014-5793(90)81026-k. [DOI] [PubMed] [Google Scholar]
- 1330.Chen P, Cabrito I, Moura JJG, Moura I, Solomon EI. J. Am. Chem. Soc. 2002;124:10497. doi: 10.1021/ja0205028. [DOI] [PubMed] [Google Scholar]
- 1331.Chen P, George SD, Cabrito I, Antholine WE, Moura JJG, Moura I, Hedman B, Hodgson KO, Solomon EI. J. Am. Chem. Soc. 2002;124:744. doi: 10.1021/ja0169623. [DOI] [PubMed] [Google Scholar]
- 1332.Beinert H. Eur. J. Biochem. 1997;245:521. doi: 10.1111/j.1432-1033.1997.t01-1-00521.x. [DOI] [PubMed] [Google Scholar]
- 1333.Savelieff MG, Lu Y. Journal of Biological Inorganic Chemistry. 2010;15:461. doi: 10.1007/s00775-010-0625-2. [DOI] [PubMed] [Google Scholar]
- 1334.Farrar JA, Neese F, Lappalainen P, Kroneck PMH, Saraste M, Zumft WG, Thomson AJ. J. Am. Chem. Soc. 1996;118:11501. [Google Scholar]
- 1335.Gorelsky SI, Xie X, Chen Y, Fee JA, Solomon EI. J. Am. Chem. Soc. 2006;128:16452. doi: 10.1021/ja067583i. [DOI] [PubMed] [Google Scholar]
- 1336.Charnock JM, Dreusch A, Korner H, Neese F, Nelson J, Kannt A, Michel H, Garner CD, Kroneck PMH, Zumft WG. Eur. J. Biochem. 2000;267:1368. doi: 10.1046/j.1432-1327.2000.01131.x. [DOI] [PubMed] [Google Scholar]
- 1337.Williams KR, Gamelin DR, LaCroix LB, Houser RP, Tolman WB, Mulder TC, deVries S, Hedman B, Hodgson KO, Solomon EI. J. Am. Chem. Soc. 1997;119:613. [Google Scholar]
- 1338.Dell'Acqua S, Pauleta SR, Moura JJG, Moura I. Philosophical Transactions of the Royal Society B-Biological Sciences. 2012;367:1204. doi: 10.1098/rstb.2011.0311. [DOI] [PMC free article] [PubMed] [Google Scholar]
- 1339.Gorelsky SI, Ghosh S, Solomon EI. J. Am. Chem. Soc. 2006;128:278. doi: 10.1021/ja055856o. [DOI] [PubMed] [Google Scholar]
- 1340.Bar-Nahum I, Gupta AK, Huber SM, Ertem MZ, Cramer CJ, Tolman WB. J. Am. Chem. Soc. 2009;131:2812. doi: 10.1021/ja808917k. [DOI] [PMC free article] [PubMed] [Google Scholar]
- 1341.Solomon EI, Xie X, Dey A. Chem. Soc. Rev. 2008;37:623. doi: 10.1039/b714577m. [DOI] [PubMed] [Google Scholar]
- 1342.Perry JJP, Shin DS, Getzoff ED, Tainer JA. Biochimica Et Biophysica Acta-Proteins and Proteomics. 2010;1804:245. doi: 10.1016/j.bbapap.2009.11.004. [DOI] [PMC free article] [PubMed] [Google Scholar]
- 1343.Seetharaman SV, Prudencio M, Karch C, Holloway SP, Borchelt DR, Hart PJ. Experimental Biology and Medicine. 2009;234:1140. doi: 10.3181/0903-MR-104. [DOI] [PMC free article] [PubMed] [Google Scholar]
- 1344.Valentine JS, Doucette PA, Potter SZ. Annu. Rev. Biochem. 2005;74:563. doi: 10.1146/annurev.biochem.72.121801.161647. [DOI] [PubMed] [Google Scholar]
- 1345.Banci L, Bertini I, Cantini F, Ciofi-Baffoni S. Cellular and Molecular Life Sciences. 2010;67:2563. doi: 10.1007/s00018-010-0330-x. [DOI] [PMC free article] [PubMed] [Google Scholar]
- 1346.Tapiero H, Townsend DM, Tew KD. Biomedicine & Pharmacotherapy. 2003;57:386. doi: 10.1016/s0753-3322(03)00012-x. [DOI] [PMC free article] [PubMed] [Google Scholar]
- 1347.Horn SJ, Vaaje-Kolstad G, Westereng B, Eijsink VGH. Biotechnology for Biofuels. 2012;5:45. doi: 10.1186/1754-6834-5-45. [DOI] [PMC free article] [PubMed] [Google Scholar]
- 1348.Quinlan RJ, Sweeney MD, Lo Leggio L, Otten H, Poulsen JCN, Johansen KS, Krogh K, Jorgensen CI, Tovborg M, Anthonsen A, Tryfona T, Walter CP, Dupree P, Xu F, Davies GJ, Walton PH. Proceedings of the National Academy of Sciences of the United States of America. 2011;108:15079. doi: 10.1073/pnas.1105776108. [DOI] [PMC free article] [PubMed] [Google Scholar]
- 1349.Li X, Beeson WT, Phillips CM, Marletta MA, Cate JHD. Structure. 2012;20:1051. doi: 10.1016/j.str.2012.04.002. [DOI] [PMC free article] [PubMed] [Google Scholar]
- 1350.Beeson WT, Phillips CM, Cate JHD, Marletta MA. J. Am. Chem. Soc. 2012;134:890. doi: 10.1021/ja210657t. [DOI] [PubMed] [Google Scholar]
- 1351.Kozlowski H, Luczkowski M, Remelli M, Valensin D. Coordination Chemistry Reviews. 2012;256:2129. [Google Scholar]
- 1352.Kepp KP. Chem. Rev. 2012;112:5193. doi: 10.1021/cr300009x. [DOI] [PubMed] [Google Scholar]