

Abstract
Aptamer and antibody mediated adhesion is central to biological function and valuable in the engineering of “lab on a chip” devices. Single molecule force spectroscopy using optical tweezers enables direct non-equilibrium measurement of these non-covalent interactions for three peptide aptamers selected for glass, polystyrene, and carbon nanotubes. A comprehensive examination of the strong attachment between anti-fluorescein 4-4-20 and fluorescein was also carried out using the same assay. Bond lifetime, barrier width, and free energy of activation are extracted from unbinding histogram data using three single molecule pulling models. The evaluated aptamers appear to adhere stronger than the fluorescein antibody under no- and low-load conditions, yet weaker than antibodies at loads above ~25pN. Comparison to force spectroscopy data of other biological linkages shows the diversity of load dependent binding and provides insight into linkages used in biological processes and those designed for engineered systems.
Keywords: Biophysics, Single molecule studies, Force spectroscopy, Peptide aptamers, Antibodies, Optical tweezers
1. Introduction
Non-covalent interactions drive a myriad of biological processes such as association, adhesion, motility, structural rearrangement, and signaling. Aptamers1 and antibodies are two broad categories of biomolecules with specific binding affinity, enabling applications in sensing,2 diagnostic,3 drug delivery,4 imaging5 and therapy.6,7 Peptide aptamers typically contain 8–20 amino acids and bind materials or biomolecules. They can be engineered via selection from large libraries of random sequences (~1010) by directed evolution techniques such as phage display. Antibodies are much larger and have hypervariable regions of over 60 residues susceptible to interact with an antigen, allowing high specificity and fine tuned adhesion for reversibility.
Force-based studies of aptamer and antibody dissociation kinetics offer unique insight into the energetic landscape underlying these interactions as well as direct quantification of bond lifetimes under load. Despite the non-equilibrium nature of biological processes, bulk adhesion methods (surface plasmon resonance, ELISA, radioligand assay) are limited to measurements of unloaded bond lifetimes. Driving the system out of equilibrium is necessary for probing tight binders with extremely slow offrates. Single molecule force spectroscopy is an invaluable tool to pry apart molecular interactions in non-equilibrium conditions; capable of quantifying bond strength and lifetimes by surveying the reaction coordinate,8 in addition to exposing individual contributions underlying a population distribution. Further examination of unbinding forces of peptide aptamers and their loading rate dependence reveal the physical interactions governing adhesion, opening possibilities for engineering and modeling linkages for biologically guided assembly of materials.
Not only are aptamers important for guided and self-assembly of larger materials but they are valuable in single molecule assay design. These complex assays are challenging to construct and rely upon the availability of various linkers and points of adhesion which must be both strong and specific allowing for the isolation of the desired molecular interaction. Aptamers offer a novel single molecule linkage that is specific, readily commercially available, very easy to engineer into a system, and small in size compared to linkers including streptavidin and antibodies. Comprehensively measuring the behavior under load for both aptamers and antibodies allows them to be correctly engineered into an assay and their contribution to the force response of the system to be accurately decoupled.
While a majority of research has been focused on elucidation of aptamer sequences and applications, a minority has explored the mechanism of adhesion and an even smaller subset of these have extracted valuable force and kinetic parameters. A wide range of force measurements have been made using a naturally occurring aptamer, ferritin, obtaining adhesion strengths on Ti, Si, and Au ranging from 0.25 to 2 nN when probed with an atomic force microscope, AFM.9 However, ferritin is a multi-subunit protein over 20kDa in size and the interactions could not be isolated to individual peptide sequences. Lee et al designed a single molecule assay to probe an adhesive amino acid, dihydroxyphenylalanine, DOPA, a modification of tyrosine used by marine mussels.10 DOPA adheres to both organic and inorganic surfaces and the rupture distribution from a titanium surface was measured with a mean of 805 pN using an AFM. Binding by a twelve amino acid peptide designed by phage display for adhesion to chlorine doped polypyrrole, PPyCl, was examined with an AFM by Sanghvi et al.11 Unbinding force distributions with a mean of 112 pN were determined, yet, explicit control for single molecule rupture was not made. While these studies highlight the importance of quantification of adhesive force, a broader understanding can be achieved through rigorous single molecule measurement.
Here, optical tweezers are used to investigate peptide aptamers with high affinity for specific materials (carbon nanotubes,12 polystyrene13 and glass14) and, for comparison, to probe a tightly binding antibody for fluorescein. Our aptamer measurements extend initial forays examining adhesion forces of biomolecules on surfaces by explicitly reaching the single molecule limit and obtaining rupture force histograms, thus providing extensive information relating to the rupture coordinate including bond lifetimes (τ(F)), barrier width (x‡) and free energy of activation (ΔG‡). The bond lifetime under zero force (τ0), x‡, and ΔG‡ are found to be larger for peptide aptamers than for anti-fluorescein. Peptide aptamers are found to have longer lifetimes under low forces than anti-fluorescein, however under forces higher than ~25pN, anti-fluorescein lifetime exceeds that of the aptamers.
2. Experimental Section
Single molecule studies are composed of a wet lab assay to isolate single tethers physically attached to the probe bead, an optical trap based force spectroscopy to measure the strength of the interaction, and data analysis to extract parameters relating to the underlying reaction coordinate. The general principals guiding assay design are based on foundational single molecule studies of motility15 and structure.16
2.1 Single molecule pulling assay
Figure 1 is a cartoon view of the geometry of a single molecule optical trap assay for aptamer adhesion to a carbon nanotube. A polystyrene bead (A) is used as a handle for the optical trap to apply force. The bead is attached to the aptamer (D) via a DNA linker (C) and biotin/streptavidin attachment chemistry (B). The glass, polystyrene, and antibody-antigen measurements follow a very similar assay geometry. Non-specific interactions are mitigated by blocking available surfaces with casein. Long dsDNA linkers are used to minimize potential surface interactions from the microbead and to reduce the angle in the pulling geometry. For the peptide adhesion measurements, 3500 bp DNA tethers, 1.190 μm in length, are synthesized via PCR using a biotin conjugated forward primer (5′ - Biotin - AAT CCG CTT TGC TTC TGA CT - 3′, IDT) and an amine conjugated reverse primer (5′ - Amine - TTG AAA TAC CGA CCG TGT GA - 3′) on a M13mp18 plasmid (Bayou Biolabs). A cysteine and two glycine residues (CGG) are added at the N-terminus of the glass binding peptide (CGGRSGRRRSHHHRL), the polystyrene binding peptide (CGGRAFIASRRIKRP) and the carbon nanotube (CNT) binding peptide (CGGHWSAWWIRSNQS). DNA is conjugated to this N-terminal cysteine via the single amine group on DNA using Sulfosuccinimidyl 4-[N-maleimidomethyl] cyclohexane-1-carboxylate (sulfo-SMCC, Pierce). For the anti-fluorescein adhesion measurements, 1100 bp DNA tethers, 0.374 μm in length, are obtained with a biotin conjugated forward primer (5′ - Biotin - TAT TGC GTT TCC TCG GTT TC - 3′) and a fluorescein conjugated reverse primer (5′ - FI - TTG AAA TAC CGA CCG TGT GA - 3′). Assay conditions are optimized to insure that beads are linked to the surface by a single tether.
Figure 1.
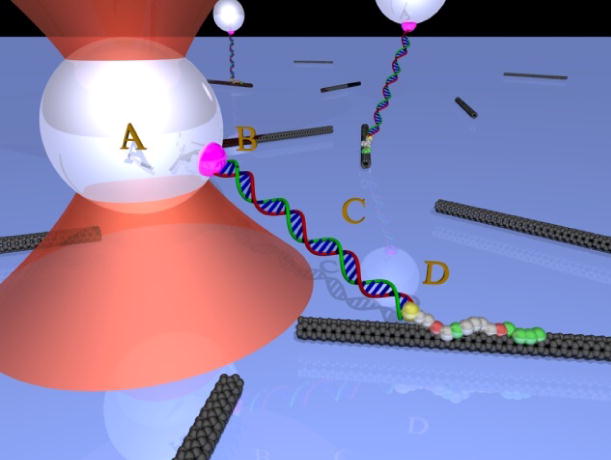
Schematics of optical tweezers pulling on a single peptide aptamer molecule linked to a carbon nanotube. The optical trap (red cone) captures a bead (A) which is linked to an aptamer (D) via a DNA molecule (C) and a biotin/streptavidin linkage (B).
A 15μL flow chamber is prepared by attaching a KOH-etched coverslip to a microscope slide with double-sided tape. The sample is loaded on one side of the channel and buffer can be exchanged with the use of a pipette tip connected to a vacuum pump to provide suction at the other side.
In the glass binding assay, the DNA-peptide (DNA-CGGRSGRRRSHHHRL) conjugate is loaded in the channel at a concentration of 10ng/uL in PBST (Phosphate buffered saline, pH 7.4, with 0.01% Tween) and incubated 1h at room temperature, RT. 1mg/mL casein in PBST is then loaded into the channel and incubated for 30 min. At the same time, 0.80μm polystyrene beads coated with streptavidin (Spherotech) are also incubated in 1mg/mL casein in PBST for 30 min. Next the beads are loaded in the channel, incubated for 30 min, and a final wash of the channel is made using 1mg/mL casein solution. Tethered beads exhibit a tethered diffusion or “wobble”.
In the polystyrene binding assay, in order to minimize nonspecific binding, cover slips are coated with a layer of aminosilane, which are then reacted with a mixture of 99% NHS-PEG and 1% NHS-PEG-biotin (MW 5000, Laysan Bio.) for 4 h at RT. Chambers built with PEG coated cover slips are incubated with 0.1mg/mL streptavidin in PBST for 30 min and then with the 1.025μm polystyrene beads (Polysciences). The beads are pre-incubated with 0.05ng/μL of peptide-DNA conjugate (DNA-CGGRAFIASRRIKRP) for 3h at 4°C, spun down at 10000 rpm for 6 min, and resuspended in 1mg/mL casein in PBST. This assay is inverted compared to that of the glass or carbon nanotubes, with the aptamer binding to the bead rather than the slide surface. A 30 min incubation at RT of the beads-peptide-DNA solution in the microscope slide chamber allows attachment of the DNA to the functionalized PEG surface. A final wash step using 100 μL of PBST removes unbound complexes.
In the carbon nanotube binding assay, a stock solution of 0.5% multi-walled carbon nanotubes (<8nm diameter, Cheap Tubes inc) with 0.7% tween-20 in PBS is diluted 10X with Millipore water. Larger CNT bundles are removed by centrifugation at 14,000g for 30 minutes. Before making the flow cell, 150uL of the nanotube containing supernatant is dried on the cover slip and then rinsed with Millipore water. The DNA-peptide (DNA-CGGHWSAWWIRSNQS) is loaded in the channel at a concentration of 0.1ng/uL in PBS (Phosphate buffered saline, pH 7.4) and incubated for 1h at RT. A 1mg/mL casein in PBS solution is then incubated in the channel for 30 min. At the same time, 1.26μm polystyrene beads coated with streptavidin (Spherotech) are also incubated in 1mg/mL casein in PBS for 30 min. The beads are then loaded into the channel, incubated for 30 min, and a final wash is completed with 100μL of the 1g/L casein solution. Controls with only Tween-20 (no CNT) dried on the slip show 10X less beads attached on the surface.
In the antibody-fluorescein binding assay, mouse monoclonal antibody (clone 4-4-20, Invitrogen) is loaded in the channel at a concentration of 15μg/μL in PBT (Phosphate buffer from 0.1% Tween-20 pH 7.4) and incubated for 40 min. 1mg/mL casein in PBT is then incubated in the channel for 20 min at RT. Avidin coated polystyrene microspheres (Spherotech) with diameters of 0.56μm or 0.76μm are also incubated in 1mg/mL casein for 30 minutes at RT. Then the beads are loaded in the channel, incubated for 30 minutes at RT, and a final wash with 1mg/mL casein solution in PBST is completed to remove unattached beads.
Concentrations of antibody, fluorescein-conjugated DNA, or peptide-conjugated DNA, are adjusted to maximize the number of single molecule tethers present and minimize rebinding events. Control scenarios using DNA tethers with only the terminal amine or the terminal amine attached to the sulfo-SMCC, but without a peptide demonstrate negligible interaction or attachment to the surface.
2.2 Optical trap based force spectroscopy
Experiments are performed using an optical trap as described previously.17 Briefly, it consists of a 10W 1064 nm trapping laser (IPG Photonics) which is steered with acoustic optic deflectors (IntraAction) before being focused at the sample plane with a 100X 1.4 NA objective (Nikon). A second 975 nm laser beam (Avanex) is passed through the objective and is projected on a position sensitive device providing nanometer scale position resolution. A piezo driven stage (Physik Instrumente) provides controllable motion.
Single molecule tethers are centered perpendicular to the optical axis by repeated tether stretching at very low force. Centering is crucial to provide a constant pulling rate along a single axis and collecting a consistent data set. The centering procedure also provides an estimate of the DNA tether length and symmetry allowing for quick detection of beads with multiple or incorrectly attached tethers. After centering, the trap stiffness is increased to approximately 0.25pN/nm (0.3–0.5pN/nm) for the peptide aptamer (fluorescein-antifluorescein) rupture and the tether is stretched by translating the sample relative to the trap with the piezo stage at a constant speed of 40μm/s for the aptamer binding assays and 40μm/s, 80μm/s or 120μm/s for the antibody binding assay, until the bond ruptured. After rupture, each bead is run through automated protocol to calibrate the exact position and forces applied. Trap stiffness is obtained using the equipartition method.18 Each event is analyzed for rupture force, loading rate, and an approximate tether length. A representative rupture curve is shown in Figure 2. Events showing multiple, or stepped breaks, too short or too large tether lengths as well as those where the bead did not return to the center of the trap after the rupture are discarded.
Figure 2.
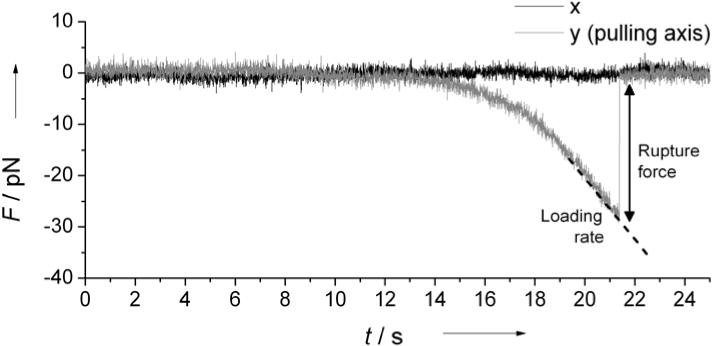
Representative force curve showing a rupture event. Rupture forces and loading rates, dashed line, are directly measured from rupture curves.
2.3 Avoiding carbon nanotubes heating
Carbon nanotubes (CNT) absorb in the near IR and may generate heat when illuminated by the trapping laser. To avoid this, while the beam center is within 0.5 μm of the peptide-CNT bond, an interposable filter that blocks 90% of the light intensity is placed in front of the laser beam. To test if this procedure prevents temperature increase in the vicinity of the peptide-MWNT interface, rupture forces are measured at two laser powers of 338 mW and 520 mW, measured before entering microscope objective. At low laser power, a mean rupture force of 25.5 pN is found with a mean loading rate of 5.7 pN/s. At high laser power, a comparable mean rupture force of 22.5 pN is found. The slight decrease can be attributable to a slower loading rate of 4.6 pN/s. Overlapping distributions suggest CNT heating is not occurring and the two data sets are combined into a single histogram.
2.4 Data analysis
Rupture forces and loading rates are extracted directly from the bead position, obliviating the need for DNA tether stiffness correction.19 Data analysis is performed using automated routines in MATLAB (MathWorks) and Igor Pro (Wavemetrics). A correction to the applied force based on the pulling angle is made by dividing the measured force by the cosine of the angle between the DNA linker and the surface, assuming that the bead is almost in contact with the surface. The pulling angle is 14.6° for the glass binding aptamer assay, 17.5° for the polystyrene, 20.3° for the CNT, 25.3° for the fluorescein-antifluorescein unbinding assay with the 0.56 μm beads and 30.3° for the assay with 0.76 μm beads. The force applied to the adhesion is that which is directly applied to the bead as the DNA is assumed to be perfectly elastic and the DNA and peptide can be modeled as two spring in series.
3. Results and discussion
3.1 Peptide aptamers show comparable rupture force
Peptide aptamers with affinity for glass,14 polystyrene13 and carbon nanotubes12 are studied. The glass binding peptide (RSGRRRSHHHRL) is highly positively charged as two thirds of its residues are either Arg or His, suggesting that binding to the negatively charged glass surface is electrostatically driven. The polystyrene binding peptide (RAFIASRRIKRP) is similarly enriched in positive amino acids and interacts electrostatically with the surface of polystyrene microbeads which carry a slight negative charge from the sulfate ester. In contrast, the highly hydrophobic carbon nanotube (CNT) binding peptide (HWSAWWIRSNQS) suggests hydrophobically driven interactions. Glass peptide adhesion is not limited to the surface it was selected for, as it has also been found to bind CdS, ZnS, and Au.14 Since the polystyrene binding mechanism is similar, non-specific adhesion would be likely. However, due to the diversity in surface charge magnitude and spacing at the atomic scale for different surfaces, the avidity and strength of the adhesion would be expected to vary.
Conveniently, the glass and polystyrene binding aptamers attach directly to the glass coverslips and the polystyrene beads typically used in optical trapping assays, thus simplifying the setup by removing the need for additional surface functionalization. Carbon nanotube binding aptamers are studied by immobilizing CNTs on glass coverslips (Figure 1 and Table 1). As CNTs absorb in the NIR and generate heat when illuminated with the 1064nm trapping laser, precautionary measures described above are taken to insure that CNTs do not heat during the rupture event. Single molecule rupture force distributions, Figure 3, exhibit average rupture forces of 19 pN for glass binding aptamers, 29 pN for polystyrene and 24 pN for CNTs with average loading rates of 2.2 pN·s−1, 7.3 pN·s−1 and 5.2 pN·s−1 respectively.
Table 1.
Rupture forces and loading rates measurements for aptamer-surface and fluorescein-antibody unbinding.
| Interaction | Na | Rupture forceb | Loading ratec | ||
|---|---|---|---|---|---|
|
| |||||
| Average | Std Dev | Average | Std Dev | ||
|
|
|
||||
| Glass/aptamer | 74 | 19.2 | 6.3 | 2.2 | 0.8 |
| Polystyrene/aptamer | 72 | 29.0 | 7.5 | 7.3 | 2.5 |
| CNTs/aptamer | 102 | 24.2 | 9.5 | 5.2 | 3.1 |
| Fluorescein/antibody | 157 | 30.4 | 21.5 | 6.1 | 5.1 |
| Fluorescein/antibody | 62 | 41.3 | 25.2 | 11.8 | 8.6 |
| Fluorescein/antibody | 79 | 59.8 | 30.2 | 24.7 | 13.3 |
Number of single-molecule measurements.
Units are pN.
Units are pN·s−1.
Figure 3.
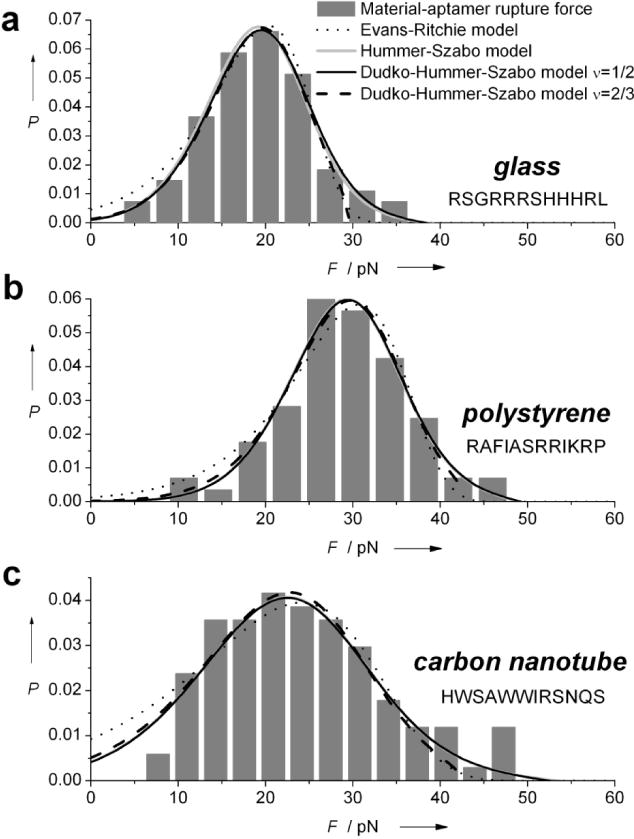
Rupture-force probability distributions for peptide aptamer binding to a) glass, b) polystyrene and c) carbon nanotubes. Histograms are fit to the model of Evans-Ritchie21 (dotted line), Hummer-Szabo22 (gray) and Dudko et al.23 assuming a cusp shaped (ν=1/2, black solid line) or a linear-cubic (ν=2/3, black dashed line) energy barrier.
The specific conformation the peptide takes on the surface is currently unknown. This, in combination with the amorphous surface of glass and polystyrene make it difficult to determine if the interactions the peptide makes with the surface are broken simultaneously or sequentially. Thus we anticipate that the unbinding distribution becomes broader as it reflects the overlap or masking of multiple individual distributions for each potential binding orientation and unbinding trajectory. A shorter distance to the transition state is obtained as the unbinding distribution becomes wider. However, for the polystyrene binding apatamer we are measuring only one unbinding trajectory, as the bead can freely rotate within the trap forcing a sequential unbinding of the adhesion.
3.2 Anti-fluorescein rupture from fluorescein increases from 30pN to 60pN with loading rate
To validate our method and compare our results to a different biomolecular interaction, we studied the attachment of an antibody/antigen pair. The adhesion of the murine monoclonal antibody, clone 4-4-20, to the fluorescein antigen is probed. Here, rupture force histrograms are obtained at loading rates of 6.1, 11.8 and 24.7 pN·s−1, Figure 4. Average rupture forces are found to increase with the loading rates from 30 pN to 60 pN.
Figure 4.
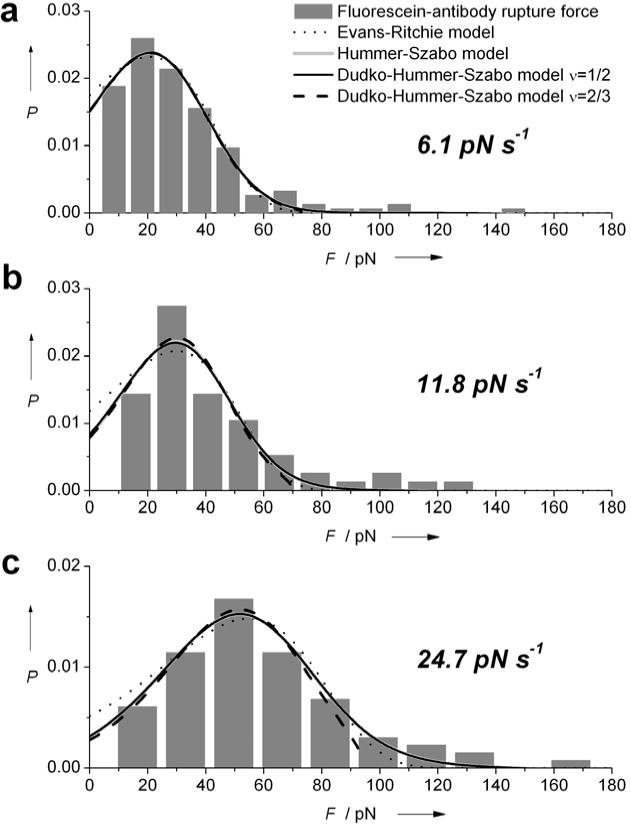
Rupture-force probability distributions for fluorescein binding to antibody 4-4-20 at average loading rates of a) 6.1 pN·s−1, b) 11.8 pN·s−1 and c) 24.7 pN·s−1. Histograms are fit to the model of Evans-Ritchie21 (dotted line), Hummer-Szabo22 (gray) and Dudko et al.23 assuming a cusp shaped (ν=1/2, black solid line) or a linear-cubic (ν=2/3, black dashed line) energy barrier.
3.3 Model fitting allows extracting kinetic and energetic parameters
Theoretical advances allow for extracting kinetic and energetic information from single molecule pulling experiments. Bell20, Evans and Ritchie21 described single molecule bond rupture as a thermally activated escape along a reaction coordinate, x, over a potential barrier, providing general shape of population distributions and exponential dependence of rupture time vs. load. This “phenomenological” model assumes that the potential barrier is very tall and that the transition state remains stationary during pulling. Hummer and Szabo22 have refined this model by considering the system as being pulled by a harmonic spring moving at constant velocity, with a harmonic underlying free-energy surface. More recently, Dudko, Hummer and Szabo23 also considered cusps and cubic-linear shaped transition state surfaces. A wide variety of pioneering theoretical21–24 and experimental25–29 work in this area can be found in literature. Models are still advancing to include probability of rebinding.30 The antibody and aptamers rupture force histograms are fit here to the Evans-Ritchie model,21 Hummer-Szabo model22 and Dudko-Hummer-Szabo model23 assuming a cusp shaped (ν=1/2) or a linear-cubic (ν=2/3) energy barrier, to provide estimates for τ0, x‡ and ΔG‡. The following equations for distribution of forces at rupture, P(F), are used for the Evans-Ritchie model fitting:
for the Hummer-Szabo model:
with
and
and for the Dudko-Hummer-Szabo model:
with
k0 is the intrinsic off rate constant at zero force (k0=τ0−1), kB is the Boltzmann’s constant, T the absolute temperature, the loading rate, ks the force constant of the pulling apparatus and S(t) the survival probability of the system.
Tables 2 and 3 show the results from fitting our data with several of these models assuming either a cusp shaped or a linear-cubic free energy profile.31 Fits with either energy profiles lead to comparable estimates, however slightly smaller τ0, x‡ and ΔG‡ are found for the linear-cubic profile in the cases of peptide aptamer adhesion.
Table 2.
Kinetic and energetic parameters for aptamer-surface unbinding, from fits to the model of Evans-Ritchie,21 Hummer-Szabo22 and Dudko et al.23 assuming a cusp shaped (ν=1/2) or a linear-cubic (ν=2/3) energy barrier.
| Interaction | Evans-Ritchie model | Hummer-Szabo model | Dudko-Hummer-Szabo model | ||||||||
|---|---|---|---|---|---|---|---|---|---|---|---|
| ν=1/2 | ν=2/3 | ||||||||||
|
| |||||||||||
| τ0a | x‡b | τ0 | x‡ | ΔG‡c | τ0 | x‡ | ΔG‡ | τ0 | x‡ | ΔG‡ | |
|
|
|
|
|
||||||||
| Glass/aptamer | 96.9 | 0.747 | 457.1 | 1.586 | 7.47 | 422.9 | 1.568 | 7.38 | 333.5 | 1.340 | 6.48 |
| Polystyrene/aptamer | 109.5 | 0.652 | 3366.7 | 1.763 | 10.60 | 2945.2 | 1.732 | 10.48 | 725.1 | 1.218 | 8.61 |
| CNTs/aptamer | 20.7 | 0.404 | 46.4 | 0.807 | 5.28 | 46.4 | 0.813 | 5.24 | 37.4 | 0.678 | 4.71 |
Units are s
Units are nm
ΔG‡ is in kBT units.
Table 3.
Kinetic and energetic parameters for anti-fluorescein 4-4-20 unbinding from fluorescein, from fits to the model of Evans-Ritchie,21 Hummer-Szabo22 and Dudko et al.23 assuming a cusp shaped (ν=1/2) or a linear-cubic (ν=2/3) energy barrier.
| Loading rate | Evans-Ritchie model | Hummer-Szabo model | Dudko-Hummer-Szabo model | ||||||||
|---|---|---|---|---|---|---|---|---|---|---|---|
| ν=1/2 | ν=2/3 | ||||||||||
|
| |||||||||||
| τ0a | x‡b | τ0 | x‡ | ΔG‡c | τ0 | x‡ | ΔG‡ | τ0 | x‡ | ΔG‡ | |
|
|
|
|
|
||||||||
| 6.1 pN·s−1 | 9.34 | 0.171 | 10.9 | 0.263 | 3.65 | 10.8 | 0.262 | 3.63 | 10.8 | 0.248 | 2.99 |
| 11.8 pN·s−1 | 7.13 | 0.176 | 10.5 | 0.318 | 4.14 | 10.1 | 0.311 | 4.09 | 10.8 | 0.308 | 3.54 |
| 24.7 pN·s−1 | 7.84 | 0.144 | 12.8 | 0.259 | 4.65 | 12.7 | 0.257 | 4.66 | 14.4 | 0.260 | 4.01 |
Units are s
Units are nm
ΔG‡ is in kBT units.
Energy landscapes of peptide aptamers and antibody/fluorescein interactions are shown in Figures 5 with energy wells represented as harmonic potentials. The transition state distance x‡, along the pulling direction is extended for the glass and polystyrene binders (~1.6 nm) compared to that of the CNT binding peptides (0.8 nm). The lengths are consistent with the shorter range of hydrophobic interactions compared to electrostatic. In addition, comparisons of τ0 and ΔG‡ indicate that adhesion is the weakest for the CNT binding aptamers and the strongest for the polystyrene binding aptamers with ΔG‡ varying from 5.2 kBT for CNT, up to 10.5 kBT for polystyrene assuming a cusp shaped barrier. Values for τ0 follow the same trend with 46 s for CNT, 423 s for glass and 2945 s for polystyrene.
Figure 5.
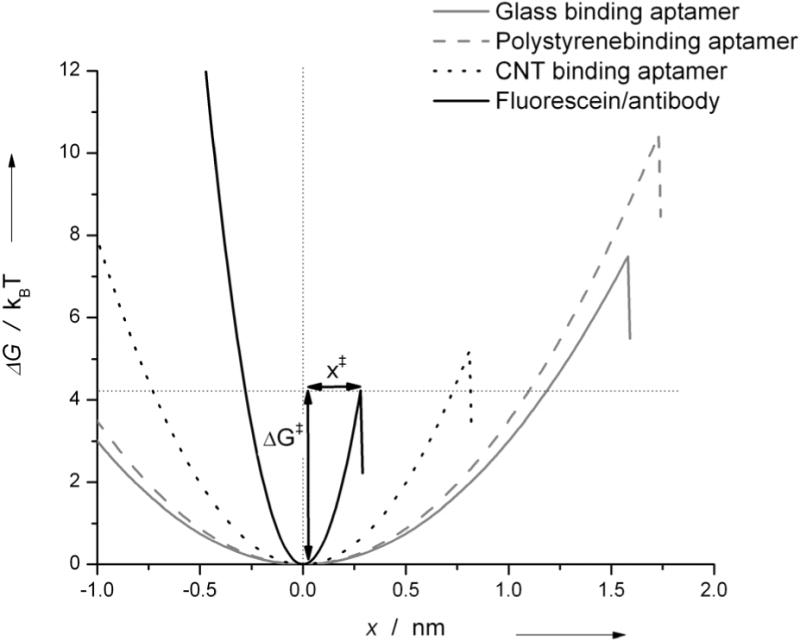
Energy landscape from parameters fitted using the model of Dudko et al.23 assuming a cusp shaped (ν=1/2) barrier, with energy wells represented as harmonic potentials.
For the antibody-fluorescein interaction, fitted parameters for the three loading rates are in close agreement and have a relative standard deviation of only ~10%, highlighting the remarkable consistency of our method. Furthermore, Boder et. al.32 measured a bulk τ0 value of 39.8 s for clone 4-4-20, which is compatable with our results when considering differences in buffer conditions.
ΔG‡ for antibody-fluorescein unbinding is 4 kBT, which is lower than that of aptamers (5–10 kBT). Transition state distance, x‡, is nearly an order of magnitude longer for peptide adhesion than antibody binding. The larger x‡ and ΔG‡ obtained for peptide aptamers are rationalized by considering the solvent accessible surface area, which gives an estimate for the number of non-covalent interactions involved in the bond. Fluorescein has a solvent accessible surface area of 5 nm2.33 Accessible surface area of peptides are computed by summing the surface areas of each amino acid side chain34, assuming that they adopt an extended conformation. Using this method, a similar surface area of 17 nm2 is obtained for each aptamer in extended conformation, three times more than that of the antibody. Aptamer-materials interactions could therefore involve a higher number of electrostatic, hydrogen-bonding and van der Waals forces, which is evidenced by larger x‡ and ΔG‡. Lifetime under no load is lower (11 s) for anti-fluorescein. However, under high forces the antibody lifetime surpasses that of aptamers.
It is important to note that our rupture experiments are done in the low loading rate regime (2–25 pN/s). Alternate kinetic and energetic parameters might have been found in a higher loading rate regime.35,36 However, extrapolated unloaded off-rates (or lifetimes) are most valid when extracted from lower loading rate force measurements, which approach unloaded conditions.
3.4 Comparison of lifetime-force relationships with other bimolecular interactions
Lifetimeforce relationships of peptide aptamers and antibody/fluorescein interactions are obtained from the following equation31:
where ν depends on the energy profile (1/2 for cusp shaped, 2/3 for linear-cubic and 1 for the phenomenological model). Figure 6 shows the aptamer and antibody lifetimes compared to several other biomolecular interactions that have been studied with single molecule force spectroscopy. Parameters for these interactions are shown in Table 4. Unloaded off rates (τ0−1) span several orders of magnitude. Slopes of τ(F) allow for comparison of relative barrier width x‡, with the longest x‡ for kinesin-microtubule unbinding and the smallest x‡ for antibody-fluorescein unbinding. A τ(F) plot also allows for comparison of spontaneous rupture (τ<1s). The fastest unbinding is observed for the molecular motor kinesin, which must readily break adhesions in order to produce processive motility. Nature tunes interactions balancing stability needed to make lasting bonds with requirements to break them within larger systems which may require rearrangement or conformational change. For example unbinding and unfolding of filamin require similar forces with a slight bias for filamin rupture at low loads and unfolding at higher.37 Described more graphically, one can control interactions not only by identifying the intercept, or unloaded off rate but by the slope of the curve.
Figure 6.
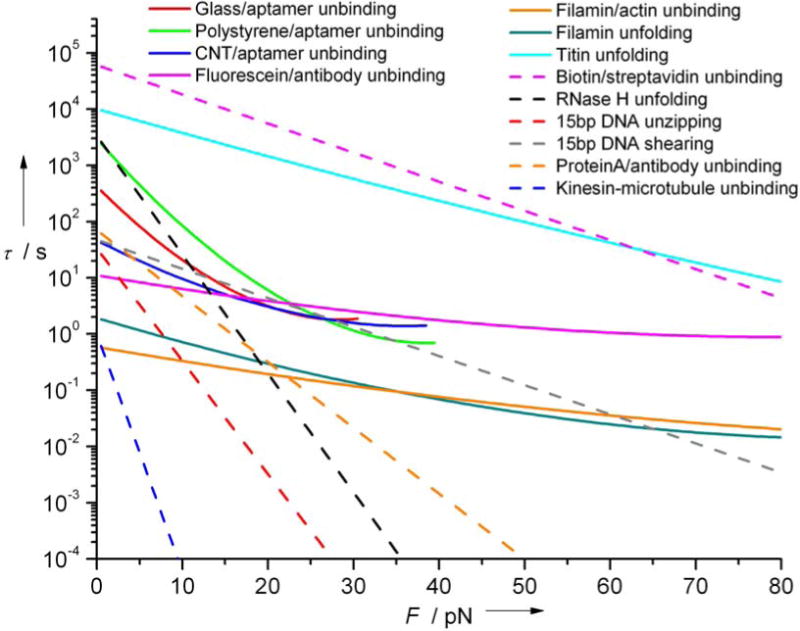
Lifetime τ(F) as a function of the applied force (F) compared to curves derived from parameters obtained from literature (Table 4) for a range of biological interactions. Kinesin-microtubule interaction is for single headed kinesin in ADP state with plus-end loading. τ(F) is obtained assuming a cusp-like barrier23 when ΔG‡ available solid lines; otherwise, Evans-Ritchie model21 is used with ν=1, dashed lines.
Table 4.
Parameters (τ0, x‡, ΔG‡ and ν) for interactions shown in Figure 6, and loading rates at which those interactions were probed.
| Interaction | τ0 (s) | x‡ (nm) | ΔG‡ (kBT) | ν | Loading rate (pN/s) | references |
|---|---|---|---|---|---|---|
| Filamin/actin unbinding | 0.59 | 0.27 | 5.6 | ½ | 400–2000 | 37 |
| Filamin unfolding | 1.92 | 0.46 | 6.8 | ½ | 400–2000 | 37 |
| Titin unfolding | 104 | 0.42 | 19.5 | ½ | 6000 | 22,38 |
| Biotin/Streptavidin unbinding | 5.99 × 10⁴ | 0.49 | – | 1 | 100–1000 | 39 |
| RNaseH unfolding | 3.33 × 10³ | 2.0 | – | 1 | 13–53 | 40 |
| 15bp DNA unzipping | 33.3 | 1.9 | – | 1 | 11 | 16 |
| 15bp DNA shearing | 47.6 | 0.49 | – | 1 | 24 | 16 |
| ProteinA/antibody undinbing | 69.9 | 1.1 | – | 1 | 0.3–500 | 41 |
| Kinesin-microtubule unbinding | 1 | 4.0 | – | 1 | 5 | 42 |
4. Conclusions
In summary, optical tweezers are used for single molecule force spectroscopy studies of peptide adhesion to materials and antibody-fluorescein interaction. Energy landscapes are reconstructed using theoretical models. Free energies of bond rupture are all in the same order of magnitude with ~ 5–10 kBT for peptide aptamers and ~3–5 kBT for anti-fluorescein. We find that peptide aptamers are strong no load binders, yet at higher loads anti-fluorescein adheres better. The developed assay has great potential to assess new linkers for biomimetic self-assembly and explore how their adhesion strengths compare to inter- and intramolecular interactions found in nature.
Acknowledgments
We thank Singapore-MIT Alliance for Research and Technology (SMART), NSF Career Award 0643745, and NIH R21CA133576 for funding. We are thankful to Olga K. Dudko and Eric Krauland for helpful discussion.
References
- 1.Mayer G. Angew Chem, Int Ed. 2009;48:2672. doi: 10.1002/anie.200804643. [DOI] [PubMed] [Google Scholar]
- 2.Ho D, Falter K, Severin P, Gaub HE. Anal Chem. 2009;81:3159. doi: 10.1021/ac802766j. [DOI] [PubMed] [Google Scholar]
- 3.Shao N, Wickstrom E, Panchapakesan B. Nanotechnology. 2008;19:465101. doi: 10.1088/0957-4484/19/46/465101. [DOI] [PubMed] [Google Scholar]
- 4.Wu Y, Sefah K, Liu H, Wang R, Tan W. Proc Natl Acad Sci USA. 2010;109:5. doi: 10.1073/pnas.0909611107. [DOI] [PMC free article] [PubMed] [Google Scholar]
- 5.Li Z, Huang P, He R, Lin J, Yang S, Zhang X, Ren Q, Cui D. Mater Lett. 2010;64:375. [Google Scholar]
- 6.Sullenger BA, Gilboa E. Nature. 2002;418:252. doi: 10.1038/418252a. [DOI] [PubMed] [Google Scholar]
- 7.Ng EW, Shima DT, Calias P, Cunningham ET, Guyer DR, Adamis AP. Nat Rev Drug Discovery. 2006;5:123. doi: 10.1038/nrd1955. [DOI] [PubMed] [Google Scholar]
- 8.Woodside MT, Anthony PC, Behnke-Parks WM, Larizadeh K, Herschlag D, Block SM. Science. 2006;314:1001. doi: 10.1126/science.1133601. [DOI] [PMC free article] [PubMed] [Google Scholar]
- 9.Hayashi T, Sano KI, Shiba K, Kumashiro Y, Iwahori K, Yamashita I, Hara M. Nano Lett. 2006;6:515. doi: 10.1021/nl060050n. [DOI] [PubMed] [Google Scholar]
- 10.Lee H, Scherer NF, Messersmith PB. Proc Natl Acad Sci USA. 2006;103:12999. doi: 10.1073/pnas.0605552103. [DOI] [PMC free article] [PubMed] [Google Scholar]
- 11.Sanghvi AB, Miller KPH, Belcher AM, Schmidt CE. Nat Mater. 2005;4:496. doi: 10.1038/nmat1397. [DOI] [PubMed] [Google Scholar]
- 12.Wang S, Humphreys ES, Chung SY, Delduco DF, Lustig SR, Wang H, Parker KN, Rizzo NW, Subramoney S, Chiang YM, Jagota A. Nat Mater. 2003;2:196. doi: 10.1038/nmat833. [DOI] [PubMed] [Google Scholar]
- 13.Kumada Y, Tokunaga Y, Imanaka H, Imamura K, Sakiyama T, Katoh S, Nakanishi K. Biotechnol Prog. 2006;22:401. doi: 10.1021/bp050331l. [DOI] [PubMed] [Google Scholar]
- 14.Krauland EM. PhD thesis PhD. Massachusetts Institute of Technology; 2007. [Google Scholar]
- 15.Svoboda K, Schmidt CF, Schnapp BJ, Block SM. Nature. 1993;365:721. doi: 10.1038/365721a0. [DOI] [PubMed] [Google Scholar]
- 16.Lang MJ, Fordyce PM, Engh AM, Neuman KC, Block SM. Nat Methods. 2004;1:133. doi: 10.1038/nmeth714. [DOI] [PMC free article] [PubMed] [Google Scholar]
- 17.Brau RR, Tarsa PB, Ferrer JM, Lee P, Lang MJ. Biophys J. 2006;91:1069. doi: 10.1529/biophysj.106.082602. [DOI] [PMC free article] [PubMed] [Google Scholar]
- 18.Lang MJ, Asbury CL, Shaevitz JW, Block SM. Biophys J. 2002;83:491. doi: 10.1016/S0006-3495(02)75185-0. [DOI] [PMC free article] [PubMed] [Google Scholar]
- 19.Ray C, Brown JR, Akhremitchev BB. J Phys Chem B. 2007;111:1963. doi: 10.1021/jp065530h. [DOI] [PubMed] [Google Scholar]
- 20.Bell GI. Science. 1978;200:618. doi: 10.1126/science.347575. [DOI] [PubMed] [Google Scholar]
- 21.Evans E, Ritchie K. Biophys J. 1997;72:1541. doi: 10.1016/S0006-3495(97)78802-7. [DOI] [PMC free article] [PubMed] [Google Scholar]
- 22.Hummer G, Szabo A. Biophys J. 2003;85:5. doi: 10.1016/S0006-3495(03)74449-X. [DOI] [PMC free article] [PubMed] [Google Scholar]
- 23.Dudko OK, Hummer G, Szabo A. Phys Rev Lett. 2006;96:108101. doi: 10.1103/PhysRevLett.96.108101. [DOI] [PubMed] [Google Scholar]
- 24.Zimanyia EN, Silbey RJ. J Chem Phys. 2009;130:171102. doi: 10.1063/1.3132747. [DOI] [PubMed] [Google Scholar]
- 25.Rief M, Gautel M, Oesterhelt F, Fernandez JM, Gaub HE. Science. 1997;276:1109. doi: 10.1126/science.276.5315.1109. [DOI] [PubMed] [Google Scholar]
- 26.Chang KC, Tees DFJ, Hammer DA. Proc Natl Acad Sci USA. 2000;97:11262. doi: 10.1073/pnas.200240897. [DOI] [PMC free article] [PubMed] [Google Scholar]
- 27.Fritz J, Katopodis AG, Kolbinger F, Anselmetti D. Proc Natl Acad Sci USA. 1998;95:12283. doi: 10.1073/pnas.95.21.12283. [DOI] [PMC free article] [PubMed] [Google Scholar]
- 28.Heinrich V, Wong WP, Halvorsen K, Evans E. Langmuir. 2008;24:1194. doi: 10.1021/la7027059. [DOI] [PubMed] [Google Scholar]
- 29.van der Horst A, Forde NR. Opt Express. 2008;16:20987. doi: 10.1364/oe.16.020987. [DOI] [PubMed] [Google Scholar]
- 30.Friddle RW. Phys Rev Lett. 2008;100:138302. doi: 10.1103/PhysRevLett.100.138302. [DOI] [PubMed] [Google Scholar]
- 31.Dudko OK, Hummer G, Szabo A. Proc Natl Acad Sci USA. 2008;105:15755. doi: 10.1073/pnas.0806085105. [DOI] [PMC free article] [PubMed] [Google Scholar]
- 32.Boder ET, Midelfort KS, Wittrup KD. Proc Natl Acad Sci USA. 2000;97:10701. doi: 10.1073/pnas.170297297. [DOI] [PMC free article] [PubMed] [Google Scholar]
- 33.Miller S, Janin J, Lesk AM, Chothia C. J Mol Biol. 1987;196:641. doi: 10.1016/0022-2836(87)90038-6. [DOI] [PubMed] [Google Scholar]
- 34.Miller S, Janin J, Lesk AM, Chothia C. J Mol Biol. 1987;196:641. doi: 10.1016/0022-2836(87)90038-6. [DOI] [PubMed] [Google Scholar]
- 35.Merkel R, Nassoy P, Leung A, Ritchie K, Evans E. Nature. 1999;397:50. doi: 10.1038/16219. [DOI] [PubMed] [Google Scholar]
- 36.Neuert G, Albrecht C, Pamir E, Gaub H. FEBS Lett. 2006;580:505. doi: 10.1016/j.febslet.2005.12.052. [DOI] [PubMed] [Google Scholar]
- 37.Lee H, Pelz B, Ferrer JM, Kim T, Lang MJ, Kamm RD. Cell Mol Bioeng. 2009;2:28. [Google Scholar]
- 38.Carrion-Vazquez M, Oberhauser AF, Fowler SB, Marszalek PE, Broedel SE, Clarke J, Fernandez JM. Proc Natl Acad Sci USA. 1999;96:3694. doi: 10.1073/pnas.96.7.3694. [DOI] [PMC free article] [PubMed] [Google Scholar]
- 39.Yuan C, Chen A, Kolb P, Moy VT. Biochemistry. 2000;39:10219. doi: 10.1021/bi992715o. [DOI] [PubMed] [Google Scholar]
- 40.Cecconi C, Shank EA, Bustamante C, Marqusee S. Science. 2005;23:2057. doi: 10.1126/science.1116702. [DOI] [PubMed] [Google Scholar]
- 41.Salomo M, Keyser UF, Struhalla M, Kremer F. Eur Biophys J. 2008;37:927. doi: 10.1007/s00249-008-0310-3. [DOI] [PubMed] [Google Scholar]
- 42.Uemura S, Kawaguchi K, Yajima J, Edamatsu M, Toyoshima YY, Ishiwata S. Proc Natl Acad Sci U S A. 2002;99:5977. doi: 10.1073/pnas.092546199. [DOI] [PMC free article] [PubMed] [Google Scholar]