

Abstract
Brettanomyces yeasts, with the species Brettanomyces (Dekkera) bruxellensis being the most important one, are generally reported to be spoilage yeasts in the beer and wine industry due to the production of phenolic off flavors. However, B. bruxellensis is also known to be a beneficial contributor in certain fermentation processes, such as the production of certain specialty beers. Nevertheless, despite its economic importance, Brettanomyces yeasts remain poorly understood at the genetic and genomic levels. In this study, the genetic relationship between more than 50 Brettanomyces strains from all presently known species and from several sources was studied using a combination of DNA fingerprinting techniques. This revealed an intriguing correlation between the B. bruxellensis fingerprints and the respective isolation source. To further explore this relationship, we sequenced a (beneficial) beer isolate of B. bruxellensis (VIB X9085; ST05.12/22) and compared its genome sequence with the genome sequences of two wine spoilage strains (AWRI 1499 and CBS 2499). ST05.12/22 was found to be substantially different from both wine strains, especially at the level of single nucleotide polymorphisms (SNPs). In addition, there were major differences in the genome structures between the strains investigated, including the presence of large duplications and deletions. Gene content analysis revealed the presence of 20 genes which were present in both wine strains but absent in the beer strain, including many genes involved in carbon and nitrogen metabolism, and vice versa, no genes that were missing in both AWRI 1499 and CBS 2499 were found in ST05.12/22. Together, this study provides tools to discriminate Brettanomyces strains and provides a first glimpse at the genetic diversity and genome plasticity of B. bruxellensis.
INTRODUCTION
Brettanomyces species, with Brettanomyces bruxellensis being the most important one, are generally reported to be spoilage yeasts that produce off flavors in beer and wine. The aroma characteristics of their spoilage-causing metabolites are typically described as burnt plastic, barnyard, horse sweat, and leather, among some other unpleasant odors (1–4), resulting in wines and beers that are less preferred by consumers. Spoilage of wine by B. bruxellensis is, in fact, considered the most important microbiological issue in the wine industry (5). However, the same species is a beneficial and even crucial contributor to the production of certain specialty beers, such as lambic and gueuze beers, which are typified by the flavors generated during secondary fermentation by this yeast (6, 7). Additionally, the species is of increasing relevance for the biofuel industry (8). Apart from isolations from beer and wine, Brettanomyces species have been detected and isolated in other foods, such as cider, soft drinks, dairy products, and olives (9–20). Despite its economic importance either as a spoilage contaminant in wine and nonalcoholic beverages or as a vital component of the fermentation biota in the production of certain beers, the physiology and ecology of Brettanomyces yeasts have only recently been the subject of intensive research (1, 21–25). However, little is still known about the level of genomic interstrain variation within B. bruxellensis or within the genus Brettanomyces.
Brettanomyces currently encompasses five species, including the anamorphs B. anomalus, B. bruxellensis, B. custersianus, B. naardenensis, and B. nanus, with teleomorphs existing for the first two species, Dekkera anomala and D. bruxellensis, respectively (26). So far, most genetic studies on Brettanomyces have focused on rapid fingerprinting using rRNA sequencing (26, 27), PCR-restriction fragment length polymorphism (RFLP) analysis (28), random amplified polymorphic DNA (RAPD) analysis (29), amplified fragment length polymorphism (AFLP) analysis, arbitrarily primed PCR (AP-PCR), and microsatellite fingerprinting (25, 30). However, so far these studies have mostly been performed with strains belonging to the same species, most often B. bruxellensis (17, 20, 29). In most cases, only a limited set of isolates was investigated or studies were performed on isolates from only a single origin, e.g., wineries (17, 31, 32). Consequently, this may limit our view of the genetic diversity within this genus. Nevertheless, most of these studies suggest great interstrain variability within Brettanomyces, especially for B. bruxellensis.
Recent advances in whole-genome sequencing technology have led to an increasing number of completely sequenced microbial genomes, providing the opportunity to compare different species or strains of the same species on a genomic scale (33). Woolfit et al. reported a partial genome sequence of a B. bruxellensis wine contaminant (CBS 2499) and identified approximately 3,000 genes (22). Recently, the full genome sequence of this strain was determined and used to deduce the genetic background of some food-relevant properties and the evolutionary history of this yeast (23). The authors found that this yeast is phylogenetically distant to food-related yeasts like Saccharomyces and is most related to Pichia (Komagataella) pastoris, which is a poor ethanol producer, unlike B. bruxellensis (23). Additionally, the full genome sequence of another B. bruxellensis wine spoilage strain (AWRI 1499) has revealed a triploid genome enriched in genes that may aid survival in the challenging environment of wine (24).
Comparative genomics of four wine isolates, including CBS 2499, AWRI 1499, and two newly sequenced B. bruxellensis isolates, revealed differences in nutrient utilization and ploidy level within B. bruxellensis, with some strains being diploid and others being triploid (34). Triploid isolates were found to possess a core diploid genome and a distantly related third genomic complement (34). Further, the authors presented evidence suggesting that this form of triploidy has arisen more than once in the evolutionary history of B. bruxellensis and that it confers a selective advantage for strains from wineries (34). Whereas the sequencing of these wine spoilage B. bruxellensis strains has increased our understanding of this species, our knowledge of how these strains behave in comparison with strains from another niche remains fairly limited. For example, no genome sequence is available for a Brettanomyces strain from an industry where its presence is desirable, such as the fermentation of Belgian gueuze and lambic beers.
Here, the genetic relationship among 50 Brettanomyces strains belonging to all species presently classified within the genus and isolated from several food-related sources was studied using a combination of established fingerprinting techniques. This revealed an intriguing correlation between the B. bruxellensis fingerprints and the niches where the respective strains were isolated. Additionally, we sequenced a (beneficial) beer isolate of B. bruxellensis (VIB X9085; ST05.12/22) and compared its genome sequence with that of two wine spoilage strains. Emphasis was put on describing single nucleotide polymorphisms (SNPs), small insertions and deletions (indels), copy number variations (CNVs), and the presence of unique genes.
MATERIALS AND METHODS
Yeast collection, DNA extraction, and nitrate assimilation tests.
A total of 50 strains representing the different Brettanomyces species, i.e., B. anomalus (D. anomala), B. bruxellensis (D. bruxellensis), B. custersianus, B. naardenensis, and B. nanus, was isolated from different food products and beverages and used in this study. A subset of these strains was isolated from three lambic beer casks from the Cantillon Brewery (Anderlecht, Belgium; February 2012) as described previously (3, 19, 20). Additional strains were obtained from several culture collections or kindly provided by colleagues (Table 1). Beer samples obtained from the Cantillon Brewery were diluted 10 times in wort extract medium (WEM; 10 ml) and incubated at 21°C for 7 days with vigorous shaking. WEM was prepared by stirring 400 g freshly ground malt in 500 ml distilled water for 60 min at 65°C. Following filtration (50 μm) and autoclave sterilization, the wort was supplemented with 150 mg/liter (NH4)2SO4 and 10 g/liter glucose. The medium was then depleted of simple fermentable sugars, such as glucose, fructose, sucrose, maltose, and maltotriose, by inoculating it with Saccharomyces cerevisiae (to mimic the main lambic wort fermentation period [19]), followed by 96 h of incubation at 25°C. Subsequently, S. cerevisiae cells were removed by centrifugation (15 min, 4,000 × g, 4°C), and 20 g/liter glucose, 10 mg/liter cycloheximide, 40 mg/liter oxytetracycline, and 60 mg/liter chloramphenicol were added to the supernatant, which resulted in WEM suitable for Brettanomyces isolation. After growing the Brettanomyces cultures in WEM, a 10-fold dilution series of each sample was plated (100 μl) in duplicate on either Wallerstein laboratory nutrient (WLN) agar (20), Dekkera/Brettanomyces differential medium (DBDM) as described by Rodrigues et al. (3) but without the addition of ethanol, or universal beer agar (UBA) supplemented with the antibiotics cycloheximide (10 mg/liter), oxytetracycline (10 mg/liter), and chloramphenicol (50 mg/liter) (19). The plates were incubated for 5 to 14 days at 25°C. Five colonies were randomly selected from each countable plate (containing less than 300 colonies) and further subcultivated to obtain pure cultures. Identification based on partial sequencing of the nuclear large subunit (LSU) rRNA gene resulted in five different Brettanomyces isolates, all of which belonged to the species B. bruxellensis (Table 1). Following incubation for 5 days at 25°C on yeast-peptone-glucose (YPG) agar, genomic DNA was isolated using the phenol-chloroform extraction method described by Lievens et al. (35). DNA yields were determined spectrophotometrically at 260 nm and diluted to 10 ng/μl. For nitrate assimilation tests, strains were grown on YPG agar for 5 days at 25°C and then inoculated into 5 ml medium as described by Conterno et al. (1) and supplemented with either 0.1% (wt/vol) nitrate or 0.1% (wt/vol) ammonium sulfate as a positive control or no nitrogen source as a negative control. After 7 days of aerobic incubation under agitation at 25°C, the growth of the different strains was evaluated by means of visual inspection. Isolates were stored at −80°C in yeast extract-peptone-dextrose (YPD) broth containing 26.1% glycerol. DNA extracts were stored at −20°C.
TABLE 1.
Brettanomyces isolates used in this study
| Species | Isolatea | Isolateb | LSU rRNA gene GenBank sequence accession no. | Geographic origin | Yr of isolation | Niche | Clusterc | Subclusterd |
|---|---|---|---|---|---|---|---|---|
| B. anomalus | ST05.12/06 | CBS 5111 | KF790764 | Ireland | —e | Beer | I | I-A |
| ST05.12/15 | MUCL 27703 | KF790805 | — | 1909 | Beer | I | I-B | |
| ST05.12/13 | MUCL 27702 | KF790807 | United Kingdom | 1940 | Bottled beer | I | I-B | |
| ST05.12/19 | MUCL 31218 | KF790801 | United Kingdom | — | Bottled beer | I | I-B | |
| ST05.12/09 | CBS 4460 | KF790763 | — | — | Cider | I | I-B | |
| ST05.12/35 | NRRL Y17520 | KF790784 | — | — | Cider | I | I-B | |
| ST05.12/61 | CBS 4210 | KF790767 | — | — | Cider | I | I-B | |
| ST05.12/17 | MUCL 49367 | KF790803 | The Netherlands | — | Soft drink | I | I-B | |
| ST05.12/39 | NRRL Y17522 | KF790781 | The Netherlands | — | Soft drink | I | I-B | |
| B. bruxellensis | ST05.12/18 | MUCL 27705 | KF790802 | South Africa | — | Bantu beer | II | II-A |
| ST05.12/26 | MUCL 49865 | KF790794 | Belgium | — | Brewery | II | II-B | |
| ST05.12/48f,h | KF790778 | Belgium | 2012 | Cantillon Brewery | II | II-B | ||
| ST05.12/49g,i | KF790777 | Belgium | 2012 | Cantillon Brewery | II | II-D | ||
| ST05.12/50g,i | — | Belgium | 2012 | Cantillon Brewery | II | II-D | ||
| ST05.12/51g,j | KF790775 | Belgium | 2012 | Cantillon Brewery | II | II-D | ||
| ST05.12/52g,j | KF790774 | Belgium | 2012 | Cantillon Brewery | II | II-D | ||
| ST05.12/53h,k | KF790773 | Belgium | 2012 | Cantillon Brewery | II | II-D | ||
| ST05.12/16 | MUCL 27701 | KF790804 | United States | — | Dry ginger ale | II | II-A | |
| ST05.12/59 | CBS 6055 | KF790768 | United States | — | Dry ginger ale | II | II-A | |
| ST05.12/54 | CBS 73 | KF790772 | France | — | Grape must | II | II-C | |
| ST05.12/22 | VIB X9085 | KF790798 | Belgium | — | Lambic beer | II | II-B | |
| ST05.12/24 | MUCL 27707 | KF790796 | Belgium | — | Lambic beer | II | II-B | |
| ST05.12/25 | MUCL 27700 | KF790795 | Belgium | — | Lambic beer | II | II-B | |
| ST05.12/27 | MUCL 30490 | KF790793 | Belgium | 1989 | Lambic beer | II | II-B | |
| ST05.12/40 | MUCL 30489 | KF790779 | Belgium | 1989 | Lambic beer | II | II-B | |
| ST05.12/36 | NRRL Y1413 | KF790783 | Belgium | — | Lambic beer sediment | II | II-B | |
| ST05.12/23 | KaHoSL 01 | KF790797 | Belgium | — | Lambic beer | II | II-B | |
| ST05.12/28 | KaHoSL 02 | KF790792 | Belgium | — | Lambic beer | II | II-B | |
| ST05.12/55 | CBS 3025 | KF790771 | United Kingdom | — | Secondary beer fermentation | II | II-B | |
| ST05.12/21 | MUCL 27706 | KF790799 | The Netherlands | — | Soft drink | II | II-A | |
| ST05.12/30 | CBS 8027 | KF790789 | The Netherlands | — | Soft drink | II | II-A | |
| ST05.12/33 | CBS 98 | KF790786 | The Netherlands | 1939 | Stout | II | II-B | |
| ST05.12/34 | CBS 97 | KF790785 | United Kingdom | 1939 | Stout | II | II-B | |
| ST05.12/56 | CBS 2499 | KF790770 | France | — | Wine | II | II-B | |
| ST05.12/62 | AWRI 1499 | KF790766 | Australia | — | Wine | II | II-E | |
| B. custersianus | ST05.12/04 | CBS 5207 | KF790780 | South Africa | — | Bantu beer | III | III-A |
| ST05.12/05 | CBS 5208 | KF790776 | South Africa | — | Bantu beer | III | III-A | |
| ST05.12/11 | CBS 4806 | KF790809 | South Africa | — | Bantu beer | III | III-B | |
| ST05.12/12 | MUCL 27704 | KF790808 | South Africa | 1960 | Bantu beer | III | III-B | |
| ST05.12/29 | CBS 8347 | KF790791 | The Netherlands | 1996 | Olives | III | III-C | |
| B. naardenensis | ST05.12/10 | CBS 6043 | KF790810 | The Netherlands | — | Carbonated tonic water | IV | IV-A |
| ST05.12/01 | CBS 6042 | KF790811 | The Netherlands | — | Lemonade | IV | IV-A | |
| ST05.12/02 | CBS 6107 | KF790800 | The Netherlands | — | Lemonade | IV | IV-A | |
| ST05.12/03 | CBS 6115 | KF790790 | The Netherlands | — | Soft drink | IV | IV-A | |
| ST05.12/07 | CBS 7540 | KF790765 | South Africa | — | Soft drink | IV | IV-B | |
| ST05.12/14 | MUCL 27708 | KF790806 | The Netherlands | — | Soft drink | IV | IV-A | |
| ST05.12/37 | NRRL Y5740 | KF790782 | United States | — | Soft drink | IV | IV-A | |
| ST05.12/57 | CBS 6040 | KF790769 | United States | — | Soda water | IV | IV-A | |
| B. nanus | ST05.12/31 | CBS 1956 | KF790788 | Sweden | — | Bottled beer | V | V-A |
| ST05.12/32 | CBS 1955 | KF790787 | Sweden | — | Bottled beer | V | V-A |
Our own isolate numbering.
AWRI, Australian Wine Research Institute, Glen Osmond, Australia; CBS, Centraalbureau voor Schimmelcultures, Utrecht, The Netherlands; NRRL, Agriculture Research Service Culture Collection, National Center for Agricultural Utilization Research, Peoria, IL; KaHoSL, Katholieke Hogeschool Sint-Lieven, Ghent, Belgium; MUCL, Mycothèque de l'Université Catholique de Louvain, Louvain-la-Neuve, Belgium; VIB, Vlaams Instituut voor Biotechnologie, Leuven, Belgium.
Clustering results (DNA fingerprinting results for combined data sets) at a similarity percentage of 66%, perfectly corresponding to species delineation.
Clustering results (DNA fingerprinting results for combined data sets) at a similarity percentage of 80%.
—, unknown.
Sampled (February 2012) from a 50-year-old cask; the beer was brewed on 13 November 2011.
Sampled (February 2012) from a 6- to 7-year-old cask; the beer was brewed on 12 December 2011.
Sampled (February 2012) from an 8-year-old cask; the beer was brewed on 12 December 2011.
Isolated using Wallerstein laboratory nutrient (WLN) agar.
Isolated using universal beer agar (UBA).
Isolated using Dekkera/Brettanomyces differentiation medium (DBDM).
DNA fingerprinting and phylogenetic analysis.
DNA extracted from all isolates listed in Table 1 was amplified using the primer pair NL1 and NL4, amplifying the divergent D1/D2 domains of the LSU rRNA gene (8). Amplification was performed in a reaction volume of 20 μl containing 312.5 μM each deoxynucleoside triphosphate (dNTP), 1.0 μM each primer, 1.25 units TaKaRa Ex Taq polymerase, 1× Ex Taq buffer (Clontech Laboratories, Palo Alto, CA), and 1 μl genomic DNA. Amplification was performed using a Bio-Rad T100 thermal cycler according to the following thermal profile: initial denaturation at 95°C for 2 min, followed by 30 cycles of 95°C for 1 min, 59°C for 45 s, and 72°C for 1 min. A final 10-min extension step at 72°C concluded the protocol. Sequencing was performed using the same primers used for the amplification. Subsequently, SeqTrace software (36) was used to identify, align, and compute consensus sequences with the same start and end motifs (457 to 471 bp) from matching forward and reverse sequences. Remaining ambiguous bases were manually edited according to the paired electropherograms. BLAST analysis (37) of the obtained sequences against the sequences in GenBank (38) confirmed the identity of the isolates as they were purchased or received. Following alignment of the different consensus sequences, a maximum likelihood tree was constructed with the MEGA (v5.2) program (39) to assess the phylogenetic relationships of the different isolates. In addition, all DNA samples were subjected to three fingerprinting techniques previously used successfully to type Brettanomyces strains, including RAPD-PCR, AP-PCR, and repetitive sequence-based PCR (rep-PCR). With regard to the RAPD analysis, the first 10 decamer oligonucleotides, randomly chosen from Operon primer kits (Operon Technologies Inc., Alameda, CA), were screened on a subset of 10 yeast isolates to select the most discriminative and reliable RAPD primers. Three primers resulting in distinct, reproducible polymorphic bands were selected for further analysis, including OPC20 (5′-ACTTCGCCAC-3′), OPD19 (5′-CTGGGGACTT-3′), and OPK03 (5′-CCAGCTTAGG-3′). Likewise, for the rep-PCR analysis, two primers and one primer set were first tested on a few isolates, including the BOXA1R primer (5′-CTACGGCAAGGCGACGCTGACG-3′), the (GTG)5 primer (5′-GTGGTGGTGGTGGTG-3′), and the primer pair REP1R-I (5′-IIIICGICGICGICATCIGGC-3′) and REP2-I (5′-ICGICTTATCIGGCCTAC-3′) (40). As the BOXA1R primer yielded only one to three bands and primer (CTG)5 resulted in some migration problems during gel electrophoresis, only REP1R-I and REP2-I, yielding 2 to 13 clear bands, were maintained for analysis of the whole collection. For the AP-PCR, the M13 universal primer (5′-TTATGAAACGACGGCCAGT-3′) (41) as well as two other 15-mer primers derived from the microsatellite core sequence of wild-type phage M13, including 5′-GAGGGTGGCGGTTCT-3′ and 5′-GAGGGTGGGGCCGTT-3′ (41), were used. All amplifications were performed using a Bio-Rad T100 thermal cycler in a total volume of 20 μl containing 0.5 μM each primer, 0.15 mM each dNTP, 1.0 unit Titanium Taq DNA polymerase, 1× Titanium Taq PCR buffer (Clontech Laboratories, Palo Alto, CA), and 1 μl genomic DNA. Before amplification, DNA samples were denatured at 94°C for 2 min. Subsequently, 35 cycles of 1 min at 94°C, 1 min at 35°C (RAPD), 40°C (rep-PCR), or 49°C (AP-PCR), and 2 min at 72°C, with a final extension step for 10 min at 72°C, were run. The PCR products obtained were separated by loading 7.5 μl of the reaction volume on 1.5% agarose gels, followed by gel electrophoresis in 1× Tris-acetate-EDTA (TAE) buffer at 120 V for 110 min. Gels were stained with ethidium bromide and visualized with UV light. A 1-kb DNA ladder (Smartladder; Eurogentec, Seraing, Belgium) was used as a size marker for comparison. A BioChemi system (UVP, Upland, CA) was used to acquire image data. All reactions were performed three times to check reproducibility and yielded identical results, demonstrating the robustness of our methods. In all analyses, an S. cerevisiae isolate (isolate 69240; Novagen) was used as a reference. Sterile distilled water was used as a negative control. The images obtained were processed using GelCompar software (v6.6.4; Applied Maths, Sint-Martens-Latem, Belgium), and analyses of the combined data sets with all fingerprinting results obtained in this study were performed. Following normalization and background subtraction, fingerprint similarities were calculated using the Pearson correlation coefficient (42). Cluster analysis was performed by the unweighted pair-group method with arithmetic averages (UPGMA) (42). In addition, nonmetric multidimensional scaling (nMDS) plots were constructed to create a two-dimensional representation of the relationships among the different isolates (43, 44). Since nMDS ordination is an iterative algorithm that involves a goodness-of-fit estimate, an important component of an nMDS plot is a measure of the goodness of fit of the final plot, also called the “stress” of the plot. A stress value of greater than 0.2 indicates that the plot is close to random. A stress value of less than 0.2 indicates a useful two-dimensional representation, and a stress value of less than 0.1 corresponds to an ideal ordination with no real prospect of misinterpretation (44). For our analysis, stress was calculated using the R package vegan (45). All ordinations in our analysis were computed following 10,000 random starts. In addition to the graphical representation, it was determined whether significant differences between groups of objects could be observed using analysis of similarity (ANOSIM [46]), based on the distance matrix obtained earlier (47). This nonparametric method compares the average rank similarity between objects within a group with the rank similarity between objects of different groups and produces a test statistic, R, which can range from 0 to 1. An R value of 1 states the complete separation of the groups, while an R value equal to 0 indicates that no separation occurs (46, 47). The multiresponse permutation procedure (MRPP) was used to confirm the results obtained with ANOSIM. MRPP calculates the chance-corrected within-group agreement, A, the value of which varies from 0 to 1. A is equal to 0 when within-group heterogeneity equals expectation by chance. When A is equal to 1, all items within each group are identical. In ecology, values for A are commonly below 0.1, even when there are apparent differences in groups. An A value of >0.3 is fairly high (48, 49). The ANOSIM, MRPP, and nMDS procedures were performed using the vegan package in R (v12.2.1) (45, 50).
High-coverage genome sequencing, de novo assembly, scaffolding, and annotation.
Following DNA purification, one paired-end library (2 × 100 bp, 500-bp inserts) and two mate-pair libraries (2 × 100 bp, 2-kb inserts; 2 × 100 bp, 5-kb inserts) from Illumina (San Diego, CA) were prepared for B. bruxellensis strain ST05.12/22 (VIB X9085), originally isolated from lambic beer, according to the manufacturer's instructions. The libraries were sequenced on the Illumina HiSeq 2000 platform at the Beijing Genomics Institute (BGI; Shenzhen, China). Reads were subjected to quality filtering using the FASTX tool kit (http://hannonlab.cshl.edu/fastx_toolkit/index.html). After removing the adaptors and low-quality reads (those with a Phred quality score of less than 30), trimmed reads were assembled de novo using the SOAPdenovo (v1.05) program (51), providing a pseudohaploid assembly. The assembled contigs were subsequently scaffolded by the SSPACE program (52) using the Illumina mate-pair information. Gaps inside the scaffolds were closed by the GapCloser program (53), based on the paired-end read data. As suggested by Curtin et al. (24), coding sequences (CDSs) were predicted by the AUGUSTUS (v2.5.5) program (54) with the S. cerevisiae gene models as a reference. All predicted genes were annotated by using the NCBI KOG database (55) and Blast2GO (56) with AWRI 1499 (= ST05.12/62 in our study) as a reference (24).
Genome comparison with AWRI 1499 and CBS 2499.
Short read sequences obtained for ST05.12/22 were mapped to the B. bruxellensis AWRI 1499 (24) and CBS 2499 (23) genome assemblies as a reference using the NovoAlign program (v3.00.5a; Novocraft) with default settings. The MarkDuplicates command in the Picard program (http://picard.sourceforge.net/) was used to remove the reads that mapped to the same positions in the reference genomes (PCR duplications). Single-nucleotide variations (SNPs) and small insertions and deletions (indels) were called for each contig using the SAMtools and GATK programs (57, 58). Default settings were used, except that the maximum read depth in SAMtools was set to 200 times (−D, 200). The generated SNPs and indels were then filtered using custom Perl scripts to minimize false-positive mutation calls. First, mutations with a total read depth of less than 20 times were discarded. Second, SNPs and indels with a Phred quality score of less than 30 were removed. Third, mutation calls were kept only when at least 80% of the reads were positive for the homogeneous sites and at least 30% of the reads were positive for the heterogeneous sites. The lists of SNPs/indels were then annotated by the use of in-house Perl scripts with the B. bruxellensis AWRI 1499 and CBS 2499 assemblies as a reference. SNP and indel density was calculated using in-house R (50) and Python (59) scripts. Homologous genes were determined by comparing the whole-genome assemblies using the BLASTN program (37). Only genes that showed a similarity of less than 1e−10 (E value) were considered homologues. Structural genome variation in ST05.12/22, including large duplications and deletions (>1 kb), was assessed using CNVnator software (60) to identify copy number variations through read-depth analysis. Default parameters were used, except the bin size was set to 100. As suggested by the developer, a q0 value of <0.5 was used as the cutoff. The analysis was not performed for the wine strains, as we did not possess the raw, unassembled sequence data for AWRI 1499.
Nucleotide sequence accession numbers.
The LSU rRNA gene sequences obtained were deposited in GenBank under accession numbers KF790763 to KF790811. Sequence data for ST05.12/22 have been deposited in the NCBI short-read archive under Bioproject accession number SRP041023. The assembly and listing of the annotations can be found at http://dx.doi.org/10.6084/m9.figshare.1007637. Sequences obtained for the genes involved in B. bruxellensis nitrate assimilation were deposited in GenBank under accession numbers KJ735590 to KJ735643.
RESULTS
Phylogenetic relationships within the genus Brettanomyces.
In order to examine the genetic relationships between the investigated Brettanomyces strains, a phylogram based on partial LSU rRNA gene sequences was constructed. This perfectly divided the different species into distinct clades (Fig. 1). In general, low sequence divergence was observed between strains belonging to the same species (0 to 1.4%). The most divergence was observed for B. bruxellensis and B. custersianus, with each species displaying a subcluster of a few isolates within the species clades. Remarkably, within the B. bruxellensis clade, all soft drink isolates grouped separately, having 1 to 3 SNPs in comparison with the sequences of the other B. bruxellensis isolates (Fig. 1). Next, all isolates were subjected to a number of DNA fingerprinting assays, including three RAPD-PCR analyses, three AP-PCR analyses, and one rep-PCR analysis. The UPGMA dendrogram derived from the Pearson correlation based on the combined data sets showed a high level of congruence with the LSU rRNA-based phylogenetic tree (Fig. 2). However, the discriminative power displayed was considerably higher with these fingerprinting methods. On the basis of a DNA fingerprint similarity level of 66%, UPGMA clustering perfectly matched the species delineation (Fig. 2), corroborating the results from the nMDS ordination (Fig. 3A; stress = 0.15). Additionally, an ANOSIM R test statistic equal to 0.9998 was found (P < 0.00001; combined data sets), indicating that the tested groups were significantly different. When the cutoff fingerprint similarity level was increased to 80%, the five species clusters could be further divided into 13 subclusters (Table 1; Fig. 2), among which the B. bruxellensis subclusters generally represented different groups of strains isolated from a similar environment. More specifically, subcluster II-A contained only isolates from soft drinks (and one bantu beer strain [strain ST05.12/18]), while subcluster II-B harbored beer strains. Separate subclusters were formed for the wine strains. Interestingly, all isolates obtained from the Cantillon Brewery, except ST05.12/48 (subcluster II-B), fell in a separate subcluster (subcluster II-D) (Table 1). nMDS ordination also grouped the B. bruxellensis isolates together according to the niche they were isolated from: Cantillon Brewery, beer, wine, and soft drinks (Fig. 3B; stress = 0.08). In this case, the ANOSIM R test statistic was 0.684 (P < 0.00001; combined data sets), supporting a large (but not complete) and statistically significant separation of the different groups, which was also supported by the MRPP results (A = 0.071, P < 0.000001; combined data sets). Altogether, these results suggest that B. bruxellensis strains isolated from similar niches are genetically more related than strains from different niches. This relation between genotype and niche is supported by evidence that strains isolated from similar niches in different locations clustered together. On the contrary, isolates obtained from, for example, the same geographic region but different niches did not cluster together. For example, B. bruxellensis strains ST05.12/21, ST05.12/30, and ST05.12/33 were all isolated in the Netherlands, with the first two being isolated from soft drinks and the last one being isolated from a Dutch stout beer. On the basis of both LSU rRNA gene sequencing and DNA fingerprinting, the soft drink isolates clustered together with other isolates from soft drinks, while the beer isolate was more related to the rest of the beer isolates, irrespective of the year of isolation. Indeed, whereas, for example, strains ST05.12/33 and ST05.12/34 were both isolated in 1939, they grouped closely together with beer strains that were isolated several years later (Table 1; Fig. 2 and 3B). To further support this correlation between genotype and niche, we expanded our collection with seven additional B. bruxellensis strains from wine (CBS 1940, CBS 1941, CBS 1942, CBS 1943, CBS 2336, MUCL 54012, and MUCL 54015) and subjected them to M13 fingerprinting (using primer 5′-TTATGAAACGACGGCCAGT-3′), together with the other B. bruxellensis strains. Again, a correlation could be observed between the source of isolation and the genetic pattern (see Fig. S1 in the supplemental material), supporting our findings.
FIG 1.

Maximum likelihood tree (Tamura-Nei model) of all Brettanomyces strains investigated in this study, based on partial large-subunit rRNA gene sequences (457 to 471 bp). Bootstrap values of >80% (based on 1,000 replicates) are given at the nodes of the tree. Saccharomyces cerevisiae was used as an outgroup. The origins of the different strains, i.e., beer, Cantillon Brewery, soft drinks, others, and wine, are highlighted in green, dark green, orange, blue, and red, respectively.
FIG 2.

Dendrogram derived from the UPGMA linkage of Pearson correlation coefficients of combined fingerprinting data sets for all Brettanomyces strains investigated in this study. Isolates from B. anomalus (Dekkera anomala) (yellow), B. (Dekkera) bruxellensis (green), B. custersianus (red), B. naardenensis (blue), and B. nanus (pink) are grouped in clusters I, II, III, IV, and V, respectively (defined at a similarity percentage of 66%, marked by the solid red line). At 80% similarity, 13 clusters can be distinguished (marked by the dotted red line); among these, the B. bruxellensis subclusters generally represent strains from a similar environment. Blank, the negative control (sterile distilled water). B. bruxellensis strains marked with a circle were shown to have the complete nitrate assimilation gene cluster, consisting of genes encoding a nitrate reductase, a nitrite reductase, and a nitrate transporter. Isolates marked with a square lost the genes encoding the nitrate reductase and nitrite reductase. Isolates marked with a triangle lost the complete nitrate assimilation gene cluster. B. bruxellensis strains that were able or unable to utilize nitrate as a nitrogen source are indicated with a green or a red mark, respectively. Isolates ST05.12/30 and ST05.12/54 (orange) were both negative on ammonium and nitrate in our assay.
FIG 3.
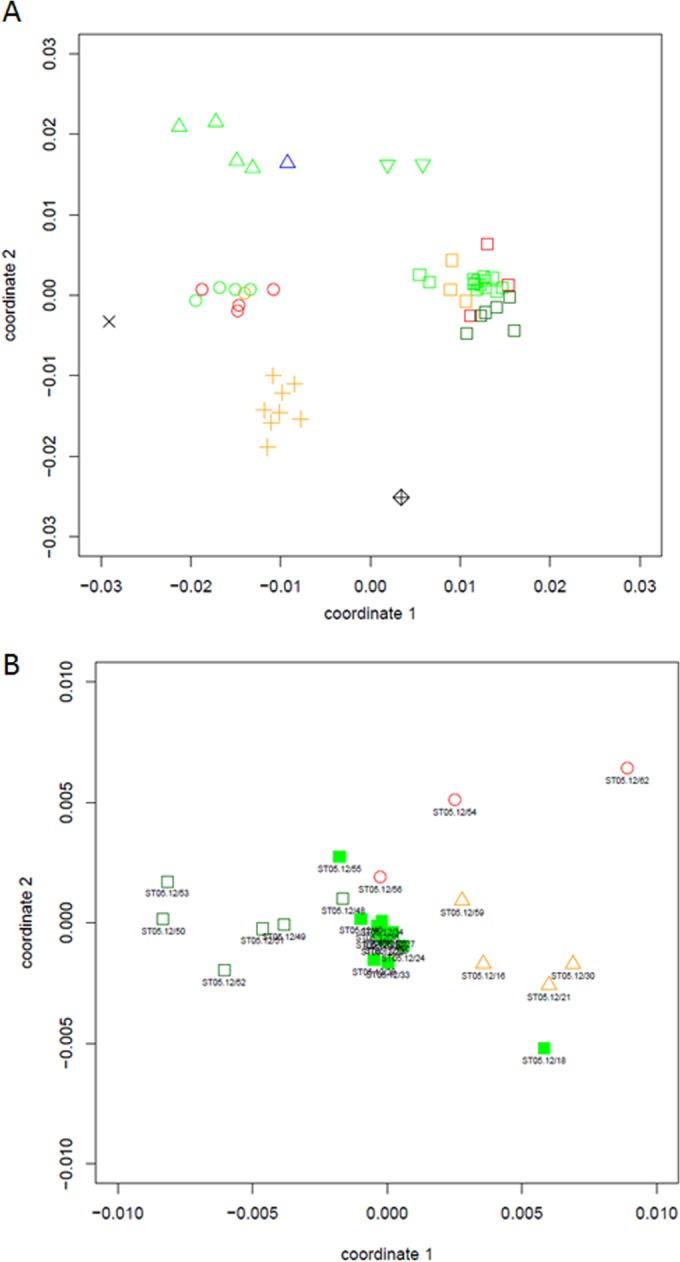
Nonmetric multidimensional scaling plot based on Pearson coefficient similarities of the combined fingerprinting data sets for all Brettanomyces isolates (A) and all B. (Dekkera) bruxellensis isolates (B) investigated in this study. In panel A, isolates from B. anomalus (D. anomala), B. bruxellensis, B. custersianus, B. naardenensis, and B. nanus are represented by circles, squares, triangles, plus signs, and inverted triangles, respectively. The diamante symbol corresponds to Saccharomyces cerevisiae, and the multiplication sign represents the negative control (sterile distilled water) (stress of plot = 0.15). The origin of the different strains, i.e., beer, Cantillon Brewery, soft drink, others, and wine, are highlighted in green, dark green, orange, blue, and red, respectively. In panel B, open dark green squares, closed green squares, red circles, and orange triangles represent B. bruxellensis isolates from the Cantillon Brewery, beer, wine, and soft drinks, respectively (stress of plot = 0.08).
Genome sequencing of a B. bruxellensis strain isolated from lambic beer fermentation.
As detailed above, the few recent studies focusing on genome sequencing of Brettanomyces yeasts have focused on wine spoilage isolates of B. bruxellensis. To obtain a more complete view of the Brettanomyces genomes and further investigate the association between strains and isolation source, we sequenced the genome of a B. bruxellensis strain originating from a spontaneous Belgian lambic beer fermentation (ST05.12/22; genotype cluster II-B). The genome sequence of this strain was compared with the genome sequences available for the wine B. bruxellensis strains AWRI 1499 (ST05.12/62; genotype cluster II-E) and CBS 2499 (ST05.12/56; genotype cluster II-B), from Australia and France, respectively. Comparison with these two strains is especially interesting, as they not only originated from a different niche (wine) but also belong to different genotype clusters (genotype clusters II-B and II-E, representing the same and another genotype as our beer isolate, respectively). Therefore, comparison of the genome sequence of our beer strain with the genome sequences of these two wine strains should provide us more insight into the genomic landscape of B. bruxellensis. De novo assembly of the ST05.12/22 sequence reads yielded 85 scaffolds with N50 of 257.6 kb at 100- to 110-fold coverage and an assembly length of 13.0 Mb (Table 2), which is comparable to the assembly lengths obtained for AWRI 1499 (12.7 Mb [24]) and CBS 2499 (13.4 Mb [23]). In total, 5,255 gene models were predicted by AUGUSTUS for ST05.12/22 with the S. cerevisiae-based model as a reference, and 36 and 17 of these had no homologues in AWRI 1499 and CBS 2499, respectively, and vice versa, 30 and 16 genes were missing from ST05.12/22 but present in AWRI 1499 and CBS 2499, respectively (but see below).
TABLE 2.
Genome analysis summary for Brettanomyces bruxellensis strain ST05.12/22
| Parameter | Value |
|---|---|
| Amt of sequence data obtained (Mb) with the following library type/name: | |
| 2 × 100, 500-bp inserts | |
| Initially | 1,668 |
| After quality filtering | 1,350 |
| 2 × 100, 2-kb inserts | |
| Initially | 615 |
| After quality filtering | 502 |
| 2 × 100, 5-kb inserts | |
| Initially | 651 |
| After quality filtering | 502 |
| Assembly | |
| Total no. of scaffolds in main genome | 85 |
| Total no. of contigs in main genome | 576 |
| Main genome scaffold sequence total (Mb) | 13.0 |
| Main genome contig sequence total (Mb) | 12.8 |
| Max scaffold size (Mb) | 1.4 |
| Minimum scaffold size (kb) | 1 |
| Main genome scaffold N50 size (Mb) | 0.7 |
| % main genome in scaffolds of >50 kb | 97.6 |
| Predicted gene models | |
| Avg gene length (bp) | 1,569 |
| Avg protein length (amino acids) | 510 |
| Avg exon frequency per gene | 1.15 |
| Avg exon length (bp) | 1,335 |
| Avg intron length (bp) | 248 |
| Predicted gene models and supporting lines of evidence | |
| No. of gene models | 5,255 |
| % complete (with start and stop codons) | 99.9 |
| % genes with homology support | 95.0 |
| Functional annotation of proteins (no. of proteins assigned a GO term) | 4,348 |
Variant analysis.
Single nucleotide variation and indel analysis was performed by mapping the ST05.12/22 reads to both the AWRI 1499 and CBS 2499 genome assemblies. Compared to the sequence of AWRI 1499, a total of 65,535 SNPs, or 5.04 SNPs per kb, were found, and of these, 50.4% were homozygous and 49.6% were heterozygous in ST05.12/22 (see Data Set S1 in the supplemental material). Further, a total of 14,092 indels (<8 bp) were called, and the average density was 1.08 indels per kb (see Data Set S2 in the supplemental material). The majority of these indels represented deletions (92.7%). Compared to the CBS 2499 genome assembly, 82,676 nucleotide variations were found, among which there were 79,421 SNPs (6.11 per kb; 87.7% heterozygous, 22.3% homozygous; see Data Set S3 in the supplemental material) and 3,255 indels (0.25 per kb; 68.2% deletions; see Data Set S4 in the supplemental material). SNPs and indels were not uniformly distributed across the ST05.12/22 genome assembly, with some regions showing much higher SNP or indel densities than others (see Fig. S2 in the supplemental material).
Ploidy level and allelic relationships.
Given the triploid nature of AWRI 1499, comprising a moderately heterozygous diploid and a third divergent haploid (24, 34), and the fact that CBS 2499 was recently confirmed to be a diploid (34), it was of interest to investigate the genomic organization of our strain in relation to that of both reference strains. First, the ploidy level of ST05.12/22 was estimated by taking advantage of allele proportions. In a diploid genome, it is expected that the average frequency of a particular allele at a heterozygous site will be about 0.5, while this would be closer to 0.66 for heterozygous sites in a triploid. As can be seen in Fig. 4, ST05.12/22 showed a maximum average allele frequency consistent with a diploid state, suggesting that ST05.12/22 is diploid. In order to determine whether the diploid strains contained the divergent haplotype of AWRI 1499, five loci that displayed three clearly defined haplotypes in AWRI 1499 (24, 34) were investigated. Maximum likelihood phylogenies were constructed on the basis of the corresponding individual haplotype sequences for AWRI 1499 (3 sequences for each locus), CBS 2499 (2 sequences for each locus), and ST05.12/22 (2 sequences for each locus). Two of the three alleles of AWRI 1499 and both alleles of ST05.12/22 and CBS 2499 formed a highly related clade (Fig. 5). The third allele from AWRI 1499, on the other hand, was always divergent from that in the conserved clade. This thus confirms that B. bruxellensis has a core diploid genome, with some strains having a divergent third haploid complement of chromosomes (34). Moreover, ST05.12/22 and CBS 2499 had identical sequences for locus g1822.t1 (Fig. 5B) and exhibited only a few differences for g2560.t1 (1 identical allele and 1 allele having 99.8% identity; Fig. 5D) and g3222.t1 (1 identical allele and 1 allele having 99.9% identity; Fig. 5E). For locus g1851.t1 (Fig. 5C), the three yeasts had one identical allele and one showing differences across the three isolates (between 99.5 and 99.8% identity).
FIG 4.

Allele frequency distribution histogram suggesting that Brettanomyces (Dekkera) bruxellensis ST05.12/22 is a diploid strain. Calculations are based on the triploid reference strain AWRI 1499 (A) and the diploid strain CBS 2499 (B).
FIG 5.

Haplotype analysis of the three investigated Brettanomyces (Dekkera) bruxellensis isolates, ST05.12/22, AWRI 1491, and CBS 2499. Distinct haplotypes were assembled for five conserved open reading frames and subjected to maximum likelihood phylogenies. These five loci represent genes encoding a nuclear protein required for actin cytoskeleton (g1134.t1) (A), a DNA primase small subunit (g1822.t1) (B), a protein component of the H/ACA small nucleolar RNA pseudouridylase complex (g1851.t1) (C), and two hypothetical proteins (g2560.t1 and g3222.t1) (D and E). Bootstrap values (based on 1,000 replicates) are given at the nodes of the tree.
Structural genome variation.
Structural genome variation between ST05.12/22 and both reference strains was further investigated by CNV determination. Compared to the sequence of AWRI 1499, CNVnator analysis enabled the identification of 61 CNVs (>1 kb), including 44 genomic duplications and 17 large deletions. Regarding the duplications, at least four genomic regions encoding a total of 69 genes (GenBank accession numbers AHIQ01000029 [29 kb], AHIQ01000031 [20 kb], AHIQ01000102 [43 kb], and AHIQ01000195 [7 kb]) displayed a doubled copy number (4n or greater; normalized read depth ≥ 2) in ST05.12/22. Normalized read depths of 0 were obtained for two deletions (GenBank accession numbers AHIQ01000315 and AHIQ01000316), suggesting that no copy was retained in ST05.12/22 (see Data Set S5 in the supplemental material). BLAST analysis of the AWRI 1499 CDSs corresponding to the 17 predicted deletions against the ST05.12/22 assembly yielded a number of genes belonging to five deletions that could not be clearly aligned to the ST05.12/22 genome (no hit or a worse match; GenBank accession numbers AHIQ01000211, AHIQ01000280, AHIQ01000303, AHIQ01000315, and AHIQ01000316; 26 genes in total; see Data Set S5 in the supplemental material), suggesting the presence of five completely deleted regions. Compared to the sequence of CBS 2499, 40 regions with deletions and 40 duplications were found, with 7 having a normalized read depth score of ≥2 (in total, harboring 11 genes; scaffold 1, 4 kb; scaffold 2, 4.7 kb; scaffold 3, 2.6 kb; scaffold 6, 1.4 kb and 1.2 kb; scaffold 9, 3.6 kb; and scaffold 10, 2.5 kb). Regarding the deletions, several regions were found to have normalized read depths close to 0 (see Data Set S6 in the supplemental material). However, BLAST analysis of the CBS 2499 translated sequences corresponding to the deleted regions was carried out and reduced the number of deletions to four regions (scaffolds 17, 18, 20, and 24; 42 genes) (see Data Set S6 in the supplemental material). PCR analysis followed by amplicon sequencing of at least one gene corresponding to each of the deletions predicted by CNVnator confirmed the loss of five regions (26 genes) and four regions (42 genes) compared to the sequences of AWRI 1499 and CBS 2499, respectively (see Data Sets S5 and S6 in the supplemental material; for primers, see Table S1 in the supplemental material).
BLAST analysis of the AWRI 1499 genome sequence using the ST05.12/22 assembly as a reference revealed a total of 30 genes that were uniquely found in AWRI 1499 (E value, <e−10). Ten out of these 30 genes were also found by the CNV analysis and were confirmed by PCR to be present in AWRI 1499 and missing in ST05.12/22. The other 20 genes represented open reading frames (ORFs) encoding putative proteins. However, their absence in ST05.12/22 could not be confirmed by additional BLAST analysis of these genes against the ST05.12/22 assembly or by PCR analysis, except for two genes (GenBank accession numbers EIF47553 and EIF48003) (see Data Set S7 in the supplemental material; for primers, see Table S1 in the supplemental material). Likewise, BLAST analysis of the CBS 2499 assembly revealed 16 genes that were present in CBS 2499 but missing in ST05.12/22, among which 10 were found by the CNV analysis and/or confirmed by PCR (see Data Set S8 in the supplemental material). Vice versa, 36 and 17 genes were missing in AWRI 1499 and CBS 2499, respectively, and present in ST05.12/22. Two genes for which a function has not yet been determined were confirmed using PCR to be present only in the beer strain and not in AWRI 1499 (see Data Set S9 in the supplemental material; for primers, see Table S1 in the supplemental material). No genes were confirmed to be present in ST05.12/22 and absent in CBS 2499 (see Data Set S10 in the supplemental material; for primers, see Table S1 in the supplemental material).
Altogether, these analyses resulted in a total of 20 genes, clustered in four islands, that are present in both wine strains (AWRI 1499 and CBS 2499) but missing in the beer strain (ST05.12/22) (Table 3; the results are also illustrated in Fig. S3 in the supplemental material [61]). The presence of these 20 genes in AWRI 1499 and CBS 2499 and their absence in ST05.12/22 was confirmed by subjecting the different strains to a PCR screen (reciprocally tested) (see Data Sets S5 and S6 in the supplemental material; for primers, see Table S1 in the supplemental material). No genes that occurred in ST05.12/22 but that did not exist in both AWRI 1499 and CBS 2499 were found. The gene clusters present in both wine strains but missing in ST05.12/22 represented 2 genes on the AWRI 1499 reference contig with GenBank accession number AHIQ01000211 (CBS 2499 scaffold 18), 12 on the sequence with GenBank accession number AHIQ01000280 (CBS 2499 scaffold 17), 4 on the sequence with GenBank accession number AHIQ01000303 (CBS 2499 scaffold 24), and 2 on the sequence with GenBank accession number AHIQ01000316 (CBS 2499 scaffold 20). Interestingly, on the second deletion region, these genes encoded proteins involved in the uptake of sugars, the efflux of drugs, or several carbon metabolic processes, encoding a galactose-1-phosphate uridylyltransferase, a galactokinase, a GAL10 bifunctional protein, a dTDP-glucose dehydratase, a maltase, and a β-glucosidase. A paralogue of this β-glucosidase (sharing 68% and 67% sequence identity with AWRI 1499 [GenBank accession number EIF45415] and CBS 2499 [JGI transcript number 51487] on the nucleotide and protein levels, respectively) was found elsewhere in the ST05.12/22 genome (scaffold 8, gene 2952, β-glucosidase), and AWRI 1499 and CBS 2499 were also found to contain a homologue (GenBank accession number EIF48743; the contig with GenBank accession number AHIQ01000078; JGI transcript number 26490; scaffold 17; 97% nucleotide sequence identity with the sequence of gene 2952 in the beer strain) for this paralogue. For each β-glucosidase, both wine strains had identical homologues. Additionally, apart from another gene involved in carbon metabolism (β-galactosidase), a cluster of three genes involved in nitrogen metabolism (nitrate reductase, nitrite reductase, and nitrate transporter) was found to be present in AWRI 1499 and CBS 2499 but missing in ST05.12/22. Consistent with these findings, AWRI 1499 and CBS 2499, both containing the nitrate assimilation gene cluster, were found to grow on nitrate as the sole nitrogen source (tested as mentioned in reference 1), whereas ST05.12/22, which lacked this gene cluster, was not (Fig. 6).
TABLE 3.
Genes present in Brettanomyces bruxellensis AWRI 1499 (ST05.12/62) and CBS 2499 (ST05.12/56) and absent in ST05.12/22a
| AWRI 1499 CDS accession no. | CBS 2499 JGI transcript identifier | AWRI 1499 contig GenBank accession no. | CBS 2499 scaffold (JGI name) | Functionb | GenBank homology (BLASTX)c |
|||
|---|---|---|---|---|---|---|---|---|
| Organism (GenBank accession no.) | % identity | E valued | S scoree | |||||
| EIF46399 | 8711 | AHIQ01000211 | Scaffold 18 | Pantothenate transporter Fen2 | Meyerozyma guilliermondii ATCC 6260 (XP_001482616) | 63.34 | 0.0 | 1,538 |
| EIF46400 | 23063 | AHIQ01000211 | Scaffold 18 | Upf0145 protein | Streptomyces sp. R1-NS-10 (WP_019070227) | 55.66 | 4e−34 | 316 |
| EIF45404 | 26687 | AHIQ01000280 | Scaffold 17 | MFS drug transporter | Meyerozyma guilliermondii ATCC 6260 (XP_001482160) | 55.11 | 2e−177 | 1,342 |
| EIF45405 | 51428 | AHIQ01000280 | Scaffold 17 | Putative MFS-MDR transporter | Ogataea parapolymorpha DL-1 (EFW97434) | 45.75 | 6e−137 | 1,073 |
| EIF45407 | 62814 | AHIQ01000280 | Scaffold 17 | High-affinity glucose transporter | Scheffersomyces stipitis CBS 6054 (XP_01382755) | 71.38 | 0.0 | 2,037 |
| EIF45408 | 26690 | AHIQ01000280 | Scaffold 17 | Galactose-1-phosphate uridylyltransferase | Scheffersomyces stipitis CBS 6054 (XP_001383359) | 65.94 | 8e−179 | 1,322 |
| EIF45409 | 8686 | AHIQ01000280 | Scaffold 17 | Galactokinase | Meyerozyma guilliermondii ATCC 6260 (EDK41764) | 54.07 | 3e−152 | 1,164 |
| EIF45410 | 26691 | AHIQ01000280 | Scaffold 17 | GAL10 bifunctional protein | Candida tenuis ATCC 10573 (EGV61616) | 58.08 | 0.0 | 2,080 |
| EIF45411 | 26692 | AHIQ01000280 | Scaffold 17 | dTDP-glucose dehydratase | Debaryomyces hansenii CBS767 (XP_457784) | 49.02 | 8e−99 | 787 |
| EIF45412 | 78562 | AHIQ01000280 | Scaffold 17 | Hexose transporter | Candida intermedia (CAO79523) | 47.73 | 6e−144 | 1,118 |
| EIF45413 | 8690 | AHIQ01000280 | Scaffold 17 | Maltase | Saccharomyces kudriavzevii IFO 1802 (EJT44539) | 63.4 | 0.0 | 1,954 |
| EIF45414 | 36189 | AHIQ01000280 | Scaffold 17 | Multidrug resistance regulator 1 | Ogataea parapolymorpha DL-1 (EFW97551) | 34.62 | 4e−61 | 584 |
| EIF45415 | 51487 | AHIQ01000280 | Scaffold 17 | β-Glucosidase | Schwanniomyces etchellsii (ACF93471) | 59.26 | 0.0 | 2,706 |
| EIF45416 | 51392 | AHIQ01000280 | Scaffold 17 | Hexose transporter | Wickerhamomyces ciferrii (CCH41021) | 50.36 | 0.0 | 1,439 |
| EIF45248 | 26813 | AHIQ01000303 | Scaffold 24 | β-Galactosidase | Kluyveromyces lactis NRRL Y-1140 (XP_452194) | 58.39 | 0.0 | 1,575 |
| EIF45249 | 51850 | AHIQ01000303 | Scaffold 24 | Nitrate reductase | Ogataea parapolymorpha DL-1 (EFW95688) | 59.32 | 0.0 | 2,067 |
| EIF45250 | 26815 | AHIQ01000303 | Scaffold 24 | Nitrite reductase | Ogataea parapolymorpha DL-1 (EFW95689) | 62 | 0.0 | 1,159 |
| EIF45251 | 145655 | AHIQ01000303 | Scaffold 24 | Nitrate transporter | Ogataea parapolymorpha DL-1 (EFW95690) | 59 | 0.0 | 604 |
| EIF45193 | 8788 | AHIQ01000316 | Scaffold 20 | Cytochrome mitochondrial precursor | Spathaspora passalidarum NRRL Y-27907 (EGW32589) | 50.68 | 2e−113 | 904 |
| EIF45194 | 31164 | AHIQ01000316 | Scaffold 20 | Fungus-specific transcription factor domain protein | Kluyveromyces lactis NRRL Y-1140 (XP_453742) | 45.55 | 7e−97 | 876 |
As determined by read depth analysis (CNVnator) and/or BLAST analysis of the AWRI 1499 and CBS 2499 genome sequence against the ST05.12/22 genome assembly and confirmed by a PCR screen (see also Data Sets S5 and S6 in the supplemental material).
Based on the best B. bruxellensis GenBank BLASTX hit.
B. bruxellensis hits excluded.
E value, expected value.
Bit score calculated by the BLAST algorithm.
FIG 6.
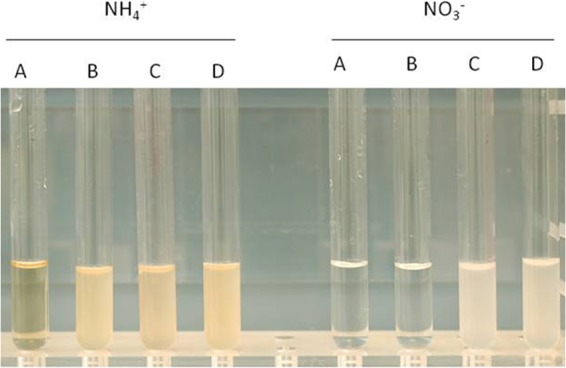
Phenotypic analysis of Brettanomyces (Dekkera) bruxellensis strains growing on either ammonium (NH4+) or nitrate (NO3−) (the strains were incubated for 7 days at 25°C). Both AWRI 1499 (ST05.12/56 [tube C]) and CBS 2499 (ST05.12/62 [tube D]) show growth, whereas ST05.12/22 (tube B) was not able to grow in medium with nitrate as the sole nitrogen source. Tube A represents the negative control (noninoculated medium).
Distribution of genes uniquely found in AWRI 1499 and CBS 2499 but missing in ST05.12/22.
The existence of strain-specific genes suggests that these genes may have been lost in a particular strain or may have been acquired from another strain or species. BLASTX analysis of the genes uniquely found in both wine strains revealed high homology (E value, <1e−19) with genes from other yeasts, such as Candida, Debaryomyces, Kluyveromyces, Meyerozyma, Ogataea, Saccharomyces, Scheffersomyces, Spathaspora, Schwanniomyces, and Wickerhamomyces (Table 3). However, the highest homology to the gene encoding a heavy metal binding protein in B. bruxellensis was found in a taxon completely unrelated to B. bruxellensis, a Streptomyces species (E value, 1e−34) (Table 3), which could have acted as a donor species for this gene. A PCR screen (for primers, see Table S1 in the supplemental material) of the gene cluster targeting the β-galactosidase, the nitrate reductase, the nitrite reductase, and the adjacent nitrate transporter genes revealed that strains scoring positive or negative for one of these four genes generally also scored similarly for the remaining genes (Table 4). This suggests that this gene cluster has been completely lost in certain isolates. All but one isolate from the Cantillon Brewery (ST05.12/48, subcluster II-B; all other isolates were subcluster II-D) had lost this gene cluster. In addition, isolates ST05.12/12.21, ST05.12/28, and ST05.12/40 displayed this genomic deletion. Additionally, the three phylogenetically closely related beer isolates ST05.12/25, ST05.12/26, and ST05.12/27 (>99% fingerprint similarity [Fig. 2]) were found to contain the nitrate transporter gene, while they had lost the genes encoding the β-galactosidase, the nitrate reductase, and the nitrite reductase. Consistent with these findings, all isolates containing the complete nitrate assimilation gene cluster displayed robust growth on nitrate as the sole nitrogen source, whereas the isolates missing (part of) this gene cluster did not (Table 4). Further analysis of the three genes involved in the assimilation of nitrate revealed that all three genes were heterozygous in ST05.12/18, ST05.12/59, AWRI 1499 (ST05.12/62), and CBS 2499 (ST05.12/56), whereas they were homozygous in the other strains. Additionally, isolates from genotype cluster II-B had highly conserved sequences for the three genes (the nitrate reductase and nitrate transporter genes were identical for all isolates; the nitrite reductase gene was identical for almost all isolates) (Fig. 7), illustrating their high degree of genetic relatedness.
TABLE 4.
Distribution of genesa uniquely found in Brettanomyces bruxellensis AWRI 1499 (ST05.12/62) and CBS 2499 (ST05.12/56) over different Brettanomyces strains
| GenBank accession no. of CDS | Function | Presence of gene in the following Brettanomyces bruxellensis ST05.12 strainb: |
|||||||||||||||||||||||||
|---|---|---|---|---|---|---|---|---|---|---|---|---|---|---|---|---|---|---|---|---|---|---|---|---|---|---|---|
| 16* | 18* | 21 | 23* | 24* | 25 | 26 | 27 | 28 | 30 | 33* | 34* | 36* | 40 | 48* | 49 | 50 | 51 | 52 | 53 | 54 | 55* | 56* | 59* | 22 | 62* | ||
| Contig AHIQ01000280 | |||||||||||||||||||||||||||
| EIF45409 | Galactokinase | + | + | + | + | + | + | + | + | + | + | + | + | + | + | + | + | ||||||||||
| EIF45411 | dTDP-glucose dehydratase | + | + | + | + | + | + | + | + | + | + | + | + | + | + | + | |||||||||||
| EIF45413 | Maltase | + | + | + | + | + | + | + | + | + | + | + | + | + | + | + | + | + | |||||||||
| EIF45415 | β-Glucosidase | + | + | + | + | + | + | + | |||||||||||||||||||
| Contig AHIQ01000303 | |||||||||||||||||||||||||||
| EIF45248 | β-Galactosidase | + | + | + | + | + | + | + | + | + | + | + | + | + | + | ||||||||||||
| EIF45249 | Nitrate reductase | + | + | + | + | + | + | + | + | + | + | + | + | + | + | ||||||||||||
| EIF45250 | Nitrite reductase | + | + | + | + | + | + | + | + | + | + | + | + | + | + | ||||||||||||
| EIF45251 | Nitrate transporter | + | + | + | + | + | + | + | + | + | + | + | + | + | + | + | + | + | |||||||||
Determined by PCR amplification using primers targeting the almost complete ORF (for primers, see Table S1 in the supplemental material); PCR amplification was performed with 10 ng genomic DNA. All bands were of the expected size.
Strains marked with an asterisk were able to utilize nitrate as the sole nitrogen source. All isolates, with the exception of ST05.12/30 and ST05.12/54, were able to utilize ammonium in our assay. +, band; blank cell, no band.
FIG 7.

Phylogenetic analysis of the nitrate assimilation cluster in B. bruxellensis. Maximum likelihood phylogenies were prepared from the haplotype-resolved ORFs for the predicted nitrate reductase (A), nitrite reductase (B), and nitrate transporter (C) proteins. Bootstrap values (based on 1,000 replicates) are given at the nodes of the tree. The origin of the different strains, i.e., beer, soft drinks, and wine, are highlighted in green, orange, and red, respectively. Circles, the parent strain was able to utilize nitrate as a nitrogen source; squares, the parent strain was unable to utilize nitrate as a nitrogen source; triangles, no conclusions regarding nitrate assimilation could be made (the strains were also found to be negative on ammonium in our assay). All three genes were heterozygous in ST05.12/18, ST05.12/56 (CBS 2499), ST05.12/59, and ST05.12/62 (AWRI 1499) but were homozygous in the other strains. Strains ST05.12/25, ST05.12/26, and ST05.12/27 lost the nitrate and nitrite reductase genes. In addition to the B. bruxellensis strains investigated in this study, strain AWRI 1608, which is unable to utilize nitrate (34), was included in the analysis.
For the galactokinase, dTDP-glucose dehydratase, maltase, and β-glucosidase genes, positive and negative PCR results were found to be scattered over the different isolates tested (Table 4). For example, of the 26 isolates tested, 17 scored positive for the maltase gene, while only 7 scored positive for the β-glucosidase gene (Table 4). The random distribution of these genes over the B. bruxellensis clade could potentially be explained by the possession of all these genes by a common ancestor and then the loss of these genes by some strains in the course of evolution. Alternatively, this may be explained by the fact that the primers developed (on the basis of the AWRI 1499 genome sequence) may have had one or more mismatches in comparison to the sequences of the tested strains and so amplification failed.
DISCUSSION
Despite their economic importance because of either their spoilage activity or their appreciated activity in specific beers, the ecology and genetic relationships between and within Brettanomyces yeasts are still poorly understood. Here, we studied the genetic relationships between different Brettanomyces strains from all recognized Brettanomyces species isolated from several food-related sources and geographic areas and compared the genome sequences of a beer strain and wine strains.
First, all isolates were subjected to phylogenetic analysis based on LSU rRNA gene sequences and a number of established DNA fingerprinting techniques. Our results support earlier findings that Brettanomyces yeasts form a genetically diverse clade, even within a species, and are represented by several subgroupings (1, 16, 17, 32). Interestingly, expansion of our phylogenetic tree with all B. bruxellensis LSU rRNA gene sequences available in GenBank (55 additional sequences; August 2013) revealed no additional subclade within our B. bruxellensis clade (displaying a total of 13 polymorphic sites between the different B. bruxellensis isolates on a fragment of about 400 bp) (see Fig. S4 in the supplemental material). A noteworthy finding was that in this analysis, all spoilage isolates collected from soft drinks, such as cola and ginger ale, or bantu beer grouped together and apart from all wine and most beer isolates, suggesting a link between the genotype and origin of the strains. Indeed, cluster analysis of the B. bruxellensis fingerprints obtained in this study indicates a strong correlation between the genetic profiles and the isolation source rather than the geographic origin or year of isolation, thus suggesting niche adaptation. These results are in agreement with previously reported findings on Brettanomyces (for example, see references 1 and 16). Also, for other microorganisms, clustering of isolates according to the niche where they were isolated has been reported (62, 63). Conversely, our results disagree with what has been found for, for example, Saccharomyces paradoxus, a Saccharomyces species not related to industrial processes, for which geography seems more important than ecology in shaping the yeast's population structure (64). For S. cerevisiae, a mixed population structure was found, with lineages corresponding to geographic origin and others corresponding to niche (65). Interestingly, almost all wild isolates collected in this work (from the Cantillon Brewery) clustered separately. This also resembles the findings of Vigentini et al. (16), who found that almost all their wild (wine) B. bruxellensis isolates were clearly separated from the CBS reference strains, representing isolates from different niches, also including wine isolates. It remains to be investigated whether these differences have a biological meaning or can be explained by the fact that the reference strains have become adapted to laboratory conditions, accompanied by changes in their genetic backbone (66).
In order to further investigate the genetic differences between strains originating from a different niche, a comparative genome analysis was carried out between a beneficial B. bruxellensis strain isolated from lambic beer fermentation (ST05.12/22) (sequenced in this study) and two wine spoilage strains, including one triploid strain (AWRI 1499 [ST05.12/62]) and one diploid strain (CBS 2499 [ST05.12/56]) that were used as reference strains. In this study, ST05.12/22 was determined to be diploid, possessing a pair of closely related chromosomes with moderate levels of heterozygosity. Interestingly, triploid B. bruxellensis strains have been found to represent the vast majority of isolates from the wine industry (34), suggesting that the additional chromosome may confer a selective advantage for these strains in wineries. Also in Saccharomyces, interspecific hybrids that are allotriploid have been found. These hybrids have been isolated from cold wine-making and brewing environments, where it is suggested that the allotriploid hybrids have a selective advantage over their parents (67, 68). So far, no other data on the ploidy level of B. bruxellensis strains isolated from other niches, such as beer, are available. Further research should therefore be performed to find out whether a correlation exists between the level of ploidy and the niche in which the strains occur.
In addition to strain-specific SNPs or indels, structural genome variation was found between our strain and both wine strains, with some genomic regions being duplicated and others being deleted in ST05.12/22. Further examination of the functional annotation of the genes duplicated in the beer strain compared to their number in the wine strains revealed no indications that our beer strain would contain duplicated genes favoring its survival in beer. Of the genomic loci that were absent in the beer strain, two regions were of particular interest. These involved either the B. bruxellensis nitrate assimilation cluster or a cluster of genes involved in carbon metabolism, two phenotypic features that have been shown to vary considerably between B. bruxellensis strains (2). For example, nearly one-third of B. bruxellensis wine isolates failed to grow on nitrate as the sole nitrogen source (2). Additionally, while most isolates could grow on the hexose monosaccharides glucose and fructose and the disaccharides sucrose, maltose, cellobiose, and trehalose, about one-fifth of the tested isolates were unable to grow on galactose. Further, sugars such as arabinose, lactose, and raffinose did not support the growth of most isolates (2). Woolfit et al. (22) reported the presence of five genes involved in nitrate assimilation in B. bruxellensis CBS 2499, including genes encoding a nitrate reductase, a nitrite reductase, and a nitrate transporter, as well as two regulatory genes encoding a Zn(II)2Cys6 transcriptional factor for nitrate induction. Strains of Hansenula polymorpha in which any of these genes were disrupted lost their ability to grow on nitrate (64, 69, 70), showing their necessity in the assimilation of nitrate. Recently, it has been shown that the ability to assimilate nitrate can render B. bruxellensis able to outcompete S. cerevisiae in industrial fermentations, as S. cerevisiae cannot use nitrate (71). Furthermore, nitrate assimilation has been shown to give B. bruxellensis an improved ability to grow under anaerobic conditions and improve its fermentative metabolism (72). Along with an adjacent β-galactosidase gene, this cluster is specifically missing in ST05.12/22. On the basis of these findings, it may be speculated that this gene cluster is less important for B. bruxellensis in certain fermentation systems such as brewing, thereby providing a selective pressure for its loss. On the other hand, whereas many beer isolates indeed presented nitrate-negative phenotypes, PCR screening and phenotypic testing of our B. bruxellensis isolates did not reveal a clear correlation between the ability to assimilate nitrate and their niche. Nonetheless, out of the five isolates from soft drinks tested (including one from bantu beer), four isolates were nitrate positive. Further research with more isolates from different origins is needed to elucidate whether a correlation exists between (non)nitrate utilization phenotypes and niche. As soft drinks are often nitrogen poor (73), it may be expected that the ability to use nitrate may give microbes with nitrate utilization phenotypes an advantage to cause spoilage over microbes that cannot utilize nitrate.
Interestingly, in many strains (10 out of 14 containing the whole nitrate assimilation gene cluster), the nitrate assimilation gene cluster was shown to have undergone a loss of heterozygosity, resulting in identical alleles (haplotyped sequences). In contrast to the findings of Borneman et al. (34), our results do not support the suggestion that a loss of heterozygosity in these genes is correlated with the inability to utilize nitrate, as all isolates which contained the complete gene cluster and showed growth on ammonium also displayed robust growth on nitrate as the sole nitrogen source. Further research should elucidate the impact of this loss of heterozygosity for nitrate assimilation in different ecosystems. In contrast, isolates that had lost part of the gene cluster or the complete gene cluster were unable to utilize nitrate. The sequences of the homozygous strain AWRI 1608, which was unable to grow on nitrate, despite containing the complete nitrate assimilation locus (34), revealed that its nitrite reductase and nitrate transporter gene sequences were identical to those of other strains able to grow on nitrate. For the nitrate reductase gene, however, a difference of at least one amino acid between AWRI 1608 and our strains was found (aspartic acid in AWR 1608 versus serine in our strains), and this could have led to a less efficient enzyme and, thus, to less efficient nitrate assimilation. However, further research, e.g., by subjecting this strain to the nitrate assimilation test performed in our study, is needed to confirm this.
Further, in comparison with both wine strains, our beer strain was found to lack a cluster of 12 genes, among which the majority was involved in carbon metabolism, encoding a galactose-1-phosphate uridylyltransferase, a galactokinase, a GAL10 bifunctional protein, a dTDP-glucose dehydratase, a maltase, and a β-glucosidase. Together with the β-galactosidase mentioned above, the first three enzymes are involved in the metabolism of galactose. β-Glucosidases are well-known for their role in flavor development in beer and wine (74, 75). Additionally, β-glucosidase has been shown to play a role in the fermentation of cellobiose by B. bruxellensis (76–79). Interestingly, we found that ST05.12/22 did contain another β-glucosidase gene, which was also present in AWRI 1499 and CBS 2499. Further research is needed to investigate whether the presence of this second β-glucosidase results in differences in glucosidase activity and the flavoring capability of B. bruxellensis strains. Furthermore, further studies to determine how substrates and growth conditions affect the production of flavor compounds is needed, and the findings of such studies may help explain to us why specific strains are, for example, not associated with any off flavor.
The phenomenon of the loss of nutrient utilization is reminiscent of the concerted loss of the galactose catabolism cluster in Japanese S. cerevisiae isolates compared to European isolates, probably due to the fact that particular functions in the pathway have fitness costs (80). A PCR screen performed on a selection of genes involved in carbon or nitrogen assimilation revealed a different distribution of the genes across the B. bruxellensis clade, corroborating the phenotypic diversity between different B. bruxellensis strains observed earlier (1). Further study of nitrate and carbon assimilation will reveal more insights into what drives phenotypes toward or away from the utilization of specific nitrogen or carbon sources. Further, by comparing sufficiently large sets of whole genomes, coupled with functional and phenotypic analyses, we hope to be able to answer the question whether there are distinct groups of B. bruxellensis isolates which have a distinct impact on the production of beer and wine or other beverages or, more generally, to further understand the behavior of this economically important yeast.
Supplementary Material
ACKNOWLEDGMENTS
We are grateful to G. Derdelinckx (KU Leuven) and F. Bajoulkakahi for assisting with the isolation of the B. bruxellensis strains. In addition, we thank everybody who provided us with Brettanomyces strains and especially the Cantillon Brewery for giving us the opportunity to sample within their brewery. We appreciate the help of A. Justé for performing the molecular analyses and C. Verreth for technical assistance. Finally, we are grateful to C. D. Curtin for discussing our results.
Footnotes
Published ahead of print 9 May 2014
Supplemental material for this article may be found at http://dx.doi.org/10.1128/AEM.00601-14.
REFERENCES
- 1.Conterno L, Lucy Joseph CM, Arvik TJ, Henick-Kling T, Bisson LF. 2006. Genetic and physiological characterization of Brettanomyces bruxellensis strains isolated from wines. Am. J. Enol. Vitic. 57:139–147 [Google Scholar]
- 2.Chattonet P, Dubourdieu D, Boidron J, Pons M. 1992. The origin of ethylphenols in wines. J. Sci. Food Agric. 60:165–178. 10.1002/jsfa.2740600205 [DOI] [Google Scholar]
- 3.Rodrigues N, Gonçalves G, Pereira-da-Silva S, Malfeito-Ferreira SM, Loureiro V. 2001. Development and use of a new medium to detect yeast of the genera Dekkera/Brettanomyces sp. J. Appl. Microbiol. 90:588–599. 10.1046/j.1365-2672.2001.01275.x [DOI] [PubMed] [Google Scholar]
- 4.Lattey KA, Bramley BR, Francis IL. 2010. Consumer acceptability, sensory properties and expert quality judgements of Australian cabernet sauvignon and Shiraz wines. Aust. J. Grape Wine Res. 16:189–202. 10.1111/j.1755-0238.2009.00069.x [DOI] [Google Scholar]
- 5.Loureiro V, Malfeito-Ferreira M. 2003. Spoilage yeasts in the wine industry. Int. J. Food Microbiol. 86:23–50. 10.1016/S0168-1605(03)00246-0 [DOI] [PubMed] [Google Scholar]
- 6.Martens H, Iserentant D, Verachtert H. 1997. Microbial aspects of a mixed yeast-bacterial fermentation in the production of a special Belgian acidic ale. J. Inst. Brew. 103:85–91. 10.1002/j.2050-0416.1997.tb00939.x [DOI] [Google Scholar]
- 7.Vanbeneden N, Gils F, Delvaux G, Delvaux FR. 2008. Formation of 4-vinyl and 4-ethyl derivatives from hydroxycinnamic acids: occurrence of volatile phenolic flavour compounds in beer and distribution of Pad 1-activity among brewing yeasts. Food Chem. 107:221–230. 10.1016/j.foodchem.2007.08.008 [DOI] [Google Scholar]
- 8.Passoth V, Blomqvist J, Schnürer J. 2007. Dekkera bruxellensis and Lactobacillus vini form a stable ethanol-producing consortium in a commercial alcohol production process. Appl. Environ. Microbiol. 73:4354–4356. 10.1128/AEM.00437-07 [DOI] [PMC free article] [PubMed] [Google Scholar]
- 9.Smith MT, van Grinsven AM. 1984. Dekkera anomala sp. nov., the teleomorph of Brettanomyces anomalus, recovered from spoiled soft drink. Antonie Van Leeuwenhoek 50:143–148. 10.1007/BF00400174 [DOI] [PubMed] [Google Scholar]
- 10.Kolfschoten GA, Yarrow D. 1970. Brettanomyces naardenensis, a new yeast from soft drinks. Antonie Van Leeuwenhoek 36:458–460. 10.1007/BF02069047 [DOI] [PubMed] [Google Scholar]
- 11.Hayashi N, Arai R, Tada S, Taguchi H, Ogawa Y. 2007. Detection and identification of Brettanomyces/Dekkera sp. yeasts with a loop-mediated isothermal amplification method. Food Microbiol. 24:778–785. 10.1016/j.fm.2007.01.007 [DOI] [PubMed] [Google Scholar]
- 12.Cosentino S, Fadda ME, Deplano M, Mulargia AF, Palmas F. 2001. Yeasts associated with Sardinian ewe's dairy products. Int. J. Food Microbiol. 69:53–58. 10.1016/S0168-1605(01)00572-4 [DOI] [PubMed] [Google Scholar]
- 13.Coton E, Coton M, Levert D, Casaregola S, Sohier D. 2006. Yeast ecology in French cider and black olive natural fermentations. Int. J. Food Microbiol. 108:130–135. 10.1016/j.ijfoodmicro.2005.10.016 [DOI] [PubMed] [Google Scholar]
- 14.Teoh AL, Heard G, Cox J. 2004. Yeast ecology of kombucha fermentation. Int. J. Food Microbiol. 95:119–126. 10.1016/j.ijfoodmicro.2003.12.020 [DOI] [PubMed] [Google Scholar]
- 15.Van der Walt JP. 1961. Brettanomyces custersianus nov. spec. Antonie Van Leeuwenhoek 27:332–336. 10.1007/BF02538463 [DOI] [PubMed] [Google Scholar]
- 16.Vigentini I, De Lorenzis G, Picozzi C, Imazio S, Merico A, Galafassi S, Piskur J, Foschino R. 2012. Intraspecific variations of Dekkera/Brettanomyces bruxellensis genome studied by capillary electrophoresis separation of the intron splice site profiles. Int. J. Food Microbiol. 157:6–15. 10.1016/j.ijfoodmicro.2012.02.017 [DOI] [PubMed] [Google Scholar]
- 17.Curtin CD, Bellon JR, Henscke PA, Godden PW, de Barros Lopes MA. 2007. Genetic diversity of Dekkera bruxellensis yeast isolated from Australian wineries. FEMS Yeast Res. 7:471–481. 10.1111/j.1567-1364.2006.00183.x [DOI] [PubMed] [Google Scholar]
- 18.Ibeas JI, Lozano I, Perdigones F, Jimenez J. 1996. Detection of Dekkera-Brettanomyces strains in sherry by a nested PCR method. Appl. Environ. Microbiol. 62:998–1003 [DOI] [PMC free article] [PubMed] [Google Scholar]
- 19.Shanta Kumara HMC, Verachtert H. 1991. Identification of lambic superattenuating micro-organisms by the use of selective antibiotics. J. Inst. Brew. 97:181–185. 10.1002/j.2050-0416.1991.tb01064.x [DOI] [Google Scholar]
- 20.Oelofse A, Lonvaud-Funel A, du Toit M. 2009. Molecular identification of Brettanomyces bruxellensis strains isolated from red wines and volatile phenol production. Food Microbiol. 26:377–385. 10.1016/j.fm.2008.10.011 [DOI] [PubMed] [Google Scholar]
- 21.Aguiliar Uscenaga MG, Delia ML, Strehaino P. 2000. Nutritional requirements of Brettanomyces bruxellensis: growth and physiology in batch and chemostat cultures. Can. J. Microbiol. 46:1046–1050. 10.1139/w00-089 [DOI] [PubMed] [Google Scholar]
- 22.Woolfit M, Rozpedowska Piskur J, Wolfe KH. 2007. Genome survey sequencing of the wine spoilage yeast Dekkera (Brettanomyces) bruxellensis. Eukaryot. Cell 6:721–733. 10.1128/EC.00338-06 [DOI] [PMC free article] [PubMed] [Google Scholar]
- 23.Piskur J, Ling Z, Marcet-Houben M, Ishchuk OP, Aerts A, LaButti K, Copeland A, Lindquist E, Barry K, Compagno C, Bisson L, Grigoriev IV, Gabaldon T, Phister T. 2012. The genome of wine yeast Dekkera bruxellensis provides a tool to explore its food-related properties. Int. J. Food Microbiol. 157:202–209. 10.1016/j.ijfoodmicro.2012.05.008 [DOI] [PubMed] [Google Scholar]
- 24.Curtin CD, Borneman AR, Chambers PJ, Pretorius IS. 2012. De-novo assembly and analysis of the heterozygous triploid genome of the wine spoilage yeast Dekkera bruxellensis AWRI1499. PLoS One 7:e33840. 10.1371/journal.pone.0033840 [DOI] [PMC free article] [PubMed] [Google Scholar]
- 25.Cocolin L, Rantsiou K, Iacumin L, Zironi R, Comi G. 2004. Molecular detection and identification of Brettanomyces/Dekkera bruxellensis and Brettanomyces/Dekkera anomalus in spoiled wines. Appl. Environ. Microbiol. 70:1347–1355. 10.1128/AEM.70.3.1347-1355.2004 [DOI] [PMC free article] [PubMed] [Google Scholar]
- 26.Egli MC, Henick-Kling T. 2001. Identification of Brettanomyces/Dekkera based on polymorphism in the rRNA internal transcribed spacer region. Am. J. Enol. Vitic. 52:241–247 [Google Scholar]
- 27.Yamada Y, Matsuda M, Maeda K, Mikata K. 1994. The phylogenetic relationships of species of the genus Dekkera Van Der Walt based on the partial sequences of 18S and 26S ribosomal RNAs (Saccharomycetaceae). Biosci. Biotechnol. Biochem. 58:1803–1808. 10.1271/bbb.58.1803 [DOI] [PubMed] [Google Scholar]
- 28.Zanol GC, Baleiras-Couto MM, Duarte FL. 2010. Restriction profiles of 26S rDNA as a molecular approach for wine yeast identification. Ciência Téc. Vitiv. 25:75–85 [Google Scholar]
- 29.Miot-Sertier C, Lonvaud-Funel A. 2007. Development of a molecular method for the typing of Brettanomyces bruxellensis (Dekkera bruxellensis) at the strain level. J. Appl. Microbiol. 102:555–562. 10.1111/j.1365-2672.2006.03069.x [DOI] [PubMed] [Google Scholar]
- 30.de Barros Lopes M, Rainieri S, Henschke PA, Langridge P. 1999. AFLP fingerprinting for analysis of yeast genetic variation. Int. J. Syst. Bacteriol. 49:915–924. 10.1099/00207713-49-2-915 [DOI] [PubMed] [Google Scholar]
- 31.Mitrakul CM, Henick-Kling T, Egli CM. 1999. Discrimination of Brettanomyces/Dekkera yeast isolates from wine by using various DNA fingerprinting methods. Food Microbiol. 16:3–4. 10.1006/fmic.1998.0217 [DOI] [Google Scholar]
- 32.Martorell P, Barata A, Malfeito-Ferreira M, Fernandez-Espinar MT, Loureiro V, Querol A. 2006. Molecular typing of the yeast species Dekkera bruxellensis and Pichia guilliermondii recovered from wine related sources. Int. J. Food Microbiol. 106:79–84. 10.1016/j.ijfoodmicro.2005.05.014 [DOI] [PubMed] [Google Scholar]
- 33.Herrero E, de la Torre MA, Valentin E. 2003. Comparative genomics of yeast species: new insights into their biology. Int. Microbiol. 6:183–190. 10.1007/s10123-003-0132-1 [DOI] [PubMed] [Google Scholar]
- 34.Borneman AR, Zeppel R, Chambers PJ, Curtin CD. 2014. Insights into the Dekkera bruxellensis genomic landscape: comparative genomics reveals variation in ploidy and nutrient utilization potential amongst wine isolates. PLoS Genet. 10:e1004161. 10.1371/journal.pgen.1004161 [DOI] [PMC free article] [PubMed] [Google Scholar]
- 35.Lievens B, Brouwer M, Vanachter ACRC, Lévesque CA, Cammue BPA, Thomma BPHJ. 2003. Design and development of a DNA array for rapid detection and identification of multiple tomato vascular wilt pathogens. FEMS Microbiol. Lett. 223:113–122. 10.1016/S0378-1097(03)00352-5 [DOI] [PubMed] [Google Scholar]
- 36.Stucky BJ. 2012. SeqTrace: a graphical tool for rapidly processing DNA sequencing chromatograms. J. Biomol. Tech. 3:90–93. 10.7171/jbt.12-2303-004 [DOI] [PMC free article] [PubMed] [Google Scholar]
- 37.Altschul SF, Gish GW, Miller W, Myers EW, Lipman DJ. 1990. Basic local alignment search tool. J. Mol. Biol. 215:403–410. 10.1016/S0022-2836(05)80360-2 [DOI] [PubMed] [Google Scholar]
- 38.Benson DA, Karsch-Mizrachi I, Clark K, Lipman D, Ostell J, Sayers EW. 2012. GenBank: update. Nucleic Acids Res. 40:D48–D53. 10.1093/nar/gkr1202 [DOI] [PMC free article] [PubMed] [Google Scholar]
- 39.Tamura K, Peterson D, Peterson N, Stecher G, Nei M, Kumar S. 2011. MEGA5: molecular evolutionary genetics analysis using maximum likelihood, evolutionary distance, and maximum parsimony methods. Mol. Biol. Evol. 28:2731–2739. 10.1093/molbev/msr121 [DOI] [PMC free article] [PubMed] [Google Scholar]
- 40.Versalovic J, Schneider M, De Brujn FJ, Lupski JR, Oliver G. 1994. Genomic fingerprinting of bacteria using repetitive sequence-based polymerase chain reaction. Methods Mol. Cell. Biol. 5:25–40 [Google Scholar]
- 41.Ipor IB, Ho WS, Tawan CS, Salmizana MS, Noryatimah M. 2007. Ecology and DNA fingerprinting of Cryptocryne pallidinervia Engler (Araceae) accessions using polymerase chain reaction M13 universal primer. Malays. Appl. Biol. 36:21–31 [Google Scholar]
- 42.Vauterin L, Vauterin P. 1992. Computer-aided objective comparison of electrophoresis patterns for grouping and identification of microorganisms. Eur. Microbiol. 1:37–41 [Google Scholar]
- 43.Fromin N, Hamelin J, Tarnawski S, Roesti D, Jourdain-Miserez K, Forestier N, Teyssier-Cuvelle S, Gillet F, Aragno M, Rossi P. 2002. Statistical analysis of denaturing gel electrophoresis (DGE) fingerprinting patterns. Environ. Microbiol. 4:634–643. 10.1046/j.1462-2920.2002.00358.x [DOI] [PubMed] [Google Scholar]
- 44.Rees GN, Baldwin DS, Watson GO, Perryman S, Nielsen DL. 2004. Ordination and significance testing of microbial community composition derived from terminal restriction fragment length polymorphisms: application of multivariate statistics. Antonie Van Leeuwenhoek 86:339–347. 10.1007/s10482-004-0498-x [DOI] [PubMed] [Google Scholar]
- 45.Oksanen J, Guillaume Blanchet F, Kindt R, Legendre P, Minchin PR, O'Hara RB, Simpson GL, Solymos P, Stevens MHH, Wagner H. 2012. vegan: community ecology package. R package, version 2.0-5. R Foundation for Statistical Computing, Vienna, Austria [Google Scholar]
- 46.Clarke KR. 1993. Non-parametric multivariate analysis of changes in community structure. Aust. J. Ecol. 18:117–143. 10.1111/j.1442-9993.1993.tb00438.x [DOI] [Google Scholar]
- 47.Ramette A. 2007. Multivariate analyses in microbial ecology. FEMS Microbiol. Ecol. 62:142–160. 10.1111/j.1574-6941.2007.00375.x [DOI] [PMC free article] [PubMed] [Google Scholar]
- 48.Moncayo-Estrada R, Owen TL, Escalera-Gallardo C. 2011. Trophic interactions among sympatric zooplanktivorous fish species in volume change conditions in a large, shallow, tropical lake. Neotrop. Ichthyol. 9:169–176. 10.1590/S1679-62252011005000003 [DOI] [Google Scholar]
- 49.Struckhoff MA, Grabner KW, Stroh ED. 2011. Vegetation communities at Big Muddy National Fish and Wildlife Refuge, Missouri. U.S. Geological Survey open-file report 2011-1038. U.S. Geological Survey, Washington, DC. [Google Scholar]
- 50.Development Core Team R. 2006. R: a language and environment for statistical computing. R Foundation for Statistical Computing, Vienna, Austria [Google Scholar]
- 51.Li R, Zhu H, Ruan J, Qian W, Fang X, Shi Z, Li Y, Li S, Shan G, Kristiansen K. 2010. De novo assembly of human genomes with massively parallel short read sequencing. Genome Res. 20:265–272. 10.1101/gr.097261.109 [DOI] [PMC free article] [PubMed] [Google Scholar]
- 52.Boetzer M, Henkel CV, Jansen HJ, Butler D, Pirovano W. 2011. Scaffolding pre-assembled contigs using SSPACE. Bioinformatics 27:578–579. 10.1093/bioinformatics/btq683 [DOI] [PubMed] [Google Scholar]
- 53.Li R, Fan W, Tian G, Zhu H, He L, Cai J, Huang Q, Cai Q, Li B, Bai Y, Zhang Z, Zhang Y, Wang W, Li J, Wei F, Li H, Jian M, Li J, Zhang Z, Nielsen R, Li D, Gu W, Yang Z, Xuan Z, Ryder OA, Leung FC, Zhou Y, Cao J, Sun X, Fu Y, Fang X, Guo X, Wang B, Hou R, Shen F, Mu B, Ni P, Lin R, Qian W, Wang G, Yu C, Nie W, Wang J, Wu Z, Liang H, Min J, Wu Q, Cheng S, Ruan J, Wang M, et al. 2010. The sequence and de novo assembly of the giant panda genome. Nature 463:311–317. 10.1038/nature08696 [DOI] [PMC free article] [PubMed] [Google Scholar]
- 54.Stanke M, Steinkamp R, Waack S, Morgenstern B. 2004. AUGUSTUS: a web server for gene finding in eukaryotes. Nucleic Acids Res. 32:W309–W312. 10.1093/nar/gkh379 [DOI] [PMC free article] [PubMed] [Google Scholar]
- 55.Koonin EV, Fedorova ND, Jackson JD, Jacobs AR, Krylov DM, Makarova KS, Mazumder R, Mekhedov SL, Nikolskaya AN, Rao BS. 2004. A comprehensive evolutionary classification of proteins encoded in complete eukaryotic genomes. Genome Biol. 5:R7. 10.1186/gb-2004-5-2-r7 [DOI] [PMC free article] [PubMed] [Google Scholar]
- 56.Conesa A, Gotz S. 2008. Blast2GO: a comprehensive suite for functional analysis in plant genomics. Int. J. Plant Genomics 2008:619832. 10.1155/2008/619832. 10.1155/2008/619832 [DOI] [PMC free article] [PubMed] [Google Scholar]
- 57.Li H, Handsaker B, Wysoker A, Fennell T, Ruan J, Homer N, Marth G, Abecasis G, Durbin R. 2009. The sequence alignment/map format and SAMtools. Bioinformatics 25:2078–2079. 10.1093/bioinformatics/btp352 [DOI] [PMC free article] [PubMed] [Google Scholar]
- 58.McKenna A, Hanna M, Banks E, Sivachenko A, Cibulskis K, Kernytsky A, Garimella K, Altshuler D, Gabriel S, Daly M, DePristo MA. 2010. The Genome Analysis Toolkit: a MapReduce framework for analyzing next-generation DNA sequencing data. Genome Res. 20:1297–1303. 10.1101/gr.107524.110 [DOI] [PMC free article] [PubMed] [Google Scholar]
- 59.van Rossum G, Drake FL. 2001. Python reference manual. PythonLabs, Beaverton, VA: http://www.python.org [Google Scholar]
- 60.Abyzov A, Urban AE, Snyder M, Gerstein M. 2011. CNVnator: an approach to discover, genotype, and characterize typical and atypical CNVs from family and population genome sequencing. Genome Res. 21:974–984. 10.1101/gr.114876.110 [DOI] [PMC free article] [PubMed] [Google Scholar]
- 61.Carver TJ, Rutherford KM, Berriman M, Rajandream MA, Barrell BG, Parkhill J. 2005. ACT: the Artemis comparison tool. Bioinformatics 21:3422–3423. 10.1093/bioinformatics/bti553 [DOI] [PubMed] [Google Scholar]
- 62.Lorè NI, Cigana C, De Fino I, Riva C, Juhas M, Schwager S, Eberl L, Bragonzi A. 2012. Cystic fibrosis-niche adaptation of Pseudomonas aeruginosa reduces virulence in multiple infection hosts. PLoS One 7:e35648. 10.1371/journal.pone.0035648 [DOI] [PMC free article] [PubMed] [Google Scholar]
- 63.Bojesen AM, Torpdahl M, Christensen H, Olsen JE, Bisgaard M. 2003. Genetic diversity of Gallibacterium anatis isolates from different chicken flocks. J. Clin. Microbiol. 41:2737–2740. 10.1128/JCM.41.6.2737-2740.2003 [DOI] [PMC free article] [PubMed] [Google Scholar]
- 64.Avila J, Perez MD, Brito N, Gonzalez C, Siverio JM. 1995. Cloning and disruption of YNR1 gene encoding the nitrate reductase apoenzyme of the yeast Hansenula polymorpha. FEBS Lett. 366:137–142. 10.1016/0014-5793(95)00511-7 [DOI] [PubMed] [Google Scholar]
- 65.Liti G, Carter DM, Moses AM, Warringer J, Parts L, James SA, Davey RP, Roberts IN, Burt A, Koufopanou V, Tsai IJ, Bergman CM, Bensasson D, O'Kelly MJT, van Oudenaarden A, Barton DBH, Bailes E, Nguyen BAN, Jones M, Quai MA, Goodhead I, Sims S, Smith F, Blomberg A, Durbin R, Louis EJ. 2009. Population genomics of domestic and wild yeasts. Nature 458:337–341. 10.1038/nature07743 [DOI] [PMC free article] [PubMed] [Google Scholar]
- 66.Palkova Z. 2004. Multicellular microorganisms: laboratory versus nature. EMBO Rep. 5:470–476. 10.1038/sj.embor.7400145 [DOI] [PMC free article] [PubMed] [Google Scholar]
- 67.Peris D, Lopes CA, Belloch C, Querol A, Barrio E. 2012. Comparative genomics among Saccharomyces cerevisiae × Saccharomyces kudriavzevii natural hybrid strains isolated from wine and beer reveals different origins. BMC Genomics 13:407. 10.1186/1471-2164-13-407 [DOI] [PMC free article] [PubMed] [Google Scholar]
- 68.Borneman AR, Forgan AH, Pretorius IS, Chambers PJ. 2008. Comparative genome analysis of a Saccharomyces cerevisiae wine strain. FEMS Yeast Res. 8:1185–1195. 10.1111/j.1567-1364.2008.00434.x [DOI] [PubMed] [Google Scholar]
- 69.Avila J, Gonzalez C, Brito N, Siverio JM. 1998. Clustering of the YNA1 gene encoding a Zn(II)2CyS6 transcriptional factor in the yeast Hansenula polymorpha with the nitrate assimilation genes YNT1, YNI1 and YNR1, and its involvement in their transcriptional activation. Biochem. J. 335:647–652 [DOI] [PMC free article] [PubMed] [Google Scholar]
- 70.Avila J, Gonzalez C, Brito N, Machın F, Pérez MD, Siverio JM. 2002. A second Zn(II)2Cys6 transcriptional factor encoded by the YNA2 gene is indispensable for the transcriptional activation of the genes involved in nitrate assimilation in the yeast Hansenula polymorpha. Yeast 19:537–544. 10.1002/yea.847 [DOI] [PubMed] [Google Scholar]
- 71.De Barros Pita W, Leite FC, de Souza Liberal A, Simões DA, Morais MA., Jr 2011. The ability to use nitrate confers advantage to Dekkera bruxellensis over Saccharomyces cerevisiae and can explain its adaptation to industrial fermentation processes. Antonie Van Leeuwenhoek 100:99–107. 10.1007/s10482-011-9568-z [DOI] [PubMed] [Google Scholar]
- 72.Galafassi S, Capusoni C, Moktaduzzaman M, Compagno C. 2013. Utilization of nitrate abolishes the “Custer effect” in Dekkera bruxellensis and determines a different pattern of fermentation products. J. Ind. Microbiol. Biotechnol. 40:297–303. 10.1007/s10295-012-1229-3 [DOI] [PubMed] [Google Scholar]
- 73.Wareing P, Davenport RR. 2007. Microbiology of soft drinks and fruit juices. In Ashurst PR. (ed), Chemistry and technology of soft drinks and fruit juices, 2nd ed. Blackwell Publishing Ltd, Oxford, United Kingdom. 10.1002/9780470995822.ch11 [DOI] [Google Scholar]
- 74.Shoseyov O, Bravdo BA, Siegel D, Goldman A, Cohen S, Shoseyov L, Ikan R. 1990. Immobilized endo-beta-glucosidase enriches flavor of wine and passion fruit juice. J. Agric. Food Chem. 38:1387–1390. 10.1021/jf00096a019 [DOI] [Google Scholar]
- 75.Daenen L, Vanderhaegen B, Verachter H, Derdelinckx G. 2004. Flavour enhancement in beer by yeast beta-glucosidase activity. Commun. Agric. Appl. Biol. Sci. 69:73–76 [PubMed] [Google Scholar]
- 76.Reis ALS, de Fátima Rodrigues de Souza R, Neves Baptista Torres RR, Leite FCB, Guedes Paiva PM, Espinosa Vidal E, de Morais MA., Jr 2014. Oxygen-limited cellobiose fermentation and the characterization of the cellobiase of an industrial Dekkera/Brettanomyces bruxellensis strain. Springerplus 3:38. 10.1186/2193-1801-3-38 [DOI] [PMC free article] [PubMed] [Google Scholar]
- 77.Smith MT, Yamazaki M, Poot GA. 1990. Dekkera, Brettanomyces and Eeniella: electrophoretic comparison of enzymes and DNA-DNA homology. Yeast 6:299–310. 10.1002/yea.320060403 [DOI] [PubMed] [Google Scholar]
- 78.Spindler DD, Wyman CE, Grohmann K, Philippidis GP. 1992. Evaluation of the cellobiose-fermenting yeast Brettanomyces custersii in the simultaneous saccharification and fermentation of cellulose. Biotechnol. Lett. 14:403–407. 10.1007/BF01021255 [DOI] [Google Scholar]
- 79.Blomqvist J, Eberhard T, Schnurer J, Passoth V. 2010. Fermentation characteristics of Dekkera bruxellensis strains. Appl. Microbiol. Biotechnol. 87:1487–1497. 10.1007/s00253-010-2619-y [DOI] [PubMed] [Google Scholar]
- 80.Hittinger CT, Gonçalves P, Sampaio JP, Dover J, Johnston M, Rokas A. 2010. Remarkably ancient balanced polymorphisms in a multi-locus gene network. Nature 464:54–58. 10.1038/nature08791 [DOI] [PMC free article] [PubMed] [Google Scholar]
Associated Data
This section collects any data citations, data availability statements, or supplementary materials included in this article.