Abstract
Sessile drop formation, also called drop deposition, has been studied as a potential medical diagnostic, but the effects of complex biofluid rheology on the final deposition pattern are not well understood. We studied two model biofluids, blood plasma and synovial fluid, when deposited onto slightly hydrophilic substrates forming a contact angle of 50–90°. Drops were imaged during the evaporation process and geometric properties of the drop, such as contact angle and drop height, were calculated from the images. The resulting dried biofluid drops were then examined using light microscopy and Raman spectroscopy to assess morphological and chemical composition of the dried drop. The effect of substrate contact angle (surface wetting) and fluid concentration was examined. We found that when biofluids are deposited onto slightly hydrophilic surfaces, with a contact angle of 50–90°, a ring-shaped deposit was formed. Analysis of the drying drop’s geometric properties indicates that biofluid dynamics follow the piling model of drop formation, as proposed by Deegan et al. The final deposition pattern varied with substrate surface and concentration, as shown by light microscopy photos of dried drops. The chemical composition of the outer ring was minimally affected by substrate surface, but the spatial heterogeneity of protein distribution within the ring varied with concentration. These results indicate that biofluid drop deposition produces ring-shaped deposits which can be examined by multiple analytical techniques.
Introduction
Sessile drop formation, also called drop deposition, occurs when a small-volume drop (2–10 μl) of fluid is placed onto a flat substrate and allowed to dry. Drop deposition is used to characterize solid surfaces, model fluid dynamics, monitor polymer film drying, and examine macromolecule conformation.1–3 In the simplest model of drop deposition, a pinned contact line forms at the edge of the drop immediately after deposition. As solvent evaporates, capillary flow transports solute toward the contact line and the drop typically dries as a ring-shaped deposition, with components coarsely separated.4, 5 Equally important to formation of a ring-shaped deposit is suppression of Marangoni flow, which recirculates flow toward the drop center.2 Fluid rheology, solute-substrate interaction, and drying conditions also influence the final shape of the dried drop. 6–8 Depending on the fluid properties and drying conditions, the resulting dried drop can be either ring-shaped, with components coarsely separated, or a uniform deposition. Both theory and experiments have shown that complex fluid flows and interactions guide the evaporation process even in the simplest of systems.9
Drop deposition is well suited for examining low abundance biofluids, such as tears, synovial fluid or spinal fluid, because there is often not enough fluid to analyze using standard chromatography or electrophoresis techniques.10 Biofluids can be prepared using drop deposition and the same dried drop can be examined using multiple analytical techniques, such as light microscopy, atomic force microscopy (AFM), matrix-assisted laser desorption/ionization (MALDI) mass spectrometry, acoustic-mechanical impedance or optical spectroscopy. Multiple data obtained from single microliter-sized drop are related to the physical and chemical properties of the biofluid. In particular, Raman spectroscopy of dried protein drops provides chemical composition and molecular structure information.11–15 A combined Raman spectroscopy/drop deposition analysis provides molecular markers associated with eye infection in tear fluid and osteoarthritis in synovial fluid.16, 17 Despite the diagnostic potential of biofluid drop deposition, the fluid dynamics that govern biofluid drop deposition are poorly understood because they exhibit non-Newtonian rheology and are chemically heterogeneous. The first goal of this study was to build an experimental framework to understand the fluid dynamics in biofluid drop deposition because they directly affect the final deposition pattern and may affect the thickness and chemical heterogeneity of the outer ring. Plasma was studied as a model viscous biofluid because it is studied for biomarkers of obesity and cardiovascular disease.18, 19 Synovial fluid was used as a model viscoelastic biofluid because its rheology and chemical composition are studied as markers of osteoarthritis.20–22
Two models of drop evaporation, the piling model proposed by Deegan et al and the piling-to-buckling model proposed by Kajiya et al., were considered in describing the evaporation behavior of biofluids. 1, 5, 23 In both models, capillary flow drives outward flow toward the drop edges and Marangoni flow recirculates flow from the drop edges toward the drop center. Most drops are formed by the piling model in which a contact line is fixed immediately after deposition. As solvent evaporates, capillary flow transports solute toward the contact line and the drop typically dries as a ring-shaped deposition. For highly-concentrated polymeric drops deposited onto hydrophobic surfaces (θc > 85°) the evaporation can be modeled using the piling-to-buckling phenomenon, where the contact line is initially pinned but becomes unpinned. After the contact line becomes unpinned, the drop shrinks uniformly and a second contact line pins to the substrate. The final deposition pattern is typically in the shape of a uniform dot with a dimple in the drop center. We collected geometric profiles of drying biofluid drops and compared our data with profiles expected from the piling and piling-to-buckling model. The piling and piling-to-buckling models have different effects on the geometric properties, such as drop height, radius and contact angle. In the piling model of drop formation, the drop height and contact angle are expected to decrease uniformly as solvent is evaporated because capillary flow is the dominant flow.4 And the drop radius should be constant because the contact line is fixed. By contrast, a step-like decrease in contact angle and drop radius is expected in a piling-to-buckling model because the drop would contract after the initial contact line becomes unpinned.1
The second goal of this study was to examine the effects of substrate surface and fluid concentration on visual appearance and chemical heterogeneity of the dried outer ring. Light microscopy and Raman spectroscopy were used to examine the morphology and chemical composition of the same drop. Light microscopy enabled visualization of morphological features on the macroscale (such as the surface smoothness and width of the outer ring) and the microscale (cracks, fern-shaped crystals, thin film accumulations, liquid crystals). Raman spectra were collected across the surface of the outer ring to assess chemical heterogeneity. Microscopy images and Raman spectra provided information on the geometric and chemical properties of the outer ring of dried biofluid drops. Microscopy images revealed that the final deposition pattern was affected by the substrate hydrophobicity. Raman data showed minor changes in bands corresponding to hydrogen bonding of aromatic amino acids when fluids were diluted. Raman maps of the outer ring showed spatial heterogeneity of protein distribution related to the starting concentration of the biofluid, with the most spatial heterogeneity observed in undiluted biofluids.
Experimental
Materials
SpectRIM (Tienta Sciences, Indianapolis, IN, USA), gold or aluminium-coated glass (EMF Corporation, Ithaca, NY, USA), CaF2 (International Crystal Laboratories, Garfield, NJ, USA), and fused silica slides were used as received. Freeze-dried human plasma was purchased through Sigma (St. Louis, MO, USA) reconstituted using purified water, and used without additional preparation. Plasma was diluted with purified water to 0.5 v/v, 0.25 v/v and 0.1 v/v. Plasma of all concentrations was deposited onto four substrates that encompassed a range of surface hydrophobicity: fused silica, gold-coated glass, calcium fluoride (CaF2) and Teflon-coated stainless steel (SpectRIM). After Institutional Review Board approval, human synovial fluid was obtained and pooled from two patient groups, degenerative joint condition (DJC, N=3) and normal (N=2). Synovial fluid from each group was diluted with water to 0.5 v/v and 0.25 v/v. Synovial fluid of all concentrations was deposited onto gold-coated glass slides, fused silica or calcium fluoride slides. In another study, synovial fluid was obtained from patients negative for radiological osteoarthritis (−/ROA, N=17) or positive for radiological osteoarthritis (+/ROA, N=23). Synovial fluid from the individual donors were examined by was and examined by DDRS and compared to x-ray evidence of osteoarthritis. The results from the earlier study are reported elsewhere.17 In this study, we pooled any remaining individual synovial fluid specimens into +/ROA and -/ROA groups. The pooled synovial fluid was deposited onto gold-coated glass slides and examined by Raman microspectroscopy. The resulting transects were used to generate Raman maps of protein distribution in the outer ring.
Drop Geometry Measurements
Drops of plasma and synovial fluid at different dilutions and on different substrates were monitored during the evaporation process with digital cameras. Geometric properties, such as drop height, contact angle (θc) and drop radius were then calculated. Fluids (v=2 μl) were deposited onto substrates using an Eagle micropipette (World Precision Instruments, Sarasota, FL, USA). All experiments were performed in ambient laboratory conditions. Overhead and side profile images were collected throughout the evaporation process. Overhead images were collected at a rate of 1 Hz using a 1280×1024 camera (High resolution USB 2.0 CMOS camera, ThorLabs, Newton NJ, USA) equipped with a 60 mm f/2.8 macro lens (Nikon AF Micro Nikkor, Nikon Inc., Melville, NY, USA), side profile images were collected at a rate of 1 Hz using a 1280×1024 camera equipped with a 1/3″ 4mm f/1.2 macro lens (Computar Commack, NY USA). 2000–2400 images were collected from each camera. Side profile images were used to calculate drop geometric properties, left and right contact angle, drop diameter (radius) and drop height. Raw images were imported into Matlab (The Math Works, Natick, MA, USA) and properties were calculated using routines written in-house. The GUI-based routine loaded a dataset of images. The user adjusted thresholds to select the drop’s bottom edge, sides and background, and these parameters defined the drop region of interest. The drop height, left and right contact angles were refined by fitting a polynomial to the data and the drop diameter was calculated from the contact points. The drop was fitted with a high order polynomial approximating the x value as a function of the angle. Next, the point where the polynomial hits the reference line was found. Finally, a partial derivative was taken at the point where the polynomial hits the reference line. The y value was calculated using the same technique. Geometric properties were measured during three separate experiments and the results shown in Figures 1–2 show representative time courses. An example of the GUI-based software steps is shown in Figure 3. Geometric properties could not be calculated from fluids deposited onto fused silica because the low contact angle (θc~30°) resulted in many artifacts in the calculations. Images were compiled into videos to provide a visual time-course of the biofluid evaporation. Representative time-course videos for plasma and synovial fluid deposited onto gold-coated glass are shown in the Supplementary Data.
Figure 1.
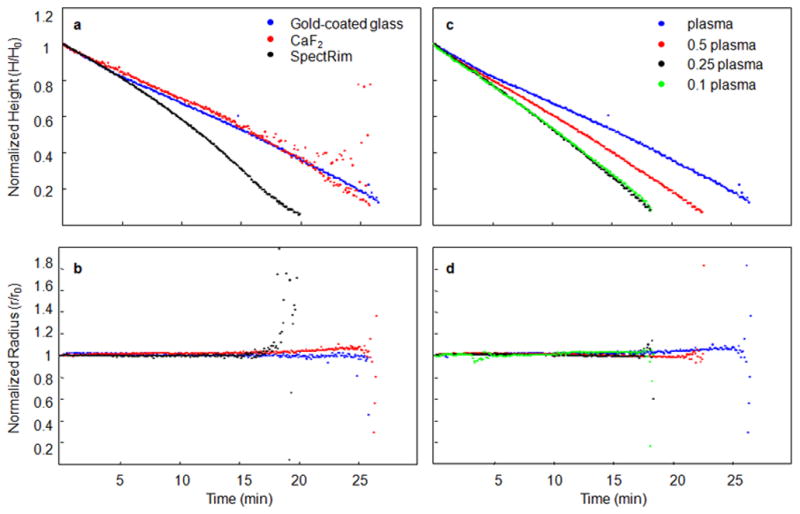
The contact angle, drop height, and drop radius were calculated from side-profile images collected from evaporating plasma drops. We examined the effect of substrate surface (panels a and b) and biofluid concentration (panels c and d) on these geometric properties to determine if the fluid dynamics of drying plasma drops could be explained by known models of drop deposition. The radius of a plasma drop remained consistent throughout the evaporation, indicating a fixed contact point. A fixed contact point was observed to be independent of substrate surface (panel b) and plasma concentration (panel d). The drop height decreased uniformly and the slope of the line, seen in panels a and c, was proportional to the rate of drop evaporation. Plasma deposited onto a SpectRIM substrate evaporated faster than on CaF2 or gold-coated glass (panel a). Drops of diluted plasma evaporated more quickly than undiluted plasma (panel c). From these data, we concluded that plasma drops dried with a constant radius, with a uniform decrease in height and contact angle, and the piling model of drop deposition could be applied.
Figure 2.
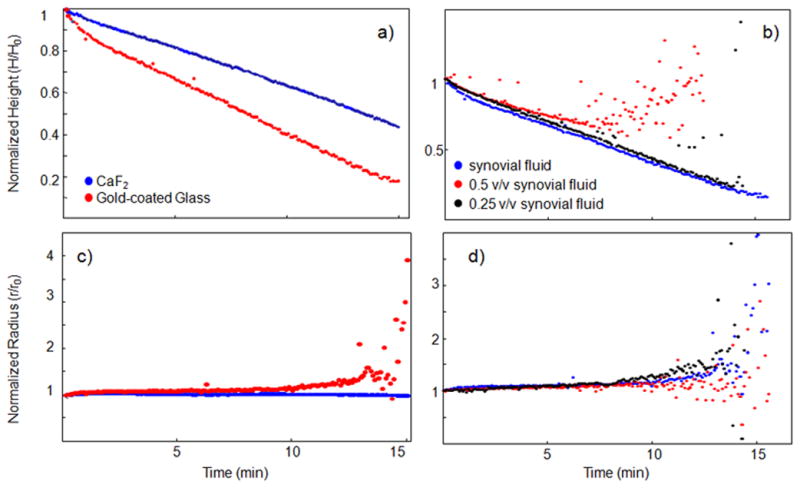
The contact angle, drop height, and drop radius were calculated from side-profile images collected from evaporating human synovial fluid drops. We examined the effect of substrate surface (panels a and b) and biofluid concentration (panels c and d) on these geometric properties. Geometric properties were studied in normal synovial and degenerative joint condition (DJC) synovial fluid (shown in Supplementary Figure 2) deposited onto gold-coated glass and calcium fluoride. The radius of a synovial fluid drop remained consistent throughout the evaporation, indicating a fixed contact point, independent of substrate surface, shown in Supplemental Figure 2.. The drop height decreased uniformly in all experiments. From these data, the piling model of drop deposition could be applied toward synovial fluid.
Figure 3.
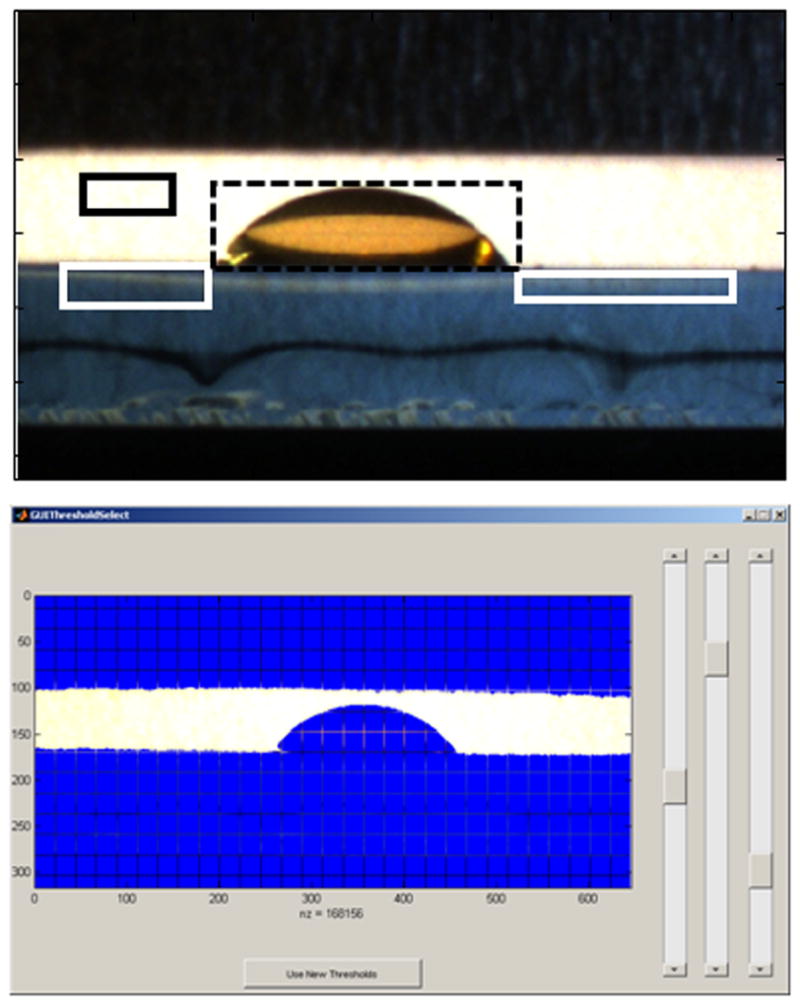
A GUI-based drop profile program was custom written for these experiments. The user is first requested to use the first image of the image sequence (top panel) to define the background (black solid square), the left and right slide surface (white solid squares) and the droplet (black dashed square). Then, the user is requested to adjust the thresholds (bottom panel) using the three sliding panels. These steps define the thresholds used to define the substrate surface or baseline, separate the background from the slide and separate the droplet from the background. The drop is then fitted with a high order polynomial to measure the left and right contact angles and drop height. The drop is then fitted in each image of the sequence using the same thresholds.
Light Microscopy and Raman Spectroscopy
Microscopy images and Raman spectra were collected from dried drops. A Nikon E600 epi-fluorescence microscope (Nikon Inc., Melville, NY, USA) was modified for NIR Raman spectroscopy in-house. Microscope images were collected in epi-illumination mode with 2x/0.06NA Plan UW, 4x/0.20NA, 10x/0.50NA, and 20x/0.75NA S Fluor objectives (Nikon Inc., Melville, NY, USA). A line-shaped 785 nm Kaiser Invictus laser approximately 100 μm long (Kaiser Optical Systems Inc., Ann Arbor, MI, USA) was focused onto dried drops using a 20x/0.75NA S Fluor objective. Laser intensity at the objective was ~ 100 mW. Raman-scattered light was collected through the same 20x/0.75 NA S Fluor objective and dispersed through a spectrograph (HoloSpec f/1.8, Kaiser Optical Systems Inc., Ann Arbor, MI, USA). Raman scatter was collected for 3 minutes on a deep-depletion, back-thinned 1024x 128 charge-coupled device (CCD) detectors (DU401-BR-DD, Andor Technologies, Belfast, Northern Ireland). Raman transects consisted of 126 Raman spectra arranged at equidistant points along a line. Five transects were collected starting at 25 μm from the drop edge, spaced 20 μm apart, toward the drop center. Raman transects were collected at the drop edge at least 25 μm from the drop edge because the very edge of the drop was desiccated in preliminary tests. Raman maps of the area interrogated were generated from the five transects. Raman spectra from drops dried onto CaF2 showed that the CaF2 surface produced a large background signal that prohibited detection of Raman spectra from biofluid proteins, as shown in Supplmental Figure 1..
Raman Data Analysis
Raman data were imported into MATLAB software and corrected for curvature, dark current, and variations in the CCD quantum efficiency using in-house routines.24, 25 Raman spectra collected from drops deposited on fused silica were not corrected for the fused silica background signal. Raman spectra were not corrected for water background signal. A mean spectrum was calculated for each transect and baseline corrected using a baseline fitting routine modified from the technique described by Lieber.26 Baseline corrected spectra were intensity-normalized to the phenylalanine ring breathing band intensity at ~1002 cm−1. Band intensity ratios corresponding to protein secondary structure were calculated in Matlab.27, 28 Total protein content was calculated by summing the intensity of the 1003,1033,1206,1445, and 1655 cm−1 bands.15 Table 1 shows the Raman band assignments. Raman maps of total protein content were generated from a ~150 μm × 100μm section of the outer ring to visualize protein distribution within the outer ring of the dried drop.
Table 1.
Band assignments of Raman spectra collected from dried plasma and synovial fluid drops.
| Raman Shift (cm−1) | Band Assignment | Component |
|---|---|---|
| 895 | C-C stretch | Protein |
|
|
||
| 938 | C-C stretch, α-helix | Protein |
|
|
||
| 1002 | Ring breathing | Protein |
|
|
||
| 1080 | C-N, C-C stretch | Protein |
|
|
||
| 1125 | C-C, C-OH, C-N stretch | Protein |
|
|
||
| 1235 | Amide III, random coil | Protein |
|
|
||
| 1260 | Amide III, α-helix | Protein |
|
|
||
| 1340 | CH2/CH3 wag | Protein |
|
|
||
| 1446 | CH2/CH3 deformation | Organic content |
|
|
||
| 1655 | Amide I, α-helix | Protein |
|
|
||
| 1670 | Amide I, random coil | Protein |
|
|
||
| 1687 | Amide I, β-sheet | Protein |
Results and Discussion
Biofluid drop formation dynamics
Biofluids have complex rheology and are highly concentrated in macromolecules including proteins and polysaccharides. Models of drop deposition have been developed based on experimental and theoretical examination of suspended particles or weakly-concentrated and chemically homogeneous solutions. Established models may not adequately capture the effects of macromolecule entanglement, shear-dependent flow, and heterogeneous interactions that are commonly observed in biofluids. Our initial unpublished studies showed that synovial fluid and plasma typically formed ring-shaped deposits during drop deposition, but we also occasionally observed formation of a uniform deposition on the SpectRIM substrate. These initial studies indicated biofluids dry following a piling model. To supplement this observational information, a thorough examination of biofluid geometric properties as they dried was necessary. We initially hypothesized was piling behavior would be observed when biofluids were placed onto slightly hydrophobic surfaces (θc=40–80°), such as fused silica, CaF2, and metal-coated glass and piling-to-buckling behavior would be observed if the drop was placed onto a more hydrophobic surface (θc~90°), such as the SpectRIM substrate.
Calculation of geometric properties provided a time-course of drop height, contact angle and drop radius during the evaporation process. Drop height and radius of plasma and synovial fluid are shown in Figures 1 and 2, respectively. The scatter observed toward the end of the measurements resulted from spurious reflections from the rapidly-drying drop. Plasma and synovial fluid exhibited a uniform decrease in drop height and contact angle and constant drop radius during the evaporation process, independent of the substrate. Normalized drop height (Figure 1a) and drop radius (Figure 1b) are shown for plasma at deposited onto different substrates. When deposited on CaF2 (θc=71°) or gold-coated glass (θc=53°), plasma dried with a consistent decrease in drop height and no change in normalized drop radius. More diluted plasma dried more rapidly (Figure 1c) than undiluted plasma because of a higher concentration of water in the initial drop but dilution had no effect on drop radius (Figure 1d). The initial contact angle of plasma deposited onto the SpectRIM substrate was higher (θc=89°) than the other substrates in this study. Based on the contact angle information, we expected to observe that plasma deposited on SpectRIM substrates would exhibit piling-to-bucking dynamics and result in a uniform deposit. However, the measurements of drop height and radius (Figure 1) data indicated that plasma deposition on SpectRIM substrates resembled a piling model.
Healthy synovial fluid drops were deposited on CaF2 or gold-coated glass. The geometric properties of drying synovial fluid drops from degenerative joint condition (DJC) patients are shown in Supplemental Figure 2.. The drop radius remained constant throughout the evaporation, As shown in Figure 2, synovial fluid behavior may be sensitive to the substrate surface and concentration. We hypothesize that synovial fluid rheology and macromolecule interactions may be responsible for the observed differences in drying rates. In particular, entanglement and molecular structure properties of hyaluronic acid chains are the primary contributors to the shear-dependent rheology of synovial fluid.20 Future work to characterize synovial fluid rheology with its drop deposition behavior will study this hypothesis.
Light Microscopy of Dried Plasma Drops
We observed that substrate surface and fluid concentration had an effect on the visual features of plasma and synovial fluid dried drops. The effects of plasma concentration (columns) and contact angle/substrate hydrophobicity (rows) on the deposition pattern of plasma are shown in Figure 4. The size and symmetry of the dried drop varied on the macroscale because of the different substrate wetting properties. Plasma dried in a symmetric circular drop when deposited onto SpectRIM, CaF2 and gold-coated glass, but dried as an asymmetric circle when deposited onto fused silica. The extent of cracks radiating from the drop center is proportional to fluid concentration and was more pronounced on substrates with poor wetting. In most cases we observed a smooth film-like ring at the drop edge with crystalline fern-shaped deposits in the drop center. However, the substrate surface affected the width of the outer ring relative to the size of the drop. Because of the moderate wetting properties of CaF2, gold-coated glass and fused silica, capillary flow was sufficiently high to enable ring formation and we observed a coarse separation of plasma components. The ring width appeared similar for plasma deposited onto CaF2 and gold-coated glass, a narrow ring was observed on fused silica and a wider ring was observed on SpectRIM. Also observable in Figure 4 are visual features such as spiral cracks. At higher magnification, other visual features on the microscale could be observed including thin-film accumulations, cells and kerns in the outer ring and fern-shaped deposits in the drop center. (The formation of these visual features can be observed in the Supplemental Videos. Synovial fluid drop morphology also varied with substrate wetting and fluid concentration (Supplemental Figures 4 and 5). Our previous drop deposition/Raman spectroscopy study of synovial fluid showed that macroscale drop features, such as fern-shaped crystals or radial cracks, were correlated (R2=0.3) with radiological evidence of osteoarthritis.17
Figure 4.
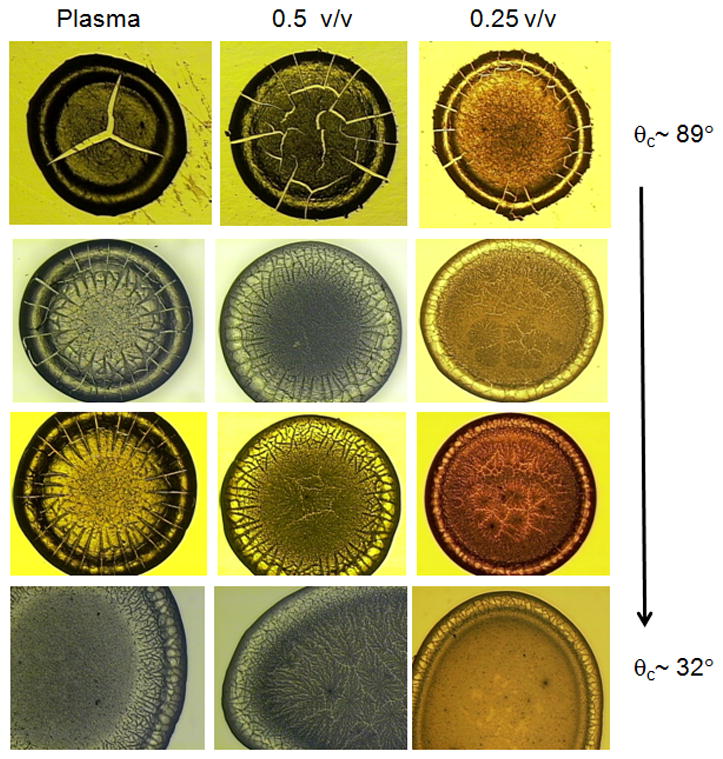
Drops of plasma dried on various commercially-available substrates (columns) at various concentrations of undiluted, 0.5 v/v and 0.25 v/v (rows). Visual inspection of the drop morphology for size, shape and features such as cracks or fern-shaped crystals was performed. The visual appearance of dried plasma is dependent on initial concentration and substrate wetting. Poor substrate wetting (θc ~ 89°, top row) resulted in a smaller-sized ~ 2mm drop, with extensive cracking throughout the drop. Moderate substrate wetting (θc ~ 50–70°, middle rows) resulted in slightly larger ~ 3mm sized drops with less cracking. Good substrate wetting (θc ~ 30°, bottom row) resulted in deposits that were not a uniform ring shape.
Raman Spectroscopy and Mapping
Raman spectra of synovial fluid drops were composed primarily of protein bands, similar to those reported in our previous study.17 Raman spectra collected from dried plasma drops showed that the chemistry of the protein-rich outer ring of the dried drop did not change when the same biofluid was dried on different substrates. Dilution of plasma affected both the optical properties and the amount of free water in the dried drop. Substrates were chosen for their compatibility with Raman spectroscopy. While the substrate affected the gross morphological features of the final deposition pattern, the hydration and conformation of biofluid proteins were preserved. The effects of substrate surface on Raman spectra are presented in Figure 5 that shows representative spectra of diluted plasma (0.5v/v) after drying on a) fused silica, b) SpectRIM and c) gold-coated glass. The choice of substrate did not interfere with collection of signal from the drop, except for minimal background signal from fluorescing impurities in fused silica, shown in the top spectrum of Figure 5. This minimal background signal from a fused silica substrate was also reported in another DDRS study.29 We did not observe any background signal from gold-coated glass and SpectRIM substrates. A strong background signal from CaF2 prohibited collection of adequate spectra from drops deposited onto calcium fluoride.
Figure 5.
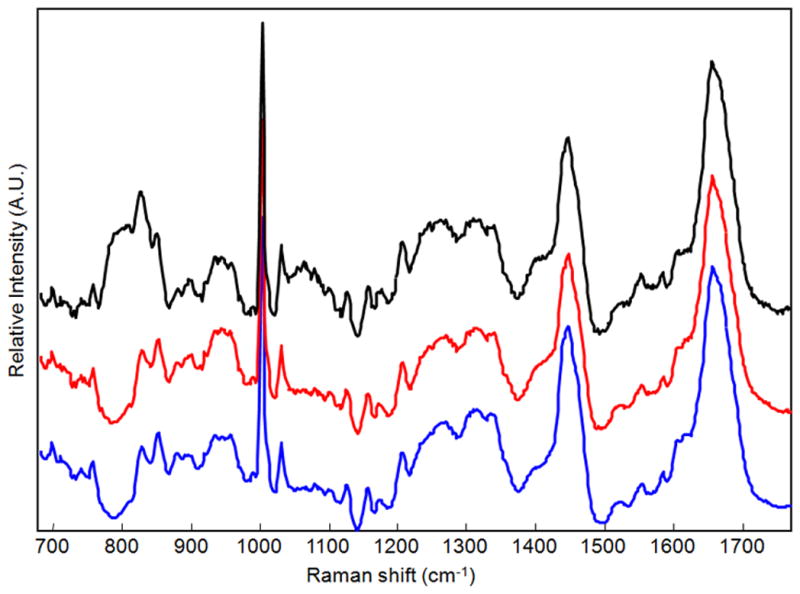
Representative Raman spectra of dried drops of 0.5 v/v plasma on fused silica (top), SpectRIM (middle) and gold-coated glass (bottom). The Raman spectra were composed of protein bands, assigned to functional groups and secondary structure in Table 1. The choice of substrates had minimal effect on observation of Raman protein bands. However, we did observe some residual background signal from the fused silica substrate.
The Raman spectrum is representative of proteins, and we interpret the Raman spectrum as a fingerprint of the biofluid’s proteomic profile. Protein secondary structure can be estimated by deconvolving bands in the amide III (1200–1300 cm−1) and amide I (1600–1700 cm−1) regions. Fluid concentration, simulated here by diluting pure biofluid, has an effect on Raman bands near the amide I region at ~1500–1700 cm−1, which was independent of the substrate. Figure 6a illustrates this effect for plasma samples deposited onto gold-coated glass, and this effect was also observed in synovial fluid dilutions. Shown in Figure 6a, Raman bands at ~1603 cm−1 and 1617 cm−1 corresponding to aromatic amino acids are less resolved in spectra collected from drops of diluted plasma. However, dilution did not affect the relative abundance of α-helix and random coil secondary structure, measured by the intensity ratio of amide I bands at 1655 cm−1 and 1670 cm−1. Figure 6a also shows the amide I envelope width at 1640–1720 cm−1 increased and the intensity of the envelope maximum at ~ 1655 cm−1 increased in dilute samples. A similar trend in the 1665 cm−1 band intensity was observed in spectra collected from fused silica and SpectRIM, shown in Figure 6b, where the normalized 1655 cm−1 intensity increased in DDRS of diluted plasma. We hypothesized that dilution of plasma affected the Raman measurements in two ways. The first effect is concentration of optical scattering and refractive index. Optical scattering increases with concentration, resulting in a wider surface area of Raman scattered photons and decreased collection efficiency. A higher plasma concentration may also result in a higher index of refraction. We believe optical scattering and refraction are minor effects that are offset by the increased number of Raman scattering molecules. The second factor is the presence of additional free and bound water. An earlier DDRS study of aqueous protein solutions showed that water had a minor contribution to the DDRS spectrum.13 But, our results suggest that water may have larger contributions in biofluid spectra especially because water is bound to macromolecules such as proteins or glycosaminoglycans. In addition to the reduced spectral resolution, we found that the width of the 1633 cm−1 band, arising from water O-H bound to plasma proteins with minor contributions from free water, also increased in dilute drops.30
Figure 6.
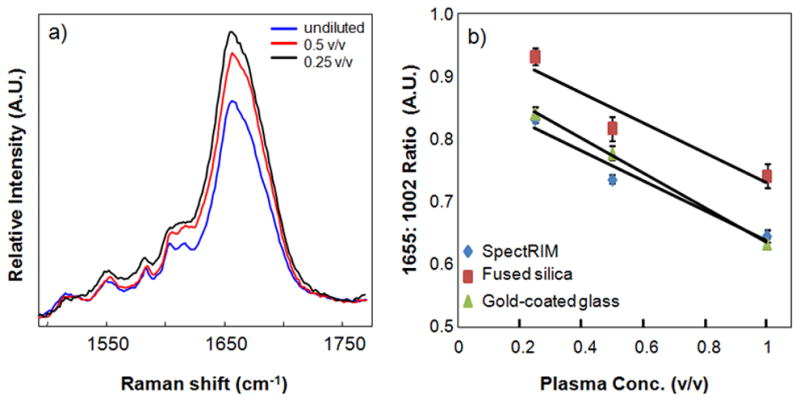
Plasma concentration had an effect on the relative intensity of the amide I envelope of the Raman spectrum, here measured by the 1665 cm−1: 1002 cm−1 intensity ratio. Unexpectedly, the ratio increased in more dilute samples (panel a). This pattern was observed independent of substrate (panel b).
Raman maps of the outer ring of dried synovial fluid drops showed spatial heterogeneity in the protein distribution which was dependent on fluid concentration. Figure 7 shows low resolution (4x) microscopy images and Raman maps of normal and arthritic synovial fluid at low concentration (0.1 v/v) and undiluted deposited onto gold-coated glass. Low concentration synovial fluid dried as ring-shaped deposits (panels a and c), with a coarse separation of a thin outer ring and fern-shaped crystals in the drop center. There was no noticeable cracking on the low concentration synovial fluid drops. Undiluted synovial fluid (panels b and d) also dried as a ring-shaped deposit with a coarse separation. However, the ring is both wider and thicker than the ring formed by low concentration synovial fluids and there were extensive cracks observed on the drop surface. Raman maps, also shown in Figure 7, were generated from the sum of intensities of the 1003,1033,1206,1445,1655 cm−1 bands as a spectroscopic marker of the amount of protein present.15 The spatial distribution of proteins varied with concentration. In diluted synovial fluid, proteins in the outer ring were either uniformly distributed (a) or localized in a stripe (c). Undiluted synovial fluid contained higher relative signal and non-uniformly distributed (panels b and d) within the ring. We hypothesize that the higher viscosity in undiluted synovial fluid resulted in localized stick-slip motion and non-uniform protein deposition.
Figure 7.
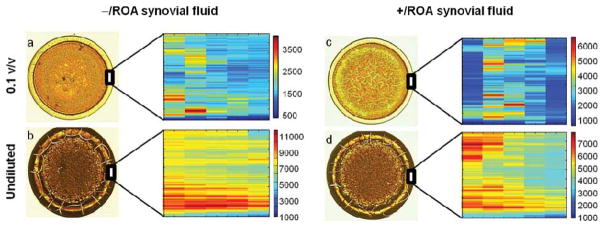
Low magnification (4x) and Raman maps of the outer ring for −/ROA and +/ROA synovial fluid, at low concentration (0.1 v/v) and undiluted. Similar to plasma, concentration has an effect on synovial fluid drop deposition. Undiluted synovial fluid dried with a thick outer ring, with cracks radiating toward the outer edge. Diluted synovial fluid drops dried as ring-shaped deposits with a thin outer ring and no cracks. Raman maps were generated from the intensity sums of the 1003,1033,1206,1445,1655 cm−1 bands, attributed to represent protein content. Scale bars on the Raman maps reflect relative intensities, and should not be used to qualitatively compare protein levels between two different drops. Qualitative analysis of the Raman maps show that protein distribution within the outer ring is highly variable, even though the ring appeared smooth, and dependent on synovial fluid concentration. The greatest spatial heterogeneity was observed in drops of undiluted synovial fluid.
Conclusions
Drop deposition is a simple, yet powerful, technique to prepare biofluids for a variety of analytical tools. In this study, two model biofluids were examined. In the first set of studies, geometric profiles of drying biofluids were calculated using home-built instrumentation and custom software to determine if the evaporation process could be explained using existing models. We found that the model biofluids followed the piling model of drop deposition under most circumstances. In the second set of studies, we examined the effects of substrate hydrophobicity and fluid concentration on the deposition pattern and chemical heterogeneity of the ring deposit. Our results show that the piling model is a good approximation of the fluid dynamics in biofluid drop deposition. However, more theoretical and experimental work can improve the model to include time-dependent rheology and intermolecular interactions during the evaporation process. Data provided by microscopy and Raman spectroscopy gives a robust description of the dried biofluid drop. While the substrate and fluid concentration had an effect on the morphology of the dried drop, the chemical composition and molecular structure of dried proteins within the outer ring were unaffected.
The ultimate goal of these studies is to improve the efficiency and diagnostic potential of biofluid drop deposition. Because the evaporation process is akin to a micro-scale crystallization process, experimental parameters such as substrate and drying conditions can be controlled to ensure that the desired type of deposit is routinely obtained. Once the proper conditions are identified, it is possible to consistently produce a deposition pattern. Depending on the application, it is desirable to obtain a homogeneous deposit or a ring-shaped deposit. In our previous study of synovial fluid, the coarse separation produced in a ring-shaped deposit enabled DDRS classification of fluids that were contaminated by vial additives (Supplemental Figure 6).17 By contrast, FT-IR analysis of dried biofluids is more sensitive to film thickness and a uniform deposition is desirable. There are elegant solutions reported by the FT-IR community including robotic liquid handling, homogeneous drop formation and multivariate data analysis.31–33 Potential basic science studies include functionalizing the substrate surface to mimic biological surface lubricity. In another approach, tryptic digestion or mass-specific filtration can be used to prepare biofluids prior to drop deposition to determine how high or low molecular weight components affect biofluid evaporation behavior. High-speed video microscopy, combined with quantum dot or fluorescence molecular tagging, may enable visualization of three dimensional flows.
Supplementary Material
Raman spectra of synovial fluid collected at various points along a synovial fluid drop. The depicted synovial fluid is from an individual patient and stored in a specimen vial enriched with proteases and anti-coagulants. The presence of the proteases and anti-coagulants prohibited good classification of bulk fluid tests, such as viscosity. The impurities, whose presence was indicated by the marked bands (*) in the bottom spectrum, were easily separated by the drop deposition process and enabled Raman classification of synovial fluid from each patient.
Videos 1–3 show a time-course of synovial fluid (normal and DJC) and plasma drying on gold-coated glass. A side-profile and overhead image was collected every second and compiled into a video. The side profile images show that the contact line remains pinned. Overhead images capture the formation of radial cracks and fern-shaped crystals. For reference, Video 4 compares the drying behavior of plasma with water.
Raman spectra of calcium fluoride slides, examined as-received.
Geometric properties of drying DJC synovial fluid drops.
Low magnification images of dried normal synovial fluid drops as a function of concentration and wetting properties. Upper row: CaF2, Lower row: gold-coated glass.
Low magnification images of dried DJC synovial fluid drops as a function of concentration and wetting properties. Upper row: CaF2, Lower row: gold-coated glass.
Acknowledgments
This work was supported by NIH/ National Institute of Arthritis and Musculoskeletal and Skin Diseases grant R01AR055222 and R01AR052010 (MDM) and a grant from the University of Michigan Medical School (BJR). KEW acknowledges training grant T32AR007080 from NIH/ National Institute of Arthritis and Musculoskeletal and Skin Diseases, and a career development grant from the University of Michigan CTSA from the NIH 2UL1TR000433. We thank Jon Jacobson, Bruce Miller, Andrew Urquhart and Farhang Raaii as our clinical collaborators in the human synovial fluid studies.
References
- 1.Kajiya T, Nishitani E, Yamaue T, Doi M. Physical Review E (Statistical, Nonlinear, and Soft Matter Physics) 2006;73:011601. doi: 10.1103/PhysRevE.73.011601. [DOI] [PubMed] [Google Scholar]
- 2.Hu H, Larson RG. J Phys Chem B. 2006;110:7090–7094. doi: 10.1021/jp0609232. [DOI] [PubMed] [Google Scholar]
- 3.Chopra M, Li L, Hu H, Burns MA, Larson RG. Journal of Rheology. 2003;47:1111–1132. [Google Scholar]
- 4.Deegan RD, Bakajin O, Dupont TF, Huber G, Nagel SR, Witten TA. Physical Review E. 2000;62:756. doi: 10.1103/physreve.62.756. [DOI] [PubMed] [Google Scholar]
- 5.Deegan RD, Bakajin O, Dupont TF, Huber G, Nagel SR, Witten TA. Nature. 1997;389:827–829. doi: 10.1103/physreve.62.756. [DOI] [PubMed] [Google Scholar]
- 6.Sommer AP. Cryst Growth Des. 2007;7:1031–1034. [Google Scholar]
- 7.Sommer AP, Rozlosnik N. Cryst Growth Des. 2005;5:551–557. [Google Scholar]
- 8.Adachi E, Dimitrov AS, Nagayama K. Langmuir. 1995;11:1057–1060. [Google Scholar]
- 9.Sefiane K. Advances in colloid and interface science. 2013 doi: 10.1016/j.cis.2013.05.002. [DOI] [PubMed] [Google Scholar]
- 10.Teng PN, Bateman NW, Hood BL, Conrads TP. Journal of Proteome Research. 2010;9:6091–6100. doi: 10.1021/pr100904q. [DOI] [PubMed] [Google Scholar]
- 11.Ortiz C, Zhang D, Xie Y, Davisson VJ, Ben-Amotz D. Analytical Biochemistry. 2004;332:245–252. doi: 10.1016/j.ab.2004.06.013. [DOI] [PubMed] [Google Scholar]
- 12.Xie Y, Zhang D, Jarori GK, Davisson VJ, Ben-Amotz D. Analytical Biochemistry. 2004;332:116–121. doi: 10.1016/j.ab.2004.05.052. [DOI] [PubMed] [Google Scholar]
- 13.Ortiz C, Zhang D, Xie Y, Ribbe AE, Ben-Amotz D. Analytical Biochemistry. 2006;353:157–166. doi: 10.1016/j.ab.2006.03.025. [DOI] [PubMed] [Google Scholar]
- 14.Zhang D, Mrozek MF, Xie Y, Ben-Amotz D. Applied Spectroscopy. 2004;58:929–933. doi: 10.1366/0003702041655430. [DOI] [PubMed] [Google Scholar]
- 15.Kopecký V, Jr, Baumruk V. Vibrational Spectroscopy. 2006;42:184–187. [Google Scholar]
- 16.Filik J, Stone N. Analytica Chimica Acta. 2008;616:177–184. doi: 10.1016/j.aca.2008.04.036. [DOI] [PubMed] [Google Scholar]
- 17.Esmonde-White KA, Mandair GS, Raaii F, Jacobson JA, Miller BS, Urquhart AG, Roessler BJ, Morris MD. J Biomed Opt. 2009;14:034013. doi: 10.1117/1.3130338. [DOI] [PMC free article] [PubMed] [Google Scholar]
- 18.Ercan M, Konukoglu D, Yesim TE. Clinical Hemorheology and Microcirculation. 2006;35:441–446. [PubMed] [Google Scholar]
- 19.Koenig W, Sund M, Filipiak B, Doring A, Lowel H, Ernst E. Arterioscler Thromb Vasc Biol. 1998;18:768–772. doi: 10.1161/01.atv.18.5.768. [DOI] [PubMed] [Google Scholar]
- 20.Fam H, Bryant JT, Kontopoulou M. Biorheology. 2007;44:59–74. [PubMed] [Google Scholar]
- 21.Jay GD, Torres JR, Warman ML, Laderer MC, Breuer KS. PNAS. 2007;104:6194–6199. doi: 10.1073/pnas.0608558104. [DOI] [PMC free article] [PubMed] [Google Scholar]
- 22.Cibere J, Zhang H, Garnero P, Poole AR, Lobanok T, Saxne T, Kraus VB, Way A, Thorne A, Wong H, Singer J, Kopec J, Guermazi A, Peterfy C, Nicolaou S, Munk PL, Esdaile JM. Arthritis & Rheumatism. 2009;60:1372–1380. doi: 10.1002/art.24473. [DOI] [PMC free article] [PubMed] [Google Scholar]
- 23.Deegan RD. Physical Review E. 2000;61:475–485. doi: 10.1103/physreve.61.475. [DOI] [PubMed] [Google Scholar]
- 24.Esmonde-White FWL, Esmonde-White KA, Morris MD. Appl Spectrosc. 2011;65:85–99. doi: 10.1366/10-06040. [DOI] [PMC free article] [PubMed] [Google Scholar]
- 25.Esmonde-White FWL, Schulmerich MV, Esmonde-White KA, Morris MD. Optics in Bone Biology and Diagnostics. San Jose, CA, USA: 2009. [Google Scholar]
- 26.Lieber CA, Mahadevan-Jansen A. Applied Spectroscopy. 2003;57:1363–1367. doi: 10.1366/000370203322554518. [DOI] [PubMed] [Google Scholar]
- 27.Lin VJC, Koenig JL. Biopolymers. 1976;15:203–218. doi: 10.1002/bip.1976.360150114. [DOI] [PubMed] [Google Scholar]
- 28.Chourpa I, Ducel V, Richard J, Dubois P, Boury F. Biomacromolecules. 2006;7:2616–2623. doi: 10.1021/bm060131d. [DOI] [PubMed] [Google Scholar]
- 29.Filik J, Stone N. Analyst. 2007;132:544–550. doi: 10.1039/b701541k. [DOI] [PubMed] [Google Scholar]
- 30.Sane SU, Cramer SM, Przybycien TM. Analytical Biochemistry. 1999;269:255–272. doi: 10.1006/abio.1999.4034. [DOI] [PubMed] [Google Scholar]
- 31.Ollesch J, Drees SL, Heise HM, Behrens T, Bruning T, Gerwert K. Analyst. 2013;138:4092–4102. doi: 10.1039/c3an00337j. [DOI] [PubMed] [Google Scholar]
- 32.Hughes C, Brown M, Clemens G, Henderson A, Monjardez G, Clarke NW, Gardner P. Journal of Biophotonics. 2014 doi: 10.1002/jbio.201300167. in press. [DOI] [PubMed] [Google Scholar]
- 33.Ollesch J, Heinze M, Heise HM, Behrens T, Brüning T, Gerwert K. Journal of Biophotonics. 2014 doi: 10.1002/jbio.201300163. in press. [DOI] [PubMed] [Google Scholar]
Associated Data
This section collects any data citations, data availability statements, or supplementary materials included in this article.
Supplementary Materials
Raman spectra of synovial fluid collected at various points along a synovial fluid drop. The depicted synovial fluid is from an individual patient and stored in a specimen vial enriched with proteases and anti-coagulants. The presence of the proteases and anti-coagulants prohibited good classification of bulk fluid tests, such as viscosity. The impurities, whose presence was indicated by the marked bands (*) in the bottom spectrum, were easily separated by the drop deposition process and enabled Raman classification of synovial fluid from each patient.
Videos 1–3 show a time-course of synovial fluid (normal and DJC) and plasma drying on gold-coated glass. A side-profile and overhead image was collected every second and compiled into a video. The side profile images show that the contact line remains pinned. Overhead images capture the formation of radial cracks and fern-shaped crystals. For reference, Video 4 compares the drying behavior of plasma with water.
Raman spectra of calcium fluoride slides, examined as-received.
Geometric properties of drying DJC synovial fluid drops.
Low magnification images of dried normal synovial fluid drops as a function of concentration and wetting properties. Upper row: CaF2, Lower row: gold-coated glass.
Low magnification images of dried DJC synovial fluid drops as a function of concentration and wetting properties. Upper row: CaF2, Lower row: gold-coated glass.


