

Abstract
Reciprocal copy-number variation (CNV) of a 593 kb region of 16p11.2 is a common genetic cause of autism spectrum disorder (ASD), yet it is not completely penetrant and can manifest in a wide array of phenotypes. To explore its molecular consequences, we performed RNA sequencing of cerebral cortex from mouse models with CNV of the syntenic 7qF3 region and lymphoblast lines from 34 members of 7 multiplex ASD-affected families harboring the 16p11.2 CNV. Expression of all genes in the CNV region correlated well with their DNA copy number, with no evidence of dosage compensation. We observed effects on gene expression outside the CNV region, including apparent positional effects in cis and in trans at genomic segments with evidence of physical interaction in Hi-C chromosome conformation data. One of the most significant positional effects was telomeric to the 16p11.2 CNV and includes the previously described “distal” 16p11.2 microdeletion. Overall, 16p11.2 CNV was associated with altered expression of genes and networks that converge on multiple hypotheses of ASD pathogenesis, including synaptic function (e.g., NRXN1, NRXN3), chromatin modification (e.g., CHD8, EHMT1, MECP2), transcriptional regulation (e.g., TCF4, SATB2), and intellectual disability (e.g., FMR1, CEP290). However, there were differences between tissues and species, with the strongest effects being consistently within the CNV region itself. Our analyses suggest that through a combination of indirect regulatory effects and direct effects on nuclear architecture, alteration of 16p11.2 genes disrupts expression networks that involve other genes and pathways known to contribute to ASD, suggesting an overlap in mechanisms of pathogenesis.
Introduction
Autism spectrum disorder (ASD) is a complex, heterogeneous developmental disorder affecting 1% of the population.1 Although much of the genetic etiology remains unexplained, the collective impact of copy-number variation (CNV), most of which involve genomic segments that encompass many genes and regulatory elements,2,3 is substantial.4 The association between ASD and large, recurrent, reciprocal CNVs, often as de novo variants, has been highly significant and consistent across multiple studies.5–7 Nonrecurrent CNVs (i.e., deletions and duplications that are not of identical size and location) can be aligned by chromosomal position to define a minimum region of overlap that can harbor a strong effect driver of phenotypic outcomes (e.g., MBD5 [MIM 611472] in 2q23.1 deletion syndrome [MIM 156200]8–11 or EHMT1 [MIM 607001] in 9q34.3 deletion syndrome [MIM 610253]10,12,13). However, recurrent CNVs are predominantly due to nonallelic homologous recombination (NAHR), mediated by flanking segmental duplications. The breakpoints of these NAHR-mediated events are defined by the flanking repetitive sequences, and therefore localization of the CNV alone does not offer the opportunity to identify individual loci contributing to the phenotype.
Previous CNV,5,7,14,15 exome-sequencing,4,16–18 and balanced chromosomal abnormality (BCA)8,10 studies suggest a substantial impact in ASD of loss-of-function mutations that result in functional hemizygosity. However, they have also highlighted the need for functional genomic approaches to augment DNA-based studies. First, despite clear evidence of a strong role for genes that regulate synaptic function (e.g., SHANK3 [MIM 606230], NRXN1 [MIM 600565], GRIN2B [MIM 138252], NLGN4 [MIM 300427]19), recent studies have also identified chromatin modifiers and transcriptional regulators as significant ASD risk factors,10,17,18 some of which have previously been implicated in a spectrum of psychiatric disorders.10,20 These associated genes include global regulators of gene expression as well as members of fundamental developmental pathways, such as β-catenin18 and FMRP signaling.16 Second, the genetic discoveries and their associated effect sizes predict that there are hundreds, if not thousands, of genes that confer risk for ASD,7,18 suggesting a genetic architecture that complicates any unified model of disease pathogenesis. Third, gene-expression studies implicate a diverse set of pathways as significantly altered in ASD. Genes responsible for neuronal development and immune response have emerged as commonly dysregulated in several studies,21,22 including one analysis of coexpression in postmortem brain, which also found regional differences implicating abnormal patterns of brain development.23 Finally, there is significant evidence that some genes initially implicated in ASD through inactivating mutations also confer increased risk through duplication,10 prompting the hypothesis of morbid genomic loci that are sensitive to alterations in gene dosage, consistent with microarray-based CNV studies.5,7,10,14,15,24
Among recurrent CNVs in ASD, a segment of 16p11.2 represents one of the most common etiological factors, accounting for ∼1% of all ASD cases.7,25 This 593 kb region contains 29 genes (25 of which are protein coding), including transcription factors (e.g., MAZ [MIM 600999], TBX6 [MIM 602427]) and chromatin modifiers (e.g., HIRIP3 [MIM 603365], INO80E [RefSeq NM_173618]), as well as other genes with a wide array of cellular functions. The region is flanked by parallel and highly homologous (>99% similarity) segmental duplications, each spanning 147 kb and containing 12 genes (10 protein coding), which are duplicated within each copy of the segment. Despite the uniformity of NAHR-mediated breakpoints, this CNV confers risk to diverse phenotypic outcomes, including ASD, schizophrenia, bipolar disorder, seizures, obesity, and numerous other neurological and anthropometric traits,5–7,26 suggesting a role for modifying factors that affect penetrance and expressivity.
Both deletion (MIM 611913) and duplication (MIM 614671) of 16p11.2 are associated with ASD risk,27 a dosage phenomenon that has been explored in zebrafish models. In one study, the importance of strict dosage balance for genes in the 16p11.2 CNV segment has been demonstrated by systematic suppression and overexpression of the genes individually and in pair-wise interactions. This revealed KCTD13 (MIM 608947) as a major driver of mirrored neuroanatomical phenotypes and detected significant interactions with MAPK3 (MIM 601795) and MVP (MIM 605088).28 In another zebrafish study, loss of function for most 16p11.2 orthologs resulted in changes in brain morphology, axonal density, and motor response.29 Here, we have taken an alternative strategy to investigate the effect of reciprocal dosage change of this genomic segment, by using RNA sequencing to assess dosage-dependent gene expression differences in the cerebral cortex of mouse models of duplication/deletion and in cell lines derived from multiplex ASD families with the CNV. Our results reveal an impact of 16p11.2 CNV on transcription of all genes within the region, as well as on a network of dysregulated genes and pathways, including genes involved in synaptic function, chromatin modification, and known contributors to ASD and intellectual disability, suggesting convergence of 16p11.2 pathogenic mechanisms on several common ASD pathways.
Material and Methods
Samples
We sequenced RNA from the cortical tissue of mice harboring deletion and duplication of the 7qF3 region of synteny conservation with 16p11.2 (n = 16) and lymphoblastoid cell lines (LCLs) derived from 34 individuals from seven, multiplex ASD families. The mouse models were created at the Cold Spring Harbor Laboratory by A. Mills and colleagues, as previously described in Horev et al.,30 and provided by the Jackson Laboratories (stock numbers 013128 and 013129). Sixteen mice were selected from two litters of an engineered line with deletion or duplication of the mouse 16p11.2 equivalent region plus four additional genes found in the human immediately outside of the segmental duplication, centromeric to the CNV (Cd2bp2, Tbc1d10b, Mylpf, Sept1). Within each litter, four mice with CNV were compared to four wild-type littermates (eight total wild-type mice; Figure S1A available online). The design was fully sex balanced for each genotype. LCLs were obtained from the Autism Genome Resource Exchange (AGRE), which has established a repository for biological material from ASD-affected families supplemented with genotype and phenotype information. The families were characterized as deletion (four families) and duplication (three families) and included multiple siblings that were both affected and unaffected (see Figure S1B for family pedigrees). The study was approved by the IRB of Partners Healthcare.
RNA Sequencing
Dissection of mouse cortex was performed simultaneously for all mice at 8 weeks of age. Both mouse cortex and human LCL RNA-seq libraries were prepared with a customized version of the originally published, strand-specific dUTP method.31–33 Human RNA-seq was performed with two biological replicates (independent cell pellets per definition of ENCODE project34) for each individual. Each library also included 1 μl of a 1:10 dilution of ERCC RNA Control Spike-Ins (Ambion) containing 92 synthetic RNA standards of known concentration and sequence. These synthetic RNAs cover a 106 range of concentration, as well as varying in length and GC content to allow for validation of dose response and the fidelity of the procedure in downstream analyses.35 See Table S1 for complete molecular protocol. Libraries were multiplexed, pooled, and sequenced on multiple lanes of an Illumina HiSeq2000, generating an average of 40M and 60M paired-end 50-cycle reads for each mouse sample and across both human replicates, respectively.
Sequence Analysis
Raw sequence data were quality checked with fastQC36 and aligned with TopHat2 via default parameters against the RefSeq transcriptome, mm10 for the mouse (UCSC Genome Browser, accessed September 2012), and hg19 for the human (UCSC Genome Browser, accessed February 2013). All aligned reads were analyzed with RNA-SeqQC37 to ensure uniformity of alignment rate, duplication rate, evenness of coverage, GC content, and rRNA content. Reads aligned to the ERCC synthetic RNAs were used to check the linearity of dose response within and between samples (Figure S2A), to determine the abundance limits of gene expression that could be accurately quantified in our experiment (defined as the average abundance of the lowest detectable ERCC transcript from all samples; Figure S2B), and to assess the power to detect differential expression at varying fold-changes. Raw gene level counts were tabulated with the BEDTools suite38 against the human and mouse RefSeq transcriptomes (both accessed February 2013). Genes with read counts below our detection threshold in any individual sample were excluded from analysis in all samples, and raw counts were normalized with the total number of counts generated per sample prior to statistical analysis.
Differential Expression Analysis
Gene level read counts generated by RNA-seq are overdispersed relative to the Poisson; therefore, we chose the negative binomial distribution to model these data.39,40 The mouse cortex data were analyzed with negative binomial generalized linear models (GLMs). The dispersion parameter for each gene was estimated with an iterative weighted least-squares approach for the GLM analysis. For the human LCL data, negative binomial generalized linear mixed models (GLMMs) were used, with random effects to account for the correlations due to relatedness among individuals. To fit a negative binomial GLMM, the Poisson-lognormal approach was used. The covariance among individuals was based on a relationship matrix estimated from the pedigree, which accounts for similarity in expression based on the degree of shared genetic background.
All analyses were conducted in R with the MASS41 package for GLMs and pedigreeMM42 package for GLMMs. Empirical p values were generated by permutation of expression values for a gene over the individuals. Differential expression analysis was performed to assess linear trends associated with reciprocal dosage imbalance by regressing gene expression as a linear function of 16p11.2 (or 7qF3) copy state (reciprocal expression model). For effects specific to the direction of CNV, we also fit a factorial ANOVA with genotype and sex as the factors for mouse, and genotype, sex, and affected status as factors for the human LCLs (deletion- and duplication-specific models). We used FDR corrected p values (Benjamini-Hochberg FDR) for thresholds of statistical significance and permutation to establish empirical p values in the human cohort. Permutation was not performed on the mouse data due to insufficient degrees of freedom for randomization. Nominally significant results were retained for exploratory analyses. See Appendix A for complete details.
Network and Enrichment Analyses
To determine patterns of differential gene expression and coexpression networks as a consequence of 16p11.2 CNV, we performed pathway and enrichment analyses utilizing orthogonal approaches. First, we used weighted-gene coexpression network analysis (WGCNA)43,44 to identify modules of coexpressed genes among nominally significant differentially expressed loci in the reciprocal expression model. We also assessed the physical interactions and networks of dysregulated genes by using DAPPLE.45 Next, we performed overrepresentation analysis to identify enriched pathways with the BIOCARTA, KEGG,46,47 PANTHER,48 and REACTOME49 databases and statistically significant gene ontology (GO) terms with DAVID,50 which are further summarized by REVIGO.51 We used all genes with expression levels above our detection thresholds as the background list for both the mouse cortex (14,435 genes with human orthologs) and human LCLs (13,812 genes that converged in our statistical analyses from the reciprocal model, 14,133 genes that converged from the direction-specific contrasts). Enrichment for differentially expressed genes by chromosomal location was performed by binning genes by chromosome band and performing Fisher’s exact tests with Enrichr.52 Gene set enrichment analysis relied on ranking the list of genes based on statistical significance with GSEA53 with the default settings. Networks were visualized with Cytoscape 2.8.3/3.1.54 A false discovery rate (FDR) of 5% (q < 0.05) was used to interpret statistical significance.
Results
RNA-Seq of Human LCLs with 16p11.2 CNV and Comparable Mouse Brain Tissue
We performed RNA sequencing on the cortical tissue of 8 mice with CNV of the 16p11.2 syntenic region (4 deletion, 4 duplication) and 8 wild-type littermates, as well as on 34 human LCLs from 7 multiplex autism-affected families harboring 16p11.2 CNVs (4 deletion families, 3 duplication families) to determine the effects of altered 16p11.2 copy state on expression in cis and in trans. There were 10,992 genes expressed in both mouse cortex and human LCLs at measurable abundance (based on the synthetic RNA spike-ins, as defined in Methods), with an additional 4,974 genes expressed only in mouse cortex and 3,142 genes expressed only in human LCLs. Of the genes expressed in both tissues, the correlation in gene expression was high (Spearman rank correlation [SRC] > 0.99) between samples of the same tissue, but was predictably lower between mouse cortex and human LCLs (SRC: 0.40–0.41; Figure S3). In mouse cortex, 29 of the 33 genes in the region of manipulated dosage in 7qF3, which extends slightly beyond the region corresponding to the 16p11.2 CNV (see Methods), met detection thresholds. In human LCLs, 21 of the 29 genes localized to the 16p11.2 segment met detection thresholds. We evaluated expression of the 603 loci previously associated with ASD as defined from the Simons Foundation55 and AutismKB56 (accessed August 2013), revealing that at this sequencing depth, we detected expression of 543 (90%) of these genes in the mouse cortex and 364 (60%) of genes in human LCLs.
Transcriptional Impact of 16p11.2 CNV on Dosage-Altered Genes
When comparing the samples with deletion to their corresponding diploid controls, we observed a relatively uniform reduction in gene expression both for human genes in the 16p11.2 CNV in LCLs and for their mouse orthologs in cerebral cortex (mean expression ± standard deviation = 0.54× ± 0.10× and 0.49× ± 0.07×, respectively) (Figures 1A and 1B). Duplication resulted in a corresponding, though slightly more variable, increase in expression (1.44× ± 0.12× and 1.53× ± 0.14× in human LCLs and in mouse cortex, respectively). Both findings indicate that there is little or no dosage compensation involved in the regulation of expression of any genes within the CNV region. We refer to “reciprocal expression” herein to represent genes that are linearly correlated with 16p11.2 dosage state, and genes are referred to as significant in “reciprocal model” based on linear regression of gene expression with copy state. In the mouse cortex, 25 of the 29 16p11.2 orthologs that met detection thresholds were significant at an FDR q < 0.05, and in human LCLs 18 of the 20 genes within the 16p11.2 CNV were significant at the same FDR-corrected threshold. In the human CNV region’s flanking segmental duplications, the average gene expression compared to control was 0.76× for deletion and 1.22× for duplication, consistent with the respective 3:4 and 5:4 copy ratios of the genes in these segments. Only SULT1A3 (MIM 600641), SULT1A4 (RefSeq NM_001017390), and LOC613037 (RefSeq NR_002555) did not show consistent differential expression, as there was a large variance for expression of these genes. No comparable analyses were performed in the mouse because the segment is not duplicated in the mouse.
Figure 1.

Expression Changes of Genes within the 16p11.2 CNV Region
Relative fold change in expression across (A) the 16p11.2 syntenic region (7qF3) in mouse cortex with copy-number variation and (B) the 16p11.2 CNV in human LCLs. Wild-type refers to family members without CNV in (B). The CNV breakpoints in the engineered mouse strain are represented by dashed vertical lines, whereas in human, the breakpoints are found within the region’s flanking segmental duplications, represented in orange. Deletion and duplication result in relatively uniform gene expression patterns with little evidence of dosage compensation. Expression estimates are counts per million mapped reads, and each point represents the relative ratio (fold change) in expression between wild-type and an abnormal copy state. Note that one gene, Gdpd3, was removed from (A) because of highly variable, sex-specific expression differences that we detected by RNA-seq and have been previously reported by Horev et al. as due to background differences in parental mouse strains.30,57
Genome-wide Effects of 16p11.2 CNV on Gene Expression
We observed differences genome-wide in the expression of genes as a consequence of the CNV dosage. In the mouse cortex, when we considered the dosage effect by regression on copy state (1, 2, or 3 copies of the CNV region), we found that the strongest effect sizes across the genome were detected within the CNV region itself (Figure 2A), although two genes outside the region met FDR-corrected significance thresholds (Kcnd3 and Slc7a14). Similar results were observed in human LCLs, where the most significant reciprocal dosage effects were within the 16p11.2 CNV (Figure 2B). We next performed ANOVA, individually contrasting deletion and duplication of the CNV region to wild-type animals or diploid humans. In the mouse cortex, outside of the 7qF3 region, 36 genes were differentially expressed due to deletion and 6 genes were differentially expressed due to duplication at FDR-corrected thresholds, with 2 genes significant at FDR thresholds in the human LCLs (Table 1). Comparing the nominal results of each model identified genotype-specific changes in gene expression: 56% of all differentially expressed genes in mouse cortex were only significantly altered by deletion, and 32% of such genes were specifically altered by duplication. By contrast, in the human LCLs the effects for 38% and 57% of differentially expressed genes were unique to deletion and duplication, respectively, though the human pedigrees had greater power to detect the effects of duplication in this model (4 deletion, 10 duplication, 20 controls) whereas the mouse study was perfectly balanced (see Table S3and Figure S4). Overall, these results indicate that the strongest and most consistent reciprocal effects are on expression of the genes directly altered by the 16p11.2 CNV but that there is a detectable impact of deletion, duplication, or both beyond the region of dosage change.
Figure 2.

Genome-wide Distribution of Reciprocal Alterations in Gene Expression
−log10(p values) across the genome in (A) mouse cortex and (B) human LCLs. Genome-wide there are no regions of differential expression as significant as the genes found within 16p11.2 and 16p11.2 syntenic (7qF3 in mouse) regions. See Table S3 for complete expression and significance details.
Table 1.
Differential Expression Counts and Enrichment for Altered Expression of ASD-Implicated Genes
| Genes Analyzed | Nominally Significant Differentially Expressed Genesa | FDR-Significant Differentially Expressed Genesb | Detected Human Orthologsc | Total ASD Genes Analyzedd | Nominally Significant Differentially Expressed ASD Genesa | Significance of ASD Gene Enrichmentd,e | |
|---|---|---|---|---|---|---|---|
| Mouse reciprocal | 15,966 | 1,079 | 25 | 14,435 | 540 | 51 | 0.0063 |
| Mouse del | 15,966 | 2,344 | 59 | 14,435 | 540 | 101 | 0.0041 |
| Mouse dup | 15,966 | 1,504 | 24 | 14,435 | 540 | 55 | 0.2506 |
| Human reciprocal | 13,812f | 587 | 19 | – | 358 | 17 | 0.3098 |
| Human del | 14,133 | 908 | 10 | – | 362 | 29 | 0.0490 |
| Human dup | 14,133 | 1,290 | 5 | – | 362 | 43 | 0.0197 |
Uncorrected p value < 0.05.
Benjamini-Hochberg FDR-corrected q < 0.05.
Orthologs were retrieved from the Jackson Labs database.
16p11.2 genes that have been individually implicated in ASD (SEZ6L, MAPK3, KCTD13) were excluded from the enrichment analysis.
p value by Fisher’s Exact Test.
Some genes were not included because the statistical model failed to converge.
Regional Effects of 16p11.2 CNV
Changes in expression of genes outside of the CNV region could result from direct effects of structural changes in the chromatin or from indirect effects of pathway perturbation due to altered dosage of one or more CNV genes. To assess the former possibility in immediate proximity to the CNV, we analyzed genes within a range of intervals spanning either side of the 16p11.2 CNV segment (1 Mb, 2.5 Mb, and 5 Mb) for potential positional effects of the dosage change on gene expression in cis across all statistical models. We found that in the mouse cortex, the region corresponding to the distal segment in the human CNV (based on gene content) was enriched for differential expression within 1 Mb (9 of 19 genes; p = 0.031), 2.5 Mb (11 of 24 genes; p = 0.023), and 5 Mb (18 of 43 genes; p = 0.013), although there was no enrichment for comparable windows in the region corresponding to the segment proximal to the human CNV (Table S2). Indeed, cis positional effects are readily observed for genes in closest proximity to the CNV breakpoint in Figure 1A. The human LCL results were remarkably consistent with the mouse findings: distal to the CNV there was significant enrichment of all three size bins (p = 0.025, 0.029, and 0.040 at 1 Mb, 2.5 Mb, and 5 Mb distal to the CNV, respectively) and none of the bins was significantly enriched proximal to the CNV (Table S2). Notably, this region of consistent positional effect telomeric to the 16p11.2 CNV in humans includes the previously described “distal” 16p11.2 microdeletion.58 To establish the genome-wide null distribution for enrichment of differentially expressed genes within a genomic segment, we performed the same enrichment analysis for every sequential 1 Mb, 2.5 Mb, and 5 Mb region in the genome in human and mouse. The enrichment observed in the genomic segments distal to the CNV was in the tail of the distribution of the enrichment p values for every bin size in both human and mouse (>97th percentile), whereas the proximal region fell between the 40th and 50th percentiles of the same distributions (Figure S5).
We next evaluated whether genome-wide gene expression differences might reflect trans positional effects due to a structural impact on chromatin and nuclear organization. Physical alterations to nuclear positioning have been previously observed due to translocation59 and copy-number variation.60 We used Enrichr52 to determine whether any cytogenetic band other than 16p11.2 was enriched for differentially expressed genes and detected a strong regional effect in 6p22 (p = 3.59 × 10⁻⁶), as well as in 1p21, 1p22, 8p22, 12q22, 12q24, and 19q13 (q < 0.05). When we integrated these segments enriched for differentially expressed genes with Hi-C data generated to assess chromatin folding and packaging in the nucleus of human lymphoblastoid cell lines (from the UMass Hi-C data browser), we found evidence for physical interaction between 16p11.2 and each of 6p22, 12q24, and 19q13, the strongest of which occurred with 6p22 (Figure 3). At the higher resolution of the Hi-C data (1 Mb segments), we also see evidence of physical interaction between the distal 16p11.2 segments in which positional effects were detected in cis and the canonical 16p11.2 CNV region. As mentioned above, this distal region has previously been associated with another microdeletion syndrome implicated in neurodevelopmental disorders.58 The Hi-C data also suggest correlation with the 16p11.2 proximal segments, though this region was not enriched for differential expression. In the mouse data, several chromosome bands were significantly enriched for differentially expressed genes (q < 0.05) including 16qB2 (3q29 syntenic region) and 13qD2.2 (5q31 syntenic region). Our findings suggest that microdeletion syndromes may influence gene expression by direct positional effects both in cis and in trans. Further studies are warranted on other microdeletion syndromes or classes of structural variation to determine whether similar genome-wide positional effects from CNV or BCAs are predictable based on physical interactions within the nucleus.
Figure 3.

Positional Effects as a Consequence of Physical Interactions
Scatterplot presents the –log10 p values associated with reciprocal expression changes across 16p11.2 deletion, control, and 16p11.2 duplication for each gene along the length of chromosome 6. The heat map below shows the reported Hi-C correlation (blue, low correlation; red, high correlation) between each section of chromosome 6 (x axis of heatmap) and the 16p11.2 region (y axis of chr16; coordinates, chr16:29,000,000–31,000,000). Note that the enrichment of low p values for differential expression over the region of chromosome 6 (6p22) corresponds to the greatest evidence for physical interaction with 16p11.2 (red arrow), suggesting altered physical interactions. See Table S3 for complete expression and significance details.
Transcriptional Impact of 16p11.2 CNV on Expression of ASD-Associated Genes
Among 603 genes previously associated with ASD as annotated by SFARI55 and AutismKB,61 543 had established orthologs that were expressed at detectable levels in mouse cortex, so we evaluated whether these were overrepresented in the set of differentially expressed genes. We found that genes previously associated with ASD were significantly enriched among all differentially expressed genes (p = 0.046), and particularly among genes that were significant in the reciprocal models in which expression changed as linear function of 16p11.2 copy state (p = 0.006). There was also enrichment of ASD-associated genes among differentially expressed genes in the human LCLs (76 ASD-associated genes, enrichment p = 0.022), although only 364 genes were expressed in LCLs at our detection thresholds. In contrast to the mouse, there was significant enrichment of ASD-associated genes whose expression was altered by deletion or by duplication only (p = 0.049 and 0.020, respectively), but not among genes that showed reciprocal alterations (p = 0.310) (Table 1). Of the ASD-associated genes outside the CNV region, 15 were altered in both human and mouse data sets, including FMR1 (MIM 309550), the causal locus of Fragile X Syndrome (MIM 300624). We also assessed the enrichment of ASD-associated genes identified by whole-exome sequencing as harboring de novo loss-of-function (LoF) mutations, as defined in Willsley et al.62 The highest confidence gene sets (harboring two or more de novo LoF mutations in exome studies) contained only nine genes—eight expressed in our mouse cortex and six expressed in our LCLs—and was not significantly enriched. However, an expanded set of 122 genes that had been disrupted at least once showed enrichment among differentially expressed genes comparable to the overall ASD-associated gene-set in mouse cortex (p = 0.013, 0.0143, and 0.0057 for CNV, deletion-only, and duplication-only models). Enrichment in LCLs was not significant, consistent with the tissue-specific differences that we observed for many of our analyses (109 of 122 genes expressed in mouse cortex, 92 expressed in LCLs; Table S9).
Weighted Gene Coexpression Network Analysis
Mouse genes with nominally significant reciprocal expression changes were clustered into four modules based upon correlated expression, independent of the direction of change, by weighted gene coexpression network analysis (WGCNA) (Table S4). The largest module (herein referred to as the Mouse 16p11.2 module) contained 393 genes including all of the 16p11.2 syntenic genes. Although the 16p11.2 syntenic genes had the greatest absolute correlation with the overall module expression profile (eigengene), more of the genes in this module were negatively correlated with dosage of the CNV region than were positively correlated: 274 genes (70%) were upregulated by deletion and downregulated by duplication. This was concordant with the analysis of individual copy states relative to wild-type (Figure 4A; see Tables S4 and S5 for complete details of the mouse cortex WGCNA). In the human LCLs, the genes that were differentially expressed in the reciprocal model were included in WGCNA analyses and clustered into four coexpression modules, one of which contained 96 genes, including all but 4 of the 16p11.2 genes (hereafter the Human 16p11.2 module). This module of 96 genes exhibited similar patterns of expression to the Mouse 16p11.2 module in that the 16p11.2 genes had the largest absolute correlations with the module eigengene, and a greater proportion of the non-16p genes again showed anticorrelated expression with the 16p11.2 copy state (63 of 96 genes, 66%). Notably, only the genes within the CNV region were conserved between the modules in mouse cortex and human LCLs (Figure 4B). See Tables S6 and S7 for complete details of module expression trends and module membership in human LCLs, respectively.
Figure 4.

Weighted Gene Coexpression Network Analysis
WGCNA was used to perform correlation network analysis of the differentially expressed genes in human and mouse. Heatmaps are shown for gene expression in the (A) “Mouse 16p” module and (B) “Human 16p” module. Each column represents the RNA-seq expression of a single gene in the module, with red indicating low expression and yellow indicating high expression. The rows in (A) represent the four deletion samples, four duplication samples, and eight wild-type samples, and rows in (B) represent four deletion samples, ten duplication samples, and 20 control samples.
Pathway Analysis of Global Gene Expression Changes
Gene ontology and pathway analysis in the mouse cortex found enrichment among differentially expressed genes for terms corresponding to cellular adhesion, cadherin signaling, Rho GTPase signaling, transcriptional regulation, actin cytoskeleton organization, neuron differentiation, axonogenesis, and axon guidance (q < 0.05; Figure 5A). In the human LCLs, we found enrichment of terms related to nucleosome assembly and chromatin organization, as well as cell cycle regulation and mRNA processing (q < 0.05; Figure 5B).
Figure 5.
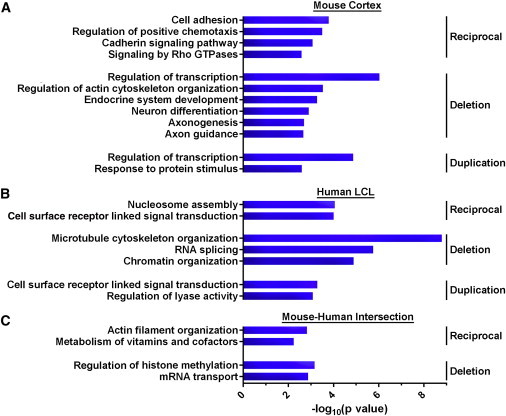
Pathway Analysis of Differentially Expressed Genes
Ontology enrichment analysis was performed with DAVID. The uncorrected –log10 p value of selected pathway enrichments significant at FDR q < 0.05 are presented above for genes with reciprocally altered expression in (A) mouse cortex, (B) human LCLs, and (C) both mouse cortex and human LCLs, with a full listing of pathway enrichments found in Table S8. No FDR-corrected significant terms emerged from the mouse-human duplication intersection gene set.
We asked whether the genes showing altered expression converge on common pathways. We performed enrichment analysis on the union of all of the altered genes that overlapped between data sets and found overrepresentation of terms related to histone methylation, mRNA processing, filament organization, and vitamin metabolism (q < 0.05; Figure 5C, Table S8). Gene set enrichment analysis on ranked gene lists found pathways involving Wnt signaling, cadherin signaling, nucleosome assembly, and cell adhesion as significantly enriched (q < 0.05). Finally, we applied DAPPLE to the 981 human orthologs that were significant in the reciprocal analysis in the mouse cortex (i.e., showed linear dosage changes that were correlated with the CNV), which revealed a highly interconnected network of 273 nodes and 320 edges that included a greater number of ASD-associated genes than expected by chance (enrichment of gene set in the direct interaction network: p = 0.006) but was not significant for genes within the 16p11.2 segment (6 genes, p = 0.792; Figure 6). A similar analysis in human LCLs on 587 genes that were nominally significant in the reciprocal expression model revealed a network of direct interactions with 145 nodes and 220 edges but was not enriched for 16p11.2 or ASD-associated genes (Figure 7, see also Figures S5–S7 for complete network analyses). However, a subnetwork of genes with altered expression was observed containing a set of histone genes implicated in nucleosome assembly as well as HDAC4 (MIM 605314), a gene previously implicated in ASD, whose gene product interacts directly with that of MAPK3, a gene from the 16p11.2 CNV.
Figure 6.

Protein-Protein Interaction Network of Differentially Expressed Genes in Mouse Cortex
DAPPLE was used to generate a direct interactome for the protein products from 981 human orthologs of genes (including 54 genes previously implicated in ASD) that were differentially expressed in the mouse cortex due to CNV of the 16p11.2 syntenic region by the reciprocal expression model. A cluster of 190 proteins includes 6 gene products encoded in the 16p11.2 syntenic region (red) as well as 24 genes previously implicated in ASD (blue). The network revealed a statistically significant enrichment of ASD-associated genes (Fisher’s exact test; p = 0.032), but not 16p11.2 syntenic CNV genes (p = 0.792).
Figure 7.

Interconnected Network of Genes Differentially Expressed because of 16p11.2 CNV
DAPPLE was used to generate a direct interactome of the proteins encoded by 587 human genes that were differentially expressed from the reciprocal model in human LCLs. A cluster of 73 proteins includes 1 encoded in the 16p11.2 CNV region (red) as well as 2 previously implicated in ASD (blue). The highlighted box shows proteins encoded by a subset of the differentially expressed genes in 6p22 that are involved in nucleosome assembly and interact indirectly with MAPK3, encoded by a 16p11.2 gene, through HDAC4.
Discussion
Our transcriptome sequencing of mouse models and families harboring dosage alterations of the 16p11.2 microdeletion/microduplication syndrome provides insights into the functional genomic consequences, both in the region of dosage change and more broadly in the genome, of a common CNV that is associated with a variety of human disorders. In both mouse cortex and human LCLs, there was no evidence for dosage compensation of genes within this CNV segment. Few genes outside the CNV region had expression changes that were as significant as those dosage-driven effects on genes within the CNV.
In ASD studies, LCLs are often the only tissues available for large-scale analyses. The effect sizes detected in this study are modest and, much like DNA-based association designs in complex disorders, suggest that well-powered cohorts will be necessary to comprehensively evaluate the transcriptional architecture of this disorder. Therefore, it is likely that the need for many subjects will limit most studies to the examination of peripheral tissues. Although we observed ASD-associated genes and pathways that can be detected reliably in the LCLs, our analyses in the mouse also revealed that neural tissue can provide additional insight, particularly with respect to ASD-associated genes. By example, when we compare our data to RNA-seq data from iPS-derived neural progenitor cells (NPCs) in an independent study (M.E.T., unpublished data), we also find significantly more ASD-associated loci expressed in human NPCs than LCLs and a correlation structure that is higher between mouse brain and human NPCs than between human NPCs and human LCLs. Given that 16p11.2 represents a genomic disorder that is associated with a spectrum of developmental, psychiatric, and anthropometric traits, a complementary approach using multiple tissue types will represent the ideal strategy for understanding its functional consequences on gene expression. Based on our data, this should include multiple human iPS-derived neuronal cell types because the impact on ASD-associated genes and their networks is likely to vary between tissues.
RNA sequencing in both mouse cortex and human LCLs supports the hypothesis that possible positional effects in cis can extend beyond the site of the CNV. We find altered gene expression in the proximity of dosage change in both mouse and humans, the former of which is not flanked by segmental duplications as is the NAHR-mediated human CNV. This cis positional effect is evident over distances of 1 Mb, 2.5 Mb, and 5 Mb and is specific to genes in the human region distal to the CNV and likewise in its syntenic counterpart in mouse. This effect was one of the most consistent results between human LCLs and mouse cortex and encompasses the site of the recurrent 220 kb deletion previously annotated as the distal 16p11.2 microdeletion syndrome.58 Publicly available Hi-C data63 aimed at detecting genome-wide chromosome interactions revealed that this segment is one of the most correlated with the canonical 16p11.2 CNV region (not surprising given their proximity), suggesting that altered chromosome folding may influence the cis regulation of gene expression. Consistent with the findings of Luo et al.,64 we did not find evidence for a correlation between the extent or direction of altered expression and distance from the CNV for the cis effects observed.
Outside of 16p11.2, we identified other contiguous genomic segments with more differentially expressed genes than would be expected by chance. The most significant of these was 6p22, for which the Hi-C suggested a correlation with 16p11.2. This suggests that microdeletion syndromes may influence gene expression both locally and remotely by changing chromatin folding, thereby altering physical interactions between chromosome regions in the nucleus. Collectively, these data suggest that positional effects from structural variation may have a significant functional impact on gene expression, either as a consequence of altering dosage of regulatory elements in cis or from alterations to nuclear structure of the chromosomes. Our association-based approach cannot definitively distinguish between direct positional effects and indirect regulatory consequences of altered pathways, and these data warrant extensive analyses across the spectrum of structural variation.
The altered expression of genes previously associated with ASD provides intriguing evidence for convergence on common pathways from disparate mutational mechanisms, such as CNV, translocation, inversion, and inactivating point mutations in the coding sequence. Alteration to gene expression in these pathways as a consequence of 16p11.2 dosage change potentially connects divergent hypotheses of ASD pathogenesis. Previous studies of hemizygous disruption have revealed genes associated with ASD and other abnormal neurodevelopment that are involved in critical neuronal functions, such as synaptic transmission and cell-cell interaction (e.g., GRIN2B, KIRREL3 [MIM 607761], NRXN1). However, they have also revealed genes involved in chromatin modification, methylation, and transcriptional regulation (e.g., CHD8 [MIM 610528], TCF4 [MIM 602272], FOXP1 [MIM 605515], EHMT1, MBD5, SATB2 [MIM 608148], ZBTB20 [MIM 606025]), supporting a model of ASD pathogenesis in which disruption of neurodevelopment can be triggered by genes with global effects on the expression of other genes. Here, we find an interesting convergence between these two hypotheses in the pathways whose expression is altered by 16p11.2 CNV, which include genes that function at the synapse (e.g., NRXN1, NRXN3 [MIM 600567], etc.), chromatin modifiers and transcription factors (e.g., CHD8, EHMT1, SOX5, SATB2, FOXP1), and genes involved in known causes of intellectual disability such as FMR1 and CEP290 (MIM 610142). Although our gene-set enrichment analyses clearly indicate that the effects of dosage change at 16p11.2 include altered expression of some ASD-associated genes, individually most of these genes were detected at nominal significance that do not survive stringent correction thresholds. Our findings therefore warrant validation in much larger samples and relevant neurodevelopmental cell types, particularly because these data also revealed substantial enrichment for pathways previously implicated in ASD (e.g., cell adhesion, cadherin signaling, WNT signaling pathway, axon guidance, mTOR signaling, circadian rhythms).
In conclusion, CNV of 16p11.2 (or its equivalent segment in the mouse) results in strong, consistent effects on the expression of all genes within the CNV region and in altered expression of many genes outside the CNV, albeit at lower magnitude and statistical significance. Our data indicate that the altered expression of genes not located within the region of dosage change may be a consequence of multiple mechanisms: direct positional effects in cis; direct positional effects in trans by altering physical interactions among chromosomes; and/or indirect effects of altered pathways. Among the genes showing marked differential expression as a function of 16p11.2 copy number, there is significant enrichment for genes previously associated with ASD, indicating that 16p11.2 dosage could exert its influence on risk through critical pathways that are already known to play major roles in neurodevelopment and ASD. Consistent with DNA-based studies of common complex disorders, our data indicate that the effect sizes for alterations in gene expression associated with this genomic variation are relatively modest, yet capable of contributing to abnormal neurodevelopment. These data also suggest that carefully designed, large-scale transcriptome studies across multiple tissues and cell types hold great promise in elucidating the multiple contributing pathways that drive the pathogenic process in ASD.
Acknowledgments
We thank A. Mills for development of the mouse models and AGRE for providing biological materials. These studies were supported by the National Institute of Mental Health (MH095867 to M.E.T., R37 MH057881 to B.D. and K.R.), the Simons Foundation for Autism Research (M.E.T., J.F.G.), the Nancy Lurie Marks Family Foundation (M.E.T., J.F.G.), and the Brain and Behavorial Research Foundation (NARSAD; M.E.T.). We also acknowledge support from the Autism Genetic Resource Exchange (AGRE) and Autism Speaks (to J.F.G.). We gratefully acknowledge the resources provided by the AGRE consortium and the participating AGRE families. The Autism Genetic Resource Exchange (AGRE) is a program of Autism Speaks and is supported, in part, by grant 1U24MH081810 from the National Institute of Mental Health to Clara M. Lajonchere (PI).
Appendix A: Statistical Analysis of Differential Expression
Modeling Approaches
We used two different approaches to model gene expression as a function of the deletion or duplication. The first approach (hereafter referred to as reciprocal-Effect) consists of fitting a linear model regressing gene expression as a function of the number of gene copies within an individual. Based upon their genotype, individuals were scored as follows: 0 for wild-type or control (WT), −1 for deletion (Del), and 1 for duplication (Dup). The reciprocal-Effect approach provides a measure for assessing gene expression profiles for linear trends associated with deletion/duplication.
The second approach (hereafter referred to as aov-Effect) was to fit a factorial ANOVA with genotype and sex as factors. The model included both main effects and an interaction term. Pairwise differences between means and linear combinations of model parameters were used to evaluate the specific hypothesis of interest. All the analyses were carried out in an R environment.
Differential Expression Analysis of Mouse Data
To quantify gene expression, the counts of reads that map to the transcribed regions in the genome (based upon gene annotations from RefSeq65) are tabulated. The counts were generated with BEDTools38 using options compatible with the strand-specific sequencing library construction method used.
Differential expression of genes across samples for the count data was performed by generalized linear models (GLMs), a general statistical framework for count data.39,66,67 The distribution of counts arising from RNA-seq is assumed to follow a Poisson distribution when only technical variation is present and extensions to the Poisson model are necessary to account for biological variation. The negative binomial distribution is an extension of the Poisson that allows for overdispersion (greater variance) than a Poisson model, for which the variance is equal to the mean, and is recommended for RNA-seq analysis.64,68,69 The negative binomial can be formulated as a mixture of Poisson distributions in which the mixing distribution is Gamma
where the marginal distribution of Y is
If θ is known, then the estimation falls within the GLM framework and can be fit in R using the glm function and the family = negative.binomial(theta) option. θ can also be estimated with the glm.nb function from the MASS package, using an iterative weighted least-squares approach and fixing the dispersion viz. .41
For the reciprocal-Effect analysis, the model included CNV, sex, and the interaction CNV:sex as fixed effects. In addition, an offset variable containing the total counts over all genes for each sample was used to compensate for varying depth of sequencing across samples.
We fit the gene-by-gene models as follows:
-
•
Estimate θ for each gene with glm.nb and get the MLE estimate.
-
•
Assume θ known and using glm fit a negative binomial model.
-
•
The fixed effects for each gene in the reciprocal-Effects model genotype, sex, and their interaction.
-
•
The fixed effects for each gene in the aov-Effects model genotype, sex, and their interaction.
Differential Expression Analysis of Human Data
As previously mentioned for the mouse analysis, normalized counts were used as a measure of gene expression and two modeling approaches were utilized in analyzing the human data.
For reciprocal-Effect, a regression approach fitting gene expression (e.g., normalized counts) as a linear function of the number of copies of 16p11.2 regions within an individual, as described above. The reciprocal-Effect approach assesses gene expression profiles for linear trends associated with deletion/duplication. Because of the unequal number of observations across genotypes either by status or by sex in our family cohort, status-specific and sex-specific slopes and the three-way interactions were not fit. The null expectation is that gene expression is similar across all samples and therefore a common intercept was assumed for all samples.
For aov-Effect, a factorial ANOVA type approach was fit with genotype, sex, and status as factors. Because all factor level combinations were not present, a cell-means model for the fixed effects was used wherein each combination of genotype × sex × status was treated as an individual level and inferences for any specific factors were based on deriving contrasts.
Empirical p values were calculated for both approaches by permuting the normalized expression values (phenotypes) for a gene, across individuals, and refitting the model every time for that gene. Using a two-sided testing approach and taking the absolute value, the t statistics for the slope or the contrasts were used as the permutation test statistic and the empirical p values were estimated as the number of times the permutation t statistic exceeded the original t statistic. To determine the number of permutations for each, we used the p values from fitting the model as a guideline for a maximum of 106 runs for any given set. Specifically, we used the integer ceiling of (−log10(p value)+1) raised to the power 10.
Random Effects
The R package pedigreeMM42 was used for fitting both the reciprocal-Effect and the aov-Effect models. This package is a wrapper around the standard mixed model package lme4, which can be used to fit both linear mixed models (LMMs) and generalized linear mixed models (GLMMs).
A GLMM approach was used with the fixed effects structure as mentioned above. Because there is currently no simple approach to fit a negative binomial GLMM in R with a relationship matrix included, a modification of the Poisson GLMM, the Poisson-lognormal approach, was used. The random effects structure employed was
where the effect is the effect of the covariance among individuals based on the relationship matrix estimated from the pedigree, accounting for similarity in expression due to shared genetic background. For example, the relationship matrix for a nuclear family A consisting of two parents and their two children would look like:

The effect fits an individual-level random effects for each observation.70 This is equivalent to fitting a negative binomial model because marginally the variance is a quadratic function of the mean.67
Supplemental Data
Web Resources
The URLs for data presented herein are as follows:
AutismKB, http://autismkb.cbi.pku.edu.cn/
BioCarta, http://www.biocarta.com/
Cytoscape, http://www.cytoscape.org/
Enrichr, http://amp.pharm.mssm.edu/Enrichr/
Hi-C Data Browser, http://hic.umassmed.edu/heatmap/heatmap.php
Jackson Laboratory, 16p11.2 syntenic deletion mouse strain (B6129S-Del (7Slx1b-Sept1)), http://jaxmice.jax.org/strain/013128.html
Jackson Laboratory, 16p11.2 syntenic duplication mouse strain (B6129S-Dp(7Slx1b-Sept1) 5Aam/J, http://jaxmice.jax.org/strain/013129.html
MGI-Mouse Vertebrate Homology, http://www.informatics.jax.org/homology.shtml
National Database for Autism Research, Online Mendelian Inheritance in Man (OMIM), http://www.omim.org/
PANTHER, http://www.pantherdb.org/
SFARI Human Gene Module (accessed August 2013), https://gene.sfari.org/autdb/HG_Home.do
UCSC Genome Browser, http://genome.ucsc.edu
WGCNA, http://labs.genetics.ucla.edu/horvath/CoexpressionNetwork/Rpackages/WGCNA/
Accession Numbers
The RNA-seq data are available in the NIH-supported National Database for Autism Research (http://ndar.nih.gov/) in Study #343.
References
- 1.Autism and Development Disabilities Monitoring Network Surveillance Year 2008 Principal Investigators (2012). Prevalence of autism spectrum disorders–autism and developmental disabilities monitoring network, 14 sites, United States, 2008. Morbid. Mortal. Weekly Report Surveillance Summaries 61, 1–19. [PubMed]
- 2.Gu W., Zhang F., Lupski J.R. Mechanisms for human genomic rearrangements. Pathogenetics. 2008;1:4. doi: 10.1186/1755-8417-1-4. [DOI] [PMC free article] [PubMed] [Google Scholar]
- 3.Colnaghi R., Carpenter G., Volker M., O’Driscoll M. The consequences of structural genomic alterations in humans: genomic disorders, genomic instability and cancer. Semin. Cell Dev. Biol. 2011;22:875–885. doi: 10.1016/j.semcdb.2011.07.010. [DOI] [PubMed] [Google Scholar]
- 4.Sanders S.J., Murtha M.T., Gupta A.R., Murdoch J.D., Raubeson M.J., Willsey A.J., Ercan-Sencicek A.G., DiLullo N.M., Parikshak N.N., Stein J.L. De novo mutations revealed by whole-exome sequencing are strongly associated with autism. Nature. 2012;485:237–241. doi: 10.1038/nature10945. [DOI] [PMC free article] [PubMed] [Google Scholar]
- 5.Marshall C.R., Noor A., Vincent J.B., Lionel A.C., Feuk L., Skaug J., Shago M., Moessner R., Pinto D., Ren Y. Structural variation of chromosomes in autism spectrum disorder. Am. J. Hum. Genet. 2008;82:477–488. doi: 10.1016/j.ajhg.2007.12.009. [DOI] [PMC free article] [PubMed] [Google Scholar]
- 6.Pinto D., Pagnamenta A.T., Klei L., Anney R., Merico D., Regan R., Conroy J., Magalhaes T.R., Correia C., Abrahams B.S. Functional impact of global rare copy number variation in autism spectrum disorders. Nature. 2010;466:368–372. doi: 10.1038/nature09146. [DOI] [PMC free article] [PubMed] [Google Scholar]
- 7.Sanders S.J., Ercan-Sencicek A.G., Hus V., Luo R., Murtha M.T., Moreno-De-Luca D., Chu S.H., Moreau M.P., Gupta A.R., Thomson S.A. Multiple recurrent de novo CNVs, including duplications of the 7q11.23 Williams syndrome region, are strongly associated with autism. Neuron. 2011;70:863–885. doi: 10.1016/j.neuron.2011.05.002. [DOI] [PMC free article] [PubMed] [Google Scholar]
- 8.Hodge J.C., Mitchell E., Pillalamarri V., Toler T.L., Bartel F., Kearney H.M., Zou Y.S., Tan W.H., Hanscom C., Kirmani S. Disruption of MBD5 contributes to a spectrum of psychopathology and neurodevelopmental abnormalities. Mol. Psychiatry. 2014;19:368–379. doi: 10.1038/mp.2013.42. [DOI] [PMC free article] [PubMed] [Google Scholar]
- 9.Talkowski M.E., Mullegama S.V., Rosenfeld J.A., van Bon B.W.M., Shen Y., Repnikova E.A., Gastier-Foster J., Thrush D.L., Kathiresan S., Ruderfer D.M. Assessment of 2q23.1 microdeletion syndrome implicates MBD5 as a single causal locus of intellectual disability, epilepsy, and autism spectrum disorder. Am. J. Hum. Genet. 2011;89:551–563. doi: 10.1016/j.ajhg.2011.09.011. [DOI] [PMC free article] [PubMed] [Google Scholar]
- 10.Talkowski M.E., Rosenfeld J.A., Blumenthal I., Pillalamarri V., Chiang C., Heilbut A., Ernst C., Hanscom C., Rossin E., Lindgren A.M. Sequencing chromosomal abnormalities reveals neurodevelopmental loci that confer risk across diagnostic boundaries. Cell. 2012;149:525–537. doi: 10.1016/j.cell.2012.03.028. [DOI] [PMC free article] [PubMed] [Google Scholar]
- 11.Williams S.R., Mullegama S.V., Rosenfeld J.A., Dagli A.I., Hatchwell E., Allen W.P., Williams C.A., Elsea S.H. Haploinsufficiency of MBD5 associated with a syndrome involving microcephaly, intellectual disabilities, severe speech impairment, and seizures. Eur. J. Hum. Genet. 2010;18:436–441. doi: 10.1038/ejhg.2009.199. [DOI] [PMC free article] [PubMed] [Google Scholar]
- 12.Kleefstra T., Brunner H.G., Amiel J., Oudakker A.R., Nillesen W.M., Magee A., Geneviève D., Cormier-Daire V., van Esch H., Fryns J.-P. Loss-of-function mutations in euchromatin histone methyl transferase 1 (EHMT1) cause the 9q34 subtelomeric deletion syndrome. Am. J. Hum. Genet. 2006;79:370–377. doi: 10.1086/505693. [DOI] [PMC free article] [PubMed] [Google Scholar]
- 13.Kleefstra T., Kramer J.M., Neveling K., Willemsen M.H., Koemans T.S., Vissers L.E.L.M., Wissink-Lindhout W., Fenckova M., van den Akker W.M.R., Kasri N.N. Disruption of an EHMT1-associated chromatin-modification module causes intellectual disability. Am. J. Hum. Genet. 2012;91:73–82. doi: 10.1016/j.ajhg.2012.05.003. [DOI] [PMC free article] [PubMed] [Google Scholar]
- 14.Girirajan S., Johnson R.L., Tassone F., Balciuniene J., Katiyar N., Fox K., Baker C., Srikanth A., Yeoh K.H., Khoo S.J. Global increases in both common and rare copy number load associated with autism. Hum. Mol. Genet. 2013;22:2870–2880. doi: 10.1093/hmg/ddt136. [DOI] [PMC free article] [PubMed] [Google Scholar]
- 15.Cooper G.M., Coe B.P., Girirajan S., Rosenfeld J.A., Vu T.H., Baker C., Williams C., Stalker H., Hamid R., Hannig V. A copy number variation morbidity map of developmental delay. Nat. Genet. 2011;43:838–846. doi: 10.1038/ng.909. [DOI] [PMC free article] [PubMed] [Google Scholar]
- 16.Iossifov I., Ronemus M., Levy D., Wang Z., Hakker I., Rosenbaum J., Yamrom B., Lee Y.H., Narzisi G., Leotta A. De novo gene disruptions in children on the autistic spectrum. Neuron. 2012;74:285–299. doi: 10.1016/j.neuron.2012.04.009. [DOI] [PMC free article] [PubMed] [Google Scholar]
- 17.Neale B.M., Kou Y., Liu L., Ma’ayan A., Samocha K.E., Sabo A., Lin C.-F., Stevens C., Wang L.-S., Makarov V. Patterns and rates of exonic de novo mutations in autism spectrum disorders. Nature. 2012;485:242–245. doi: 10.1038/nature11011. [DOI] [PMC free article] [PubMed] [Google Scholar]
- 18.O’Roak B.J., Vives L., Girirajan S., Karakoc E., Krumm N., Coe B.P., Levy R., Ko A., Lee C., Smith J.D. Sporadic autism exomes reveal a highly interconnected protein network of de novo mutations. Nature. 2012;485:246–250. doi: 10.1038/nature10989. [DOI] [PMC free article] [PubMed] [Google Scholar]
- 19.Cook E.H., Jr., Scherer S.W. Copy-number variations associated with neuropsychiatric conditions. Nature. 2008;455:919–923. doi: 10.1038/nature07458. [DOI] [PubMed] [Google Scholar]
- 20.Ronan J.L., Wu W., Crabtree G.R. From neural development to cognition: unexpected roles for chromatin. Nat. Rev. Genet. 2013;14:347–359. doi: 10.1038/nrg3413. [DOI] [PMC free article] [PubMed] [Google Scholar]
- 21.Lintas C., Sacco R., Persico A.M. Genome-wide expression studies in autism spectrum disorder, Rett syndrome, and Down syndrome. Neurobiol. Dis. 2012;45:57–68. doi: 10.1016/j.nbd.2010.11.010. [DOI] [PubMed] [Google Scholar]
- 22.Voineagu I. Gene expression studies in autism: moving from the genome to the transcriptome and beyond. Neurobiol. Dis. 2012;45:69–75. doi: 10.1016/j.nbd.2011.07.017. [DOI] [PubMed] [Google Scholar]
- 23.Voineagu I., Wang X., Johnston P., Lowe J.K., Tian Y., Horvath S., Mill J., Cantor R.M., Blencowe B.J., Geschwind D.H. Transcriptomic analysis of autistic brain reveals convergent molecular pathology. Nature. 2011;474:380–384. doi: 10.1038/nature10110. [DOI] [PMC free article] [PubMed] [Google Scholar]
- 24.Mullegama S.V., Rosenfeld J.A., Orellana C., van Bon B.W.M., Halbach S., Repnikova E.A., Brick L., Li C., Dupuis L., Rosello M. Reciprocal deletion and duplication at 2q23.1 indicates a role for MBD5 in autism spectrum disorder. Eur. J. Hum. Genet. 2014;22:57–63. doi: 10.1038/ejhg.2013.67. [DOI] [PMC free article] [PubMed] [Google Scholar]
- 25.Weiss L.A., Shen Y., Korn J.M., Arking D.E., Miller D.T., Fossdal R., Saemundsen E., Stefansson H., Ferreira M.A.R., Green T., Autism Consortium Association between microdeletion and microduplication at 16p11.2 and autism. N. Engl. J. Med. 2008;358:667–675. doi: 10.1056/NEJMoa075974. [DOI] [PubMed] [Google Scholar]
- 26.Jacquemont S., Reymond A., Zufferey F., Harewood L., Walters R.G., Kutalik Z., Martinet D., Shen Y., Valsesia A., Beckmann N.D. Mirror extreme BMI phenotypes associated with gene dosage at the chromosome 16p11.2 locus. Nature. 2011;478:97–102. doi: 10.1038/nature10406. [DOI] [PMC free article] [PubMed] [Google Scholar]
- 27.Rosenfeld J.A., Coe B.P., Eichler E.E., Cuckle H., Shaffer L.G. Estimates of penetrance for recurrent pathogenic copy-number variations. Genet. Med. 2013;15:478–481. doi: 10.1038/gim.2012.164. [DOI] [PMC free article] [PubMed] [Google Scholar]
- 28.Golzio C., Willer J., Talkowski M.E., Oh E.C., Taniguchi Y., Jacquemont S., Reymond A., Sun M., Sawa A., Gusella J.F. KCTD13 is a major driver of mirrored neuroanatomical phenotypes of the 16p11.2 copy number variant. Nature. 2012;485:363–367. doi: 10.1038/nature11091. [DOI] [PMC free article] [PubMed] [Google Scholar]
- 29.Blaker-Lee A., Gupta S., McCammon J.M., De Rienzo G., Sive H. Zebrafish homologs of genes within 16p11.2, a genomic region associated with brain disorders, are active during brain development, and include two deletion dosage sensor genes. Dis. Model. Mech. 2012;5:834–851. doi: 10.1242/dmm.009944. [DOI] [PMC free article] [PubMed] [Google Scholar]
- 30.Horev G., Ellegood J., Lerch J.P., Son Y.E., Muthuswamy L., Vogel H., Krieger A.M., Buja A., Henkelman R.M., Wigler M., Mills A.A. Dosage-dependent phenotypes in models of 16p11.2 lesions found in autism. Proc. Natl. Acad. Sci. USA. 2011;108:17076–17081. doi: 10.1073/pnas.1114042108. [DOI] [PMC free article] [PubMed] [Google Scholar]
- 31.Levin J.Z., Yassour M., Adiconis X., Nusbaum C., Thompson D.A., Friedman N., Gnirke A., Regev A. Comprehensive comparative analysis of strand-specific RNA sequencing methods. Nat. Methods. 2010;7:709–715. doi: 10.1038/nmeth.1491. [DOI] [PMC free article] [PubMed] [Google Scholar]
- 32.Parkhomchuk D., Borodina T., Amstislavskiy V., Banaru M., Hallen L., Krobitsch S., Lehrach H., Soldatov A. Transcriptome analysis by strand-specific sequencing of complementary DNA. Nucleic Acids Res. 2009;37 doi: 10.1093/nar/gkp596. e123–e123. [DOI] [PMC free article] [PubMed] [Google Scholar]
- 33.Zhong S., Joung J.-G., Zheng Y., Chen Y.R., Liu B., Shao Y., Xiang J.Z., Fei Z., Giovannoni J.J. High-throughput illumina strand-specific RNA sequencing library preparation. Cold Spring Harb. Protoc. 2011;2011:940–949. doi: 10.1101/pdb.prot5652. [DOI] [PubMed] [Google Scholar]
- 34.(2011). Standards, Guidelines and Best Practices for RNA-Seq. The ENCODE Consortium, http://encodeproject.org/ENCODE/protocols/dataStandards/ENCODE_RNAseq_Standards_V1.0.pdf.
- 35.Jiang L., Schlesinger F., Davis C.A., Zhang Y., Li R., Salit M., Gingeras T.R., Oliver B. Synthetic spike-in standards for RNA-seq experiments. Genome Res. 2011;21:1543–1551. doi: 10.1101/gr.121095.111. [DOI] [PMC free article] [PubMed] [Google Scholar]
- 36.Andrews, S. (2010). FASTQC. A quality control tool for high throughput sequence data. http://www.bioinformatics.babraham.ac.uk/projects/fastqc.
- 37.DeLuca D.S., Levin J.Z., Sivachenko A., Fennell T., Nazaire M.-D., Williams C., Reich M., Winckler W., Getz G. RNA-SeQC: RNA-seq metrics for quality control and process optimization. Bioinformatics. 2012;28:1530–1532. doi: 10.1093/bioinformatics/bts196. [DOI] [PMC free article] [PubMed] [Google Scholar]
- 38.Quinlan A.R., Hall I.M. BEDTools: a flexible suite of utilities for comparing genomic features. Bioinformatics. 2010;26:841–842. doi: 10.1093/bioinformatics/btq033. [DOI] [PMC free article] [PubMed] [Google Scholar]
- 39.Lund S.P., Nettleton D., McCarthy D.J., Smyth G.K. Detecting differential expression in RNA-sequence data using quasi-likelihood with shrunken dispersion estimates. Stat. Appl. Genet. Mol. Biol. 2012;11:11. doi: 10.1515/1544-6115.1826. [DOI] [PubMed] [Google Scholar]
- 40.Soneson C., Delorenzi M. A comparison of methods for differential expression analysis of RNA-seq data. BMC Bioinformatics. 2013;14:91. doi: 10.1186/1471-2105-14-91. [DOI] [PMC free article] [PubMed] [Google Scholar]
- 41.Venables W.N., Ripley B.D. Springer Verlag; New York: 2002. Modern Applied Statistics with S. [Google Scholar]
- 42.Vazquez A.I., Bates D.M., Rosa G.J.M., Gianola D., Weigel K.A. Technical note: an R package for fitting generalized linear mixed models in animal breeding. J. Anim. Sci. 2010;88:497–504. doi: 10.2527/jas.2009-1952. [DOI] [PubMed] [Google Scholar]
- 43.Langfelder P., Horvath S. WGCNA: an R package for weighted correlation network analysis. BMC Bioinformatics. 2008;9:559. doi: 10.1186/1471-2105-9-559. [DOI] [PMC free article] [PubMed] [Google Scholar]
- 44.Langfelder P., Horvath S. Fast R Functions for Robust Correlations and Hierarchical Clustering. J. Stat. Softw. 2012;46:46. [PMC free article] [PubMed] [Google Scholar]
- 45.Rossin E.J., Lage K., Raychaudhuri S., Xavier R.J., Tatar D., Benita Y., Cotsapas C., Daly M.J., International Inflammatory Bowel Disease Genetics Constortium Proteins encoded in genomic regions associated with immune-mediated disease physically interact and suggest underlying biology. PLoS Genet. 2011;7:e1001273. doi: 10.1371/journal.pgen.1001273. [DOI] [PMC free article] [PubMed] [Google Scholar]
- 46.Kanehisa M., Goto S. KEGG: kyoto encyclopedia of genes and genomes. Nucleic Acids Res. 2000;28:27–30. doi: 10.1093/nar/28.1.27. [DOI] [PMC free article] [PubMed] [Google Scholar]
- 47.Kanehisa M., Goto S., Sato Y., Furumichi M., Tanabe M. KEGG for integration and interpretation of large-scale molecular data sets. Nucleic Acids Res. 2012;40(Database issue):D109–D114. doi: 10.1093/nar/gkr988. [DOI] [PMC free article] [PubMed] [Google Scholar]
- 48.Mi H., Lazareva-Ulitsky B., Loo R., Kejariwal A., Vandergriff J., Rabkin S., Guo N., Muruganujan A., Doremieux O., Campbell M.J. The PANTHER database of protein families, subfamilies, functions and pathways. Nucleic Acids Res. 2005;33(Database issue):D284–D288. doi: 10.1093/nar/gki078. [DOI] [PMC free article] [PubMed] [Google Scholar]
- 49.Matthews L., Gopinath G., Gillespie M., Caudy M., Croft D., de Bono B., Garapati P., Hemish J., Hermjakob H., Jassal B. Reactome knowledgebase of human biological pathways and processes. Nucleic Acids Res. 2009;37(Database issue):D619–D622. doi: 10.1093/nar/gkn863. [DOI] [PMC free article] [PubMed] [Google Scholar]
- 50.Huang W., Sherman B.T., Lempicki R.A. Systematic and integrative analysis of large gene lists using DAVID bioinformatics resources. Nat. Protoc. 2009;4:44–57. doi: 10.1038/nprot.2008.211. [DOI] [PubMed] [Google Scholar]
- 51.Supek F., Bošnjak M., Škunca N., Šmuc T. REVIGO summarizes and visualizes long lists of gene ontology terms. PLoS ONE. 2011;6:e21800. doi: 10.1371/journal.pone.0021800. [DOI] [PMC free article] [PubMed] [Google Scholar]
- 52.Chen E.Y., Tan C.M., Kou Y., Duan Q., Wang Z., Meirelles G.V., Clark N.R., Ma’ayan A. Enrichr: interactive and collaborative HTML5 gene list enrichment analysis tool. BMC Bioinformatics. 2013;14:128. doi: 10.1186/1471-2105-14-128. [DOI] [PMC free article] [PubMed] [Google Scholar]
- 53.Subramanian A., Tamayo P., Mootha V.K., Mukherjee S., Ebert B.L., Gillette M.A., Paulovich A., Pomeroy S.L., Golub T.R., Lander E.S., Mesirov J.P. Gene set enrichment analysis: a knowledge-based approach for interpreting genome-wide expression profiles. Proc. Natl. Acad. Sci. USA. 2005;102:15545–15550. doi: 10.1073/pnas.0506580102. [DOI] [PMC free article] [PubMed] [Google Scholar]
- 54.Shannon P., Markiel A., Ozier O., Baliga N.S., Wang J.T., Ramage D., Amin N., Schwikowski B., Ideker T. Cytoscape: a software environment for integrated models of biomolecular interaction networks. Genome Res. 2003;13:2498–2504. doi: 10.1101/gr.1239303. [DOI] [PMC free article] [PubMed] [Google Scholar]
- 55.Abrahams B.S., Arking D.E., Campbell D.B., Mefford H.C., Morrow E.M., Weiss L.A., Menashe I., Wadkins T., Banerjee-Basu S., Packer A. SFARI Gene 2.0: a community-driven knowledgebase for the autism spectrum disorders (ASDs) Mol. Autism. 2013;4:36. doi: 10.1186/2040-2392-4-36. [DOI] [PMC free article] [PubMed] [Google Scholar]
- 56.Xu L.M., Li J.R., Huang Y., Zhao M., Tang X., Wei L. AutismKB: an evidence-based knowledgebase of autism genetics. Nucleic Acids Res. 2012;40(Database issue):D1016–D1022. doi: 10.1093/nar/gkr1145. [DOI] [PMC free article] [PubMed] [Google Scholar]
- 57.Luo R., Sanders S.J., Tian Y., Voineagu I., Huang N., Chu S.H., Klei L., Cai C., Ou J., Lowe J.K. Genome-wide transcriptome profiling reveals the functional impact of rare de novo and recurrent CNVs in autism spectrum disorders. Am. J. Hum. Genet. 2012;91:38–55. doi: 10.1016/j.ajhg.2012.05.011. [DOI] [PMC free article] [PubMed] [Google Scholar]
- 58.Barge-Schaapveld D.Q., Maas S.M., Polstra A., Knegt L.C., Hennekam R.C. The atypical 16p11.2 deletion: a not so atypical microdeletion syndrome? Am. J. Med. Genet. A. 2011;155A:1066–1072. doi: 10.1002/ajmg.a.33991. [DOI] [PubMed] [Google Scholar]
- 59.Harewood L., Schütz F., Boyle S., Perry P., Delorenzi M., Bickmore W.A., Reymond A. The effect of translocation-induced nuclear reorganization on gene expression. Genome Res. 2010;20:554–564. doi: 10.1101/gr.103622.109. [DOI] [PMC free article] [PubMed] [Google Scholar]
- 60.Zeitz M.J., Lerner P.P., Ay F., Van Nostrand E., Heidmann J.D., Noble W.S., Hoffman A.R. Implications of COMT long-range interactions on the phenotypic variability of 22q11.2 deletion syndrome. Nucleus. 2013;4:487–493. doi: 10.4161/nucl.27364. [DOI] [PMC free article] [PubMed] [Google Scholar]
- 61.Berry R., Harewood L., Pei L., Fisher M., Brownstein D., Ross A., Alaynick W.A., Moss J., Hastie N.D., Hohenstein P. Esrrg functions in early branch generation of the ureteric bud and is essential for normal development of the renal papilla. Hum. Mol. Genet. 2011;20:917–926. doi: 10.1093/hmg/ddq530. [DOI] [PMC free article] [PubMed] [Google Scholar]
- 62.Willsey A.J., Sanders S.J., Li M., Dong S., Tebbenkamp A.T., Muhle R.A., Reilly S.K., Lin L., Fertuzinhos S., Miller J.A. Coexpression networks implicate human midfetal deep cortical projection neurons in the pathogenesis of autism. Cell. 2013;155:997–1007. doi: 10.1016/j.cell.2013.10.020. [DOI] [PMC free article] [PubMed] [Google Scholar]
- 63.Lieberman-Aiden E., van Berkum N.L., Williams L., Imakaev M., Ragoczy T., Telling A., Amit I., Lajoie B.R., Sabo P.J., Dorschner M.O. Comprehensive mapping of long-range interactions reveals folding principles of the human genome. Science. 2009;326:289–293. doi: 10.1126/science.1181369. [DOI] [PMC free article] [PubMed] [Google Scholar]
- 64.Young M., McCarthy D., Wakefield M., Smyth G., Oshlack A., Robinson M. Differential expression for RNA sequencing (RNA-seq) data: mapping, summarization, statistical analysis, and experimental design. In: Rodríguez-Ezpeleta M.H.N., Aransay A.M., editors. Bioinformatics for High Throughput Sequencing. Springer New York; New York: 2012. pp. 169–190. [Google Scholar]
- 65.Pruitt K.D., Brown G.R., Hiatt S.M., Thibaud-Nissen F., Astashyn A., Ermolaeva O., Farrell C.M., Hart J., Landrum M.J., McGarvey K.M. RefSeq: an update on mammalian reference sequences. Nucleic Acids Res. 2014;42(Database issue):D756–D763. doi: 10.1093/nar/gkt1114. [DOI] [PMC free article] [PubMed] [Google Scholar]
- 66.McCullagh P., Nelder J.A. Chapman and Hall; London: 1989. Generalized linear models. [Google Scholar]
- 67.Agresti A. Wiley-Interscience; New York: 2002. Categorical data analysis. [Google Scholar]
- 68.Di Y., Schafer D.W., Cumbie J.S., Chang J.H. The NBP negative binomial model for assessing differential gene expression from RNA-seq. Stat. Appl. Genet. Mol. Biol. 2011;10:1–28. [Google Scholar]
- 69.Anders S., Huber W. Differential expression analysis for sequence count data. Genome Biol. 2010;11:R106. doi: 10.1186/gb-2010-11-10-r106. [DOI] [PMC free article] [PubMed] [Google Scholar]
- 70.Atkins D.C., Baldwin S.A., Zheng C., Gallop R.J., Neighbors C. A tutorial on count regression and zero-altered count models for longitudinal substance use data. Psychol. Addict. Behav. 2013;27:166–177. doi: 10.1037/a0029508. [DOI] [PMC free article] [PubMed] [Google Scholar]
Associated Data
This section collects any data citations, data availability statements, or supplementary materials included in this article.