

Abstract
A first analysis of the genome sequence of the common marmoset (Callithrix jacchus), assembled using traditional Sanger methods and Ensembl annotation, has permitted genomic comparison with apes and old world monkeys and the identification of specific molecular features that may contribute to the unique biology of this diminutive primate. The common marmoset has a rapid reproductive capacity partly due to prevalence of dizygotic twins. Remarkably, these twins share placental circulation and exchange hematopoietic stem cells in utero, resulting in adults that are hematopoietic chimeras.
We observed positive selection or non-synonymous substitutions for genes encoding growth hormone/insulin-like growth factor (growth pathways), respiratory complex I (metabolic pathways), immunobiology, and proteases (reproductive and immunity pathways). In addition, both protein-coding and microRNA genes related to reproduction exhibit rapid sequence evolution. This New World monkey genome sequence enables significantly increased power for comparative analyses among available primate genomes and facilitates biomedical research application.
Apparently unique among mammals, marmosets routinely produce dizygotic twins that exchange hematopoietic stem cells in utero, a process that leads to lifelong chimerism1,2. As a result of this placental exchange, the blood of adult marmosets normally contains a substantial proportion of leukocytes that are not derived from the inherited germline of the sampled individual but rather were acquired in utero from its co-twin. In addition, marmosets (subfamily Callitrichinae) and other callitrichines are small in body size as a result of natural selection for miniaturization. This reduced body size may be related to their gestation of multiples and to their social system, also unique among primates3–5. These animals display a cooperative breeding system in which generally only one pair of adults in any social group are active breeders. Other adult group members participate in the care and feeding of infants, but do not reproduce. This alloparental care is rare among anthropoid primates, with the clear exception of humans. The evolutionary appearance of major new groups (e.g. superfamilies) of primates has generally been characterized by progressive increases in body size and lifespan, reductions in overall reproductive rate, and increases in maternal investment in the rearing of individual offspring. In contrast, marmosets and their callitrichine relatives have undergone secondary reduction in body size from a larger platyrrhine ancestor6, and have evolved a reproductive and social system in which the dominant male and female monopolize breeding but benefit from alloparental care provided to their offspring by multiple group members.
Here we report an analysis of the complete genome sequence for this first New World monkey (NWM) to be sequenced (Supplementary Note). Our results include comparisons of this platyrrhine genome with the available catarrhine (human, other hominoid and Old World monkey (OWM)) genomes that reveal previously undetected aspects of catarrhine genome evolution, including positive selection in specific genes and significant conservation of previously unidentified segments of noncoding DNA. The marmoset genome displays a number of unique features, such as rapid changes in microRNAs (miRNAs) expressed in placenta, and non-synonymous changes in protein-coding genes involved in reproductive physiology, which may be related to the frequent twinning and/or chimerism.
The genetics of twinning
WFIKKN1, a multidomain protease inhibitor that binds growth factors and BMPs7, has non-synonymous changes found exclusively in common marmosets and all other tested callitrichine species that twin. In the one callitrichine species that does not produce twins (Callimico), one change has reverted back to the ancestral (non-twinning) primate sequence. GDF9 and BMP15, genes associated with twinning in sheep and humans, also exhibit non-synonymous changes in callitrichines.
Genetics of body size
We detected positive selection in five growth hormone/insulin-like growth factor (GH-IGF) axis genes with potential roles in diminutive body size and eight genes in the nuclear-encoded subunits of the respiratory complex I that affect metabolic rates and body temperature, adaptations associated with challenges of small body size.
Novel microRNA loci
Marmosets exhibit a significant number of unanticipated differences in miRNAs and their targets, including 321 novel miRNA loci. Two large clusters of miRNAs expressed in placenta show substantial sequence divergence compared with other primates and are potentially involved in marmoset reproductive traits. We identified considerable evolutionary change in the protein coding genes targeted by the highly conserved let-7 family and significant co-evolution of the rapidly evolving Chr. 22 miRNA cluster and their targets.
Novel functional elements specific to primates
The marmoset genome provides unprecedented statistical power to identify sequence constraint among primates, facilitating discovery of novel genomic regions underlying primate phenotypic evolution. The 23,849 regions that exhibit significant sequence constraint among primates but not in non-primate mammals are overwhelmingly noncoding, disproportionately associated with genes involved in neurodevelopment and retroviral suppression, and frequently overlap transposable elements.
Novel detection of positive selection in human, ape and OWM lineages
For seven genes, we detected positive selection on the branch leading to Catarrhini. Five were previously unidentified, including genes involved in immunobiology and reproduction (Table 1).
Table 1.
Gene Ontology (GO) Categories Enriched for Positively Selected Genes.
| GOa | Description | Genes | Excessd | Adjusted | |||
|---|---|---|---|---|---|---|---|
| PSGb | Totalc | P-value (MWU) | P-value (Holm) | P-value (FET) | |||
| 0005576 | extracellular region | 150 | 1954 | 1.3 | 3.24E-15 | 9.80E-12 | 3.86E-17 |
| 0005615 | extracellular space | 63 | 429 | 2.4 | 2.52E-08 | 7.61E-05 | 1.31E-08 |
| 0005747 | mitochondrial respiratory chain complex I | 8 | 14 | 9.4 | 1.81E-07 | 5.47E-04 | 2.72E-05 |
| 0006952 | defense response | 54 | 324 | 2.7 | 2.19E-06 | 6.59E-03 | 3.38E-09 |
| 0004872 | receptor activity | 103 | 866 | 2.0 | 3.42E-06 | 1.03E-02 | 1.05E-08 |
| 0007606 | sensory perception of chemical stimulus | 20 | 136 | 2.4 | 5.82E-06 | 1.75E-02 | 1.26E-03 |
| 0030246 | carbohydrate binding | 29 | 203 | 2.3 | 6.81E-06 | 2.05E-02 | 1.78E-04 |
| 0006954 | inflammatory response | 36 | 181 | 3.3 | 8.39E-06 | 2.52E-02 | 3.31E-08 |
| 0004984 | olfactory receptor activity | 16 | 107 | 2.5 | 9.88E-06 | 2.97E-02 | 3.21E-03 |
| 0009611 | response to wounding | 53 | 332 | 2.6 | 2.93E-05 | 8.79E-02 | 1.73E-08 |
| 0006955 | immune response | 41 | 295 | 2.3 | 3.18E-05 | 9.53E-02 | 1.57E-05 |
GO category number,
positively selected genes (PSG) identified with a threshold of P<0.05,
total genes in the GO category,
fold enrichment of PSGs over background. Enriched GO categories were identified by Mann-Whitney U-test (MWU), nominal P-value adjusted for multiple testing by Holm correction (Holm), and Fisher’s exact test (FET) using all genes with nominal P<0.05 in marmoset lineage likelihood ratio test. Note that the results of MWU may also be affected by relaxation of constraint, while FET considers only genes identified as under positive selection.
Results
Genome Assembly and Features
The 2.26 Gb genome of a female marmoset (#186/17066) assembled with Sanger read data (6x) and a whole genome shotgun (WGS) strategy (Supplementary Tables 1–4, Figure 1) represents ~90% of the marmoset genome. By all available measures the chromosomal sequences have high nucleotide and structural accuracy (Contig N50 29 kb, Scaffold N50 6.7 Mb, Supplementary Notes) and provide a suitable template for initial analysis.
Given the inherent genetic chimerism in this species, blood DNA contains sequences from the germline of the sampled individual and also her male co-twin. We took advantage of the sex-difference in the co-twins to estimate the proportion of reads originating from the co-twin (see Supplementary Tables 5–6, Figure 2, Note). These analyses indicate that 10% of the reads in the reference genome dataset are derived from the co-twin.
Figure 2. Gains and Losses of let-7 Regulated Genes.
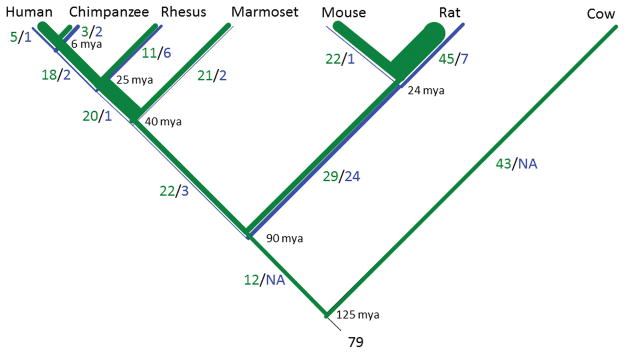
The conserved let-7 miRNA targets variable numbers of genes. Let-7 targets gains (in green) and losses (in blue) mapped to the phylogenetic tree of the analyzed species, line thickness indicates the rate of gain or loss. Gains and losses that occurred twice on independent lineages were omitted. Gains exceed losses on each branch of the tree, and the total gained (196) is four times the losses (49). Primate lineage changes (gains plus losses) exceed non-primate lineage changes (except for the branch leading to rat after divergence from mouse).
We estimated the amount and size of marmoset segmental duplications using two computational methods, WGAC8 and WSSD9. The assembly based duplications add a total of 138 Mb of nonredundant sequences (4.7% of the whole genome), slightly less than observed in human or chimpanzee (~5%)10–12 but more than orangutan (3.8%)13 where specific collapses in the released assembly version might explain this anomaly. See Supplementary Figure 3, 4, Tables 7–10 and Note.
For segmental duplications >10 kb with >94% sequence identity (Supplementary Table 8) we compared the two independent methods to measure artifactual duplications and mistaken assembly collapses. Both methods identified a total of 18 Mb of duplications, while 26 Mb were possible artifactual duplications and 53 Mb were possible collapses. To validate the methods we tested 97 clones by FISH mapping to marmoset chromosomes (see Supplementary Table 9). Both methods successfully identify segmentally duplicated regions and unlike previous studies, WGAC seems better suited than WSSD to detect duplication in marmoset. The degree to which this is due to the chimeric nature of the individual sequenced is not clear, though the chimerism is certainly a contributing factor.
The overall repeat composition of the marmoset genome is similar to other sequenced primate genomes10,12–14, containing ~1.1 million Alu elements, ~ 660,000 of which are full-length. However, in the recent past, Alu retrotransposition appears to be somewhat slower in marmosets than in humans and rhesus macaques (Supplementary Note).
Constrained sequence evolution indicates natural selection, and therefore implies conserved function. By extension, lineage-specific constraint indicates lineage-specific function15,16. Using the marmoset we detected 23,849 elements constrained in anthropoid primates but not in non-primate mammals17 (Supplementary Note). These anthropoid-specific constrained (ASC) sequences potentially drove primate phenotypic evolution, and are abundant in non-coding regions (e.g. upstream of SNTG1) (Supplementary Figures 5a, 5b) though coding exons are also represented (e.g. PGBD3). Annotated transposable elements contributed 46% of ASC basepairs. We validated the enhancer activity of six (of eight tested) elements in human embryonic stem cells (Supplementary Figure 5c, Table 11), and showed that their mouse orthologs had little or no functional activity. This dataset highlights specific loci that acquired new functional roles in the primate lineage, and potentially reveals molecular mechanisms underlying unique primate traits.
Gene Content and Gene Families
The Ensembl gene set18 (Supplementary Note) of 21,168 genes (44,973 transcripts) included 219 genes with marmoset protein support and 15,706 genes without marmoset protein evidence but with human protein evidence. The remaining 5,243 genes had transcripts supported by protein data from other sources (Supplementary Figures 6g, 6h).
A phylogenetic framework including four other primates, two rodents and three Laurasiatheria, showed 429 primate-specific gene families, among which few were present only in marmoset (Supplementary Figure 7, Tables 12–19, Note). More than half of these families (221/429) are indeed absent in marmoset, suggesting that they emerged after the catarrhine-platyrrhine divergence. In addition, many families are absent in rhesus macaque, and thus almost half are apparently unique to apes.
Our comparative analysis found surprising changes in the miRNA repertoir and the mRNA targets that they regulate. We identified 777 mature miRNAs (mapping to 1,165 hairpin precursor miRNAs) (Supplementary Table 20). Most were confirmed through expression studies (582, 75%) (Supplementary Note) and conserved in primates (~55–58%). Many (321 miRNAs mapping to 477 hairpins) are novel (not found in any other species to date). These include miRNAs exclusive to marmoset, miRNAs exclusive to Platyrrhini, and conserved miRNAs that are yet to be discovered in other species. The two largest marmoset miRNA clusters (Chr. 22, Chr. X) are expanded in number compared to human (112 vs. 49 human Chr. 22 hairpins and 40 vs. 15 human Chr. X hairpins) (Supplementary Table 22) and diverged in sequence. Less than 3% of Chr.22 and 8% of the Chr. X miRNAs are conserved across primate (Supplementary Table 22), and most exhibit at least one nucleotide modification in the 5′-seed region (83% of Chr. 22, 78% of Chr. X) compared to human (Supplemental Tables 20, 22, 23, 29). The rapidly evolving Chr. 22 and Chr. X clusters dominate the miRNA expression in marmoset placenta whereas the marmoset brain exhibits a more diverse miRNA expression pattern (Supplementary Figure 9, Tables 30–32). In contrast, some families (e.g. let-7) are completely conserved in all five primates (Supplementary Figure 8).
Changes in the miRNA seed region are expected to correspond to changes in the genes they regulate unless the miRNAs and their mRNA targets have co-evolved. Comparing the annotated genes containing predicted let-7 target sequences (Figure 1, Supplementary Note), we found 165 common to human and marmoset, 44 unique to marmoset and 64 unique to human. Despite caveats related to differences in assembly and annotation qualities, it is striking that less than half of the targets for this highly conserved family are shared between marmoset and human (Supplemental Table 34), a number similar to non-euarchontoglires (dog, horse and cow). A phylogenetic analysis of these changes shows that let-7 targets have evolved rapidly in primates compared to other species (Figure 2). The pattern of miRNA:mRNA target evolution differs among the three described miRNA families and even between the two rapidly evolving families (Supplementary Tables 33–37). In the Chr. X cluster, as expected, fewer than 50% of the target sequences are shared between marmosets and humans (Supplementary Table 35). In contrast, in the Chr. 22 cluster 84% of the targets are shared (Supplementary Table 36), implying significant co-evolution of miRNAs and their targets in the Chr. 22 cluster but not in the Chr. X cluster.
Figure 1. Predicted let-7 Regulated Genes (miRNA targets).
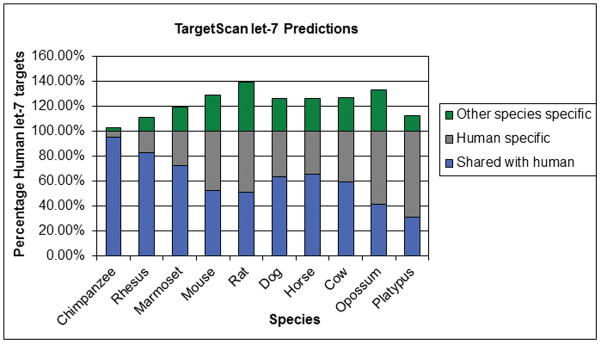
The number of protein coding genes with predicted targets for let-7 miRNA binding in the 3′ UTR are shown. Only single copy orthologs are counted and numbers are relative to the number found in human (100% on scale). The number of gene targets shared with human (in blue) falls as the evolutionary distance increases, as expected. However, the proportion of let-7 targets shared with human is comparable for marmoset, dog, horse and cow, while mouse and rat share fewer targets with human than other non-primate placental mammals.
Small marmosets are believed to have evolved from a larger ancestor, so we looked for positively selected genes that might explain this change. We identified 37 positively selected genes on the marmoset lineage and 7 on the branch to Catarrhini (FDR<0.01)(Supplemental Table 38). Five of these seven genes (SAMHD1, CLEC4A, ANKZF1, KRT8, CATSPERG) were previously unrecognized as positively selected19. An additional 91 positively selected genes could not be traced to a particular branch due to a lack of identifiable outgroup orthologs. Following trends observed in previous studies19, gene ontology categories related to immunity, physiological defense response, and sensory perception are enriched (Table 1). In addition, the ATP synthesis and transport and NADH dehydrogenase activity categories show enrichment (Mann-Whitney U-test, P<0.05). The latter group contains eight positively selected nuclear genes encoding subunits of the respiratory Complex I. Resulting differences in Complex I regulatory and kinetic properties could affect metabolic rates and body temperature, challenges posed by small body size.
A prominent example of marmoset lineage positive selection can be found in IGF1R (P=0.0014), which is associated with short stature in humans20,21. This protein shows multiple mutations within crucial binding domains (Figure 3) which likely affect ligand-receptor binding affinity. Other growth hormone related positively selected genes possibly related to small stature include growth hormone secretagogue receptor (GHSR), insulin-like growth factor 2 (IGF2), insulin-like growth factor binding proteins 2 (IGFBP2), and 7 (IGFBP7), and epidermal growth factor (EGF) (marmoset lineage, P<0.05). Targeted exon sequencing of multiple species revealed several callitrichid-specific non-synonymous substitutions in genes that are strong candidates for influencing diminutive body size (GDF9, BMP15, BMP4). Analysis of these mutations by SIFT22 and Polyphen23 indicate that these likely affect the function of the corresponding proteins24 (Supplementary Note, Table 38).
Figure 3. Residues under Positive Selection in IGF1R.

The insulin-like growth factor 1 receptor (IGF1R) interacts with other genes in growth hormone pathways and has a role in both prenatal (left) and postnatal (right) growth. Genes in these pathways in marmoset that have residues under positive selection are tallied, the number changes that can be assigned to either the marmoset or callitrichine NWM lineages are also shown. In the middle, the first three domains of the IGF1R alpha chain are shown with positively selected residues in red (Bayes empirical Bayes analysis PP>0.95) and yellow (PP>0.5). Leucine-rich repeat domains L1 and L2 are shown in green with L1 on top, cystein-rich region CR is shown in blue. A multiple alignment of IGF1R proteins from several mammalians species (bottom) exhibits several marmoset changes in a short region corresponding to the part of structure enclosed in the black rectangle.
The genetic basis of twinning has received significant attention in humans and other animals25–27. Genetic differences drive variation in ovulation number among sheep strains25,28. There is also clear evidence for genetic influence on human twinning but specific genes have not been identified. We studied 63 candidate genes previously implicated in the control of either body size, number of ova produced in a single estrous cycle, or both. Of these, 41 genes with putative marmoset-specific non-synonymous variants were examined further (Supplemental Table 39, 40). Three genes with a role in ovulation (BMP4, FSTL4 and WFIKKN1) showed likely function-altering amino acid changes as scored by both SIFT22 and Polyphen23 (Supplementary Note and24). Potentially functional non-synonymous substitutions in genes coding for follicle stimulating hormone receptor (FSHR), BMP10, BMP15, GDF9 and GDF15 were also found. Notably, a single non-synonymous substitution in WFIKKN1 is common to all callitrichids we tested, with the exception of Callimico goeldi. That species shows a reversal of this change back to the sequence found in OWM and other non-twinning NWM. C. goeldi is the only callitrichid that does not regularly twin, and given its phylogenetic position, it is highly likely to have reverted back to singleton births from an ancestral state that exhibited twinning. This amino acid change in WFIKKN1 is therefore a strong candidate for a role in the origin of twinning in callitrichids.
Hematopoietic chimerism of marmosets was expected to correlate with significant changes in immune system function. We found positively selected genes related to immune response significantly enriched in marmoset (Table 1). NAIP and NLRC4 homologues, conserved in mammals, are absent in marmoset (Supplemental Table 38). These proteins form the NAIP inflammasome in macrophages, a cytoplasmic complex that triggers macrophage inflammatory death through activation of caspase-129,30 and could affect reproduction as human NAIP is expressed in the placenta.
Other positively selected genes potentially involved in circumventing unwanted chimerism-associated responses include CD48, a ligand for CD244 (2B4) found on the surface of hematopoietic cells which regulates natural killer cells31 and interleukins IL5 and IL12B, involved in T cell development and in allergic responses32. Finally, in contrast to the extensive family of KIR genes integral to immune system function in humans and other catarrhine primates, the marmoset genome contains only two KIR genes, one of which is partial.
Most differences in protease gene families observed between marmosets and other primates occur in genes related to reproductive and immune systems (Supplementary Note). For example, ADAM6, with a role in fertility33,34, was lost in marmoset, while ISP2, involved in embryo implantation35, has been duplicated twice. KLK2/3, duplicated in the Catarrhine ancestor36 and involved in reproductive physiology33 is non-functional in marmoset. Chymase and tryptase protease changes and CMA1 and MAST duplications potentially affect the immune response37,38 and mast cell biology, respectively. The duplicated CMA1 gene may be related to the murine-specific mast cell proteases (MCPs) absent in hominoids39. Changes in the C-terminal of MMP19 an IGFBP3-processing enzyme40 might be related to growth characteristics. Consistent with retrogene analysis (Supplementary Note), there are multiple non-functional single-exon protease-like pseudogenes. Seven of these have complete ORFs without identified transcripts, indicating that they arose from recent retrotranscription events.
PRDM9, which binds DNA in recombination hot spots and affects recombination activity during meiosis41 (Supplementary Note) is duplicated in catarrhine primates. Orthologs with all three functional PRDM9 domains have been computationally identified in placental mammals42, however, these genes are often not in syntenic locations. In primates (including human and marmoset), panda, pig, and elephant, there is a PRDM9-like gene flanked by a conserved syntenic block including the genes URAH and GAS8. This gene, located near 16q telomere in human, is labeled PRDM7 in catarrhine primates but PRDM9 in marmoset and non-primates. Another gene (labeled PRDM9 in catarrhine primates) is located between the cadherin genes CDH12 and CDH10 at human 5p1443. This gene is present in chimpanzee, orangutan and rhesus macaque but is absent in marmoset and non-primates. The marmoset genome sequence provides two types of evidence that support the occurrence of a duplication in the catarrhine lineage after its divergence from platyrrhine primates: the phylogeny of PRDM9-like genes (Supplementary Figure 10b) and their genomic locations.
Population Genetics and Polymorphism
Genome sequence diversity was examined in nine marmosets (two animals from the New England Regional Primate Research Center (RPRC), two from Wisconsin National PRC (NPRC), and five from Southwest NPRC) (Supplementary Figure 11). This sample size is sufficient to identify common polymorphisms in this species, but will not detect a large proportion of low frequency or rare variants. Chimerism does not interfere with identifying SNPs that are polymorphic in the species as a whole, but does complicate the assignment of genotypes for specific SNPs to specific individuals. We investigated this effect by quantifying read balance (proportion of reads supporting each allele in apparent heterozygotes) and found different distributions in marmosets compared to a human control: more SNPs with read balance fractions between 5% and 25% are observed in marmosets. Simulations indicate that this flattened read balance distribution results from bases that are not polymorphic in the sampled animal but are either heterozygous or differently homozygous in the co-twin, with the low level of alternative reads representing the chimeric cells introduced during development (Supplementary Note, Supplementary Figure 2a).
We also explicitly modeled the expected numbers of sequencing reads covering a dimorphic SNP locus with one allele or the other, given a known fraction of chimerism and applied a maximum likelihood method to estimate the proportion of chimerism present in the marmoset samples from the sequencing data (see Supplementary Note). The chimerism fractions range from 12% to 37% (Supplementary Note, Table 6).
Using polymorphic autosomal bi-allelic SNPs (~7.7 million), we calculated pairwise allele-sharing genetic distances. To test if the genetic variation among individuals can be explained by their primate colony of origin, we performed principal component analysis (PCA) based on the pairwise distance. PCA separates the three colonies on the first 2 principal components (Supplementary Figure 11a) with individual M32784 from Southwest PRC more similar to individuals from other primate centers. Next, we used ADMIXTURE44 to assess the ancestry of each individual. When K=3 (Supplementary Figure 11b), three groups corresponding to the colonies are identified. New England RPRC and Wisconsin NPRC individuals form distinct groups with little admixture. Consistent with the PCA result, two Southwest NPRC individuals (M32783 and M32784) show appreciable admixture from the other colonies (Supplementary Figure 11b). A neighbor-joining tree using the distance matrix (Supplementary Figure 11c) confirms the individuals from the same colony are grouped together, with the exception of M32784. The long terminal branch length suggests that most of the diversity exists among individuals.
We identified 107 polymorphic Alu insertions within common marmosets (Supplementary Figure 10a). Analysis of these insertions using Structure (version 3.3.2)45,46 indicates population structure within the marmosets and detects two populations (Supplementary Table 41, Figure 12). The included marmosets show varying degrees of admixture with some individuals mostly assigned to one cluster and others assigned to both clusters (Supplementary Figure 12). The Structure analysis suggests the New England RPRC colony is assigned primarily to one cluster and the Wisconsin and Southwest NPRC colonies fall into the other cluster.
Discussion
Prior analyses of primate genomes have identified few specific changes that account for phenotypic differences among species, with the exception of genes that influence human brain size47, language (reviewed48) or other unique human traits49. In contrast, our analysis presents a number of specific differences in gene content, miRNA number and sequence, and protein coding gene sequences in genes known to influence growth, reproduction and twinning propensity all potentially related to marmoset phenotypic adaptations (Supplementary Figure 13). Such divergence at multiple levels does indeed underscore the remarkable nature of this platyrrhine monkey species.
Online Methods
Genome sequencing and assembly
The 26.7M sequence reads, generated on ABI3730 instruments (Supplementary Table 1), average read length 700 bases (>=Phred51 quality 20), were assembled using PCAP52. Assembly filtered for known non-marmoset sequence contaminants and singleton contigs and supercontigs < 2 kb included 99.98% of the input reads and is 59% A/T. WUGC Callithrix jacchus-3.2 was submitted to Genbank (UCSC version calJac3) and used by Ensembl to build gene models. Statistics (Supplementary Table 2) are for the initial assembly, before integrating finished BACs and adding inter-scaffold gaps and gaps representing centromeres and telomeres. The final assembly spans 2.91 Gb, with 2.77 Gb ordered and oriented along specific chromosomes (see below). The assembly represents an arbitrary consensus of the individual animal’s alleles.
The non-repetitive assembly data were aligned against the repeat masked human genome at UCSC utilizing BLASTZ39. Orthologous and paralogous alignments53 were differentiated and only “reciprocal best” alignments were retained and used to generate. the marmoset AGP files similar to methods described12. Documented inversions based on FISH data (see URLs and below) and inversions suggested by the assembly and supported by additional mapping data (e.g. fosmid and BAC-end pairs) were also introduced. Centromeres were placed based on their positions identified from cytogenetic data (see Supplementary Note). A total of 81 finished CHORI-259 marmoset BACs (totaling 15,576,643 bases) were merged into the final chromosomal files.
WUGSC sequenced Marmoset cDNAs (Supplementary Table 4) with Roche 454 Life Sciences instruments and methods54 assembled using Newbler55 and BLAT56 aligned against the marmoset genome.
Using >700 human BAC clones we established synteny block organization of marmoset chromosomes and disambiguated inconsistencies and uncertainties of the genome assembly (see URLs to explore the data).
Gene Feature Annotation
The RefSeq57 and Ensembl18, 58 annotations used the general methods described (see URLs). Ensembl annotation raw compute stage (Supplementary Figures 6a) screened genomic sequence using RepeatMasker59 (version 3.2.5 with parameters ‘-nolow -species homo –s’), Dust (Kuzio J, Tatusov R, and Lipman DJ: Unpublished but briefly described in60)(together masking 47%) and TRF61.
Predicted features include transcription start sites (Eponine–scan62, FirstEF63), CpG islands (described64) and tRNAs65. Genscan results on RepeatMasked sequence were input for UniProt66, UniGene67 and Vertebrate RNA (see URLs) by WU-BLAST68,69 alignments, resulting in 252,582 UniProt, 316,384 UniGene and 317,679 Vertebrate RNA sequences aligning.
Genewise70 and Exonerate71 produced coding sequence models using marmoset and human UniProt, SwissProt/TrEMBL (see URLs) and RefSeq72 proteins mapped to the genome (Pmatch, Durbin, unpublished) (Supplementary Figures 6b, 6c). One model per locus was selected using BestTargeted module. Species-specific (here marmoset and human) data generated 1,908 (of 3,153) marmoset protein and 20,735 (of 22,320) human protein “Targeted stage” models with UTRs.
Raw Compute UniProt alignments were filtered, sequences with UniProt’s Protein Existence (PE) classification, level 1 and 2 were mapped with WU-BLAST and coding models built with Genewise in regions outside of Targeted Stage models, generating 57,019 mammalian and 42,323 non-mammalian additional “Similarity stage” models.
Marmoset cDNAs and ESTs and human cDNAs from ENA/Genbank/DDBJ with polyA tails removed were aligned to the genome using Exonerate72 (Supplementary Figures 6d, 6e, 6f). With 90% coverage and 80% identity cut-offs, 139,713 (of 292,329) human cDNAs, 887 (of 986) marmoset cDNAs, and 2,562 (of 2,605) marmoset ESTs aligned. EST-based gene models (similar to those for human73) are displayed in a separate website track from the Ensembl gene set.
Similarity stage coding models were filtered to remove models with little cDNA or EST support, visualized using Apollo74, extended using human cDNA and marmoset expressed sequences, resulting in 1,501 (of 2,119) marmoset, 13,150 (of 20,735) human, and 22,897 (of 31,863) UniProt coding models with UTR. Redundant transcript models were removed and remaining models clustered wherever any coding exons from two transcripts overlapped.
More information on the Ensembl automatic gene annotation process19,20 is available in the references and the Supplementary Note.
Segmental duplications in Callithrix jacchus-3.2 were estimated using two computational methods; one compares assembly segments using BLAST (Whole Genome Assembly Comparison), WGAC,8 the second, assessed excess depth-of-coverage of WGS data mapped to the assembly, WSSD9. All scaffolds were RepeatMasked (see URLs) and window masked75 using the specific marmoset repeat library (Supplementary Note) composed of retrotransposons and other low complexity sequences. WGAC, identifies pairwise alignments >1 Kb and >90% identity. WSSD, identifies SDs > 10 Kb in length and >94% identity. For WSSD we mapped reads using Megablast with >94% sequence identity, >200bp non-repeatmasked bp and at least 200 bp of PhredQ>30 bp.
FISH Assessment of 97 clones on lymphoblast cell line nuclei and metaphases chromosomes from a marmoset unrelated to animal #186/17066. Duplicated probes had > 2 signals in 95–98% of > 60 observed nuclei (Supplementary Figure 3c). Sixteen clones showing strong hybridization background were tested three times without a clear pattern emerging and removed from further analysis. This unusual background may be due to incomplete masking by Repeatmasker and/or competitive hybridization conditions during FISH. Nine (of 16) belonged to the WGAC-WSSD+ category consistent with collapsed repeats.
As with ape assessment76, We aligned 27,615,086 marmoset reads to human (build35, excluding random sequences) with repeat content masked (<20% divergent from consensus (RepeatMasker in either human or marmoset)). Aligned reads had >200bp of high quality (Phred score >27), >300bp aligned, >40% read length aligned, and <200bp repeat content. After evaluation, we applied an identity threshold of 85%, similar to the criteria applied in the macaque analysis. See Supplementary Note for details.
Sequence elements constrained in anthropoid primates were defined using the pipeline briefly outlined in Supplementary Note, described in detail17. To validate the functional role of the bioinformatically defined elements as transcriptional enhancers, we tested eight non-coding ASCs in embryonic stem cell (ESC) enhancer assays. Candidates were selected based on DNaseI hypersensitivity in human ESCs77. The eight human sequences and their mouse orthologs (identified using liftOver, Supplementary Table 11) were amplified from their respective genomic DNA, cloned into the SalI site, downstream of luciferase, of the pGL3-Pou5f1 vector using the Gateway Cloning System (Invitrogen), and transfected with the reporter constructs into hESCs (H1-WA-01, WiCell Research Institute, Inc.) and mESCs (E14TG2A, ATCC CRL-1821) using Fugene HD (Roche) or Lipofectamine 2000 (Invitrogen) respectively. Both cell lines are routinely tested for Mycoplasma contamination (Lonza Detection kit :LT07-318). A Renilla luciferase plasmid (pRL-SV40, Promega) was co-transfected as an internal control. Cells were harvested 48 hours after transfection and the luciferase activities of the cell lysate were measured using the Stop-Glow Dual Luciferase Reporter Assay System (Promega) (Supplementary Note).
MicroRNAs (877, Supplementary Table S2) were identified as being expressed or predicted based on cross-species conservation of mature microRNA or hairpin sequences. Small RNAs were sequenced from total RNA from prefrontal cortex brain samples (A07-716monkB, 3.2 years, male; A09-122monkB, 12.8 years, female; A08-206monkB, 13.4 years, male; A08-337monkB, 13.0 years, female), and two placenta samples, using 36 bp reads on the Illumina 1G Genome Analyzer78. Usable reads were identified as described78,79, omitting reads with <4 copies, <10 nt, >10 repetitive nucleotides, or that matched E. coli using WU BLAST69 (Supplementary Table S2). Expressed microRNAs 100% conserved (Group A, 291 miRNAs) or with 1–3 mismatches (Group B, 240 miRNAs) in at least one other species in miRBase 17.080. were identified. Known microRNAs in miRBase80 17.0 mapped to the marmoset genome identifed conserved (100% match, Group C, 119) or novel (with 1–3 mismatches, Group D, 120) miRNAs. Group A to D sequences (~22nt) aligned with BLAT (-stepSize=5 repMatch=100000 -minScore=0 -minIdentity=0 -fine), and their flanking sequences (+/− 200 bp) extracted from UCSC were folded using Vienna RNAfold78 twice to confirm hairpin structures with the mapped sequenced in the mature miRNA location. Group E contains the 91 novel miRNAs (20 passed high stringency filters) identified, trimmed to include only the hairpin bases (60–150 nt) (Supplementary Table S2).
WU BLAST comparison identified marmoset micoRNAs conserved in four anthropoid primates (-nogaps -N -1000 -mformat=2 -warning -kap -hspmax=10) (marmoset: calJac3, human: hg18, rhesus: rhemac2, orangutan: ponAbe2, chimpanzee: panTro2 from UCSC). BLAT mapping (-stepSize=5 -repMatch=100000 -minScore=0 -minIdentity=0 –fine) of precursor miRNA hairpins on marmoset Chr. 22 to rhesus, orangutan and chimpanzee identified the best matches which were realigned to marmoset miRNAs hairpins using Smith-Waterman to identify nucleotide changes in the mature microRNA sequence. Human Chr. 19 hairpins were mapped to calJac 3 using Galaxy lift over and BLAT alignment and realigned as above (see conservation in Supplementary Tables S3, S4, S5, S6, S7, and S8).
MicroRNAs predicted using SVM (Group F)
Human precursor miRNAs (miRBase 14.081) WU-BLASTN68,69 (see URLs) matches > 20 bp to calJac 3.2. (-M 1 -N -1 -Q 3 -R 2 -W 9 -filter dust -mformat 2 -hspsepSmax 40 -e 1e-3) were extended to match their entire length and realigned using MAFFT82 (maxiterate 1000 --localpair–quiet). Matches were identified with (i) length > 40 bp, (ii) 100% conserved seed region (mature miRNA nucleotides 2–8), (iii) > 90% mature miRNA sequence identity, (iv) total precursor conservation > 50% length, (v) at most 2 gaps in mature miRNA, (vi) minimum free folding energy (MFE) < −15 kcal/mol, (vii) > 40% of bases paired, (viii) mature regions not overlapping a multiple loop region, and (ix) probability < 5% for a randomly shuffled hit sequence to have a lower MFE than the native sequences for <95% conserved matches. The lowest e-value hit for overlapping loci was subjected to a Support Vector Machine (SVM) model trained to distinguish miRNAs from unspecific genomic stem-loop sequences or other non-coding RNAs. Developed for miROrtho annotation database83 (see URLs), the model incorporates themodynamical, structural and sequence features found in known miRNA genes. Using an initial BLAST e-value cutoff of 1e-6, SVM score over 0.5 and 100% mature miRNA sequence conservation to any known miRBase miRNA identified 589 genes (Group F).
Expression profiles estimated counting filtered small RNA sequences (above) mapping within 4 bp on the same chromosome as the microRNA, normalized by total usable reads. Euclidean hierarchical clustering of genes and arrays with Cluster 3.0 and Tree View84 (see URLs) used the log2 transformation of microRNAs per 10 million usable reads with the median expression value across the six samples set to zero.
MiRmap85 identified mRNAs with 3′ UTR matches to miRNA bases 2 – 8 and predicted the repression strength with a model encompassing thermodynamic, conservation, probabilistic, and sequence-based approaches. We computed the total energy of the miRNA-mRNA duplex (similar to86), branch length score87 and SPH test implemented in PhyloP88 and computed statistical significance of the seed-match based on 3′-UTR sequence composition. The three features of TargetScan context score89 were included in miRmap for a total of 11 features, of which 3 are novel (see URLs). These data were generated by mapping all human RefSeq genes to marmoset based on UCSC “Other RefSeq” track, multiple mapping locations in marmoset were retained, represented {refseqAccession}.1, {refseqAccession}.2, etc. Where the 3′ UTR differs between different mapped locations, this could represent true paralogs or assembly errors. The extracted marmoset 3′-UTRs were aligned using MAFFT82 to the TargetScan 5.1 23 way UTR alignments and marmoset target genes identified with 3′-UTR binding sites to the mature marmoset Chr. 22 family miRNAs.
Conservative 1:1 orthologs between marmoset and human, chimpanzee, rhesus macaque, orangutan, mouse, rat, and dog produced using UCSC90 whole-genome alignments and genes (July 2010) including partial transcripts missing 10% on both ends. Transcripts on chromosomes > 100 nucleotides from RefSeq (58,126), knownGene (118,345), ENSEMBL (128,193), and VEGA (73,873) clustered into 21,694 genes based on location.
Each transcript was transferred to other species and subjected to tests designed to exclude genes that have undergone large-scale changes other than point mutations (as in19), testing for breaks in synteny, significant assembly gaps overlapping the transcript, frameshift and non-sense mutations, conservation of gene structure elements (splice sites, start codons, stop codons), and recent duplications causing mis-assignment of 1:1 orthology. Clean transcripts pass all tests. We choose a representative clean transcript for each locus, preferring longer transcripts clean in more species (summarized in Supplementary Table 12). This conservative set (13,717 1:1 orthologs of human and marmoset), has 41% covering all eight species, 27% missing one species, 15% missing two species, 10% missing three species, and less than 7% missing more than three species.
Gene family evolution was investigated in four other primates, two rodents, and three Laurasiatheria with fully sequenced genomes (human, chimpanzee, orangutan, rhesus macaque, marmoset, mouse, rat, dog, horse and cow). Gene families, including gene and protein names and genome coordinates were retrieved from Ensembl gene trees, version 58 (see URLs). Genes with multiple short introns (< 50 bp), short coding regions (< 100 bp), or present in < 3 species were removed, and we analyzed separately families with genes in only one lineage (Euarchonta, Glires, Laurasiatheria). The final set included most genes and families from the original Ensembl annotations (Supplementary Table 13), and was used to infer the ancestral family size with maximum-likelihood CAFE91 analysis with the following ultrametric tree built according to92: ((((((chimp:6,human:6):7, orang:13):11, macaca:24):16, marmoset:40):47, (mouse:17,rat:17):70):6, ((dog:74,horse:74):9,cow:83):10). where numbers correspond to million years (Supplementary Note).
Positively selected genes in the 1:1 orthologs were identified using Markov models of codon evolution and maximum likelihood methods similar to PAML93. Further downstream analysis such as enrichment analysis for GO categories was performed as described19. Supplementary Note details genes identified using FDR<0.01.
Genes involved in growth pathways and twinning
Candidate genes identified using 33-way EPO alignments18 containing marmoset NS (compared to human) conserved in haplorhine primates (human, chimpanzee, gorilla, orangutan, rhesus macaque and tarsier) were sequenced. The NS effect was defined using SIFT94 and some candidates were omitted due to conflicting evidence. Genes and coordinates are listed in Supplementary Table 39. Species include: Saguinus bicolor martinsi*, Saguinus imperator imperator, *Saguinus midas niger, Saguinus fuscicollis weddelli, Callithrix cebuella pygmaea*, Leontopithecus rosalia*, Cebus apella, Callimico goeldii, Ateles belzebuth, and Saimiri sciureus (species with an asterisk were also selected for miRNA sequencing). Sanger sequences were assembled (Velvet95), mapped to the genome (BLAT51), and aligned (MAFFT82). In 49 of 82 exons sequenced, data was insufficient to determine if the marmoset NS were callitrichine or NWM specific (Supplementary Note).
Protease Genes
We mined the marmoset genome for protease genes (see URLs) using BATI (Blast, Annotate, Tune, Iterate). Curated human proteases were compared to the marmoset genome with TBLASTN algorithm using the tbex script and the locations of marmoset protease genes predicted with bsniffer. Putative novel proteases were predicted with bgmix (Supplementary Note) and visually inspected.
Variation Analysis
SNPs (7,697,538) in reads aligned to the genome using BWA (version 0.5.9-r16, default parameters), were called using SAMTOOLS96 (version 0.1.14 (r933:176), command “$ samtools pileup -Bvcf $ref_genome $bam”), filtered q>20, D<100), with monomorphic, multi-allelic, and singletons removed. Pairwise allele-sharing genetic distance was calculated97 and the resulting matrix used for PCA and neighbor-joining tree construction (MATLAB ver. r2010b). Genetic ancestries of each individual was determined with ADMIXTURE44 in a given number of populations without using population designation. We filtered out SNPs with r2 > 0.2 within 100 SNP window using PLINK98, leaving 411,924 autosomal SNPs.
Alu genetic analysis
Best matching loci from CalJac3.2 for each Alu subfamily were identified using BLAT51 or retrieved from a local RepeatMasker (see URLs) analysis using a custom library and subfamilies with evidence of recent mobilization (divergence up to 1%) from the consensus sequence used for population genetic analyses. For phylogenetic analyses, Alu insertions of subfamilies were selected with varying divergence from the consensus sequence.
We retrieved marmoset Alu elements with ~500 bp flanking sequence, identified orthologous loci using BLAT51 and retrieved the sequences if the flanking sequence matched unambiguously in the other genome and the Alu insertion was absent. We did this for human, chimpanzee, orangutan, and rhesus macaque. We aligned the flanking sequence (BioLign/BioEdit) and selected primers (Primer399 or selected manually) to minimize the nucleotide substitutions and other Alu insertions. Primers were tested using UCSC In-Silico PCR51 and synthesized by Sigma Aldrich.
PCR amplifications (96-well format) in 25 μl using Perkin Elmer GeneAmp 9700 or a BioRad i-cycler thermo-cycler contained 15–25 ng of template DNA; 200 nM of each primer; 1.5–2 mM MgCl2, 1X PCR buffer (50 mM KCl; 10 mM TrisHCl, pH 8.3); 0.2 mM dNTPs; and 1–2 U Taq DNA polymerase. Conditions included: initial denaturation at 94 °C for 90 sec, followed by 32 cycles of denaturation at 94 °C for 20 sec, 57 °C annealing for 20 sec (see URLs for exceptions), and 72 °C extension for 30 to 70 sec depending on amplicon size, with a final 72 °C extension for 2 min. If necessary, temperature gradient using HeLa DNA identified the optimal annealing temperature. 20 μl of each reaction was fractionated in 2% agarose gel containing 0.1 μg/ml ethidium bromide at 175V for 50–60 minutes and visualized with UV-fluorescence.
Using genotype data from unlinked markers we inferred the population structure omitting information of the origin of the samples with a model-based clustering analysis45,46 under the admixture model that assumes that individuals may have mixed ancestry.
The number of identifiable population clusters (K) with the highest likelihood was determined using initial values of K (1 to 5), burn-in period (1,000,000 iterations) and run-length of 1,000,000 steps repeated at least five times. After determination of K (2) 25 replications were run under identical burn-in and run-length settings. The Structure analyses were run on a desktop machine with 4 CPUs.
Animal samples used in these study were obtained under protocols approved by the relevant institutional animal care and use committees from animals maintained in AAALAC-accredited animal care programs.
Supplementary Material
Figure 4. Twinning species and WFIKKN1 sequence variation.
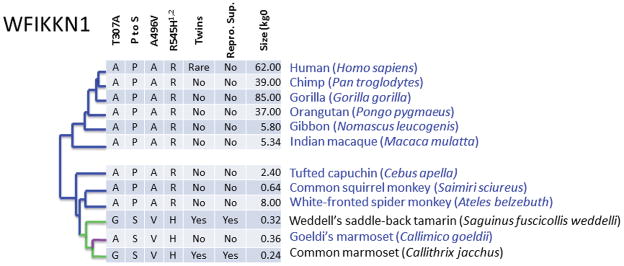
Primate species tree showing species that regularly produce twins in green and those that produce singletons in blue or purple. Phylogeny from50. In the table, marmoset WFIKKN1 NS changes sequenced labeled by the amino acid change (T307A Chr12:642862, P to S Chr12:642877 multiple base insertion, A496V Chr12:643445, R545H Chr12:643592). R545H is predicted by SIFT22 to alter protein function and by Polyphen23 to be probably damaging. Features related to reproduction including twin offspring, pair bonding, and reproductive suppression in non-breeding females and adult female weight are shown. Adult female weights from IUCN 2013. IUCN Red List of Threatened Species. Version 2013.2. (see URLs) and Primate Info Net (apes and marmoset, see URLs). Species on the green branches exhibit phyletic dwarfing, an early period of developmental quiescence, and a shared chimeric placenta. Sequence changes in the WFIKKN1 gene support the phylogenetic tree with four changes occurring on the branch leading to tamarins and marmosets and a single change in Callimico goeldii back to the residue found in other primates that produce singletons (purple).
Acknowledgments
The authors acknowledge the contributions of the sequence production staff of the HGSC: K. Abraham, C. Adams, C. Allen, U. Anosike, T. Attaway, D. Bandaranaike, A. Bell, S. N. Bell, B. Beltran, C. Bickham, J. Chacko, A. Chavez, H.-S. Chu, M. Coyle, M. L. Davila, L. Davy-Carroll, S. Denson, Y. Ding, S. Dugan, V. Ebong, S. Fernandez, P. Fernando, A. Ferrer, J. Ganer, R. Garcia III, T. Garrett, E. Hawkins, S. Hines, M. Holder, B. Hollins, H. Jiang, B. Johnson, H. Kisamo, L. Lago, M. Lago, C.-Y. Lai, T.-K. Le, F. Legall III, S. Lemon, R. Madu, E. Martinez, I. Mercado, C. Mercado, M. Munidasa, D. Ngo, P. Nguyen, O. Nwaokelemeh, M. Obregon, C. Onwere, A. Parra, H. Paul, A. Perez, Y. Perez, E. Primus, J. Quiroz, B. Schneider, I. Sisson, X.-Z. Song, A. Svatek, T. Taylor, R. Thelus, N. Thomas, R. Thornton, Z. Trejos, K. Usmani, S. Vattathil, D. Villasana, D. Walker, K. Wang, S. Wang, C. White, A. Williams, J. Williams, J. Woodworth, and L. Zhang. The WUGSC acknowledges the many people who contributed to the sequencing and analysis of this project who are not named here individually. We thank Joan Steitz for mRNA data used to annotate the 3′ untranslated regions of genes. The miRNA analysis group acknowledges the contributions of Deepthi Rajapakshe, Chanel Athulathmudali, Huaiyang Jiang and Ashley Moehring. We gratefully acknowledge the assistance of David Opheim with the figures. The marmoset genome project was funded by the National Human Genome Research Institute (NHGRI), including grants U54 HG003273 (R.A.G), and U54 HG003079 (R.K.W.) with additional support from National Institutes of Health (NIH), including grants R01-DK077639 to SDT, R01-GM59290 (LBJ and MAB), HG002385 to EEE, and P51-OD011133 to Southwest NPRC and support from the National Science Foundation (NSF BCS-0751508 to DEW) and the VEGA grant agency 1/0719/14 (TV) and 1/1085/12 (BB). CCF and MCR were supported in part by a Howard Hughes Medical Institute grant to Louisiana State University through the Undergraduate Biological Sciences Education program. JX was supported by NHGRI K99 HG005846. PHG was supported by the Cullen Foundation. TM-B was supported by ERC Starting Grant (260372) and MICINN (Spain) BFU2011-28549. BL-G was supported by the Spanish National Institute of Bioinformatics (see URLs). EEE is an investigator of the Howard Hughes Medical Institute.
Accession Numbers
The sequences are available in the NCBI Trace Archive (see URLs) using the query SPECIES_CODE=‘CALLITHRIX JACCHUS’ and TRACE_TYPE_CODE=‘454’ for 454 transcript sequences, ‘WGS’ for ‘plasmid reads, ‘FINISHING’ for BAC finishing reads, or ‘CLONEEND’ for fosmid and BAC end sequences. The Illumina data are available from NCBI: RNAseq under bioproject 13630, and genomic sequence from nine other marmosets under bioproject 20401 (see URLs). Short RNAs sequenced using Illumina are available from MirBase (see URLs). The sequence assembly is accessioned in GenBank (ACFV00000000.1) and available in NCBI under genome build 1.1 (see URLs). The data are also available from the WU GI web site, BCM HGSC web site, the UCSC Genome Browser (GCA_000004665.1), and Ensembl (C_jacchus3.2.1, Jan 2010) (see URLs). The cytogenetic data is presented at Campus Universitario Bari, Italy (see URLs).
URLs
NCBI Trace Archive - http://www.ncbi.nlm.nih.gov/Traces/trace.cgi?; NCBI RNAseq bioproject http://www.ncbi.nlm.nih.gov/bioproject/13630; Genome Institute, Washington University St. Louis, http://genome.wustl.edu/genomes/view/callithrix_jacchus/; Human Genome Sequencing Center, Baylor College of Medicine, https://www.hgsc.bcm.edu/non-human-primates/marmoset-genome-project; UCSC Genome Browser, http://genome.ucsc.edu; Cytogenetic data at Campus Universitario Bari, Italy, http://www.biologia.uniba.it/marmoset/; MirBase, http://www.mirbase.org/; NCBI Marmoset genome build, http://www.ncbi.nlm.nih.gov/mapview/map_search.cgi?taxid=9483; NCBI nine other marmoset genomic samples, http://www.ncbi.nlm.nih.gov/bioproject?Db=biosample&DbFrom=bioproject&Cmd=Link&LinkName=bioproject_biosample&LinkReadableName=BioSample&ordinalpos=1&IdsFromResult=20401; Ensembl, http://www.ensembl.org/index.html; IUCN Red List of Threatened Species, www.iucnredlist.org; Primate Info Net, http://pin.primate.wisc.edu/factsheets/; Spanish National Bioinformatics Institute, www.inab.org; BAC FISH mapping data exploration, http://www.biologia.uniba.it/marmoset/; Ensembl Genebuild Process Documentation, http://cvs.sanger.ac.uk/cgi-bin/viewvc.cgi/ensembl-doc/pipeline_docs/the_genebuild_process.txt?root=ensembl&view=co; Ensembl Gene Annotation Pipeline for Marmoset, http://www.ensembl.org/info/docs/genebuild/genome_annotation.html; Vertebrate RNA alignments, http://www.ebi.ac.uk/ena/; UniProt, SwissProt/TrEMBL protein sequences, http://www.uniprot.org/; RepeatMasker Open-3.0, http://www.repeatmasker.org; WU-BLAST package, http://blast.wustl.edu; miROrtho miRNA annotation database, http://cegg.unige.ch/mirortho; Cluster 3.0 and Tree View software, http://rana.lbl.gov/EisenSoftware.htm; miRmap, http://cegg.unige.ch/mirmap; Protease genes, http://degradome.uniovi.es; Alu PCR conditions and primers, http://batzerlab.lsu.edu; Ensembl gene trees, http://www.ensembl.org/index.html.
Author Contributions
K.C.W., W.C.W., J.R., and D.L. led the Marmoset Genome Sequencing and Analysis Consortium project. Principal investigators R.A.G. and R.K.W. provided material support. R.A.G., R.K.W., D.M.M., E.R.M., G.M.W., and W.C.W. led the sequencing project. K.C.W., J.R., R.A.H., K.M.A., and S.D.T. prepared the manuscript. S.D.T. provided samples for genomic sequencing and contributed information on the biology of marmosets. J.F.H., L.B.J., H.S., S.D.T., D.J.W., and J.X. contributed the chimerism estimates. K.B., S.F., P.F., J.M.H., and B.J.R. contributed comparative alignments. M.R., S.S., J.-H.V. annotated the genes. L.W.H. and P.M. assembled the genome sequence. K.M.A., B.B., R.A.H., S.D.T. and T.V. analyzed growth genes. D.H. investigated immune genes. N.A., O. C. and M.R. performed karyotype analysis. P.J.D., D.M. and B.Z. prepared the BAC library. S.L.L., L.V.N., I.N., L.P., L.-L.P., C.M.W., and Y.W. prepared the plasmid sequencing libraries. D.G., P.H.G., R.A.H., J.S.M., R.M., J.R., B.S., J.B.T., C.E.V., W.X., K.C.W., and E.M.Z. performed the microRNA analysis. M.A.B., R.H., L.B.J., M.K.K., M.C.R., A.F.A.S., S.D.T., B.U., J.A.W., D.J.W. and J.X. analyzed the population genetics. B.B., C.K., L.T. and T.V. analyzed positively selected genes. R.C.-H. D.N. A.R. and S.P. defined primate-constrained sequence elements. C.L.-O., X.S.P., V.Q. and D.R. analyzed protease genes. C.C., P.F., J.M.H., E.V. K., A.J. V. and E.M. Z. analyzed protein coding genes. M.A.B., C.C.F., R.H., M.K.K., A.F.A.S., B.U., J.A. W. and Q.W. performed analysis of the repeats. S.B.C., K.G.M., C.R. and D.E.W. collected samples. C.C., E.E.E., M.W.H., E.K., B.L.-G., T.M.-B., S.S., D.R.S. and M.V. analyzed segmental duplications. Sequence was produced by M.M.C., A.C., M.D.D., K.D.D., H.H.D., R.G.F., C.F., L.A. F.R.S. F.R.A.G., T.A.G., Y.H., J.H., S.N.J., V.J., C.L.K., L.R.L., Y.L., J.L., E.R.M., M.B.M., D.M.M., N.B.N., G.O.O., S.J.R., J.S. and R.A.W. D.R.D. analyzed SNP variation. K.M.A., R.A.H. and S.D.T. analyzed twinning genes.
Footnotes
Human Genome Sequencing Center, Baylor College of Medicine, One Baylor Plaza, Houston, TX, 77030, USA.
Department of Molecular and Human Genetics, Baylor College of Medicine, One Baylor Plaza, Houston, TX, 77030, USA.
The Genome Institute, Washington University St. Louis, 4444 Forest Park Blvd., St Louis, MO 63198, USA.
Barshop Institute for Longevity & Aging Studies, University of Texas Health Science Center at San Antonio, 15355 Lambda Drive, San Antonio, TX 78245 USA.
Obstetrics & Gynecology, Baylor College of Medicine, One Baylor Plaza, Houston, TX 77032, USA.
Biology, Bari University, Via Orabona 4, 70125 Bari Italy.
Genome Institute of Singapore, 60 Biopolis St, Genome #02-01, Singapore 138672.
Department of Biological Sciences, Louisiana State University, 202 Life Sciences Building, Baton Rouge, LA 70803, USA.
Vertebrate Genomics, European Bioinformatics Institute, Wellcome Trust Genome Campus, Hinxton, Cambridge, CB10 1SD, UK
Faculty of Mathematics, Physics and Informatics, Comenius University in Bratislava, Mlynska Dolina, 84248 Bratislava, Slovakia.
Wisconsin Primate Center, WI, USA.
Department of Biology, Indiana University, 1001 E. 3rd St., Bloomington, IN 47405, USA.
School of Informatics and Computing, Indiana University, 1001 E. 3rd St., Bloomington, IN 47405, USA.
Children’s Hospital Oakland Research Institute, Oakland, California 94609, USA.
Department of Genome Sciences, University of Washington, 3720 15th Ave NE, Seattle WA 98195-5065, USA.
Genetic Medicine and Development, University of Geneva Medical School, Michel-Servet 1, 1211 Geneva, Switzerland.
Department of Biology & Biochemistry, University of Houston, 4800 Calhoun, Houston, TX 77204, USA.
Department of Pathology, Baylor College of Medicine, One Baylor Plaza, Houston, TX 77030, USA.
Organismic and Evolutionary Biology, Harvard University, 26 Oxford Street, Cambridge MA 02138, USA.
Ensembl, European Bioinformatics Institute – EMBL, Wellcome Trust Genome Campus, Hinxton, UK.
Institute for Systems Biology, 401 Terry Avenue North, Seattle, Washington 98103, USA.
Whitehead Institute, 9 Cambridge Center, Cambridge, MA 02142, USA.
Department of Human Genetics, University of Utah School of Medicine, 15 North 2030 East, Salt Lake City, Utah 84112, USA.
Institut für Populationsgenetik, Vetmeduni Vienna, Veterinärplatz 1, A-1210 Wien, Austria
Departamento de Bioquímica y Biología Molecular, Instituto Universitario de Oncología, Universidad de Oviedo, C/Fernando Bongera S/N, 33006 Asturias, Spain.
Spanish National Bioinformatics Institute (INB), Barcelona, Spain.
ICREA at Institut de Biologia Evolutiva CSIC-Universitat Pompeu Fabra, Doctor Aiguader, 88, 08003, Spain.
Division of Comparative Pathology, New England Primate Research Center, Harvard University Medical School, 1 Pine Hill Drive, Southborough, MA 01778, USA.
CNAG (Centro Nacional de Analisis Genomico), Baldiri Reixac 4, Barcelona, Catalonia 08028, Spain
Center for Biomolecular Science and Engineering, School of Engineering, University of California, Santa Cruz, Santa Cruz, CA 95064, USA.
Informatics, Wellcome Trust Sanger Institute, Wellcome Trust Genome Campus, Hinxton, Cambridge, CB10 1SA, UK.
Howard Hughes Medical Institute, Whitehead Institute, 9 Cambridge Center, Cambridge, MA 02142, USA.
Department of Genetics, Faculty of Natural Sciences, Comenius University in Bratislava, Mlynska Dolina, 84215 Bratislava, Slovakia.
Center for Computation and Technology, Louisiana State University, 216 Johnston Hall, Baton Rouge, LA 70803, USA.
Department of Computer Sciences, Louisiana State University, 216 Johnston Hall, Baton Rouge, LA 70803, USA.
Center for Molecular Medicine and Genetics, Wayne State University School of Medicine, 3220 Scott Hall, 540 East Canfield, Detroit, MI 48201, USA
Swiss Institute of Bioinformatics, Michel-Servet 1, 1211 Geneva, Switzerland.
Molecular Biosciences, Imperial College London, South Kensington Campus, SW7 2AZ London, UK.
Leader
Current address: Department of Bioengineering, University of Illinois at Urbana-Champaign, Urbana, Illinois 61801, USA.
Current address: Translational Sciences, Novartis Institutes for Biomedical Research, 300 Tech square, Cambridge, MA, 02139, USA.
Current address: Department of Genetics, the Human Genetics Institute of New Jersey, Rutgers, the State University of New Jersey, 145 Bevier Rd, Piscataway, NJ 08854, USA
Current address: Boehringer Ingelheim RCV GmbH and Co KG, Vienna, Austria.
Current address: CAS Key Lab of Pathogenic Microbiology and Immunology, Institute of Microbiology, Chinese Academy of Sciences, No. 1 West Beichen Road, Building 3, Chaoyang District, Beijing 100101, China.
Current address: Department of Biology, Saint Louis University, 3507 Laclede Ave. St. Louis, MO 63103, USA
Current address: The Genome Analysis Center, Norwich Research Park, Norwich NR4 7UH, UK.
Additional information describing NWM phylogeny, genome sequencing, assembly and quality assessment, chimerism assessment, analysis of segmental duplications, sequence constraint, gene annotation, orthologs, and sequence variation is available in the Supplementary Notes.
COMPETING FINANCIAL INTERESTS
The authors declare no competing financial interests.
References
- 1.Benirschke K, Anderson JM, Brownhill LE. Marrow Chimerism in Marmosets. Science. 1962;138:513–515. doi: 10.1126/science.138.3539.513. [DOI] [PubMed] [Google Scholar]
- 2.Gengozian N, Batson JS, Eide P. Hematologic and Cytogenetic Evidence for Hematopoietic Chimerism in the Marmoset, Tamarinus Nigricollis. Cytogenetics. 1964;10:384–393. doi: 10.1159/000129828. [DOI] [PubMed] [Google Scholar]
- 3.Goldizen AW. Tamarin and marmoset mating systems: Unusual flexibility. Trends Ecol Evol. 1988;3:36–40. doi: 10.1016/0169-5347(88)90045-6. [DOI] [PubMed] [Google Scholar]
- 4.Leutenegger W. Maternal-fetal weight relationships in primates. Folia Primatol (Basel) 1973;20:280–293. doi: 10.1159/000155580. [DOI] [PubMed] [Google Scholar]
- 5.Tardif SD, Jaquish CE. The common marmoset as a model for nutritional impacts upon reproduction. Ann N Y Acad Sci. 1994;709:214–215. doi: 10.1111/j.1749-6632.1994.tb30405.x. [DOI] [PubMed] [Google Scholar]
- 6.Marroig G, Cheverud J. Size as a line of least resistance II: direct selection on size or correlated response due to constraints? Evolution. 2010;64:1470–1488. doi: 10.1111/j.1558-5646.2009.00920.x. [DOI] [PubMed] [Google Scholar]
- 7.Kondas K, Szlama G, Trexler M, Patthy L. Both WFIKKN1 and WFIKKN2 have high affinity for growth and differentiation factors 8 and 11. J Biol Chem. 2008;283:23677–23684. doi: 10.1074/jbc.M803025200. [DOI] [PMC free article] [PubMed] [Google Scholar]
- 8.Bailey JA, Yavor AM, Massa HF, Trask BJ, Eichler EE. Segmental duplications: organization and impact within the current human genome project assembly. Genome Res. 2001;11:1005–1017. doi: 10.1101/gr.187101. [DOI] [PMC free article] [PubMed] [Google Scholar]
- 9.Bailey JA, et al. Recent segmental duplications in the human genome. Science. 2002;297:1003–1007. doi: 10.1126/science.1072047. [DOI] [PubMed] [Google Scholar]
- 10.Lander ES, et al. Initial sequencing and analysis of the human genome. Nature. 2001;409:860–921. doi: 10.1038/35057062. [DOI] [PubMed] [Google Scholar]
- 11.Cheng Z, et al. A genome-wide comparison of recent chimpanzee and human segmental duplications. Nature. 2005;437:88–93. doi: 10.1038/nature04000. [DOI] [PubMed] [Google Scholar]
- 12.C. S. a. A Consortium. Initial sequence of the chimpanzee genome and comparison with the human genome. Nature. 2005;437:69–87. doi: 10.1038/nature04072. [DOI] [PubMed] [Google Scholar]
- 13.Locke DP, et al. Comparative and demographic analysis of orang-utan genomes. Nature. 2011;469:529–533. doi: 10.1038/nature09687. [DOI] [PMC free article] [PubMed] [Google Scholar]
- 14.Gibbs RA, et al. Evolutionary and biomedical insights from the rhesus macaque genome. Science. 2007;316:222–234. doi: 10.1126/science.1139247. [DOI] [PubMed] [Google Scholar]
- 15.Wang QF, et al. Detection of weakly conserved ancestral mammalian regulatory sequences by primate comparisons. Genome Biol. 2007;8:R1. doi: 10.1186/gb-2007-8-1-r1. [DOI] [PMC free article] [PubMed] [Google Scholar]
- 16.Wang QF, et al. Primate-specific evolution of an LDLR enhancer. Genome Biol. 2006;7:R68. doi: 10.1186/gb-2006-7-8-r68. [DOI] [PMC free article] [PubMed] [Google Scholar]
- 17.del Rosario RCH, Rayan NA, Prabhakar S. Repetitive Origins and Neuronal Bias of Recently Evolved Functional Elements in the Human Genome. Genome Research. 2014 In Press. [Google Scholar]
- 18.Potter SC, et al. The Ensembl Analysis Pipeline. Genome Research. 2004;14:934–941. doi: 10.1101/gr.1859804. [DOI] [PMC free article] [PubMed] [Google Scholar]
- 19.Kosiol C, et al. Patterns of positive selection in six Mammalian genomes. PLoS Genet. 2008;4:e1000144. doi: 10.1371/journal.pgen.1000144. [DOI] [PMC free article] [PubMed] [Google Scholar]
- 20.Choi JH, et al. Clinical and functional characteristics of a novel heterozygous mutation of the IGF1R gene and IGF1R haploinsufficiency due to terminal 15q26.2->qter deletion in patients with intrauterine growth retardation and postnatal catch-up growth failure. The Journal of clinical endocrinology and metabolism. 2011;96:E130–134. doi: 10.1210/jc.2010-1789. [DOI] [PubMed] [Google Scholar]
- 21.Fang P, et al. Severe Short Stature Caused by Novel Compound Heterozygous Mutations of the Insulin-Like Growth Factor 1 Receptor (IGF1R) The Journal of clinical endocrinology and metabolism. 2012;97:E243–247. doi: 10.1210/jc.2011-2142. [DOI] [PubMed] [Google Scholar]
- 22.Kumar P, Henikoff S, Ng PC. Predicting the effects of coding non-synonymous variants on protein function using the SIFT algorithm. Nat Protoc. 2009;4:1073–1081. doi: 10.1038/nprot.2009.86. [DOI] [PubMed] [Google Scholar]
- 23.Adzhubei IA, et al. A method and server for predicting damaging missense mutations. Nat Methods. 2010;7:248–249. doi: 10.1038/nmeth0410-248. [DOI] [PMC free article] [PubMed] [Google Scholar]
- 24.Harris RA, et al. Evolutionary genetics and implications of small size and twinning in callitrichine primates. Proc Natl Acad Sci U S A. 2014;111:1467–1472. doi: 10.1073/pnas.1316037111. [DOI] [PMC free article] [PubMed] [Google Scholar]
- 25.Bodin L, et al. A novel mutation in the bone morphogenetic protein 15 gene causing defective protein secretion is associated with both increased ovulation rate and sterility in Lacaune sheep. Endocrinology. 2007;148:393–400. doi: 10.1210/en.2006-0764. [DOI] [PubMed] [Google Scholar]
- 26.Hoekstra C, et al. Dizygotic twinning. Human reproduction update. 2008;14:37–47. doi: 10.1093/humupd/dmm036. [DOI] [PubMed] [Google Scholar]
- 27.Palmer JS, et al. Novel variants in growth differentiation factor 9 in mothers of dizygotic twins. The Journal of clinical endocrinology and metabolism. 2006;91:4713–4716. doi: 10.1210/jc.2006-0970. [DOI] [PubMed] [Google Scholar]
- 28.Galloway SM, et al. Mutations in an oocyte-derived growth factor gene (BMP15) cause increased ovulation rate and infertility in a dosage-sensitive manner. Nat Genet. 2000;25:279–283. doi: 10.1038/77033. [DOI] [PubMed] [Google Scholar]
- 29.Vinzing M, et al. NAIP and Ipaf control Legionella pneumophila replication in human cells. J Immunol. 2008;180:6808–6815. doi: 10.4049/jimmunol.180.10.6808. [DOI] [PubMed] [Google Scholar]
- 30.Zhao Y, et al. The NLRC4 inflammasome receptors for bacterial flagellin and type III secretion apparatus. Nature. 2011;477:596–600. doi: 10.1038/nature10510. [DOI] [PubMed] [Google Scholar]
- 31.McNerney ME, Guzior D, Kumar V. 2B4 (CD244)-CD48 interactions provide a novel MHC class I-independent system for NK-cell self-tolerance in mice. Blood. 2005;106:1337–1340. doi: 10.1182/blood-2005-01-0357. [DOI] [PMC free article] [PubMed] [Google Scholar]
- 32.Lloyd CM, Hessel EM. Functions of T cells in asthma: more than just T(H)2 cells. Nat Rev Immunol. 2010;10:838–848. doi: 10.1038/nri2870. [DOI] [PMC free article] [PubMed] [Google Scholar]
- 33.Dorus S, Evans PD, Wyckoff GJ, Choi SS, Lahn BT. Rate of molecular evolution of the seminal protein gene SEMG2 correlates with levels of female promiscuity. Nature genetics. 2004;36:1326–1329. doi: 10.1038/ng1471. [DOI] [PubMed] [Google Scholar]
- 34.Schlecht U, et al. Expression profiling of mammalian male meiosis and gametogenesis identifies novel candidate genes for roles in the regulation of fertility. Mol Biol Cell. 2004;15:1031–1043. doi: 10.1091/mbc.E03-10-0762. [DOI] [PMC free article] [PubMed] [Google Scholar]
- 35.Sharma N, Kaur J, Xu H, Zur Nieden N, Rancourt D. Characterization of secretory leukocyte protease inhibitor as an inhibitor of implantation serine proteinases. Mol Reprod Dev. 2008;75:1136–1142. doi: 10.1002/mrd.20855. [DOI] [PubMed] [Google Scholar]
- 36.Pavlopoulou A, Pampalakis G, Michalopoulos I, Sotiropoulou G. Evolutionary history of tissue kallikreins. PLoS One. 2010;5:e13781. doi: 10.1371/journal.pone.0013781. [DOI] [PMC free article] [PubMed] [Google Scholar]
- 37.Caughey GH. Mast cell tryptases and chymases in inflammation and host defense. Immunol Rev. 2007;217:141–154. doi: 10.1111/j.1600-065X.2007.00509.x. [DOI] [PMC free article] [PubMed] [Google Scholar]
- 38.Trivedi NN, Tong Q, Raman K, Bhagwandin VJ, Caughey GH. Mast cell alpha and beta tryptases changed rapidly during primate speciation and evolved from gamma-like transmembrane peptidases in ancestral vertebrates. Journal of immunology. 2007;179:6072–6079. doi: 10.4049/jimmunol.179.9.6072. [DOI] [PMC free article] [PubMed] [Google Scholar]
- 39.Schwartz S, et al. Human-mouse alignments with BLASTZ. Genome Res. 2003;13:103–107. doi: 10.1101/gr.809403. [DOI] [PMC free article] [PubMed] [Google Scholar]
- 40.Sadowski T, Dietrich S, Koschinsky F, Sedlacek R. Matrix metalloproteinase 19 regulates insulin-like growth factor-mediated proliferation, migration, and adhesion in human keratinocytes through proteolysis of insulin-like growth factor binding protein-3. Mol Biol Cell. 2003;14:4569–4580. doi: 10.1091/mbc.E03-01-0009. [DOI] [PMC free article] [PubMed] [Google Scholar]
- 41.Cheung VG, Sherman SL, Feingold E. Genetics. Genetic control of hotspots. Science. 2010;327:791–792. doi: 10.1126/science.1187155. [DOI] [PubMed] [Google Scholar]
- 42.Myers S, et al. Drive against hotspot motifs in primates implicates the PRDM9 gene in meiotic recombination. Science. 2010;327:876–879. doi: 10.1126/science.1182363. [DOI] [PMC free article] [PubMed] [Google Scholar]
- 43.Fumasoni I, et al. Family expansion and gene rearrangements contributed to the functional specialization of PRDM genes in vertebrates. BMC Evol Biol. 2007;7:187. doi: 10.1186/1471-2148-7-187. [DOI] [PMC free article] [PubMed] [Google Scholar]
- 44.Alexander DH, Novembre J, Lange K. Fast model-based estimation of ancestry in unrelated individuals. Genome Res. 2009;19:1655–1664. doi: 10.1101/gr.094052.109. [DOI] [PMC free article] [PubMed] [Google Scholar]
- 45.Falush D, Stephens M, Pritchard JK. Inference of population structure using multilocus genotype data: linked loci and correlated allele frequencies. Genetics. 2003;164:1567–1587. doi: 10.1093/genetics/164.4.1567. [DOI] [PMC free article] [PubMed] [Google Scholar]
- 46.Pritchard JK, Stephens M, Donnelly P. Inference of population structure using multilocus genotype data. Genetics. 2000;155:945–959. doi: 10.1093/genetics/155.2.945. [DOI] [PMC free article] [PubMed] [Google Scholar]
- 47.Pollard KS, et al. An RNA gene expressed during cortical development evolved rapidly in humans. Nature. 2006;443:167–172. doi: 10.1038/nature05113. [DOI] [PubMed] [Google Scholar]
- 48.Enard W. FOXP2 and the role of cortico-basal ganglia circuits in speech and language evolution. Curr Opin Neurobiol. 2011;21:415–424. doi: 10.1016/j.conb.2011.04.008. [DOI] [PubMed] [Google Scholar]
- 49.Kingsley CB. Identification of causal sequence variants of disease in the next generation sequencing era. Methods Mol Biol. 2011;700:37–46. doi: 10.1007/978-1-61737-954-3_3. [DOI] [PubMed] [Google Scholar]
- 50.Perelman P, et al. A molecular phylogeny of living primates. PLoS Genet. 2011;7:e1001342. doi: 10.1371/journal.pgen.1001342. [DOI] [PMC free article] [PubMed] [Google Scholar]
- 51.Ewing B, Green P. Base-calling of automated sequencer traces using phred. II. Error probabilities. Genome Res. 1998;8:186–194. [PubMed] [Google Scholar]
- 52.Huang X, Wang J, Aluru S, Yang SP, Hillier L. PCAP: a whole-genome assembly program. Genome Res. 2003;13:2164–2170. doi: 10.1101/gr.1390403. [DOI] [PMC free article] [PubMed] [Google Scholar]
- 53.Kent WJ, Baertsch R, Hinrichs A, Miller W, Haussler D. Evolution’s cauldron: duplication, deletion, and rearrangement in the mouse and human genomes. Proc Natl Acad Sci U S A. 2003;100:11484–11489. doi: 10.1073/pnas.1932072100. [DOI] [PMC free article] [PubMed] [Google Scholar]
- 54.Shin H, et al. Transcriptome analysis for Caenorhabditis elegans based on novel expressed sequence tags. BMC Biol. 2008;6:30. doi: 10.1186/1741-7007-6-30. [DOI] [PMC free article] [PubMed] [Google Scholar]
- 55.Margulies M, et al. Genome sequencing in microfabricated high-density picolitre reactors. Nature. 2005;437:376–380. doi: 10.1038/nature03959. [DOI] [PMC free article] [PubMed] [Google Scholar]
- 56.Kent WJ. BLAT--the BLAST-like alignment tool. Genome Res. 2002;12:656–664. doi: 10.1101/gr.229202. [DOI] [PMC free article] [PubMed] [Google Scholar]
- 57.Consortium IAG. Genome sequence of the pea aphid Acyrthosiphon pisum. PLoS Biol. 2010;8:e1000313. doi: 10.1371/journal.pbio.1000313. [DOI] [PMC free article] [PubMed] [Google Scholar]
- 58.Curwen V, et al. The Ensembl automatic gene annotation system. Genome Res. 2004;14:942–950. doi: 10.1101/gr.1858004. [DOI] [PMC free article] [PubMed] [Google Scholar]
- 59.Bailey JA, Eichler EE. Primate segmental duplications: crucibles of evolution, diversity and disease. Nat Rev Genet. 2006;7:552–564. doi: 10.1038/nrg1895. [DOI] [PubMed] [Google Scholar]
- 60.Morgulis A, Gertz EM, Schaffer AA, Agarwala R. A fast and symmetric DUST implementation to mask low-complexity DNA sequences. J Comput Biol. 2006;13:1028–1040. doi: 10.1089/cmb.2006.13.1028. [DOI] [PubMed] [Google Scholar]
- 61.Benson G. Tandem repeats finder: a program to analyze DNA sequences. Nucleic Acids Res. 1999;27:573–580. doi: 10.1093/nar/27.2.573. [DOI] [PMC free article] [PubMed] [Google Scholar]
- 62.Down TA, Hubbard TJ. Computational detection and location of transcription start sites in mammalian genomic DNA. Genome Res. 2002;12:458–461. doi: 10.1101/gr.216102. [DOI] [PMC free article] [PubMed] [Google Scholar]
- 63.Davuluri RV, Grosse I, Zhang MQ. Computational identification of promoters and first exons in the human genome. Nat Genet. 2001;29:412–417. doi: 10.1038/ng780. [DOI] [PubMed] [Google Scholar]
- 64.Gardiner-Garden M, Frommer M. CpG islands in vertebrate genomes. J Mol Biol. 1987;196:261–282. doi: 10.1016/0022-2836(87)90689-9. [DOI] [PubMed] [Google Scholar]
- 65.Lowe TM, Eddy SR. tRNAscan-SE: a program for improved detection of transfer RNA genes in genomic sequence. Nucleic Acids Res. 1997;25:955–964. doi: 10.1093/nar/25.5.955. [DOI] [PMC free article] [PubMed] [Google Scholar]
- 66.Goujon M, et al. A new bioinformatics analysis tools framework at EMBL-EBI. Nucleic Acids Res. 2010;38:W695–699. doi: 10.1093/nar/gkq313. [DOI] [PMC free article] [PubMed] [Google Scholar]
- 67.Sayers EW, et al. Database resources of the National Center for Biotechnology Information. Nucleic Acids Res. 2010;38:D5–16. doi: 10.1093/nar/gkp967. [DOI] [PMC free article] [PubMed] [Google Scholar]
- 68.Altschul SF, Gish W, Miller W, Myers EW, Lipman DJ. Basic local alignment search tool. J Mol Biol. 1990;215:403–410. doi: 10.1016/S0022-2836(05)80360-2. [DOI] [PubMed] [Google Scholar]
- 69.Lopez R, Silventoinen V, Robinson S, Kibria A, Gish W. WU-Blast2 server at the European Bioinformatics Institute. Nucleic Acids Res. 2003;31:3795–3798. doi: 10.1093/nar/gkg573. [DOI] [PMC free article] [PubMed] [Google Scholar]
- 70.Birney E, Clamp M, Durbin R. GeneWise and Genomewise. Genome Res. 2004;14:988–995. doi: 10.1101/gr.1865504. [DOI] [PMC free article] [PubMed] [Google Scholar]
- 71.Slater GS, Birney E. Automated generation of heuristics for biological sequence comparison. BMC Bioinformatics. 2005;6:31. doi: 10.1186/1471-2105-6-31. [DOI] [PMC free article] [PubMed] [Google Scholar]
- 72.Pruitt KD, Tatusova T, Klimke W, Maglott DR. NCBI Reference Sequences: current status, policy and new initiatives. Nucleic Acids Res. 2009;37:D32–36. doi: 10.1093/nar/gkn721. [DOI] [PMC free article] [PubMed] [Google Scholar]
- 73.Eyras E, Caccamo M, Curwen V, Clamp M. ESTGenes: alternative splicing from ESTs in Ensembl. Genome Res. 2004;14:976–987. doi: 10.1101/gr.1862204. [DOI] [PMC free article] [PubMed] [Google Scholar]
- 74.Lewis SE, et al. Apollo: a sequence annotation editor. Genome Biol. 2002;3:RESEARCH0082. doi: 10.1186/gb-2002-3-12-research0082. [DOI] [PMC free article] [PubMed] [Google Scholar]
- 75.Morgulis A, Gertz EM, Schaffer AA, Agarwala R. WindowMasker: window-based masker for sequenced genomes. Bioinformatics. 2006;22:134–141. doi: 10.1093/bioinformatics/bti774. [DOI] [PubMed] [Google Scholar]
- 76.Marques-Bonet T, et al. A burst of segmental duplications in the genome of the African great ape ancestor. Nature. 2009;457:877–881. doi: 10.1038/nature07744. [DOI] [PMC free article] [PubMed] [Google Scholar]
- 77.Thomas DJ, et al. The ENCODE Project at UC Santa Cruz. Nucleic Acids Res. 2007;35:D663–667. doi: 10.1093/nar/gkl1017. [DOI] [PMC free article] [PubMed] [Google Scholar]
- 78.Creighton CJ, Reid JG, Gunaratne PH. Expression profiling of microRNAs by deep sequencing. Brief Bioinform. 2009;10:490–497. doi: 10.1093/bib/bbp019. [DOI] [PMC free article] [PubMed] [Google Scholar]
- 79.Creighton CJ, et al. Discovery of novel microRNAs in female reproductive tract using next generation sequencing. PLoS One. 2010;5:e9637. doi: 10.1371/journal.pone.0009637. [DOI] [PMC free article] [PubMed] [Google Scholar]
- 80.Kozomara A, Griffiths-Jones S. miRBase: integrating microRNA annotation and deep-sequencing data. Nucleic Acids Res. 2011;39:D152–157. doi: 10.1093/nar/gkq1027. [DOI] [PMC free article] [PubMed] [Google Scholar]
- 81.Griffiths-Jones S, Saini HK, van Dongen S, Enright AJ. miRBase: tools for microRNA genomics. Nucleic Acids Res. 2008;36:D154–158. doi: 10.1093/nar/gkm952. [DOI] [PMC free article] [PubMed] [Google Scholar]
- 82.Katoh K, Misawa K, Kuma K, Miyata T. MAFFT: a novel method for rapid multiple sequence alignment based on fast Fourier transform. Nucleic Acids Res. 2002;30:3059–3066. doi: 10.1093/nar/gkf436. [DOI] [PMC free article] [PubMed] [Google Scholar]
- 83.Gerlach D, Kriventseva EV, Rahman N, Vejnar CE, Zdobnov EM. miROrtho: computational survey of microRNA genes. Nucleic Acids Res. 2009;37:D111–117. doi: 10.1093/nar/gkn707. [DOI] [PMC free article] [PubMed] [Google Scholar]
- 84.Eisen MB, Spellman PT, Brown PO, Botstein D. Cluster analysis and display of genome-wide expression patterns. Proc Natl Acad Sci U S A. 1998;95:14863–14868. doi: 10.1073/pnas.95.25.14863. [DOI] [PMC free article] [PubMed] [Google Scholar]
- 85.Vejnar CE, Zdobnov EM. MiRmap: comprehensive prediction of microRNA target repression strength. Nucleic Acids Res. 2012;40:11673–11683. doi: 10.1093/nar/gks901. [DOI] [PMC free article] [PubMed] [Google Scholar]
- 86.Kertesz M, Iovino N, Unnerstall U, Gaul U, Segal E. The role of site accessibility in microRNA target recognition. Nat Genet. 2007;39:1278–1284. doi: 10.1038/ng2135. [DOI] [PubMed] [Google Scholar]
- 87.Stark A, et al. Discovery of functional elements in 12 Drosophila genomes using evolutionary signatures. Nature. 2007;450:219–232. doi: 10.1038/nature06340. [DOI] [PMC free article] [PubMed] [Google Scholar]
- 88.Pollard KS, Hubisz MJ, Rosenbloom KR, Siepel A. Detection of nonneutral substitution rates on mammalian phylogenies. Genome Res. 2010;20:110–121. doi: 10.1101/gr.097857.109. [DOI] [PMC free article] [PubMed] [Google Scholar]
- 89.Grimson A, et al. MicroRNA targeting specificity in mammals: determinants beyond seed pairing. Molecular cell. 2007;27:91–105. doi: 10.1016/j.molcel.2007.06.017. [DOI] [PMC free article] [PubMed] [Google Scholar]
- 90.Rhead B, et al. The UCSC Genome Browser database: update 2010. Nucleic Acids Res. 2010;38:D613–619. doi: 10.1093/nar/gkp939. [DOI] [PMC free article] [PubMed] [Google Scholar]
- 91.Hahn MW, De Bie T, Stajich JE, Nguyen C, Cristianini N. Estimating the tempo and mode of gene family evolution from comparative genomic data. Genome Res. 2005;15:1153–1160. doi: 10.1101/gr.3567505. [DOI] [PMC free article] [PubMed] [Google Scholar]
- 92.Springer MS, et al. The adequacy of morphology for reconstructing the early history of placental mammals. Syst Biol. 2007;56:673–684. doi: 10.1080/10635150701491149. [DOI] [PubMed] [Google Scholar]
- 93.Yang Z, Nielsen R. Codon-substitution models for detecting molecular adaptation at individual sites along specific lineages. Mol Biol Evol. 2002;19:908–917. doi: 10.1093/oxfordjournals.molbev.a004148. [DOI] [PubMed] [Google Scholar]
- 94.Ng PC, Henikoff S. Predicting deleterious amino acid substitutions. Genome Res. 2001;11:863–874. doi: 10.1101/gr.176601. [DOI] [PMC free article] [PubMed] [Google Scholar]
- 95.Zerbino DR, Birney E. Velvet: algorithms for de novo short read assembly using de Bruijn graphs. Genome Res. 2008;18:821–829. doi: 10.1101/gr.074492.107. [DOI] [PMC free article] [PubMed] [Google Scholar]
- 96.Li H. A statistical framework for SNP calling, mutation discovery, association mapping and population genetical parameter estimation from sequencing data. Bioinformatics. 2011;27:2987–2993. doi: 10.1093/bioinformatics/btr509. [DOI] [PMC free article] [PubMed] [Google Scholar]
- 97.Xing J, et al. Fine-scaled human genetic structure revealed by SNP microarrays. Genome Res. 2009;19:815–825. doi: 10.1101/gr.085589.108. [DOI] [PMC free article] [PubMed] [Google Scholar]
- 98.Purcell S, et al. PLINK: a tool set for whole-genome association and population-based linkage analyses. Am J Hum Genet. 2007;81:559–575. doi: 10.1086/519795. [DOI] [PMC free article] [PubMed] [Google Scholar]
- 99.Rozen S, Skaletsky H. Primer3 on the WWW for general users and for biologist programmers. Methods Mol Biol. 2000;132:365–386. doi: 10.1385/1-59259-192-2:365. [DOI] [PubMed] [Google Scholar]
Associated Data
This section collects any data citations, data availability statements, or supplementary materials included in this article.