

Abstract
Molecular imaging with photoacoustic ultrasound is an emerging field that combines the spatial and temporal resolution of ultrasound with the contrast of optical imaging. However, there are few imaging agents that offer both high signal intensity and biodegradation into small molecules. Here we describe a cellulose-based nanoparticle with peak photoacoustic signal at 700 nm and an in vitro limit of detection of 6 pM (0.02 mg/mL). Doses down to 0.35 nM (1.2 mg/mL) were used to image mouse models of ovarian cancer. Most importantly, the nanoparticles were shown to biodegrade in the presence of cellulase both through a glucose assay and electron microscopy.
Keywords: Photoacoustic imaging, Optoacoustic, Biodegradation, Cellulose, Nanoparticle, Ovarian cancer
1. Introduction
Photoacoustic imaging (PAI) has been used extensively in pre-clinical models of human disease including prostate [1], breast [2], and ovarian cancer [3]. This modality produces contrast by converting nanosecond light pulses into an acoustic signal and offers significant improvements in spatial resolution relative to other optics-based approach [4–6]. Ovarian cancer in particular could eventually benefit from PAI due to the existing widespread use of trans-abdominal or trans-vaginal ultrasound in the screening and management of ovarian cancer [7,8]. PAI can use either endogenous signal from hemoglobin, deoxyhemoglobin, melanin, etc. or an exogenous imaging agent can be applied, which is typical for in molecular imaging experiments.
Many materials produce photoacoustic signal and can be broadly grouped as small molecules and nanoparticles. Both types offer a range of PA signal. Small molecule agents include methylene blue [9] or indocyanine green [10] with very intensephotoacoustic signal. Fluorophore, fluorescent proteins [11], quenchers [12], and activatable hybrid molecules [13,14] are also members of this category. Nanoparticle-based PAI uses gold nanoparticles, gold/silica hybrids [15,16], carbon-based particles [17,18], porphysomes [19], iron oxide nanoparticles, copper sulfide [20], and others [14,21,22]. Other nanoparticles such as poly-lactic-glutamic acid or poly-caprolactone have poor photoacoustic signal. However—on a molar basis—nanoparticles usually out-perform small molecule fluorophore.
While nanoparticles do offer robust and stable photoacoustic signal, they are hampered by poor biodistribution and clearance profiles. Indeed, one of the most common limitations of all nanoparticle imaging agents is non-specific, long term liver and spleen accumulation. While porphysomes [19] and plasmonic nanoclusters containing 5 nm gold particles linked for red-shifted resonances [23,24] may offer renal clearance, their full utility in small animal models remains unclear. Any agent that combines the signal intensity of nanoparticles with the renal clearance of small molecules would have a significant advantage toward clinical translation.
We thus considered a wide variety of naturally occurring, optically active biodegradable materials. Of interest as an alternative to solid metal nanoparticles or carbon nanotubes is cellulose [25–27]. This material has a crystalline structure [28], is readily available from renewable sources, well characterized, and easily manipulated through a variety of chemical processes [29]. Cellulose is a routine component of the human diet and has very well defined clearance pathways in ruminants and rodents via cellulase. Furthermore, cellulose has been transformed into a variety of crystalline nanoparticle forms for materials science applications [26,30]. These cellulose nanoparticles are formed by treating the biomass with concentrated sulfuric acid for acid hydrolysis to remove disordered or paracrystalline cellulose with highly ordered crystalline areas remaining intact [31].
In this work, we hypothesized that cellulose in crystalline nanoparticle form could be used as a biodegradable PAI agent. We made cellulose nanoparticles (CNPs) from cotton cellulose and performed physical and toxicological characterization. We then did a series of ex vivo experiments to quantitate the PA signal produced by the material as well as in vivo experiments to understand its utility in a small animal model of human ovarian cancer. Finally, we demonstrate that the imaging agent can biodegrade into simple sugars. To the best of our knowledge, this is the first report of a cellulose-based imaging agent and among the few reported biodegradable photoacoustic imaging agents with important advantages for clinical translation.
2. Materials and methods
2.1. Reagents
The cellulose source was cotton linters from Arnold Grummer Corp. Concentrated sulfuric acid and phosphosphate buffered saline (PBS) was purchased from Fisher. Cellulase from Aspergillus niger and glacial acetic acid were purchased from Sigma and Fisher, respectively, and used without further purification. Modified Alamar Blue reagent (“Presto Blue”) was acquired from Invitrogen. All water was purified to 18 MΩ and then filtered through 0.2 μm filter.
2.2. CNP synthesis
The CNPs were made with a protocol adapted from the literature [26]. Briefly, 500 mg of cellulose was added to 15 mL of water in an Erlenmeyer flask with magnetic stirring. 28 mL of 18 M sulfuric acid was added and the exothermic reaction was allowed to cool back to room temperature over 3 h. The material was then centrifuged for 10 min at 6000 RPM and the supernatant decanted and the pellet re-suspended with distilled water. The product was then dialyzed with a 3500 molecular weight cutoff membrane (Pierce) for at least 24 h and then adjusted to pH 7 with 0.1 N NaOH. We dried known volumes of CNPs in a 90 °C oven overnight and weighed the resulting powder to calculate the mass concentration.
2.3. Equipment
The CNP size and zeta potential were obtained via dynamic light scattering (DLS) on a Zetasizer-90 instrument from Malvern Instruments (Worcestershire, UK). The measurements were made in 50% PBS/50% water. A Synergy 4 (Biotek) microplate reader was used for cell assays and absorbance measurements. All transmission electron microscopy (TEM) and energy-dispersive x-ray spectroscopy (EDS) was performed with a Tecnai G2 X-Twin (FEI Co.) instrument operating at 200 kV.
A tomographic photoacoustic scanner (Nexus 128; Endra Life Sciences) was used for animal imaging [32,33]. Briefly, the Nexus uses an optical parametric oscillator (OPO) tunable laser and 128 detectors submerged in hemispherical bowl filled with water stabilized at 38 °C. The animal or sample to be imaged is placed in a tray that lies on top of the water in the center of the bowl. This tray contains a central indentation or dimple to immobilize a subcutaneous tumor or ex vivo sample for consistent spatial location. Optimization scans used 60 views with 25 replicate pulses. Animal scans rotated the bowl through 120 views (3° each) with 75 pulses per view with 8 min scan times. The incident radiation was selected during scan setup. The fluence is ∼4 mJ/cm2.
For spectral PA studies, a linear array scanner (LAZR; Visualsonics Corp.) was used for planar imaging due to the high throughput nature of this imaging instrument. It was equipped with a 21 MHz-centered transducer as described previously [34,35]. This instrument also uses an OPO laser operating at 20 Hz between 680 and 970 nm. Step sizes are 1 nm with 4–6 ns pulse width. The spot size is 1 mm × 24 mm and the full field-of-view is 14–23 mm wide. Images were acquired at 5 frames per second, and peak energy at the source is 45 ± 5 mJ at 20 Hz.
2.4. Cell culture and animal handling
In vivo imaging and in vitro studies used the OV2008 (also known as 2008) cell line. These cells were grown in DMEM supplemented with fetal bovine serum and antibiotics/antimycotics. Toxicity assays used a derivative of the Alamar Blue assay (Presto Blue) [37]. Here, 10,000 cells/well were plated and analyzed in replicate (n = 8). Cells were exposed to increasing concentrations of CNPs for 18 h, 24 h after plating. Assay readout used 540 nm excitation and 600 nm emission.
Female nu/nu mice age 6–16 weeks were used for these studies and each data point includes three mice unless otherwise noted. Before handling, animals were anesthetized with 2% isofluorane in oxygen at 1–3 L/min. To create subcutaneous xenograft tumors, we implanted 107 cells in 50% growth factor reduced matrigel/50% PBS into the hind limb of a nude mouse. Tumors were imaged when they reached 500 mm3, typically 1–2 weeks after implantation. The Administrative Panel on Laboratory Animal Care at Stanford University approved all work with animals.
2.5. Biodegradation experiments
These experiments followed established protocols [38]. A solution containing 1.5 mM nicotinamide adenine dinucleotide (NAD), 1.0 mM ATP, 1.0 unit/mL of hexokinase, and 1.0 unit/mL of glucose-6-phosphate dehydrogenase was obtained from Sigma (p/n G3293). CNPs and cellulose standards were brought to 1 mg/mL in 0.05 M acetic acid (pH = 5.0). d-Glucose standards (250–5 μg/mL) were prepared in the same acetic acid solution. Cellulase (5 U/mL) was prepared in cold distilled water. 4 mL of CNPs and controls were added to borosilicate test tubes followed by 1 mL of cellulase or water as a control. The solution was incubated at 37 °C with shaking. Aliquots were periodically removed and the cellulase activity quenched by placing the aliquots in an ice bath. The samples were centrifuged for 12 min at 12,000 RPM to removed unreacted materials. 40 μL aliquots of the supernatant and glucose standards were then placed in triplicate in a 96 well plate; 100 μL of the HK solution was added and allowed to react at room temperature for 15–17 min. Absorbance at 340 nm was measured and used to construct a standard curve and estimate available glucose.
2.6. Data analysis
PA data was reconstructed with a filtered backprojection algorithm proposed by Wang et al. [39]. Amide software (http://sourceforge.net/projects/amide/) was used to create renderings of the images and all images were thresholded to the same value [40]. To quantitate the images, we used MicroView (General Electric Corp.) software. A region of interest (ROI) 15 mm × 15 mm × 15 mm was created around the sample and the mean intensity extracted. This intensity was assigned values of arbitrary units (a.u.) and used for the analysis and discussion below. We defined the limit of detection (LOD; sensitivity) as the concentration detectable 3 standard deviations above the signal of the blank. The time to half max (T½) is the time halfway between the pre-injection time point and maximum signal.
2.7. Statistical treatment
To determine the average and standard deviations of data sets, the Excel functions “AVERAGE” and “STDEV” were used. Other metrics include the standard error of the mean that was computed by dividing the standard deviation by the square root of n samples. Relative standard deviation (RSD) was computed by dividing the standard deviation by the average. Significance testing used a two tailed, t-test through the “TTEST” function in Excel.
3. Results
Our goal was to construct, characterize, and utilize a biodegradable PAI agent with a small animal model of human ovarian cancer. The research findings can be broadly grouped as physical characterization, toxicity and cytotoxicity, ex vivo biodegradation, and PAI.
3.1. Physical characterization
During the synthesis the solution turned from an opaque white with suspended cellulose that readily settled, to a dark brown colloidal suspension. After purification, the CNPs from cotton linters could be concentrated by centrifugation and were stable with no sign of degradation over 18 months.
The CNPs were dissolved in water to an optical density of ∼0.2 and studied with TEM, absorbance spectroscopy, and DLS. Although literature suggested using uranyl acetate for increased contrast [26], we found that the presence of such additional treatment was optional and collected the images presented in Fig. 1 in the absence of positive staining. TEM images were analyzed with ImageJ to determine the mean diameter, which was 132 ± 46 nm. The DLS data (Fig. 1D) in 50:50 water:PBS presents particles with a mean size between 160 and 200 nm, a polydispersity index of 0.138, and a neutral zeta potential. Their weight concentration was 2.4 mg/mL. Using the 1.5 g/cm3 density of cellulose [41], we calculated the molecular weight of these 3.8 × 10⁶ nm3 CNPs to be 3.4 × 10⁹ g/mol or 0.70 nM in the 2.4 mg/mL batch. Absorbance spectroscopy data in Fig. 1E indicates Rayleigh scatter and suggest that the CNPs have their most intense interaction with light in the visible range of the spectrum. We contrast this with gold nanorods at 0.34 nM and show the typical near infra-red absorbance peak for this material.
Fig. 1.
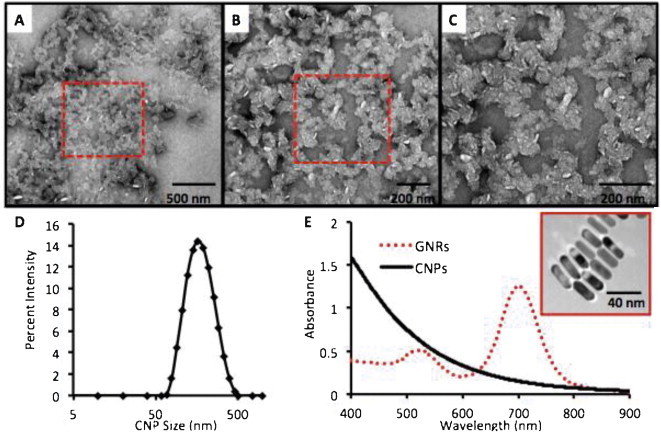
Physical characterization of CNPs. CNPs were examined with TEM at increasing magnification (A–C) and show amorphous and anisotropically shaped nanoparticles with dimensions of 132 ± 46 nm. Red box in panels (A) and (B) indicates the subsequent higher magnification image in panel (C). (D) The hydrodynamic radius by DLS was 196.0 nm with a PDI of 0.138. (E) The absorbance spectra of CNPs at 0.077 mg/mL (0.023 nM) in PBS show Rayleigh scattering with maximum absorbance in the UV visible region (black line). This is in contrast to gold nanorods at 0.34 nM (red dashed line) with a resonance tuned to 700 nm. Inset in (E) shows gold nanorods with dimensions of 40.0 nm × 13.2 nm used for signal comparisons.
We next characterized the capacity of the CNPs to generate photoacoustic signal, and the first step was optimization of the imaging wavelength. Because in vivo imaging was the ultimate goal, we subcutaneously injected a 100 μL bolus of 0.6 mg/mL CNPs in 50% matrigel into the rear limb of a nude mouse. The PA intensity spectrum of the injected bolus was collected with the linear array scanner described above and is plotted in Fig. 2A. Also plotted is the spectrum of normal tissue not treated with CNPs. The data suggests that optimal signal occurs at 700 nm—that wavelength was used for all subsequent experiments. We calculated the molar extinction coefficient at 700 nm to be 8.74 × 10⁹ M−1 cm−1. From literature [42], the GNRs are known to be 3.59 × 10⁹ M−1 cm−1.
Fig. 2.
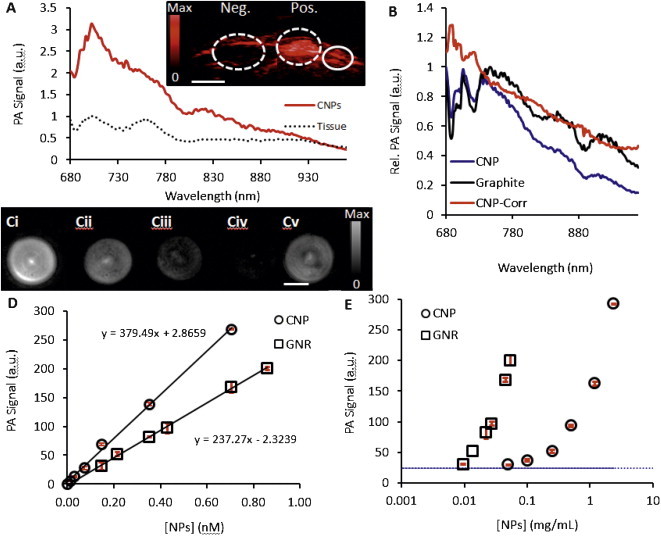
Photoacoustic signaling of CNPS. (A) Spectral imaging of CNPs highlights the maximum absorbance peak at 700 nm, which was used for all subsequent imaging experiments (red solid curve). The background PA spectrum of normal tissue is also shown for reference (black dots). Inset is a photoacoustic image of a subcutaneously implanted bolus of CNPs at 0.5 mg/mL (“Pos.”) and matrigel only implant (“Neg.”). Solid circle highlights a normal region used to create the tissue-only spectrum. Scale bar in inset is 3 mm. (B) Normalized photoacoustic data for the CNPs as well as “flat” graphite absorber illustrate change in laser power as a function of wavelength that has been reported previously [32]. This allows calculation of a normalized photoacoustic spectrum for the CNP (blue) that corresponds nicely to the absorption data (Fig. 1E). (C) Representative photoacoustic imaging data of a phantom scanned with the tomographic imaging system. Ci–Civ are CNPs. Bi: 0.70 nM, Bii: 0.35 nM; Biii: 0.15 nM; Biv: 0.07 nM. Bv is 0.70 nM GNRs. Scale bar in B is 4 mm. Photoacoustic data collected with the tomographic scanner for both CNPs and GNRs with 700 nm incident radiation using either molar (D) or mass units (E). Error bars in C are plotted in red and represent the standard deviation of 3 replicate samples and are <10% RSD.
This peak at 700 nm is in contrast to the absorbance data in Fig. 1E. This discrepancy is due to differences in the laser power at different wavelengths. We have previously characterized how the power changes as a function of wavelength in both the tomographic and linear array scanner [32]. The implications of these power changes on this study are seen in Fig. 2C. Here we performed spectral imaging of both graphite and the CNPs. Graphite is well known flat absorber and could be used to compensate for different laser power. We used these known laser power differences to correct the PA spectrum of the CNPs and present a figure that agrees with the absorbance data.
Next, decreasing concentrations of CNPs were placed in the sensitive volume of the tomographic scanner and imaged with 700 nm excitation. The reconstructed maximum intensity projections are presented in Fig. 2B and highlight the concentration-dependent nature of the PA signal. Absolute quantitation is presented in Fig. 2C along with data from GNRs with dimensions of 40.0 ± 4.4 and 13.2 ± 1.8 nm, longitudinally and axially, respectively. The peak absorbance of these GNRs is 700 nm and was also used as their excitation wavelength for the comparison studies. For the CNPs, there was clear discrimination between the 0.00 nM and 0.01 nM data points (p < 0.01); the calculated LOD was 0.006 nM (0.02 mg/mL). Experiments at isomolar concentrations of CNPs and GNRs indicate that the CNPs have increased signal relative to GNRs: 3.0-fold at 0.15 nM, 2.0-fold at 0.35 nM, and 1.7-fold at 0.70 nM. Regression analysis between the molar concentration and PA signal indicates a R2 > 0.99 for both the GNRs and CNPs. The slope of the CNP curve was 1.6-fold higher than the GNR curve. It was important to also compare the CNPs and GNRs on a mass basis (Fig. 2D) because of differences in absorption cross-section. We found that with mass units, the GNRs produced equivalent signal to CNPs using 30-fold lower mass units. We also examined the in vivo LOD by subcutaneously injection CNPs dissolved in matrigel beneath the skin of nude mice and imaging that bolus. The LOD was 0.05 mg/mL.
Laser induced shape changes to GNRs are well known [43,44], and these could potentially introduce error into this comparison. To investigate, we scanned the GNRs with increasing laser dose. Each scan used 30 views (12° apart). At each angle, we used an increasing number of pulses: 1, 5, 20, 200, and 400 for a scan time of ∼20 s to 10.5 min. The signal intensity was measured with a volumetric ROI and then the sample was removed for absorbance spectroscopy. The peak absorbance of GNRs not treated with laser was 707 nm and those at 5.5 and 10.5 min of laser dose had peaks at 707 and 706 nm, respectively. The relative standard deviation in the photoacoustic signal for this experiment was 9.6%, which is within the error we reported previously for this scanner [33]. This indicates that the GNRs are stable during the imaging experiment.
The CNPs could be separated into two different fractions with centrifugation (20,000 × g for 30 min). The supernatant had a mean size of 65 nm by DLS and the re-suspended sediment was 186 nm. When the two fractions were brought to the same optical density, the photoacoustic signal in the 65 nm fraction was 1.5-fold greater than the larger fraction. For the remainder of the experiments the combined product was used without further fractionation.
3.2. Toxicity
We used in vitro tissue culture experiments and small animal models for pilot toxicity data. The CNPs were first tested with 10,000 OV2008 cells plated in each well of a 96 well plate. Increasing concentrations of CNPs were added to the growth media and allowed to incubate for 18 h. Analysis with the Presto Blue assay indicated a small, but statistically significant (p < 0.05) decrease in metabolic activity at concentrations above 0.31 mg/mL of CNPs (Fig. 3A).
Fig. 3.
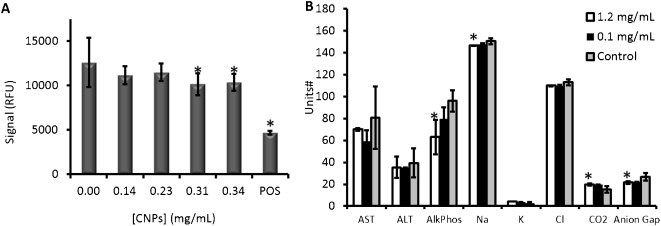
Pilot toxicity data. OV2008 cells (n = 6 replicate wells) were exposed to increasing concentrations of CNPs overnight and then analyzed with the Alamar Blue reagent. A positive control (“POS”) used 0.1 mg/mL cetyltrimethylammonium bromide as a toxic agent to validate the reagent. (B) Serum electrolyte and liver function tests from animals treated with CNPs at increasing concentrations was collected and compared to untreated animals (Control). #Units: aspartate transaminase (AST), alanine transaminase (ALT), and alkaline phosphatase (AlkPhos) – U/L; Na, K, CO2, anion gap, and K: mmol/L. Error bars in A represent the standard deviation of 6 replicates; error bars in B represent the standard deviation of 3 animals. The * indicates a statistically significant change (p < 0.05) versus control.
Next, we injected 200 μL of CNPs via tail vein in mice (n = 3) and collected whole blood retro-orbitally 24 h later for serum chemistry (Na, K, Cl, CO2, and anion gap) and liver function tests (aspartate transaminase (AST), alanine transaminase (ALT), alkaline phosphatase (AlkPhos), gamma-glutamyltransferase (GGT), and total bilirubin). Three concentrations were studied: 2.4 mg/mL, 1.2 mg/mL, 0.1 mg/mL, as well as control animals with no injection of imaging agent. The 2.4 mg/mL animals suffered a difficult recovery from anesthesia and had labored breathing several hours after the procedure; they were sacrificed before serum could be collected. The other two cohorts (1.2 mg/mL and below) had no obvious signs of toxicity including modified behavior, posture, or activity. Serum liver function tests and electrolyte data indicates no statistically significant changes for the 0.1 mg/mL cohort (p > 0.05). The 1.2 mg/mL animals had statistically significant (p < 0.05) changes to alkaline phosphatase, sodium, CO2, and the calculated anion gap. However, the levels in these animals were still within reported reference ranges [45,46]. Although not presented in Fig. 3, total bilirubin was not detectable in any of the samples and GGT was only detectable in 1 of the control animals.
3.3. Biodegradation
We used a glucose assay to evaluate the ex vivo biodegradation of the CNPs in the presence of cellulase. This assay uses hexokinase to catalyze a glucose phosphorylation from an ATP donor to give glucose-6-phosphate (G6P). G6P is then oxidized by nicotinamide adenine dinucleotide (NAD) to 6-phosphogluconate with glucose-6-phosphate dehydrogenase (G6PDH). Here an equivalent molecule of NAD is reduced to NADH with a subsequent change in absorbance at 340 nm (A340) which is directly proportional to glucose concentration [38].
This assay was validated with a calibration curve as well as positive and negative controls. The calibration curve used glucose standards from 5 to 250 μg/mL. It was linear at R2 > 0.999 and the relative standard deviation for each datum was less than 5%. The relationship between A340 and glucose concentration was used in subsequent experiments (Fig. 4A). Next, we validated the activity of the cellulase enzyme (Fig. 4B) with raw cellulose (not in nanoparticle form). Important controls here included cellulose without cellulase (Negative control; Cell − Enz.) and cellulose with cellulase (Positive control; Cell + Enz.). The results indicate that free glucose is liberated from the cellulose by cellulase, but not from the cellulose in the absence of this enzyme with A340 signal <2% of the positive control. This “cellulase-free” experiment was repeated for all of the subsequent CNP experiments shown in Fig. 4C and the A340 for these samples (due to solvent) was subtracted from the “cellulase-positive” experiments. The A340 for a “cellulase only” sample from each experiment corrected for absorbance from the enzyme's protein structure.
Fig. 4.
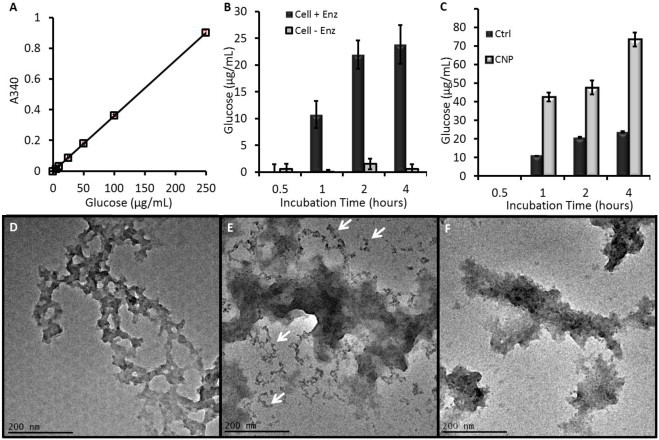
Biodegradation data of CNPs. (A) A hexokinase glucose assay was validated with standards. (B) The activity of the cellulase enzyme was validated with a cellulose standard and caused increased glucose concentration in samples with cellulase, but not the control samples. All points except 0.5 h were significant at p < 0.01. (C) Both control (raw cellulose) and CNPs produced glucose in the presence of cellulase suggesting biodegradation. Error bars in (A–C) represent the standard deviation of at least 3 replicate measurements. The CNPs had statistically elevated glucose levels that were above raw cellulose at p < 0.05 for all points above 0.5 h. (D) TEM imaging of naïve CNPs compared to CNPs treated with heat and acidic cellulase (E) and heat/acid only (F). Smaller fragments in the cellulase-treated CNPs are highlighted by black arrows.
We next examined the biodegradation of the CNPs. Samples were studied at 1 mg/mL along with naïve cellulose. The results show rapid biodegradation of cellulose and CNPs. The CNP reached ½ maximum values between 30 and 60 min (Fig. 4C). Importantly, while the starting concentrations were the same, 3.1-fold more glucose was released from the CNPs than from the cellulose standards.
Finally, we performed DLS and TEM studies on the CNPs before and after enzyme treatment. As a negative control, we also performed TEM on CNPs subjected to 37 °C heating in the acetic acid solution for 1 h, but without cellulase. The TEM images show a marked impact of cellulase treatment on the CNPs. Naïve CNPs (Fig. 4D) show a morphology typical of Fig. 1A, while CNPs treated with cellulase for 1 h show small fragments near the main body of the nanoparticle (red arrows, Fig. 4E). ROI analysis on 25 of these fragments from multiple fields of view determined the size to be 12.0 nm ± 3.2 nm. Further quantification across at least 10 different fields of view indicated that each field in the enzyme treated sample contained 23 ± 14 fragments versus 4 ± 4 fragments in the control sample, a five-fold increase that was significant at p < 0.01. Less than 1 such 12 nm fragment was seen per field-of-view in the pre-treatment CNP samples. There was no difference in the DLS data for any of the samples, but an increase in PDI was seen from 0.083 to 0.434.
3.4. In vivo PA imaging
The final group of experiments studied the in vivo imaging potential of CNPs. Nude mice bearing subcutaneous xenograft tumors from the OV2008 cell line between 500 and 1000 mm3 were fitted with a tail vein catheter and the tumor placed in the imaging dimple of the tomographic scanner. Scans were collected prior to injection of contrast and 1, 15, 30, 45, and 60 min post-injection. Because there is a wide variety in the baseline photoacoustic signal between animals, each mouse was considered to be its own control, and the PA signal for each scan is plotted relative to the pre-injection signal (Fig. 5A).
Fig. 5.
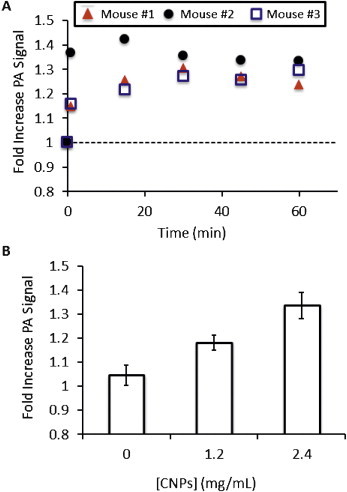
In vivo imaging with CNPs. (A) Time-activity curves of CNP in a subcutaneous murine model of human ovarian cancer (OV2008 line). Three different animals were imaged before (0) and 1, 15, 30, 45, and 60 min after tail-vein injection of 200 μL of 2.4 mg/mL CNPs and photoacoustic signal was divided by the PA signal pre-injection to give the relative units graphed here. The dashed line indicates no increase above baseline. All three animals showed maximum intensity 15–30 min after injection. This pattern was also seen at the other concentration values presented in panel (B). In Panel B the fold-increase above baseline is again plotted and all concentration values examined here are statistically significant above baseline at p < 0.05. Error bars in (B) represent the standard error for the three animals and the relationship between PA signal and concentration of injected contrast was linear at R2 > 0.96.
We imaged at 1.2 mg/mL and 2.4 mg/mL with a constant injection volume of 200 μL. This dose may alternatively be expressed as 0.024 mg and 0.048 mg or 0.07 nmol and 0.14 nmol. A group without injected contrast was also studied (sham injection). Three mice were imaged at each point. Although only the 2.4 mg/mL cohort are shown in Fig. 5A, the remaining data sets were very similar with maximum PA signal occurring between 15 and 30 min post injection and T½ between 7 and 15 min. In Fig. 5B, the maximum fold increase above baseline is plotted for the different concentration regimes. The relationship between injected concentration and signal increase is linear at R2 > 0.98. A washout period within 30 min after peak intensity was then seen, however tumor PA signal did not return to the baseline level during the imaging session and decreased by at most 20%. After data collection, the imaging data was rendered as maximum intensity projection images along the axial plane (Fig. 6). These images show an obvious increase in the tumor signal when the pre-injection (Fig. 6B–E) are compared to the post-injection images (Fig. 6Bi–Ei). At 1.2 mg/mL, the percent increase above baseline was 18.2 ± 4.4% and 33.5 ± 7.7% at 2.4 mg/mL CNPs. These experiments were significant at p < 0.034 and p < 0.007, respectively when compared with the sham injection (Fig. 6B and Bi) that had a signal increase of 4.6% versus baseline.
Fig. 6.
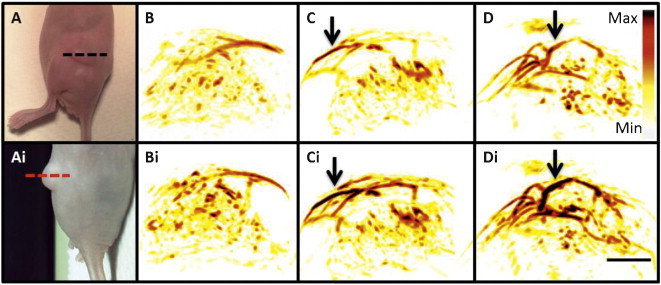
Imaging data. Dashed lines in panels. Panels (A) and (Ai) are two different views of the imaging plane used to create the renderings in panels (B–D) (dashed lines). Here, the top images are before injection of CNPs and lower panels denoted by “i” are post injection. (B) no injection; (C) 1.2 mg/mL; and (D) 2.4 mg/mL. Intensity bar in (D) applies to all images as does the scale bar in (Di), which represents 3 mm. Arrows highlight regions with particularly increased PA contrast in post-injection images.
4. Discussion
We report a cellulose-based nanoparticle suitable for photoacoustic imaging with the capacity to biodegrade. Although cellulose nanocrystals and microcrystals are primarily described as optical reflection tools [25,27], they have also shown interaction with the infrared spectrum that may be responsible for the photoacoustic signal described here via thermal expansion [47]. Absorbance near 700 nm has also been reported [48,49]. Much of the work in the literature is describing nanocrystalline cellulose, which is white in color. The brown color we observed here is likely due to mild pyrolysis due to heating during acidic cleavage [50]. For this reason, we have referred to the material as cellulose nanoparticles and not nanocrystalline cellulose.
The CNPs produce 2–3 times more photoacoustic signal as GNRs on a per-particle basis at 700 nm, while using mass units, the CNPs produced 30-fold less signal (Fig. 2). Importantly, there are many additional caveats when comparing photoacoustic contrast agents. The CNPs are markedly larger than GNRs and this makes a straightforward comparison to GNRs difficult because their absorption cross-section is not equivalent. Volumetrically, the 13.2 nm × 40.0 nm cylindrical GNRs are 5474 nm3 and the 180 nm spherical CNPs are 305,000 nm3. This is a ∼560-fold difference. Jain and El-Sayed characterized the optical cross section of plasmonic materials and found that it increased as a function of the effective radius of the nanorod, and that at 20 nm of effective radius, a nanorod has 2 × 10⁻¹⁴ m2 of optical cross section [51]. While there are no similar reports for cellulose nanoparticles, one important control the use of identical volumes and laser powers in the comparison of the CNPs and GNRs. The comparison presented in Fig. 2 was done with the same volume of contrast and the same laser intensity of 4.2 ± 0.2 mJ/pulse. Thus, differences in photoacoustic signal must be due to differences in absorption cross-section; the CNPs are larger than GNRs on a per particle basis.
The choice of dose was critically important. Although all agents (including water) are toxic at some dose, this imaging agent has a sharp response curve and doses at or above 2.4 mg/mL showed toxicity. However, at 1.2 mg/mL there was only very slight modification of liver function and electrolytes relative to control animals with changes still within the normal reference range [45,46]. The most dramatically changed enzyme, alkaline phosphatase, actually decreased while liver toxicity would show an increase (Fig. 3B). Importantly, this same 1.2 mg/mL concentration was still effective at producing a significant increase in tumor PA signal (Figs. 5 and 6). This concentration was further validated by the ex vivo experiments. The 200 μL of 1.2 mg/mL CNPs would have a working concentration in vivo of 0.12 mg/mL for a typical mouse with 2 mL of total blood volume. This value is well below the 0.31 mg/mL value shown to induce dysregulated metabolisms in cell culture experiments (Fig. 3A).
The sham injection in Fig. 6B and 6Bi should have no change in photoacoustic signal. However, the fold increase in the sham injection cohort was 4.6% of the baseline signal for the three animals. This difference may be due to differences in animal positioning, despite our best efforts to maintain the orientation. It may also be due to differences in blood oxygenation due to anesthesia. Finally, it may be due to the variation within the scanner (laser intensity, water temperature, transducer current, etc.), although we have monitored the laser intensity and find that those differences are <5% across these scans.
We characterized the run-to-run variation previously [33] and measured the signal differences using this tomographic photoacoustic scanner in a single tumor-bearing mouse under three different challenges: imaging repeatedly without movement (stationary), removing and replacing the animal in the scanner by the same operator (on/off), or by removing and replacing the animal in the scanner by different operators (users). The relative standard deviation for the three approaches was 9.6%, 13.5%, and 6.5% for the stationary, on/off, and user-based experiments, respectively. Thus, the variation seen here is reasonable based on this previous data.
The potential of a biodegradable nanoparticle imaging agent is the primary motivation for this work, but these particles will not biodegrade in the circulation of rodents or humans. Fig. 4 shows both chemical and imaging data to support the hypothesis that CNPs can biodegrade in the presence of cellulase. While free glucose could be used metabolically, the smaller fragments are near the size known to clear renally [52]. Interestingly, at the same 1 mg/mL starting concentration, temperature, and enzyme activities, the CNPs produce more than 3-fold more glucose than normal cellulose. This finding is consistent with the acidic cleavage of cellulose during synthesis with a potential attendant increase in enzymatic reaction sites on the newly formed CNPs. Fortunately, the peak imaging times (<30 min) are well before cellulase-based biodegradation would occur.
One key limitation of this work is that humans obviously do not produce cellulase—a potential application would therefore be using this imaging agent as a “smart probe” that biodegrades only after injection of a secondary cellulase-based treatment. Although traditional cellulose requires acid conditions, newly reported versions including the Xyn01 strain operate at physiological pH [53]. More likely however, is further modification of the sugar backbone that retains the optical properties, but with more obvious routes of clearance from the body. Another limitation of this approach is imaging at 700 nm that can be confounded by hemoglobin and other species in tissue. Indeed, the relatively high PA background at 700 nm is likely one of the key factors that determines the detection limits of 1.2 mg/mL (0.35 nM). Nevertheless, careful registration and comparison of the pre- and post-injection images can highlight CNP-specific signal and this value is still lower than that determined for GNRs with identical cell line and imaging equipment (0.4 nM) [33]. Future work will study whether this peak intensity is tunable as with plasmonic gold.
While passive tumor targeting was suitable for this preliminary study and may be exploited further with size-tuned CNPs, future experiments may utilize the sulfate ester groups resulting from hydrolysis of cellulose to add cloaking polymers such as polyethylene glycol or polyoxyalzine [54] or targeting ligands to increase tumor uptake. Although studied here with ovarian cancer, the CNPs may have utility with a broad range of disease states currently characterized with ultrasound imaging.
5. Conclusion
In summary, we report a cellulose-based nanoparticle capable of both biodegrading ex vivo in the presence of a naturally occurring enzyme and producing photoacoustic signal in living mice. The limit of detection in molar units was comparable to gold nanorods in a mouse model of ovarian cancer and a dose of 48 μg in PBS was found to provide consistent photoacoustic signal above background at 700 nm with low toxicity. Our future goals are a more mechanistic understanding of the generation of photoacoustic signal and optimization of the CNP structure to reduce toxicity concerns while retaining biodegradation properties.
Conflict of interest statement
Sanjiv Sam Gambhir serves as a scientific advisor and board member to Endra Life Sciences. He has previously served in that capacity with Visualsonics Corporation.
Acknowledgements
This work is funded in part by the National Cancer Institute S10-OD010344 CCNE U54 CA151459 (S.S.G.) and In Vivo Cancer Molecular Imaging Center ICMIC P50 CA114747 (S.S.G.). J.V.J. is grateful for fellowship support from the Stanford Molecular Imaging Scholars Program SMIS R25-T CA118681. Jesse Jokerst, PhD was supported by a Postdoctoral Fellowship, PF-13-098-01–CCE from the American Cancer Society. We also thank the Stanford Small Animal Imaging Facility and the Stanford Nanocharacterization Laboratory for infrastructure support. S.E.B. was funded by an AAUW International Fellowship (Grant no. 12157615) and AACR Clinical/Translational Research Fellowship (Grant no. 12-40-11-BOHN).
Biographies

Jesse V. Jokerst was born in Missouri and earned his Ph.D. in Analytical Chemistry under the supervision of John T. McDevitt (currently Rice University) at The University of Texas at Austin in 2009. He is currently an Instructor in the Department of Radiology and Stanford and works at the interface of materials science and imaging developing nanoparticle contrast agents for a variety of imaging modalities.

Dominique Van de Sompel has completed his postdoctoral training and now performs image recognition and analysis in the private sector. Key interests include Bayesian signal processing for 3D photoacoustic tomography and Raman spectroscopy. He has also studied machine learning on supervised and unsupervised methods including support vector machines, logistic regression, and principal and independent component analysis.

Sarah E. Bohndiek completed her PhD in Radiation Physics at University College London. Following two successful postdoctoral fellowships, first at the University of Cambridge and then at Stanford University, she now leads her own laboratory at the University of Cambridge whose focus is imaging of oxygen and oxidative stress in cancer.

Sanjiv Sam Gambhir is the Virginia & D.K. Ludwig Professor of Cancer Research and the Chair of Radiology at Stanford University School of Medicine. He also heads up the Canary Center at Stanford for Cancer Early Detection and directs the Molecular Imaging Program at Stanford (MIPS). He received his MD/PhD from the UCLA Medical Scientist Training Program. He has over 500 publications in the field, has a H-index of ∼80, and over 40 patents pending or granted. His labs work has been featured on over 30 journal covers such as Science, Journal of Nuclear Medicine, Circulation, Small, Nano Letters, Cancer Cell, Nature Drug Discovery, and Science Translational Medicine. An internationally recognized researcher in molecular imaging with over $75 Million of NIH funding as the Principal Investigator, his lab has focused on interrogating fundamental molecular events in living subjects. He has developed and clinically translated several multimodality molecular imaging strategies including imaging of gene and cell therapies. He has also pioneered imaging areas such as Bioluminescence Resonance Energy Transfer (BRET), split-reporter technology, Raman imaging in living subjects, Molecular Photoacoustic imaging in living subjects including humans, PET reporter genes and multiple PET traers, and novel combination of in vitro and in vivo strategies for the early detection of cancer.
Contributor Information
Jesse V. Jokerst, Email: jokerst@stanford.edu.
Sanjiv S. Gambhir, Email: sgambhir@stanford.edu.
References
- 1.Agarwal A. Targeted gold nanorod contrast agent for prostate cancer detection by photoacoustic imaging. J Appl Phys. 2007;102 064701-064701-064704. [Google Scholar]
- 2.Manohar S., Kharine A., van Hespen J.C., Steenbergen W., van Leeuwen T.G. Photoacoustic mammography laboratory prototype: imaging of breast tissue phantoms. J Biomed Opt. 2004;9:1172–1181. doi: 10.1117/1.1803548. [DOI] [PubMed] [Google Scholar]
- 3.Aguirre A., Ardeshirpour Y., Sanders M.M., Brewer M., Zhu Q. Potential role of coregistered photoacoustic and ultrasound imaging in ovarian cancer detection and characterization. Transl Oncol. 2011;4:29–37. doi: 10.1593/tlo.10187. [DOI] [PMC free article] [PubMed] [Google Scholar]
- 4.Xu M., Wang L.V. Photoacoustic imaging in biomedicine. Rev Sci Instrum. 2006;77:041101. [Google Scholar]
- 5.Wang L.V., Hu S. Photoacoustic tomography in vivo imaging from organelles to organs. Science. 2012;335:1458–1462. doi: 10.1126/science.1216210. [DOI] [PMC free article] [PubMed] [Google Scholar]
- 6.Ntziachristos V., Razansky D. Molecular imaging by means of multispectral optoacoustic tomography (MSOT) Chem Rev. 2010;110:2783–2794. doi: 10.1021/cr9002566. [DOI] [PubMed] [Google Scholar]
- 7.Lutz A.M. Early diagnosis of ovarian carcinoma: is a solution in sight? Radiology. 2011;259:329–345. doi: 10.1148/radiol.11090563. [DOI] [PubMed] [Google Scholar]
- 8.Bast R.C., Hennessy B., Mills G.B. The biology of ovarian cancer: new opportunities for translation. Nat Rev Cancer. 2009;9:415–428. doi: 10.1038/nrc2644. [DOI] [PMC free article] [PubMed] [Google Scholar]
- 9.Kim C., Erpelding T.N., Jankovic L., Wang L.V. Performance benchmarks of an array-based hand-held photoacoustic probe adapted from a clinical ultrasound system for non-invasive sentinel lymph node imaging. Philos Trans R Soc Lond Ser A Math Phys Eng Sci. 2011;369:4644–4650. doi: 10.1098/rsta.2010.0353. [DOI] [PMC free article] [PubMed] [Google Scholar]
- 10.Kim C., Song K.H., Gao F., Wang L.V. Sentinel lymph nodes and lymphatic vessels: noninvasive dual-modality in vivo mapping by using indocyanine green in rats—volumetric spectroscopic photoacoustic imaging and planar fluorescence imaging. Radiology. 2010;255:442–450. doi: 10.1148/radiol.10090281. [DOI] [PMC free article] [PubMed] [Google Scholar]
- 11.Razansky D. Multispectral opto-acoustic tomography of deep-seated fluorescent proteins in vivo. Nat Photonics. 2009;3:412–417. [Google Scholar]
- 12.van de Ven S.M.W.Y. Molecular imaging using light-absorbing imaging agents and a clinical optical breast imaging system—a phantom study. Mol Imaging Biol. 2011;13:232–238. doi: 10.1007/s11307-010-0356-3. [DOI] [PMC free article] [PubMed] [Google Scholar]
- 13.Levi J. Design, synthesis, and imaging of an activatable photoacoustic probe. J Am Chem Soc. 2010;132:11264–11269. doi: 10.1021/ja104000a. [DOI] [PMC free article] [PubMed] [Google Scholar]
- 14.Zerda A., Kim J.W., Galanzha E.I., Gambhir S.S., Zharov V.P. Advanced contrast nanoagents for photoacoustic molecular imaging, cytometry, blood test and photothermal theranostics. CMMI. 2011;6:346–369. doi: 10.1002/cmmi.455. [DOI] [PMC free article] [PubMed] [Google Scholar]
- 15.Kircher M.F. A brain tumor molecular imaging strategy using a new triple-modality MRI-photoacoustic-Raman nanoparticle. Nat Med. 2012;18:829–834. doi: 10.1038/nm.2721. [DOI] [PMC free article] [PubMed] [Google Scholar]
- 16.Chen Y.S. Silica-coated gold nanorods as photoacoustic signal nanoamplifiers. Nano Lett. 2011;11:348–354. doi: 10.1021/nl1042006. [DOI] [PMC free article] [PubMed] [Google Scholar]
- 17.De la Zerda A. Carbon nanotubes as photoacoustic molecular imaging agents in living mice. Nat Nanotechnol. 2008;3:557–562. doi: 10.1038/nnano.2008.231. [DOI] [PMC free article] [PubMed] [Google Scholar]
- 18.Wu L. A green synthesis of carbon nanoparticles from honey and their use in real-time photoacoustic imaging. Nano Res. 2013;6(5):312–325. doi: 10.1007/s12274-013-0308-8. [DOI] [PMC free article] [PubMed] [Google Scholar]
- 19.Lovell J.F. Porphysome nanovesicles generated by porphyrin bilayers for use as multimodal biophotonic contrast agents. Nat Mater. 2011;10:324–332. doi: 10.1038/nmat2986. [DOI] [PubMed] [Google Scholar]
- 20.Ku G. Copper sulfide nanoparticles as a new class of photoacoustic contrast agent for deep tissue imaging at 1064-nm. ACS Nano. 2012;6:7489–7496. doi: 10.1021/nn302782y. [DOI] [PMC free article] [PubMed] [Google Scholar]
- 21.Kim G. Indocyanine-green-embedded PEBBLEs as a contrast agent for photoacoustic imaging. J Biomed Opt. 2007;12:044020. doi: 10.1117/1.2771530. [DOI] [PubMed] [Google Scholar]
- 22.Wilson K., Homan K., Emelianov S. Biomedical photoacoustics beyond thermal expansion using triggered nanodroplet vaporization for contrast-enhanced imaging. Nat Commun. 2012;3:618. doi: 10.1038/ncomms1627. [DOI] [PubMed] [Google Scholar]
- 23.Tam J.M. Controlled assembly of biodegradable plasmonic nanoclusters for near-infrared imaging and therapeutic applications. ACS Nano. 2010;4:2178–2184. doi: 10.1021/nn9015746. [DOI] [PMC free article] [PubMed] [Google Scholar]
- 24.Yoon S.J. Utility of biodegradable plasmonic nanoclusters in photoacoustic imaging. Opt Lett. 2010;35:3751–3753. doi: 10.1364/OL.35.003751. [DOI] [PMC free article] [PubMed] [Google Scholar]
- 25.de Souza Lima M.M., Borsali R. Rodlike cellulose microcrystals: structure, properties, and applications. Macromol Rapid Commun. 2004;25:771–787. [Google Scholar]
- 26.Capadona J.R. Polymer nanocomposites with nanowhiskers isolated from microcrystalline cellulose. Biomacromolecules. 2009;10:712–716. doi: 10.1021/bm8010903. [DOI] [PubMed] [Google Scholar]
- 27.Samir M.A.S.A., Alloin F., Dufresne A. Review of recent research into cellulosic whiskers, their properties and their application in nanocomposite field. Biomacromolecules. 2005;6:612–626. doi: 10.1021/bm0493685. [DOI] [PubMed] [Google Scholar]
- 28.Atalla R.H., Vanderhart D.L. Native cellulose: a composite of two distinct crystalline forms. Science (New York, NY) 1984;223:283. doi: 10.1126/science.223.4633.283. [DOI] [PubMed] [Google Scholar]
- 29.Siqueira G., Bras J., Dufresne A. Cellulosic bionanocomposites: a review of preparation, properties and applications. Polymers. 2010;2:728–765. [Google Scholar]
- 30.Braun B., Dorgan J.R., Chandler J.P. Cellulosic nanowhiskers. Theory and application of light scattering from polydisperse spheroids in the Rayleigh–Gans–Debye regime. Biomacromolecules. 2008;9:1255–1263. doi: 10.1021/bm7013137. [DOI] [PubMed] [Google Scholar]
- 31.Tingaut P., Eyholzer C., Zimmermann . 2011. Functional polymer nanocomposite materials from microfibrillated cellulose. [Google Scholar]
- 32.Bohndiek S.E., Bodapati S., Van De Sompel D., Kothapalli S.-R., Gambhir S.S. Development and application of stable phantoms for the evaluation of photoacoustic imaging instruments. PLOS ONE. 2013;8:e75533. doi: 10.1371/journal.pone.0075533. [DOI] [PMC free article] [PubMed] [Google Scholar]
- 33.Jokerst J.V., Cole A.J., Van de Sompel D., Gambhir S.S. Gold nanorods for ovarian cancer detection with photoacoustic imaging and resection guidance via raman imaging in living mice. ACS Nano. 2012;6:10366–10377. doi: 10.1021/nn304347g. [DOI] [PMC free article] [PubMed] [Google Scholar]
- 34.Needles A. IEEE, 2010. 2010. Development of a combined photoacoustic micro-ultrasound system for estimating blood oxygenation; pp. 390–393. [Google Scholar]
- 35.Jokerst J.V., Thangaraj M., Kempen P., Sinclair R., Gambhir S.S. Photoacoustic imaging of mesenchymal stem cells in living mice via silica-coated gold nanorods. ACS Nano. 2012;6:5920–5930. doi: 10.1021/nn302042y. [DOI] [PMC free article] [PubMed] [Google Scholar]
- 37.Al-Nasiry S., Geusens N., Hanssens M., Luyten C., Pijnenborg R. The use of Alamar Blue assay for quantitative analysis of viability, migration and invasion of choriocarcinoma cells. Hum Reprod. 2007;22:1304–1309. doi: 10.1093/humrep/dem011. [DOI] [PubMed] [Google Scholar]
- 38.Moss D., Bergmeyer H. Academic Press; New York, NY: 1984. Methods of enzymatic analysis. [Google Scholar]
- 39.Wang Y., Xing D., Zeng Y., Chen Q. Photoacoustic imaging with deconvolution algorithm. Phys Med Biol. 2004;49:3117. doi: 10.1088/0031-9155/49/14/006. [DOI] [PubMed] [Google Scholar]
- 40.Loening A.M., Gambhir S.S. AMIDE: a free software tool for multimodality medical image analysis. Mol Imaging. 2003;2:131–137. doi: 10.1162/15353500200303133. [DOI] [PubMed] [Google Scholar]
- 41.Lozano J., Rotstein E., Urbicain M. Total porosity and open-pore porosity in the drying of fruits. J Food Sci. 2006;45:1403–1407. [Google Scholar]
- 42.Orendorff C.J., Murphy C.J. Quantitation of metal content in the silver-assisted growth of gold nanorods. J Phys Chem B. 2006;110:3990–3994. doi: 10.1021/jp0570972. [DOI] [PubMed] [Google Scholar]
- 43.Link S., Burda C., Nikoobakht B., El-Sayed M. Laser-induced shape changes of colloidal gold nanorods using femtosecond and nanosecond laser pulses. J Phys Chem B. 2000;104:6152–6163. [Google Scholar]
- 44.Pu K. Semiconducting polymer nanoparticles as photoacoustic molecular imaging probes in living mice. Nat Nanotechnol. 2014;9:233–239. doi: 10.1038/nnano.2013.302. [DOI] [PMC free article] [PubMed] [Google Scholar]
- 45.Wolford S.T. Reference range database for serum chemistry and hematology values in laboratory animals. J Toxicol Environ Health. 1986;18:161–188. doi: 10.1080/15287398609530859. [DOI] [PubMed] [Google Scholar]
- 46.Derelanko M.J., Hollinger M.A. CRC Press; Boca Raton, Florida USA: 2001. Handbook of toxicology. [Google Scholar]
- 47.Åkerholm M., Hinterstoisser B., Salmén L. Characterization of the crystalline structure of cellulose using static and dynamic FT-IR spectroscopy. Carbohydr Res. 2004;339:569–578. doi: 10.1016/j.carres.2003.11.012. [DOI] [PubMed] [Google Scholar]
- 48.Querejeta-Fernández A., Chauve G., Methot M., Bouchard J., Kumacheva E. Chiral plasmonic films formed by gold nanorods and cellulose nanocrystals. J Am Chem Soc. 2014;136(12):4788–4793. doi: 10.1021/ja501642p. [DOI] [PubMed] [Google Scholar]
- 49.Dong S., Roman M. Fluorescently labeled cellulose nanocrystals for bioimaging applications. J Am Chem Soc. 2007;129:13810–13811. doi: 10.1021/ja076196l. [DOI] [PubMed] [Google Scholar]
- 50.Yang H., Yan R., Chen H., Lee D.H., Zheng C. Characteristics of hemicellulose, cellulose and lignin pyrolysis. Fuel. 2007;86:1781–1788. [Google Scholar]
- 51.Jain P.K., Lee K.S., El-Sayed I.H., El-Sayed M.A. Calculated absorption and scattering properties of gold nanoparticles of different size, shape, and composition: applications in biological imaging and biomedicine. J Phys Chem B. 2006;110:7238–7248. doi: 10.1021/jp057170o. [DOI] [PubMed] [Google Scholar]
- 52.Choi H.S. Renal clearance of quantum dots. Nat Biotechnol. 2007;25:1165–1170. doi: 10.1038/nbt1340. [DOI] [PMC free article] [PubMed] [Google Scholar]
- 53.Nacke H. Identification and characterization of novel cellulolytic and hemicellulolytic genes and enzymes derived from German grassland soil metagenomes. Biotechnol Lett. 2012;34:663–675. doi: 10.1007/s10529-011-0830-2. [DOI] [PMC free article] [PubMed] [Google Scholar]
- 54.Luxenhofer R. Doubly amphiphilic poly (2-oxazoline) s as high-capacity delivery systems for hydrophobic drugs. Biomaterials. 2010;31:4972–4979. doi: 10.1016/j.biomaterials.2010.02.057. [DOI] [PMC free article] [PubMed] [Google Scholar]