Abstract
For multiallelic loci, standard measures of linkage disequilibrium provide an incomplete description of the correlation of variation at two loci, especially when there are different numbers of alleles at the two loci. We have developed a complementary pair of conditional asymmetric linkage disequilibrium (ALD) measures. Since these measures do not assume symmetry, they more accurately describe the correlation between two loci and can identify heterogeneity in genetic variation not captured by other symmetric measures. For biallelic loci the ALD are symmetric and equivalent to the correlation coefficient r. The ALD measures are particularly relevant for disease-association studies to identify cases in which an analysis can be stratified by one of more loci. A stratified analysis can aid in detecting primary disease-predisposing genes and additional disease genes in a genetic region. The ALD measures are also informative for detecting selection acting independently on loci in high linkage disequilibrium or on specific amino acids within genes. For SNP data, the ALD statistics provide a measure of linkage disequilibrium on the same scale for comparisons among SNPs, among SNPs and more polymorphic loci, among haplotype blocks of SNPs, and for fine mapping of disease genes. The ALD measures, combined with haplotype-specific homozygosity, will be increasingly useful as next-generation sequencing methods identify additional allelic variation throughout the genome.
Keywords: linkage disequilibrium (LD), correlation coefficient r, multiallelic LD Wn, asymmetric LD (ALD), WA/B and WB/A, conditional or stratified analyses
THE definition of the linkage disequilibrium (LD) parameter Dij of nonrandom association between a pair of alleles Ai and Bj at two loci (A and B) is straightforward and unequivocal. It is the difference between the observed (or estimated) haplotype (chromosomal or gametic) frequency (fij) and that expected under random association of the two allele frequencies . While this is the base of all other measures of LD, defining the strength of any observed nonrandom association is complicated by the fact that the maximum value Dij can take is a function of the observed allele frequencies. A number of normalized measures to reflect the strength of LD have been proposed; both for bi- and multiallelic data (Hedrick 1987; Lewontin 1988). However, since these are all a single summary of multidimensional data, no proposed measure of the strength of LD can be perfect; although each may have strengths and weaknesses with respect to the question being addressed.
The two most common measures of the strength of LD are: (1) the normalized measure of the individual LD values (Lewontin 1964), Dij′ = Dij/Dmax (see Supporting Information, File S1 for details) and (2) the correlation coefficient r for biallelic data, which is most often reported as r2 = Dij2 / (pA1 pA2 pB1 pB2). Hedrick (1987) extended the D′ measure for multiallelic data as a weighted average over all alleles at each locus of the individual normalized LD values: D′ = Σi Σj p p|Dij′| . The multiallelic extension of the r2 measure is
where kA and kB indicate the number of alleles at each locus. It is also known as Cramer’s V statistic (Cramer 1946), defined on the contingency table relating two categorical variables and is a reexpression of the χ2 statistic, normalized to be between zero and one (Hill 1975; Hedrick 1987; Single et al. 2007, 2011). With N individuals (2N alleles/haplotypes), (2N)(Wn2)min(kA − 1, kB − 1) has a χ2 distribution with (kA – 1)(kB − 1) degrees of freedom and can be used to test for significant LD between two loci.
For biallelic data, D′ = 1 whenever one or more of the four possible haplotypes are not observed, irrespective of the expected frequencies. In contrast, r directly measures the correlation coefficient of the biallelic variation at two loci. Specifically, r = 1 only when the allelic variations at the two loci show 100% correlation, i.e., when both loci have equal allele frequencies and only two complementary haplotypes are observed. This correlation property is of interest to many research questions. For example, if two loci show associations with a disease but r is close or equal to one (i.e., nearly complete allelic association), then there is little or no variation that can be assessed by a stratified analysis for risk heterogeneity between two potentially disease-predisposing genetic variants.
Due to these inherent differences between the properties of the D′ measure and the correlation measure r, we focus on the correlation measure and its multiallelic extension Wn. We developed the pair of conditional asymmetric LD (ALD) measures, WA/B and WB/A, to complement the Wn measure especially when there are different numbers of alleles at the two loci. This leads to cases where Wn is equal or close to one while one of the two ALD measures is substantially less than one.
Other conditional LD measures have been proposed (Nei and Li 1980; Chakravarti et al. 1984; Hudson 1985; Guo 1997). Nei and Li (1980) developed a statistic that quantifies the association between alleles at a marker locus and a disease locus for studies where individuals are not randomly sampled from a single population, but sampling intensity varies within (disease) categories (Kaplan and Weir 1992; Maiste and Weir 1992). See File S1 for additional detail. In contrast to the above, the ALD measures introduced below are defined for a randomly ascertained sample from a demographically defined population or control group.
When there are different numbers of alleles at the two loci, the direct correlation property discussed above for the r measure is not retained by its multiallelic extension Wn. Consider example 1 with two and three alleles at the first and second loci, with f11 = 0.3, f22 = 0.5, f23 = 0.2 for A1B1, A2B2, and A2B3 haplotypes. Wn = 1; however, there is variation at the B locus on haplotypes containing the A2 allele. Thus, there is not 100% correlation, and there never can be with differing numbers of alleles at the two loci. In this example the two ALD measures (defined below) reflect that while there is no variation of A locus alleles on any of the haplotypes conditioned on the B locus alleles (WA/B = 1), there is variation in the B2 and B3 alleles on haplotypes carrying A2 (WB/A = 0.73). The ALD measures directly indicate that with appropriate sample size, stratification analyses could be carried out for certain comparisons. In contrast, a naive interpretation of the fact that Wn = 1 could result in passing over these data for conditional or stratified haplotype analyses of risk heterogeneity (Thomson et al. 2008).
The definition of the ALD measures begins with the homozygosity (F) and heterozygosity (H) values expected under Hardy–Weinberg proportions (HWP) at a single locus (see Table 1). While there are other measures of association and LD that are based on allelic diversity statistics (see File S1 for details), these measures are all symmetric (Ohta 1980; Maruyama 1982; Hedrick and Thomson 1986; Hedrick 1987). The composite LD measure of Wu et al. (2008) is designed to test interaction between two unlinked loci.
Table 1. Linkage disequilibrium and genetic diversity measures.
| Description | Definition of measuresa |
|---|---|
| 1. Single locus homozygosity (F) and heterozygosity (H)b | FA = ∑i pAi2, HA = 1 − FA |
| 2. Haplotype-specific homozygosity (HSF)c | FA/Bj = ∑i (fij / pBj)2, FB/Ai = ∑j (fij / pAi)2 |
| 3. Overall weighted HSF values FA/B and FB/A | FA/B = ∑j (FA/Bj) (pBj), FB/A = ∑i (FB/Ai) (pAi) |
| 4. Multiallelic ALD squared (overall asymmetric LD squared) | WA/B2 = (FA/B−FA) / (1−FA) = [∑i ∑j (Dij2 / pBj)] / (1−FA) WB/A2 = (FB/A−FB) / (1−FB) = [∑i ∑j (Dij2 / pAi)] / (1−FB) |
In all cases, ∑i indicates summation over all i = 1, 2, …, kA, and similarly ∑j over all j = 1, 2, …, kB, where kA and kB are the number of alleles at the A and B loci, respectively, with ∑i pAi = 1, and ∑j pBj = 1. ∑i ∑j Dij = 0, ∑i Dij = 0, ∑j Dij = 0, ∑i ∑j fij = 1, ∑j fij = pAi, ∑i fij = pBj. For biallelic data: D11 = −D12 = −D21 = D22 = D. Alternate expressions are given in the Appendix along with biallelic results.
The values of FA and HA (FA + HA = 1) are those expected under Hardy–Weinberg proportions.
The HSFA/Bj values are the extension of the single-locus FA values but now restricted to haplotypes containing the allele Bj (similarly for HSFB/Ai). Haplotype-specific heterozygosity values are HSHA/Bj = 1–HSFA/Bj, and HSHB/Ai = 1–HSFB/Ai.
The conditional two-locus extensions of F and H, called haplotype-specific homozygosity (HSF) and haplotype-specific heterozygosity (HSH), measure the level of genetic variation at locus A on haplotypes with a specific allele on the B locus (and vice versa), i.e., FA/Bj, and FB/Ai (see Table 1). We developed the HSF and HSH measures (Malkki et al. 2005) to ascertain informative microsatellites (MSATs) in HLA transplantation and disease studies. The complementary pair of conditional ALD measures are defined by normalizing an extension of the HSF measure across all haplotypes.
Materials and Methods
Definition of the asymmetric LD measures
There are two conditional ALD measures, depending on which locus is conditioned upon. For simplicity, we often describe the measure in detail conditioning on the B locus. The derivation of the complementary measure, conditioning on the A locus, is given by swapping the roles of loci A and B.
The individual HSF values (Table 1) are combined as a weighted average over all alleles at the conditioned locus to obtain the two overall haplotype specific homozygosity measures: FA/B and FB/A (Table 1 and see Appendix for alternate expressions). The maximum value FA/B can take is 1.0, when each A allele occurs with only one B allele.
WA/B2 (the square of the ALD measure) is obtained by normalizing the overall weighted HSF value based on the range of possible values that it can achieve (Table 1):
For biallelic data at both loci (see Appendix).
Once we deviate from having two alleles at both loci, the two ALD measures are only equal in certain specific cases (see below). For biallelic data the correlation coefficient is given by r; for multiallelic data Wn and the ALD measures, WA/B and WB/A, give the appropriate correlation coefficients.
Other factors being equal, the ALD increases with stronger LD between the two loci. The ALD values are also influenced by the number of alleles at each locus. Specifically, for multiallelic loci with unequal numbers of alleles, e.g., kA < kB (with kA ≥ 2), in the extreme case each Bj allele will occur with only one Ai allele and WA/B = 1 (indicating no variation at the A locus on any haplotype containing a specific Bj allele) and also Wn = 1 (mirroring this effect). However, WB/A < 1 reflects the required variation, given the inequality of allele numbers, at the B locus on some or all haplotypes containing a specific Ai allele (see special case e, below).
Special cases
Biallelic loci with two haplotypes of the four possible, e.g., A1B1 and A2B2, (hence ). LD is maximal with D = , and there is symmetry in all measures: D′ = 1 and r = Wn = WA/B = WB/A = 1.
Biallelic loci with three haplotypes of the four possible, e.g., A1B1, A1B2, and A2B2. With the following allele frequencies , LD is maximal (D = ): D′ = 1, but r (= Wn = WA/B = WB/A) < 1. This reflects that the allele frequencies at the two loci are not 100% correlated.
Multiallelic loci with equal number of alleles (i.e., kA = kB = k) and only symmetric haplotypes (i.e., fii > 0, for all i = 1, 2, …, k, and fij = 0 otherwise). As above for the biallelic case a, there is complete symmetry and 100% correlation of allele frequencies at the two loci: D′ = 1, and Wn = WA/B = WB/A = 1. An example with three alleles at both loci is f11 = 0.5, f22 = 0.3, f33 = 0.2, with all other fij = 0. There is no variation of A locus alleles on any of the haplotypes conditioned on the B locus alleles, and vice versa.
The same as c above, except that one or more of fij > 0 for i ≠ j: Wn < 1, WA/B <1, WB/A < 1.
Multiallelic loci with unequal number of alleles (e.g., kA < kB), with each Bj allele occurring with only one Ai allele (see example 1 in the Introduction). While Wn = WA/B = 1, WB/A < 1.
One locus biallelic and the other multiallelic (e.g., kA = 2, kB > 2): Wn = WA/B ≠ WB/A. In a variety of cases examined, WB/A < WA/B, but we have no proof that this is always the case.
See File S1 for proofs of special cases c–f.
Results
HLA classical loci
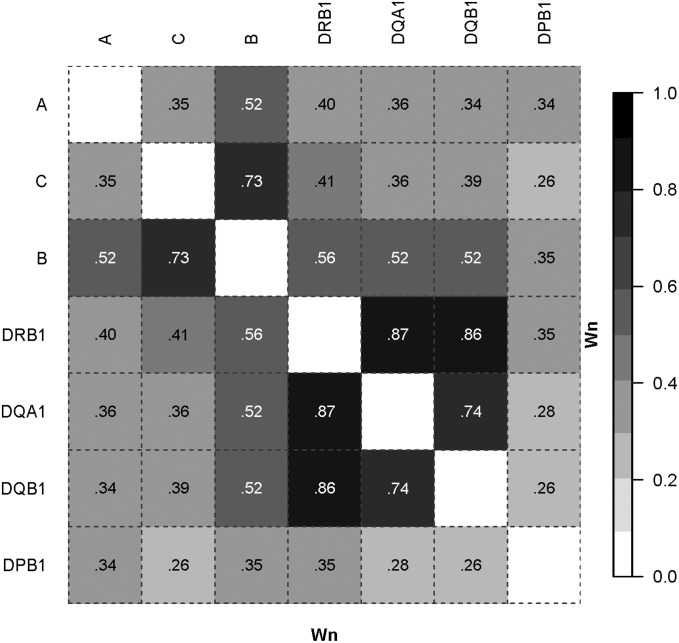
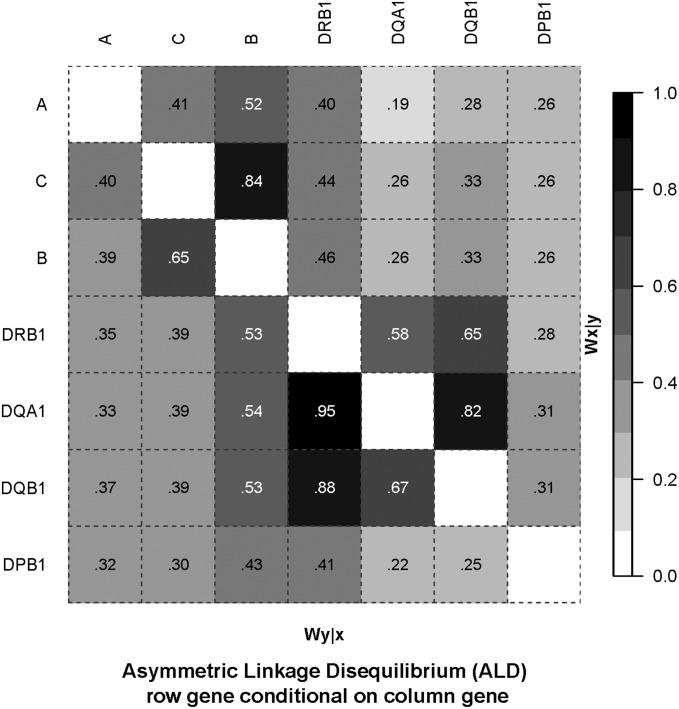
We applied the ALD measures to data for the polymorphic HLA classical genes (Wilson 2010): class I (A, C, and B) and class II (DRB1, DQA1, DQB1, and DPB1). Figure 1 and Figure 2 respectively show the standard overall LD measure Wn and the ALD measures WA/B and WB/A. The Wn measure assumes/forces symmetry (as does the overall D′ measure, not shown) even though with more than two alleles per locus, differing numbers of alleles at each locus, and different levels of LD between loci this is not the case.
Figure 1.
Wn Measure for classical HLA genes. LD plot based on the Wn measure (the multiallelic extension of the r correlation measure). Data source: ImmPort Study#SDY26 with N = 300 controls typed for HLA (Wilson 2010). The number of alleles (k) are as follows (given in parentheses after each locus): A (33), C (29), B (61), DRB1 (40), DQA1 (9), DQB1 (14), DPB1 (24).
Figure 2.
ALD measures for classical HLA genes. LD plot based on the ALD measures. Our usual generic notation for the ALD measures of WA/B and WB/A is replaced by Wx/y and Wy/x to avoid confusion with the HLA-A and -B loci used in this example. Data source as for Figure 1.
The ALD values show considerable heterogeneity. For example (with numbers of alleles for each locus given in parentheses), the ALD for DRB1(40) conditioning on DQA1(9) is 0.58 = WDRB1/DQA1; i.e., the overall variation for DRB1 is relatively high given specific DQA1 alleles. In contrast, the ALD for DQA1 conditioning on DRB1 is 0.95 = WDQA1/DRB1; i.e., the overall variation for DQA1 is relatively low given specific DRB1 alleles. This reflects both the smaller number of alleles at DQA1 compared to DRB1 and the high LD between the two loci (most DRB1 alleles occur with only one DQA1 allele, but not vice versa). Similarly with the B(61) and C(29) loci, WB/C = 0.65, and WC/B = 0.84. In both these examples the standard (symmetric) overall pairwise LD values are intermediate to the ALD values: Wn = 0.87 and 0.73 for the DRB1:DQA1 and C:B locus pairs, respectively. In almost all comparisons, if the number of alleles kX > kY then WX/Y < WY/X. An exception is with the A(33) and C(29) loci, i.e., kA > kC, but WA/C (0.41) > WC/A (0.40).
SNP and HLA data
HLA and SNP data from de Bakker et al. (2006) characterized patterns of LD among highly polymorphic HLA genes and a large number of SNP sites. The extensive LD across the extended HLA region (∼8 Mb) makes the identification of additional non-HLA genomic effects on disease difficult to assess. The SNP sites used here were selected on the basis of their ability to identify or tag specific alleles at each of the HLA classical loci (i.e., tag-SNPs for HLA alleles). We chose this example, with a subset of the HLA and SNP data in the class II region, to highlight the properties of the ALD measures and what distinguishes them from the symmetric r and Wn measures.
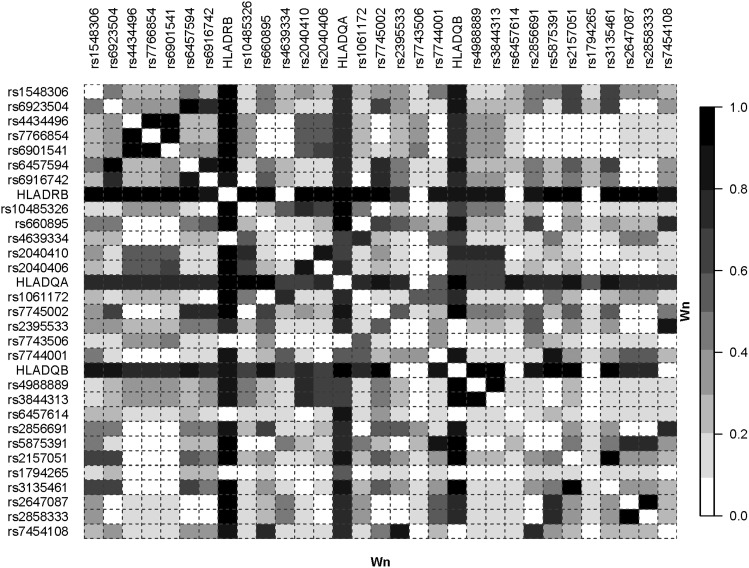
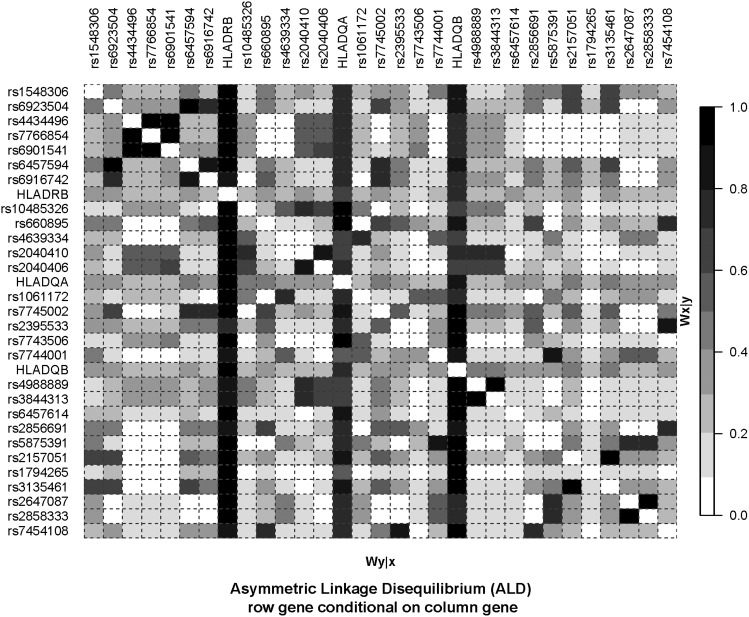
Figure 3 and Figure 4 show plots of the Wn and ALD measures for 90 unrelated individuals with European ancestry from the Centre d’Etude du Polymorphisme Humain (CEPH) collection (CEU) obtained from the Tagger/MHC webpage. The ALD measures (Figure 4) provide a visualization of the tag-SNP properties that is not captured by the symmetric Wn measure. Looking down the column for any one of the HLA loci (i.e., conditioning on an HLA locus), one can see the particular SNPs that tag specific HLA alleles. These show up as a dark column in the figure. However, conditioning on any given SNP does not show this pattern of high LD. In contrast with the figure for Wn, there are no dark rows of high LD for the ALD measures, indicating that the ALD measures capture the different degree of overall association for each individual SNP.
Figure 3.
The Wn measure applied to SNP and HLA–DRB1, DQA1, and DQB1 data. LD plot based on the Wn measure. The data are for 90 unrelated individuals from de Bakker et al. (2006) with European ancestry from the CEU obtained from the Tagger/MHC webpage.
Figure 4.
The ALD measures applied to SNP and HLA–DRB1, DQA1 ,and DQB1 data. LD plot based on the ALD measures. Data source as for Figure 3.
Note that the information displayed in Figure 3 and Figure 4 captures different aspects of LD from the results reported in the de Bakker et al. (2006) article, as we present overall LD between each pair of loci. The r2 values reported in their article represent the squared correlation between a given SNP and presence/absence of each particular HLA allele (e.g., A*0101 vs. other). The tag-SNPs were chosen such that this r2 value is 1.0 (or nearly so) for a specific HLA allele, not for the overall locus. The values in Figure 3 and Figure 4 represent overall LD combining over all alleles at both loci.
For example, the SNP rs4988889 is listed as a tag-SNP in the CEU population for the HLA-DQB1*02:01 allele in Table S3 of de Bakker et al. (2006), with an r2 (symmetric) value of 0.958. It does not show up as a tag-SNP for any other HLA allele in their Table S3. In Table 2 below, one can see that the values for WHLA|SNP and WSNP|HLA are quite different (0.4083 vs. 0.9788). The rs7743506 SNP is listed in de Bakker et al. (2006) as a tag-SNP for three class II alleles, each with an r2 value of 1.0: HLA-DQA1*04:01, HLA-DQB1*04:02, and HLA-DRB1*08:01. Thus, allele 2 for this SNP is completely correlated with the presence of each of these three class II HLA alleles. This 100% correlation is captured by the ALD measure (WSNP|HLA = 1.0), while the low values for WHLA|SNP for each of the three class II loci indicates that there is a large amount of variability remaining at the HLA loci after conditioning on this SNP. Note that for the examples in Table 2, WSNP|HLA is equal to Wn. This is an example of special case f above.
Table 2. Overall LD measures applied to data from de Bakker et al. (2006).
| WHLA|SNP | WSNP|HLA | D’ | Wn | Locus 1a | Locus 2 |
|---|---|---|---|---|---|
| 0.2611 | 0.8214 | 0.9150 | 0.8214 | DRB1 | rs4988889 |
| 0.2824 | 0.6256 | 0.8255 | 0.6256 | DQA1 | rs4988889 |
| 0.4083 | 0.9788 | 1.0000 | 0.9788 | DQB1 | rs4988889 |
| 0.1980 | 1.0000 | 1.0000 | 1.0000 | DRB1 | rs7743506 |
| 0.2164 | 1.0000 | 1.0000 | 1.0000 | DQA1 | rs7743506 |
| 0.2056 | 1.0000 | 1.0000 | 1.0000 | DQB1 | rs7743506 |
The loci listed under locus 1 are the three classical class II loci HLA–DRB1, –DQA1, and –DQB1
HLA disease association data
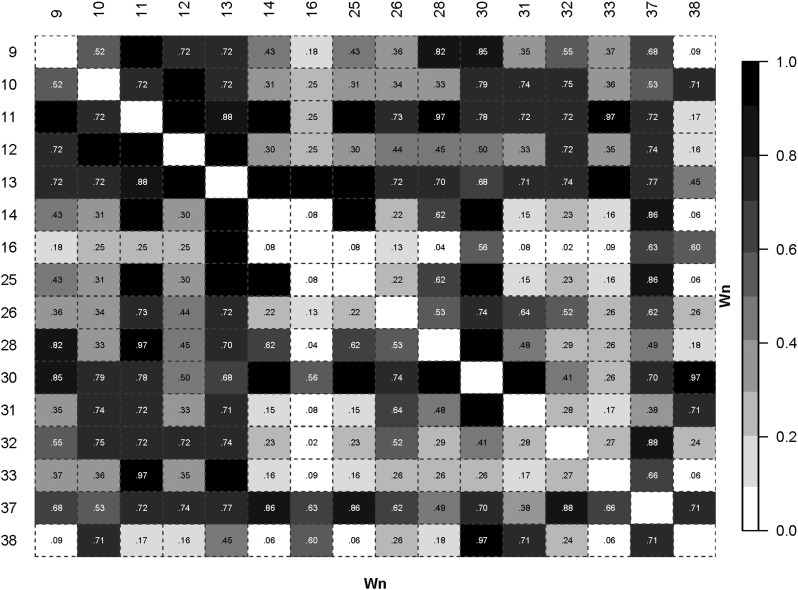
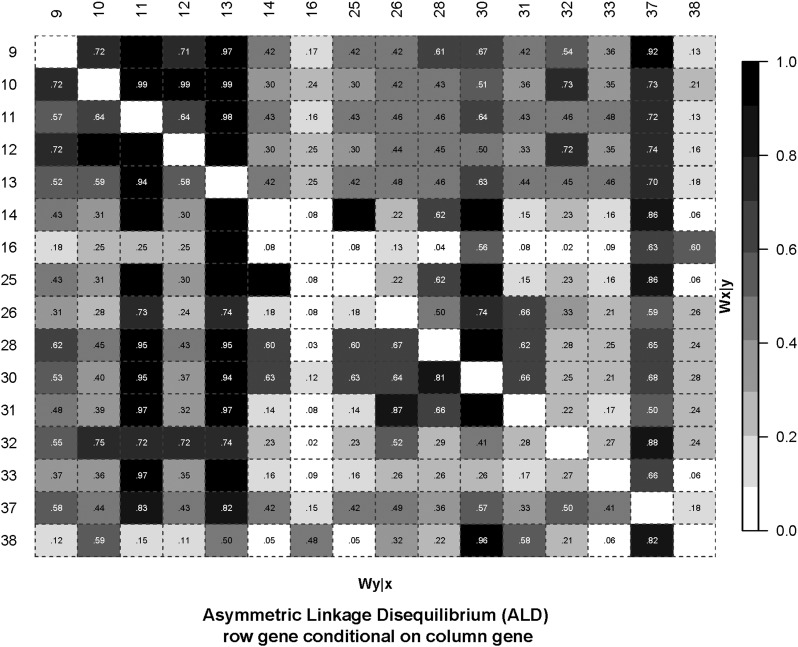
The HLA class II DRB1 gene is strongly associated with juvenile idiopathic arthritis (oligoarticular-persistent) (JIA-OP), with a hierarchy of predisposing through intermediate (“neutral”) to protective effects (Hollenbach et al. 2010; Thomson et al. 2010). Amino-acid position 13 (AA13) of DRB1 shows the strongest single AA association with JIA-OP. This association is also stronger than other potentially biologically relevant combinations of AAs defined under sequence feature variant-type (SFVT) analysis (Karp et al. 2010; Thomson et al. 2010). AA13 is also identified as potentially causative in disease using an extension of Salamon’s unique combinations algorithm (Salamon et al. 1996; Thomson et al. 2010). The overall AA LD (Wn) patterns are quite complex for each of the classical HLA loci, with DRB1 control data for JIA-OP shown in Figure 5. AA13 shows high LD via the Wn measure with quite a few other AAs (note only AAs 9–38 within exon 2 are shown). However, ALD analyses show additional variation that can be tested via conditional analyses (Figure 6).
Figure 5.
The Wn measure applied to HLA-DRB1 AMINO Acids 9-38. LD plot based on the Wn measure. Black colored cells have a numeric value of 1. The data are for the control sample in a study of JIA.(Hollenbach et al. 2010; Thomson et al. 2010) For clarity, only amino acids 9-38 are shown.
Figure 6.
The ALD measures applied to HLA-DRB1 AMINO Acids 9-38. LD plot based on the ALD measures. The data are as for Figure 5.
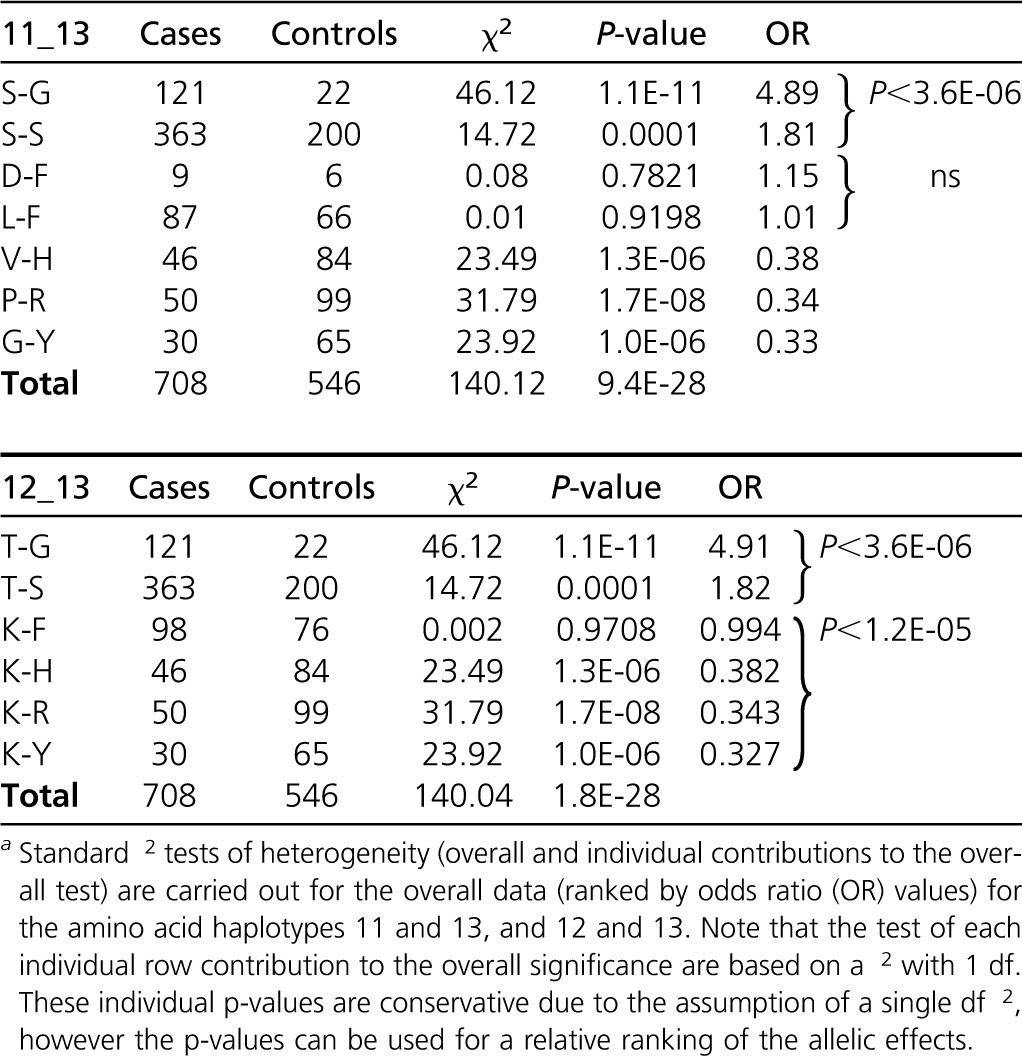
For illustration, we consider the block of high LD AAs 11(6), 12(2), and 13(6) (the number of “alleles,” or different AA residues segregating, at each AA site are given in parentheses). AA 10(2) and AA 12 are 100% correlated apart from a very rare allele, and hence AA 10 is not considered here. The ALD values indicate which pairs of AAs may allow for stratification and conditional analyses. For example (see Figure 5 and Figure 6), with AAs 11 and 12, Wn = 1, and while W12/11 = 1, W11/12 = 0.64, and hence some stratification analyses can be carried out (this is also an illustration of special case f above). Table 3 shows the results of specific tests of risk heterogeneity: variation at AA 13 is significantly associated with disease on haplotypes with AA 11 and AA 12. In contrast, AA 11 does not show heterogeneity on haplotypes with AA 13. This does not exclude a role for AA 11, nor AA 12, in disease predisposition, but the conditional analyses do show a potential role for AA 13 in being directly involved in disease risk.
Table 3.
Conditional Analyses of JIA-OP Data for HLA DRB1 Amino Acids 11-13a
Selection on HLA–DRB1 amino acids
A role for balancing selection maintaining much of the extensive variation at the HLA classical loci is well established (Meyer and Thomson 2001; Meyer et al. 2006). In particular, application of the Ewens–Watterson (EW) neutrality test of allele-frequency distributions at the classical HLA loci has revealed the action of balancing selection in maintaining diversity at the HLA-A, -C, -B, DRB1, DQA1, and DQB1 loci (Salamon et al. 1999; Lancaster 2006; Solberg et al. 2008). Allele frequency distributions at these loci are generally more even than expected under neutral conditions. The distributions of DPB1 alleles do not show evidence of balancing selection (Salamon et al. 1999; Begovich et al. 2001; Lancaster 2006; Tsai and Thomson 2007; Solberg et al. 2008). However, extension of the EW test to the AA level has shown evidence for balancing selection acting on some AAs for all the classical HLA loci, including DPB1 (Salamon et al. 1999; Valdes et al. 1999; Lancaster 2006).
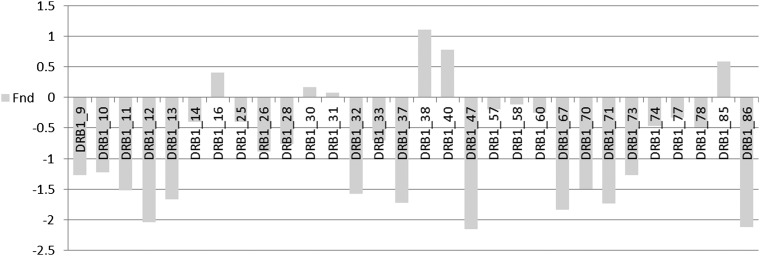
At both the allele and AA levels, the statistic used for the above analyses is the mean across populations of the normalized deviate Fnd of the homozygosity statistic F (Salamon et al. 1999). Balancing selection results in significantly negative Fnd values compared to neutral expectations, whereas directional selection, along with certain demographic events, leads to significant positive values. An observation of interest from previous studies is that pairs of AAs that show high LD may nonetheless show quite different Fnd values (Salamon et al. 1999; Lancaster 2006). To illustrate this point in the context of ALD measures applied to the JIA-OP DRB1 control data, consider AA positions 37 and 38, which have a moderately high Wn value of 0.71 (Figure 5). However, the ALD values are quite disparate (W37/38 = 0.18 and W38/37 = 0.82) (Figure 6), and explain how the observed Fnd values can show different evolutionary histories with significant evidence for balancing selection for AA 37 and possible directional selection for AA 38 (Figure 7). This pattern is not unique to this particular population. Similar patterns of this differential selection can be seen in meta-analyses across several populations (see Figure S1 for Fnd values across 57 populations for DRB1 data (Lancaster 2006)). For these data, P-values for deviation from neutral expectations in the direction of balancing selection are 2.5E−24 and 0.11 for AAs 37 and 38, respectively (Lancaster 2006).
Figure 7.
Selection at DRB1 AA sites measured by Fnd values. The Fnd measure of selection for polymorphic amino acid sites in HLA–DRB1 exon 2. The data are as for Figure 5 and Figure 6.
Discussion
From analyses of allele and haplotype data in disease-association studies, HLA researchers have long recognized that high pairwise LD (Wn) between two loci has limited our ability in some cases to distinguish the primary disease gene or genes. It is also well known that there are instances, particularly with differing numbers of alleles at two loci, where the Wn value does not accurately reflect our ability to perform stratified or conditional analyses to identify disease-risk heterogeneity. With multiallelic data, the ALD measures presented here are more appropriate and informative than the Wn measure. For example, with type 1 diabetes (T1D), DRB1–DQB1 haplotypes carrying the DRB1*04:01 allele can be subdivided by the DQB1*03:02 (predisposing) and *03:01 (protective) alleles. This approach, termed for HLA studies “within serogroup comparisons” (based on a specific variant in the first field, or serotype, of the DQB1 allele name, and comparing AA variation related to disease risk in the second field) focuses on a smaller number of AAs to compare. In this case the analysis of DRB1–DQB1 haplotypes is stratified on DQB1 based on the presence of DRB1*04:01. This led to identification of AA 57 of DQB1 in T1D risk. In fact, for T1D both DRB1 and DQB1 are directly involved in disease risk, with confirmation coming from cross-ethnic studies (Thomson et al. 2007, 2008, 2011; Erlich et al. 2008).
Another example of stratification on a particular site aiding in the identification of additional effects comes from a SNP in the PTPN22 gene. In a study of rheumatoid arthritis, Begovich et al. (2004) demonstrated an association with the minor allele of the R620W missense SNP (rs2476601) in PTPN22. In a follow-up study, similar to the above HLA study on T1D, Carlton et al. (2005) used AA analyses of closely related haplotypes of SNPs to show a direct role of R620W in risk heterogeneity. With stratification of the data by R620W, the role in disease risk of at least one additional SNP in PTPN22 was identified.
The ALD measures were initially developed to aid two separate lines of research for AA variation at classical HLA genes: to determine the actual disease-predisposing AAs in disease-association studies and to identify which AA sites are independently subject to selection in population studies. The major problem encountered in both research areas is the high level and complex patterns of LD between many AA sites, combined with more than two (and up to six) distinct AAs (“alleles”), seen at many sites. When evidence of strong balancing selection is seen at a number of AA sites (Salamon et al. 1999; Valdes et al. 1999; Lancaster 2006), how does one determine which AA sites could potentially show independent evolution vs. correlation due to high LD? Similarly with disease-association studies of individual AAs and biologically relevant sequence features (SFs) and their variant types (VTs) (Karp et al. 2010; Thomson et al. 2010), how can one distinguish between potentially causal effects vs. those due to LD? These AA-level analyses showed that there are cases with different numbers of “alleles” (AAs or SFVTs) at two loci where Wn = 1; nonetheless a stratified analysis could be applied to potentially distinguish disease predisposing variants. Also in population studies there are cases of two AA sites with Wn ≈ 1, which show variation that appears to be under different selection pressures (Salamon et al. 1999; Lancaster 2006). The ALD measures can help provide additional insight in these situations.
The ALD measures are applicable to the study of any genetic variation, and the fact that they are measured on the same scale as the well-documented correlation measure r enhances their comparability and interpretation. They will be increasingly useful as next-generation sequencing methods identify more allelic variation, including nonbiallelic SNPs, insertion/deletion polymorphisms, and copy-number variants. Currently, these nonbiallelic SNP sites are often excluded from analyses. Linkage disequilibrium analyses among SNPs and among polymorphic genes are typically handled separately and polymorphic genes are often recoded as a set of dichotomous indicator variables (presence/absence of each allele) to simplify analyses at the expense of interpretation. The ALD statistics provide a measure of linkage disequilibrium that is on the same scale for comparisons among SNPs, among SNPs and more polymorphic loci, among haplotype blocks of SNPs, and for fine mapping of disease genes. The ALD measures are especially useful when there is asymmetry in the number of alleles at each locus, and it is suspected that even with very high Wn values, some haplotypes will allow for a stratified analysis. The ALD values, combined with the HSF values (Table 1), give us a numeric evaluation of the variation available for stratification analyses. It can be challenging to conduct several analyses, synthesizing results from various combinations and types of genetic variants as risk factors. The ALD measures form a base for such studies, along with consideration of other complementary summary measures of the strength and structure of LD in multiallelic data.
Supplementary Material
Acknowledgments
We thank Diogo Meyer, Montgomery Slatkin, and two anonymous reviewers for their helpful comments. We also thank Alex Lancaster for the use of his thesis data. This work was supported in part by National Institutes of Health (NIH) Contract HHSN272201200028C (G.T. and R.M.S.), NIH grant MH096262 (G.T.), and a 2013-14 REACH grant from the University of Vermont (R.M.S.). The content is solely the responsibility of the authors and does not necessarily represent the official views of the NIH. Data used in this paper can be found at the tagger/MHC webpage (http://www.broadinstitute.org/mpg/tagger/mhc.html) and at the Immunology Database and Analysis Portal (ImmPort - immport.niaid.nih.gov - SDY26 and SDY313).
Appendix: Alternate Expressions for ALD Statistics
Alternate expressions for FA/B and FB/A for multiallelic data
The two overall HSF measures can also be expressed as haplotype and allele frequencies (line 1 below), or as a deviation from the single-locus homozygosity (second line below) using individual LD (Dij) values and allele frequencies.
. Similarly, . It follows that FA/B ≥ FA with equality only when all Dij = 0 (a “Wahlund” effect).
Alternate expressions for FA/B and FB/A for biallelic data
If both loci are biallelic:
Similarly,
Alternate expressions for WA/B2 and WB/A2 for multiallelic data
WA/B2 and WB/A2 (Table 1) can also be expressed using haplotype and allele frequencies or using individual LD (Dij) values and allele frequencies:
Alternate expressions for WA/B2 and WB/A2 for biallelic data
If both loci are biallelic:
Similarly, .
Footnotes
Supporting information is available online at http://www.genetics.org/lookup/suppl/doi:10.1534/genetics.114.165266/-/DC1.
Communicating editor: J. Wall
Literature Cited
- Begovich A. B., Moonsamy P. V., Mack S. J., Barcellos L. F., Steiner L. L., et al. , 2001. Genetic variability and linkage disequilibrium within the HLA-DP region: analysis of 15 different populations. Tissue Antigens 57: 424–439 [DOI] [PubMed] [Google Scholar]
- Begovich A. B., Carlton V. E., Honigberg L. A., Schrodi S. J., Chokkalingam A. P., et al. , 2004. A missense single-nucleotide polymorphism in a gene encoding a protein tyrosine phosphatase (PTPN22) is associated with rheumatoid arthritis. Am. J. Hum. Genet. 75: 330–337 [DOI] [PMC free article] [PubMed] [Google Scholar]
- Carlton V. E., Hu X., Chokkalingam A. P., Schrodi S. J., Brandon R., et al. , 2005. PTPN22 genetic variation: evidence for multiple variants associated with rheumatoid arthritis. Am. J. Hum. Genet. 77: 567–581 [DOI] [PMC free article] [PubMed] [Google Scholar]
- Chakravarti A., Li C. C., Buetow K. H., 1984. Estimation of the marker gene frequency and linkage disequilibrium from conditional marker data. Am. J. Hum. Genet. 36: 177–186 [PMC free article] [PubMed] [Google Scholar]
- Cramer H., 1946. Mathematical Methods of Statistics. Princeton University Press, Princeton [Google Scholar]
- de Bakker P. I., McVean G., Sabeti P. C., Miretti M. M., Green T., et al. , 2006. A high-resolution HLA and SNP haplotype map for disease association studies in the extended human MHC. Nat. Genet. 38: 1166–1172 [DOI] [PMC free article] [PubMed] [Google Scholar]
- Erlich H., Valdes A. M., Noble J., Carlson J. A., Varney M., et al. , 2008. HLA DR-DQ haplotypes and genotypes and type 1 diabetes risk: analysis of the type 1 diabetes genetics consortium families. Diabetes 57: 1084–1092 [DOI] [PMC free article] [PubMed] [Google Scholar]
- Guo S. W., 1997. Linkage disequilibrium measures for fine-scale mapping: a comparison. Hum. Hered. 47: 301–314 [DOI] [PubMed] [Google Scholar]
- Hedrick P. W., 1987. Gametic disequilibrium measures: proceed with caution. Genetics 117: 331–341 [DOI] [PMC free article] [PubMed] [Google Scholar]
- Hedrick P. W., Thomson G., 1986. A two-locus neutrality test: applications to humans, E. coli and lodgepole pine. Genetics 112: 135–156 [DOI] [PMC free article] [PubMed] [Google Scholar]
- Hill W. G., 1975. Linkage disequilibrium among multiple neutral alleles produced by mutation in finite population. Theor. Popul. Biol. 8: 117–126 [DOI] [PubMed] [Google Scholar]
- Hollenbach J. A., Thompson S. D., Bugawan T. L., Ryan M., Sudman M., et al. , 2010. Juvenile idiopathic arthritis and HLA class I and class II interactions and age-at-onset effects. Arthritis Rheum. 62: 1781–1791 [DOI] [PMC free article] [PubMed] [Google Scholar]
- Hudson R. R., 1985. The sampling distribution of linkage disequilibrium under an infinite allele model without selection. Genetics 109: 611–631 [DOI] [PMC free article] [PubMed] [Google Scholar]
- Kaplan N., Weir B. S., 1992. Expected behavior of conditional linkage disequilibrium. Am. J. Hum. Genet. 51: 333–343 [PMC free article] [PubMed] [Google Scholar]
- Karp D. R., Marthandan N., Marsh S. G., Ahn C., Arnett F. C., et al. , 2010. Novel sequence feature variant type analysis of the HLA genetic association in systemic sclerosis. Hum. Mol. Genet. 19: 707–719 [DOI] [PMC free article] [PubMed] [Google Scholar]
- Lancaster, A., 2006 Interplay of selection and molecular function in HLA genes. Ph.D. Thesis, University of California, Berkeley, CA. [Google Scholar]
- Lewontin R. C., 1964. The interaction of selection and linkage. I. General considerations; heterotic models. Genetics 49: 49–67 [DOI] [PMC free article] [PubMed] [Google Scholar]
- Lewontin R. C., 1988. On measures of gametic disequilibrium. Genetics 120: 849–852 [DOI] [PMC free article] [PubMed] [Google Scholar]
- Maiste P. J., Weir B. S., 1992. Estimating linkage disequilibrium from conditional data. Am. J. Hum. Genet. 50: 1139–1140 [PMC free article] [PubMed] [Google Scholar]
- Malkki M., Single R., Carrington M., Thomson G., Petersdorf E., 2005. MHC microsatellite diversity and linkage disequilibrium among common HLA-A, HLA-B, DRB1 haplotypes: implications for unrelated donor hematopoietic transplantation and disease association studies. Tissue Antigens 66: 114–124 [DOI] [PubMed] [Google Scholar]
- Maruyama T., 1982. Stochastic integrals and their application to population genetics, pp. 151–166 in Molecular Evolution, Protein Polymorphism and the Neutral Theory, edited by Kimura M. Japan Scientific Societies Press, Tokyo [Google Scholar]
- Meyer D., Thomson G., 2001. How selection shapes variation of the human major histocompatibility complex: a review. Ann. Hum. Genet. 65: 1–26 [DOI] [PubMed] [Google Scholar]
- Meyer D., Single R. M., Mack S. J., Erlich H. A., Thomson G., 2006. Signatures of demographic history and natural selection in the human major histocompatibility complex Loci. Genetics 173: 2121–2142 [DOI] [PMC free article] [PubMed] [Google Scholar]
- Nei M., Li W. H., 1980. Non-random association between electromorphs and inversion chromosomes in finite populations. Genet. Res. 35: 65–83 [DOI] [PubMed] [Google Scholar]
- Ohta T., 1980. Linkage disequilibrium between amino acid sites in immunoglobulin genes and other multigene families. Genet. Res. 36: 181–197 [DOI] [PubMed] [Google Scholar]
- Salamon H., Tarhio J., Ronningen K., Thomson G., 1996. On distinguishing unique combinations in biological sequences. J. Comput. Biol. 3: 407–423 [DOI] [PubMed] [Google Scholar]
- Salamon H., Klitz W., Easteal S., Gao X., Erlich H. A., et al. , 1999. Evolution of HLA class II molecules: allelic and amino acid site variability across populations. Genetics 152: 393–400 [DOI] [PMC free article] [PubMed] [Google Scholar]
- Single, R., D. Meyer, and G. Thomson, 2007 Statistical methods for analysis of population genetic data, pp. 518–522 in Immunobiology of the Human MHC: Proceedings of the 13th International Histocompatibility Workshop and Congress, edited by J. Hansen. IHWG Press, Seattle, WA. [Google Scholar]
- Single, R., P.-A. Gourraud, H. Maldonado-Torres, A. Lancaster, F. Briggs et al., 2011 Estimating haplotype frequencies and linkage disequilibrium parameters in the HLA and KIR Regions. NIAID/NIH’s ImmPort. https://immport.niaid.nih.gov/docs/standards/MethodsManual_HaplotypeFreqs+LD_v8.pdf
- Solberg O. D., Mack S. J., Lancaster A. K., Single R. M., Tsai Y., et al. , 2008. Balancing selection and heterogeneity across the classical human leukocyte antigen loci: a meta-analytic review of 497 population studies. Hum. Immunol. 69: 443–464 [DOI] [PMC free article] [PubMed] [Google Scholar]
- Thomson G., Valdes A. M., Noble J. A., Kockum I., Grote M. N., et al. , 2007. Relative predispositional effects of HLA class II DRB1–DQB1 haplotypes and genotypes on type 1 diabetes: a meta-analysis. Tissue Antigens 70: 110–127 [DOI] [PubMed] [Google Scholar]
- Thomson G., Barcellos L. F., Valdes A. M., 2008. Searching for additional disease loci in a genomic region. Adv. Genet. 60: 253–292 [DOI] [PubMed] [Google Scholar]
- Thomson G., Marthandan N., Hollenbach J. A., Mack S. J., Erlich H. A., et al. , 2010. Sequence feature variant type (SFVT) analysis of the HLA genetic association in juvenile idiopathic arthritis. Pac. Symp. Biocomput., 359–370 [DOI] [PMC free article] [PubMed] [Google Scholar]
- Thomson, G., S. Mack, A. Valdes, L. Barcellos, J. Hollenbach et al., 2011 HLA disease associations: detecting primary and secondary disease predisposing genes. NIAID/NIH’s ImmPort. https://immport.niaid.nih.gov/docs/standards/MM-HL-Adisease-version010.pdf
- Tsai, Y., and G. Thomson, 2007 Selection intensity differences in seven HLA loci in many populations, pp. 705–746 in Immunobiology of the Human MHC: Proceedings of the 13th International Histocompatibility Workshop and Congress, edited by J. Hansen. IHWG Press, Seattle, WA. [Google Scholar]
- Valdes A. M., McWeeney S. K., Meyer D., Nelson M. P., Thomson G., 1999. Locus and population specific evolution in HLA class II genes. Ann. Hum. Genet. 63: 27–43 [DOI] [PubMed] [Google Scholar]
- Wilson, C., 2010 Identifying polymorphisms associated with risk for the development of myopericarditis following smallpox vaccine. Study #26. NIAID/NIH’s ImmPort. https://immport.niaid.nih.gov/immportWeb/clinical/study/displayStudyDetails.do?itemList=SDY26
- Wu X., Jin L., Xiong M., 2008. Composite measure of linkage disequilibrium for testing interaction between unlinked loci. Eur. J. Hum. Genet. 16: 644–651 [DOI] [PubMed] [Google Scholar]
Associated Data
This section collects any data citations, data availability statements, or supplementary materials included in this article.


