

Abstract
Background
Temporal and local fluctuations in O2 in tumors require adaptive mechanisms to support cancer cell survival and proliferation. The transcriptome associated with cycling hypoxia (CycHyp) could thus represent a prognostic biomarker of cancer progression.
Methods
We exposed 20 tumor cell lines to repeated periods of hypoxia/reoxygenation to determine a transcriptomic CycHyp signature and used clinical data sets from 2,150 breast cancer patients to estimate a prognostic Cox proportional hazard model to assess its prognostic performance.
Results
The CycHyp prognostic potential was validated in patients independently of the receptor status of the tumors. The discriminating capacity of the CycHyp signature was further increased in the ER+ HER2- patient populations including those with a node negative status under treatment (HR=3.16) or not (HR=5.54). The CycHyp prognostic signature outperformed a signature derived from continuous hypoxia and major prognostic metagenes (P<0.001). The CycHyp signature could also identify ER+HER2 node-negative breast cancer patients at high risk based on clinicopathologic criteria but who could have been spared from chemotherapy and inversely those patients classified at low risk based but who presented a negative outcome.
Conclusions
The CycHyp signature is prognostic of breast cancer and offers a unique decision making tool to complement anatomopathologic evaluation.
Keywords: hypoxia, breast cancer, biomarker, gene signature, prognosis
INTRODUCTION
Hypoxia is nowadays described as a hallmark of tumors [1, 2]. Tumor angiogenesis and glycolytic metabolism are two extensively studied responses of cancer cells to a deficit in oxygen [1]. The building of new blood vessels to bring O2 and the respiration-independent metabolism to survive under low O2 are actually complementary responses of tumors to hypoxia [1, 2]. These somehow opposite modes of adaptation account for local and temporal heterogeneities in tumor O2 distribution. The terms ‘intermittent hypoxia’ or ‘cycling hypoxia’ were settled to describe this phenomenon of fluctuating hypoxia in tumors [3, 4]. As a corollary, the extent of cycling hypoxia reflects tumor plasticity and thus measures the capacity of tumor cells to survive and proliferate in a hostile environment [3].
Although we and others have contributed to demonstrate the existence of cycles of hypoxia and/or ischemia in mouse, canine and human tumors [see [5, 6] for review], technologies aiming to routinely measure tumor O2 fluctuations in the clinics are not (yet) available despite important progresses in the in vivo imaging of hypoxia [7-11]. In the absence of readily accessible monitoring strategies, the analysis of the transcriptome associated with this phenomenon could represent a prognostic biomarker of cancer progression. Indeed, although mutations and defects in tumor suppressor genes directly influence the whole genetic profile of a given tumor cell clone, cycling hypoxia could be envisioned as a supra-oncogenic phenomenon influencing gene expression [3]. In other words, independently of the genetic background of tumor cells, cycling hypoxia has the potential to lead to common alterations in the expression of some transcripts, and thus to a possible clinically exploitable signature.
Clinical data sets derived from breast cancer patients could be used to evaluate the performance of such cycling hypoxia-related gene signature. The clinical and genetic heterogeneities of this disease and the very large panel of data sets available represent indeed good opportunities to evaluate new prognostic gene expression signatures [12]. Whole genome analysis already provided several molecular classifications for breast cancer beyond standard clinicopathologic variables [12-21]. The latter include tumor size, presence of lymph node metastasis and histological grades [22] but also encompass three predictive markers of response, namely expression of oestrogen (ER), progesterone (PR) and HER2 receptors [12]. Treatment guidelines are nowadays still largely based on algorithms integrating these informations such as the Notthingham Prognostic Index [22, 23] or Adjuvant! Online [24]. Accordingly, for early-stage breast cancer, adjuvant chemotherapy is recommended for most patients with ER-negative or HER2-positive tumors [13, 25-27]. The challenge actually resides in selecting patients with ER-positive HER2-negative disease who could benefit from chemotherapy.
In this study, we derived a transcriptomic signature of cycling hypoxia (CycHyp) using 20 cell lines derived from various human tumors and characterized by a large variety of distinct genetic anomalies. We then validated the capacity of the CycHyp signature to optimize patient stratification. In particular, we showed how the CycHyp signature could identify ER-positive node-negative breast cancer patients at high risk based on conventional NPI (and who could have been spared from chemotherapy) and inversely those patients classified at low risk but who could have drawn benefits of chemotherapy.
RESULTS
Identification of the CycHyp signature
Tumor cells covering a large diversity of tissues (Suppl. Table 1) were submitted to cycling hypoxia (CycHyp) for 24 hours, maintained under normoxic conditions or exposed to continuous hypoxia (ContHyp) for the same period of time (Figure 1A). Corresponding mRNA samples were analysed by hybridization using Human Gene 1.0 ST Affymetrix microarrays. Gene expression profiles of each cell type under normoxia vs. cycling hypoxia (CycHyp) were produced to identify the most differentially expressed probesets. The CycHyp signature was determined as the top 100 probesets with the lowest FDR-corrected p-values averaged over 200 resamplings (Table 1); a ContHyp signature was also determined in parallel (Table 2). The heatmaps made with the 100 probe sets of the CycHyp signature confirmed its excellent potential of discrimination between cycling hypoxia and either normoxia (Figure 1B) or continuous hypoxia (Figure 1C). Moreover, Gene Set Enrichment Analysis (GSEA) [28] indicated that when considering differentially expressed probesets (after FDR correction), only 2 gene sets were significantly enriched in the CycHyp signature (Suppl. Table 2) whereas we identified 52 gene sets enriched in the ContHyp signature, including 17 directly related to hypoxia (Suppl. Table 3). Also, when using the MSigDB molecular signature database referring to hypoxia or HIF (www.broadinstitute.org), we found 13 hypoxia gene sets sharing, on average, only 1.4 gene with CycHyp (Suppl. Table 4) whereas 44 hypoxia gene sets showed overlap with ContHyp with an average of 6.6 (1-27) common genes (Suppl. Table 5). We also compared the CycHyp signature to 13 other hypoxia-derived signatures described by Seigneuric et al. [29] and Starmans et al. [30]. The CycHyp signature was again far from those signatures with an average of only 1 gene in common. The overlap was larger between ContHyp and those signatures with an average of 6 genes in common (Suppl. Table 6). Finally, using TFactS [31] to analyse transcription factors regulating expression of genes associated to either signature, HIF-1α was only found as positively associated with the ContHyp signature.
Figure 1. The CycHyp and ContHyp signatures.
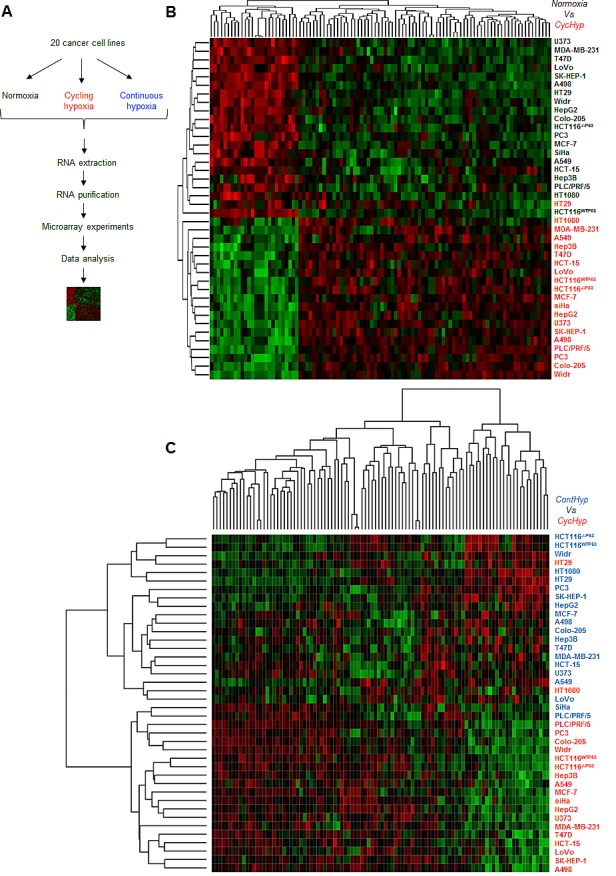
(A.) Flowchart of the signature determination from tumor cells exposed either to normoxia, cycling or continuous hypoxia. (B.) Heatmap depicting the transcripts from the CycHyp signature either underexpressed (green) or overexpressed (red) (centered to median values). Each column corresponds to a specific human Gene 1.0 ST probeset ; each line represents a specific cell line either maintained under normoxia (black label) or exposed to cycling hypoxia (red label); cells under normoxia and cycling hypoxia are perfectly separated in two distinct clusters, except for one cycling hypoxia sample in the normoxia cluster. (C.) Similarly, a heatmap depicting the relative expression of transcripts from the CycHyp signature in the cell lines maintained under continuous hypoxia (blue) or cycling hypoxia (red); only two cycling hypoxia samples are grouped with the continuous hypoxia samples.
Table 1. Gene list of the CycHyp signature.
| Probe | Entrez ID | GenBank | Symbol | Gene Title | |
|---|---|---|---|---|---|
| 1 | 8018860 | 332 | NM_001168 | BIRC5 | baculoviral IAP repeat containing 5 |
| 2 | 8064156 | 84619 | NM_032527 | ZGPAT * | zinc finger, CCCH-type with G patch domain |
| 3 | 8138912 | 23658 | NM_012322 | LSM5§ | LSM5 homolog, U6 small nuclear RNA associated (S. cerevisiae) |
| 4 | 7921786 | 5202 | NM_012394 | PFDN2 | prefoldin subunit 2 |
| 5 | 8165011 | 2219 | NM_002003 | FCN1 | ficolin (collagen/fibrinogen domain containing) 1 |
| 6 | 7964262 | 4666 | NM_001113201 | NACA* | nascent polypeptide-associated complex alpha subunit |
| 7 | 7949792 | 5790 | NM_005608 | PTPRCAP # | protein tyrosine phosphatase, receptor type, C-associated protein |
| 8 | 8034101 | 11018 | NM_006858 | TMED1 | transmembrane emp24 protein transport domain containing 1 |
| 9 | 8168087 | 3476 | NM_001551 | IGBP1 | immunoglobulin (CD79A) binding protein 1 |
| 10 | 7963575 | 1975 | NM_001417 | EIF4B§ | eukaryotic translation initiation factor 4B |
| 11 | 8124397 | 3006 | NM_005319 | HIST1H1C # | histone cluster 1, H1c |
| 12 | 7975989 | 81892 | NM_031210 | SLIRP§ | SRA stem-loop interacting RNA binding protein |
| 13 | 8127692 | 3351 | NM_000863 | HTR1B | 5-hydroxytryptamine (serotonin) receptor 1B |
| 14 | 8127087 | 2940 | NM_000847 | GSTA3 | glutathione S-transferase alpha 3 |
| 15 | 7941122 | 29901 | NM_013299 | SAC3D1 | SAC3 domain containing 1 |
| 16 | 7998692 | 4913 | NM_002528 | NTHL1 | nth endonuclease III-like 1 (E. coli) |
| 17 | 8073623 | 758 | NM_001044370 | MPPED1 | metallophosphoesterase domain containing 1 |
| 18 | 8014865 | 4761 | NM_006160 | NEUROD2 * | neurogenic differentiation 2 |
| 19 | 8005726 | 3768 | NM_021012 | KCNJ12 | potassium inwardly-rectifying channel, subfamily J, member 12 |
| 20 | 7966631 | 64211 | NM_022363 | LHX5 * | LIM homeobox 5 |
| 21 | 8037853 | 54958 | NM_017854 | TMEM160 | transmembrane protein 160 |
| 22 | 8104136 | 3166 | NM_018942 | HMX1* | H6 family homeobox 1 |
| 23 | 7948606 | 746 | NM_014206 | C11orf10 # | chromosome 11 open reading frame 10 |
| 24 | 8044773 | 8685 | NM_006770 | MARCO | macrophage receptor with collagenous structure |
| 25 | 7947015 | 7251 | NM_006292 | TSG101 | tumor susceptibility gene 101 |
| 26 | 7931553 | 8433 | NM_003577 | UTF1 * | undifferentiated embryonic cell transcription factor 1 |
| 27 | 7956876 | 84298 | NM_032338 | LLPH | LLP homolog, long-term synaptic facilitation (Aplysia) |
| 28 | 8117372 | 8334 | NM_003512 | HIST1H2AC# | histone cluster 1, H2ac |
| 29 | 8001329 | 869 | NM_004352 | CBLN1 | cerebellin 1 precursor |
| 30 | 8027205 | 51079 | NM_015965 | NDUFA13 | NADH dehydrogenase (ubiquinone) 1 alpha subcomplex, 13 |
| 31 | 8042896 | 3196 | NM_016170 | TLX2 * | T-cell leukemia homeobox 2 |
| 32 | 7911532 | 54998 | NM_017900 | AURKAIP1 | aurora kinase A interacting protein 1 |
| 33 | 8039923 | 54998 | NM_017900 | AURKAIP1 | aurora kinase A interacting protein 1 |
| 34 | 7992043 | 65990 | BC001181 | FAM173A | family with sequence similarity 173, member A |
| 35 | 8063074 | 90204 | NM_080603 | ZSWIM1 * | zinc finger, SWIM-type containing 1 |
| 36 | 7992191 | 23430 | NM_012217 | TPSD1 | tryptase delta 1 |
| 37 | 8108435 | 7322 | NM_181838 | UBE2D2 | ubiquitin-conjugating enzyme E2D 2 |
| 38 | 8165309 | 8721 | NM_003792 | EDF1 * | endothelial differentiation-related factor 1 |
| 39 | 7946267 | 63875 | NM_022061 | MRPL17 | mitochondrial ribosomal protein L17 |
| 40 | 7945536 | 51286 | NM_016564 | CEND1 | cell cycle exit and neuronal differentiation 1 |
| 41 | 8159609 | 8636 | NM_003731 | SSNA1 # | Sjogren syndrome nuclear autoantigen 1 |
| 42 | 8005471 | 6234 | NM_001031 | RPS28 #,§ | ribosomal protein S28 |
| 43 | 8025395 | 6234 | NM_001031 | RPS28 | ribosomal protein S28 |
| 44 | 7942824 | 6234 | NM_001031 | RPS28 | ribosomal protein S28 |
| 45 | 8170753 | 26576 | NM_014370 | SRPK3 | SRSF protein kinase 3 |
| 46 | 8032718 | 1613 | NM_001348 | ||
| 47 | 7967067 | 8655 | NM_001037495 | ||
| 48 | 8159654 | 25920 | NM_015456 | COBRA1 * | cofactor of BRCA1 |
| 49 | 8011212 | 6391 | NM_003001 | SDHC | succinate dehydrogenase complex, subunit C, integral membrane protein, 15kDa |
| 50 | 8011968 | 51003 | NM_016060 | MED31 * | mediator complex subunit 31 |
| 51 | 7977440 | 9834 | NR_026800 | KIAA0125 | KIAA0125 |
| 52 | 8016508 | 11267 | NM_007241 | SNF8 * | SNF8, ESCRT-II complex subunit, homolog (S. cerevisiae) |
| 53 | 8168567 | 5456 | NM_000307 | POU3F4 * | POU class 3 homeobox 4 |
| 54 | 8086317 | 64689 | NM_031899 | GORASP1 | golgi reassembly stacking protein 1, 65kDa |
| 55 | 8052834 | 54980 | BC005079 | C2orf42 | chromosome 2 open reading frame 42 |
| 56 | 8073334 | 9978 | NM_014248 | RBX1 # | ring-box 1, E3 ubiquitin protein ligase |
| 57 | 7915846 | 8569 | NM_003684 | MKNK1 | MAP kinase interacting serine/threonine kinase 1 |
| 58 | 8071920 | 6634 | NM_004175 | SNRPD3 § | small nuclear ribonucleoprotein D3 polypeptide 18kDa |
| 59 | 8032371 | 81926 | NM_031213 | FAM108A1 | family with sequence similarity 108, member A1 |
| 60 | 7924884 | 8290 | NM_003493 | HIST3H3 | histone cluster 3, H3 |
| 61 | 8006845 | 6143 | NM_000981 | RPL19 § | ribosomal protein L19 |
| 62 | 7946812 | 6207 | NM_001017 | RPS13 #,§ | ribosomal protein S13 |
| 63 | 7949015 | 65998 | NM_001144936 | C11orf95 * | chromosome 11 open reading frame 95 |
| 64 | 8009784 | 51081 | NM_015971 | MRPS7 § | mitochondrial ribosomal protein S7 |
| 65 | 8174509 | 2787 | NM_005274 | GNG5 | guanine nucleotide binding protein (G protein), gamma 5 |
| 66 | 7906235 | 5546 | NM_005973 | PRCC § | papillary renal cell carcinoma (translocation-associated) |
| 67 | 8020179 | 57132 | NM_020412 | CHMP1B | chromatin modifying protein 1B |
| 68 | 7947450 | 4005 | NM_005574 | LMO2 | LIM domain only 2 (rhombotin-like 1) |
| 69 | 8064370 | 6939 | NM_004609 | TCF15 * | transcription factor 15 (basic helix-loop-helix) |
| 70 | 7955896 | 22818 | NM_016057 | COPZ1 | coatomer protein complex, subunit zeta 1 |
| 71 | 8137805 | 8379 | NM_003550 | MAD1L1 # | MAD1 mitotic arrest deficient-like 1 (yeast) |
| 72 | 8117334 | 8359 | NM_003538 | HIST1H4A # | histone cluster 1, H4a |
| 73 | 8117368 | 8364 | NM_003542 | HIST1H4C # | histone cluster 1, H4c |
| 74 | 7977507 | 85495 | NR_002312 | RPPH1§ | ribonuclease P RNA component H1 |
| 75 | 7949410 | 378938 | BC018448 | MALAT1 | metastasis associated lung adenocarcinoma transcript 1 (non-protein coding) |
| 76 | 8150433 | 157848 | NM_152568 | NKX6-3 * | NK6 homeobox 3 |
| 77 | 8071168 | 29797 | NR_024583 | POM121L8P | POM121 membrane glycoprotein-like 8 pseudogene |
| 78 | 7989611 | 84191 | NM_032231 | FAM96A | family with sequence similarity 96, member A |
| 79 | 7980859 | NM_001080113 | |||
| 80 | 8032782 | 126259 | NM_144615 | TMIGD2 | transmembrane and immunoglobulin domain containing 2 |
| 81 | 8110861 | 64979 | NM_032479 | MRPL36 § | mitochondrial ribosomal protein L36 |
| 82 | 7901687 | 199964 | NM_182532 | TMEM61 | transmembrane protein 61 |
| 83 | 7916130 | 112970 | NM_138417 | KTI12 | KTI12 homolog, chromatin associated (S. cerevisiae) |
| 84 | 8048712 | 440934 | BC033986 | LOC440934 | hypothetical LOC440934 |
| 85 | 8018993 | 146713 | NM_001082575 | RBFOX3 § | RNA binding protein, fox-1 homolog (C. elegans) 3 |
| 86 | 8032601 | 84839 | NM_032753 | RAX2 | retina and anterior neural fold homeobox 2 |
| 87 | 8010719 | 201255 | NM_144999 | LRRC45 | leucine rich repeat containing 45 |
| 88 | 8036584 | 3963 | NM_002307 | LGALS7 | lectin, galactoside-binding, soluble, 7 |
| 89 | 8133209 | 441251 | NR_003666 | SPDYE7P | speedy homolog E7 (Xenopus laevis), pseudogene |
| 90 | 8159501 | 286256 | NM_178536 | LCN12 | lipocalin 12 |
| 91 | 8028546 | 3963 | NM_002307 | LGALS7 | lectin, galactoside-binding, soluble, 7 |
| 92 | 8065013 | ENST00000427835 | |||
| 93 | 8018502 | 201292 | NM_173547 | TRIM65 * | tripartite motif containing 65 |
| 94 | 7903294 | 64645 | NM_033055 | HIAT1 | hippocampus abundant transcript 1 |
| 95 | 7989473 | 388125 | NM_001007595 | C2CD4B | C2 calcium-dependent domain containing 4B |
| 96 | 8054449 | 644903 | AK095987 | FLJ38668 | hypothetical LOC644903 |
| 97 | 8081867 | 51300 | NM_016589 | TIMMDC1 | translocase of inner mitochondrial membrane domain containing 1 |
| 98 | 7934544 | 118881 | NM_144589 | COMTD1 | catechol-O-methyltransferase domain containing 1 |
| 99 | 7968260 | 219409 | NM_145657 | GSX1 * | GS homeobox 1 |
| 100 | 8022952 | 56853 | NM_020180 | CELF4 § | CUGBP, Elav-like family member 4 |
# common to the ContHyp signature
* regulators of transcription
§ involved in RNA processing
Table 2. Gene list of the ContHyp signature.
| Probe | Entrez ID | GenBank | Symbol | Gene Title | |
|---|---|---|---|---|---|
| 1 | 7948606 | 746 | NM_014206 | C11orf10 | chromosome 11 open reading frame 10 |
| 2 | 8043283 | 55818 | NM_018433 | KDM3A | lysine (K)-specific demethylase 3A |
| 3 | 8025395 | 6234 | NM_001031 | RPS28 | ribosomal protein S28 |
| 4 | 8139706 | 23480 | NM_014302 | SEC61G | Sec61 gamma subunit |
| 5 | 7942824 | 6234 | NM_001031 | RPS28 | ribosomal protein S28 |
| 6 | 8005471 | 6234 | NM_001031 | RPS28 | ribosomal protein S28 |
| 7 | 8048489 | 55139 | NM_018089 | ANKZF1 | ankyrin repeat and zinc finger domain containing 1 |
| 8 | 7994737 | 226 | NM_000034 | ALDOA | aldolase A, fructose-bisphosphate |
| 9 | 7934278 | 5033 | NM_000917 | P4HA1 | prolyl 4-hydroxylase, alpha polypeptide I |
| 10 | 8102518 | 401152 | NM_001170330 | C4orf3 | chromosome 4 open reading frame 3 |
| 11 | 8117334 | 8359 | NM_003538 | HIST1H4A | histone cluster 1, H4a |
| 12 | 8074969 | 1652 | NM_001355 | DDT | D-dopachrome tautomerase |
| 13 | 8044766 | 51141 | NM_016133 | INSIG2 | insulin induced gene 2 |
| 14 | 7937476 | 6181 | NM_001004 | RPLP2 | ribosomal protein, large, P2 |
| 15 | 8086961 | 5210 | NM_004567 | PFKFB4 | 6-phosphofructo-2-kinase/fructose-2,6-biphosphatase 4 |
| 16 | 8145454 | 665 | NM_004331 | BNIP3L | BCL2/adenovirus E1B 19kDa interacting protein 3-like |
| 17 | 8113981 | 8974 | NM_004199 | P4HA2 | prolyl 4-hydroxylase, alpha polypeptide II |
| 18 | 8162142 | 81689 | NM_030940 | ISCA1 | iron-sulfur cluster assembly 1 homolog (S. cerevisiae) |
| 19 | 8007992 | 3837 | NM_002265 | KPNB1 | karyopherin (importin) beta 1 |
| 20 | 7928308 | 54541 | NM_019058 | DDIT4 | DNA-damage-inducible transcript 4 |
| 21 | 8073334 | 9978 | NM_014248 | RBX1 | ring-box 1, E3 ubiquitin protein ligase |
| 22 | 8124397 | 3006 | NM_005319 | HIST1H1C | histone cluster 1, H1c |
| 23 | 8153459 | 65263 | NM_023078 | PYCRL | pyrroline-5-carboxylate reductase-like |
| 24 | 7916568 | AF263547 | |||
| 25 | 7955117 | 23519 | NM_012404 | ANP32D | acidic (leucine-rich) nuclear phosphoprotein 32 family, member D |
| 26 | 8098604 | 353322 | NM_181726 | ANKRD37 | ankyrin repeat domain 37 |
| 27 | 8121076 | 10957 | NM_006813 | PNRC1 | proline-rich nuclear receptor coactivator 1 |
| 28 | 7921076 | 54865 | NM_182679 | GPATCH4 | G patch domain containing 4 |
| 29 | 7908879 | 8497 | NM_015053 | PPFIA4 | protein tyrosine phosphatase, receptor type, f polypeptide (PTPRF), interacting protein (liprin), alpha 4 |
| 30 | 8103518 | 23520 | NM_012403 | ANP32C | acidic (leucine-rich) nuclear phosphoprotein 32 family, member C |
| 31 | 8050591 | 91942 | NM_174889 | NDUFAF2 | NADH dehydrogenase (ubiquinone) 1 alpha subcomplex, assembly factor 2 |
| 32 | 8172154 | 6187 | NM_002952 | RPS2 | ribosomal protein S2 |
| 33 | 7984846 | 1198 | NM_001130028 | CLK3 | CDC-like kinase 3 |
| 34 | 7946812 | 6207 | NM_001017 | RPS13 | ribosomal protein S13 |
| 35 | 7982531 | 8125 | NM_006305 | ANP32A | acidic (leucine-rich) nuclear phosphoprotein 32 family, member A |
| 36 | 8119898 | 7422 | NM_001025366 | VEGFA | vascular endothelial growth factor A |
| 37 | 8004331 | 9744 | NM_014716 | ACAP1 | ArfGAP with coiled-coil, ankyrin repeat and PH domains 1 |
| 38 | 8159441 | 29085 | NM_001135861 | PHPT1 | phosphohistidine phosphatase 1 |
| 39 | 8168500 | 5230 | NM_000291 | PGK1 | phosphoglycerate kinase 1 |
| 40 | 7938890 | 10196 | NM_005788 | PRMT3 | protein arginine methyltransferase 3 |
| 41 | 7930398 | 4601 | NM_005962 | MXI1 | MAX interactor 1 |
| 42 | 7997740 | 81631 | NM_022818 | MAP1LC3B | microtubule-associated protein 1 light chain 3 beta |
| 43 | 8004360 | 147040 | NM_001002914 | KCTD11 | potassium channel tetramerisation domain containing 11 |
| 44 | 7909782 | 51018 | NM_016052 | RRP15 | ribosomal RNA processing 15 homolog (S. cerevisiae) |
| 45 | 7949792 | 5790 | NM_005608 | PTPRCAP | protein tyrosine phosphatase, receptor type, C-associated protein |
| 46 | 8124385 | 8366 | NM_003544 | HIST1H4B | histone cluster 1, H4b |
| 47 | 8117368 | 8364 | NM_003542 | HIST1H4C | histone cluster 1, H4c |
| 48 | 8081241 | 84319 | NM_032359 | C3orf26 | chromosome 3 open reading frame 26 |
| 49 | 8050079 | 246243 | NM_002936 | RNASEH1 | ribonuclease H1 |
| 50 | 8005765 | 26118 | NM_015626 | WSB1 | WD repeat and SOCS box containing 1 |
| 51 | 7924491 | 64853 | NM_022831 | AIDA | axin interactor, dorsalization associated |
| 52 | 8133273 | ENST00000455206 | |||
| 53 | 8124391 | 8335 | NM_003513 | HIST1H2AB | histone cluster 1, H2ab |
| 54 | 8159609 | 8636 | NM_003731 | SSNA1 | Sjogren syndrome nuclear autoantigen 1 |
| 55 | 7957890 | 27340 | NM_014503 | UTP20 | UTP20, small subunit (SSU) processome component, homolog (yeast) |
| 56 | 7933582 | 100287932 | NM_006327 | TIMM23 | translocase of inner mitochondrial membrane 23 homolog (yeast) |
| 57 | 8153002 | 10397 | NM_001135242 | NDRG1 | N-myc downstream regulated 1 |
| 58 | 7926037 | 5209 | NM_004566 | PFKFB3 | 6-phosphofructo-2-kinase/fructose-2,6-biphosphatase 3 |
| 59 | 8082066 | 26355 | NM_014367 | FAM162A | family with sequence similarity 162, member A |
| 60 | 8042962 | 9801 | NM_014763 | MRPL19 | mitochondrial ribosomal protein L19 |
| 61 | 8090678 | 11222 | NM_007208 | MRPL3 | mitochondrial ribosomal protein L3 |
| 62 | 7977507 | 85495 | NR_002312 | RPPH1 | ribonuclease P RNA component H1 |
| 63 | 8007397 | 10197 | NM_176863 | PSME3 | proteasome (prosome, macropain) activator subunit 3 (PA28 gamma/ Ki) |
| 64 | 7998902 | 54985 | NM_017885 | HCFC1R1 | host cell factor C1 regulator 1 (XPO1 dependent) |
| 65 | 8117372 | 8334 | NM_003512 | HIST1H2AC | histone cluster 1, H2ac |
| 66 | 7997230 | 5713 | NM_002811 | PSMD7 | proteasome (prosome, macropain) 26S subunit, non-ATPase, 7 |
| 67 | 7915485 | 10969 | NM_006824 | EBNA1BP2 | EBNA1 binding protein 2 |
| 68 | 8113873 | 3094 | NM_005340 | HINT1 | histidine triad nucleotide binding protein 1 |
| 69 | 7958152 | 5223 | NM_002629 | PGAM1 | phosphoglycerate mutase 1 (brain) |
| 70 | 7947867 | 5702 | NM_002804 | PSMC3 | proteasome (prosome, macropain) 26S subunit, ATPase, 3 |
| 71 | 7964460 | 1649 | NM_004083 | DDIT3 | DNA-damage-inducible transcript 3 |
| 72 | 7928395 | 170384 | NM_173540 | FUT11 | fucosyltransferase 11 (alpha (1,3) fucosyltransferase) |
| 73 | 8163629 | 944 | NM_001244 | TNFSF8 | tumor necrosis factor (ligand) superfamily, member 8 |
| 74 | 7965486 | 51134 | NM_016122 | CCDC41 | coiled-coil domain containing 41 |
| 75 | 8136179 | 23008 | AF277175 | KLHDC10 | kelch domain containing 10 |
| 76 | 8095870 | 901 | NM_004354 | CCNG2 | cyclin G2 |
| 77 | 8127526 | 6170 | NM_001000 | RPL39 | ribosomal protein L39 |
| 78 | 8174710 | 6170 | NM_001000 | RPL39 | ribosomal protein L39 |
| 79 | 8137517 | 3361 | NM_024012 | HTR5A | 5-hydroxytryptamine (serotonin) receptor 5A |
| 80 | 7929624 | 5223 | NM_002629 | PGAM1 | phosphoglycerate mutase 1 (brain) |
| 81 | 8052331 | 87178 | NM_033109 | PNPT1 | polyribonucleotide nucleotidyltransferase 1 |
| 82 | 8015969 | 7343 | NM_014233 | UBTF | upstream binding transcription factor, RNA polymerase I |
| 83 | 8069168 | 386685 | NM_198699 | KRTAP10-12 | keratin associated protein 10-12 |
| 84 | 7941087 | 5526 | NM_006244 | PPP2R5B | protein phosphatase 2, regulatory subunit B', beta |
| 85 | 8026875 | 26780 | NR_000012 | SNORA68 | small nucleolar RNA, H/ACA box 68 |
| 86 | 8027621 | 2821 | NM_000175 | GPI | glucose-6-phosphate isomerase |
| 87 | 8130539 | 117289 | NM_054114 | TAGAP | T-cell activation RhoGTPase activating protein |
| 88 | 8004691 | 92162 | NM_203411 | TMEM88 | transmembrane protein 88 |
| 89 | 7962183 | 205 | NM_001005353 | AK4 | adenylate kinase 4 |
| 90 | 8137805 | 8379 | NM_003550 | MAD1L1 | MAD1 mitotic arrest deficient-like 1 (yeast) |
| 91 | 8124388 | 8358 | NM_003537 | HIST1H3B | histone cluster 1, H3b |
| 92 | 8083223 | 205428 | NM_173552 | C3orf58 | chromosome 3 open reading frame 58 |
| 93 | 8113305 | 1105 | NM_001270 | CHD1 | chromodomain helicase DNA binding protein 1 |
| 94 | 8169659 | 4694 | NM_004541 | NDUFA1 | NADH dehydrogenase (ubiquinone) 1 alpha subcomplex, 1, 7.5kDa |
| 95 | 8046408 | 5163 | NM_002610 | PDK1 | pyruvate dehydrogenase kinase, isozyme 1 |
| 96 | 8053599 | 23559 | NM_012477 | WBP1 | WW domain binding protein 1 |
| 97 | 8043377 | 23559 | NM_012477 | WBP1 | WW domain binding protein 1 |
| 98 | 7960878 | 642559 | GU480887 | POU5F1P3 | POU class 5 homeobox 1 pseudogene 3 |
| 99 | 7959023 | 643246 | NM_001085481 | MAP1LC3B2 | microtubule-associated protein 1 light chain 3 beta 2 |
| 100 | 8073148 | 468 | NM_001675 | ATF4 | activating transcription factor 4 (tax-responsive enhancer element B67) |
The CycHyp signature predicts clinical outcome in breast cancer patients
To evaluate the prognostic value of the CycHyp signature, we focused on breast cancer because of the very large amounts of well-annotated clinical data sets available and a clearly identified need to discriminate between patients at low and high risks among subgroups determined on the basis of clinicopathologic criteria [12, 13]. Publicly available GEO data sets allowed us to collect information on the survival of 2,150 patients with primary breast cancer (see clinical features in Table 3).
Table 3. Breast Cancer Patient Demographics and Characteristics.
| All patients n = 2150 No % |
ER+/HER2- n=1452 No % |
ER+/HER2- Node neg. n=899 No % |
ER+/HER2- Node neg. Untreated n=590 No % |
|
|---|---|---|---|---|
| Age | ||||
| ≤50 >50 NA |
649 30 945 44 556 26 |
388 27 649 45 415 28 |
218 24 367 41 314 35 |
190 32 237 40 163 28 |
|
Tumor size |
||||
| ≤2cm >2cm NA |
742 35 473 22 935 43 |
537 37 326 22 589 41 |
474 53 210 23 215 24 |
424 72 158 28 8 1 |
|
Grade |
||||
| 0-1 2 3 NA |
224 10 605 28 487 23 834 39 |
200 14 485 33 206 14 561 39 |
148 17 346 38 162 18 243 27 |
104 18 270 46 137 23 79 13 |
|
Node status |
||||
| Negative Positive |
1329 62 821 38 |
899 62 553 38 |
899 100 0 0 |
590 100 0 0 |
|
Estrogen receptor |
||||
| Negative Positive NA |
443 21 1607 75 100 4 |
0 0 1452 100 0 0 |
0 0 899 100 0 0 |
0 0 590 100 0 0 |
|
HER2 status |
||||
| Negative Positive |
1835 85 315 15 |
1452 100 0 0 |
899 100 0 0 |
590 100 0 0 |
|
Treatment |
||||
| None Chemotherapy Hormonotherapy |
901 42 691 32 558 26 |
590 41 410 28 452 31 |
590 66 73 8 236 26 |
590 100 0 0 0 0 |
In order to exploit these data sets, we first transferred the Gene 1.0ST datasets in the HU133 platform. We then used the VDX dataset (GSE2034 and GSE5327) as a reference because of its large number of node negative untreated patients [17]. This training dataset was used to estimate a prognostic multivariate Cox proportional hazard model built on the CycHyp signature (see Methods for details). The other eight datasets (see references in Table 3) were used according to the methodology described by Haibe-Kains and colleagues [32], to assess the prognostic performance of the CycHyp signature on independent samples. We first chose to evaluate our signature independently of the clinicopathological data. The prognostic potential of the CycHyp signature to discriminate between patients at low or high risk was confirmed with a HR=2.39 and a p-value = 1.13e-18 whathever the treatment and the tumor histology (Figure 2A). We then focused on the ER+ HER2- population which is known to be heterogeneous and thus difficult to treat [12, 13]. The discriminating capacity of the CycHyp signature remained strikingly high in the ER+ HER2- patient populations (HR = 2.47, p-value = 3.88e-13, Figure 2B). Finally, among this subpopulation of patients, we considered those with a node negative status (Figure 2C) and among the latter, those who did not receive any treatment (Figure 2D). Hazard ratios rose to 3.16 and 5.54 in these conditions (p-values = 2.85e-9 and 6.44e-10, respectively), further supporting the discriminating potential of the CycHyp signature. In particular, the data presented in Figure 2D allowed to exclude any confounding influence of the potential benefit arising from the treatment administered to these patients and thus clearly identified a population of patients who remained inadequately untreated.
Figure 2. Kaplan-Meier survival curves of patients with primary breast cancer, as determined by using the CycHyp signature.
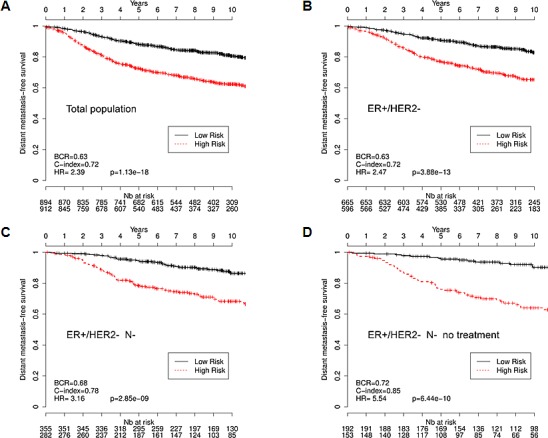
(A) All patients. (B.) ER+/HER2- patients, (C.) node-negative ER+/HER2-, (D.) node-negative, untreated ER+/HER2- patients (DFS Mantel-Cox comparison); hazard ratio (HR), balanced classification rate (BCR) and concordance index (C-index) for the prediction in high risk vs. low risk groups are reported; HRs are presented with their associated p-values.
Using the same methodology, we examined the prognostic capacity of the ContHyp signature (discriminating between normoxia and continuous hypoxia). The performance of the ContHyp signature was satisfactory on the ER+ HER2- untreated population (HR = 2.58, p-value = 1.46e-4, see Supplementary Fig. 1) but was significantly lower (p-value = 3.61e-8) than the CycHyp signature.
The CycHyp signature provides significant additional prognostic information to available multigene assays
To evaluate the performance of the CycHyp signature, we compared it with other well-established prognostic multigene assays for breast cancer, namely Gene70 or Mammaprint [14], Gene76 [17] and Oncotype Dx [15]. Using the same set of ER+ HER2- node negative patients as used in Figure 2D, we could determine the low vs. high risk patient stratification according to these signatures. The superior prognostic potential of the CycHyp signature could be captured from the Kaplan Meier curves obtained with the Gene 70, Gene76 and Oncotype DX signatures (compare Figure 3A with Figure 2D). Hazard ratios confirmed the net advantage of the CycHyp signature with a significantly higher value than the three other metagenes (Figure 3B). The concordance index, which is the probability of a high risk patient to relapse before a low risk patient, was also higher with the CycHyp signature (Figure 3B). Finally, the Balanced Classification Rate (BCR), which represents the average between sensitivity and specificity to discriminate between patients with progressing disease vs. disease-free at 5 years, was significantly higher for the CycHyp signature than the three other multigene assays (Figure 3B). The sensitivity of the CycHyp was above 80% and the specificity of the CycHyp signature was well above the level of the others (Figure 3B). Of note, the metrics corresponding to each data set taken separately is depicted in Suppl. Figure 2.
Figure 3. Comparison of the prognostic potential of the CycHyp signature vs. Gene 70 (Mammaprint), Gene 76 and Oncotype Dx signatures.
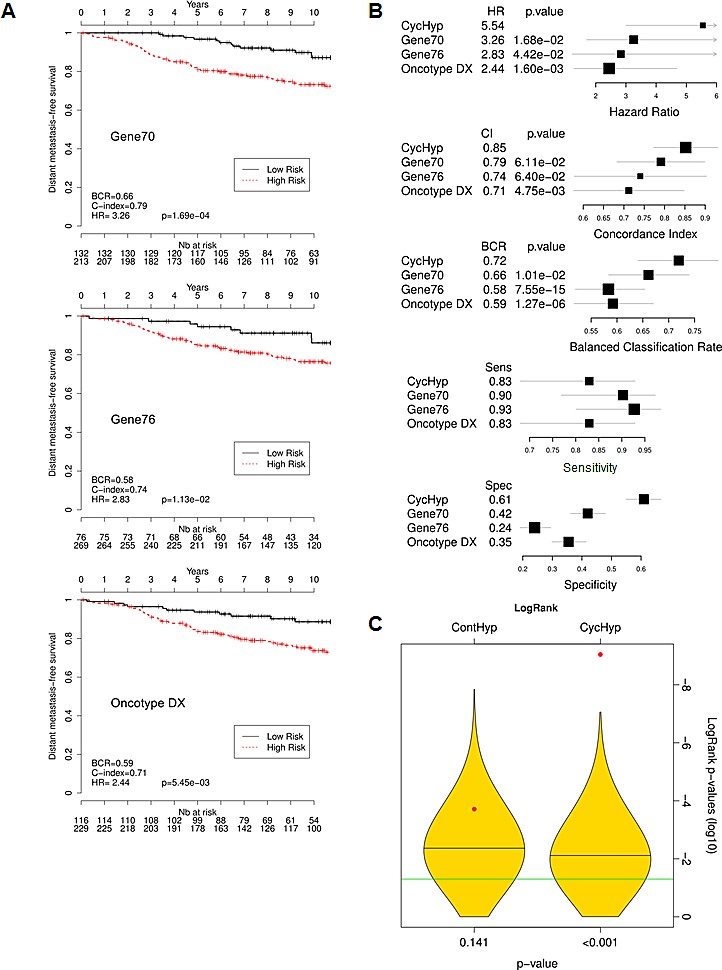
(A) Kaplan-Meier survival curves of node-negative, untreated ER+/HER2- patients, as determined by using the indicated signature (DFS Mantel-Cox comparison); hazard ratio (HR), balanced classification rate (BCR) and C-index for the prediction in high risk vs. low risk groups are reported; HR are presented with their associated p-values. (B.) Forest plots of the hazard ratio (HR), Concordance index (CI), balance classification rate (BCR), sensitivity and specificity for the prediction in high risk vs. low risk groups; p-values refer to the comparisons of CycHyp vs. Gene 70 (Mammaprint), Gene 76 and Oncotype Dx. (C.) Graph represents the power of discrimination in high vs. low risk groups (expressed as the logarithm of the p-values of the logrank) of the ContHyp and CycHyp signatures (see red dots) versus 1,000 randomly generated signatures (yellow shapes depicting their distribution).
Importantly, to further validate the prognostic significance of the CycHyp signature, a comparison with random gene signatures was performed according to the methodology described by Venet et al. [33] and Beck et al. [34]. Figure 3C shows the distribution of the p-values (logrank test in log 10) for 1000 randomly generated signatures together with the p-values of the CycHyp and ContHyp signatures. The logrank test (or Mantel-Haenszel test) [35] is commonly used to assess whether there is a significant survival difference between risk groups. The discrimination between risk groups was significantly higher (P < 0.001) with the CycHyp signature as compared to each of the random signatures whereas the ContHyp signature was not significantly better (vs. random ones; P=0.141). The same analysis was carried out for the three other metrics (HR, CI and BCR) to assess the discrimination capability between risk groups and confirmed the significantly higher value of the CycHyp signature (vs. random signatures) (Suppl. Figure 3).
The CycHyp signature in association with NPI offers a powerful prognostic tool
We then aimed to determine whether the CycHyp signature could improve the Nottingham Prognostic Index (NPI) for better predicting the survival of operable breast cancers. The NPI algorithm combines nodal status, tumour size and histological grade and allows to model a continuum of clinical aggressiveness with 3 subsets of patients divided into good, moderate, and poor prognostic groups with 15-year survival [22, 23, 36]. Since few patients were assigned a poor index, we merged here the moderate and poor indices into a high risk group to facilitate the comparison with the CycHyp signature. We found that by integrating the CycHyp signature, an important proportion of patients could be reclassified to another risk group (Figure 4). 44.1% of patients classified at high risk using the NPI algorithm were identified at low risk when using the CycHyp signature and were confirmed to be “false positive” since they actually exhibited a profile of survival closer to the low risk NPI patient (Figure 4A). Inversely, using the CycHyp signature, we also identified in the patients at low risk based on the NPI criteria, 33.1% of patients with a risk profile closer to the patients with a negative outcome (Figure 4B). This increased discriminating potential remained highly relevant when considering all patients or patients with a ER+ HER2- status (and among the latter, those with a node negative status or the untreated ones) (see Suppl. Figure 4).
Figure 4. Kaplan-Meier survival curves of node-negative, untreated ER+/HER2- patients stratified by using the CycHyp signature to detect.
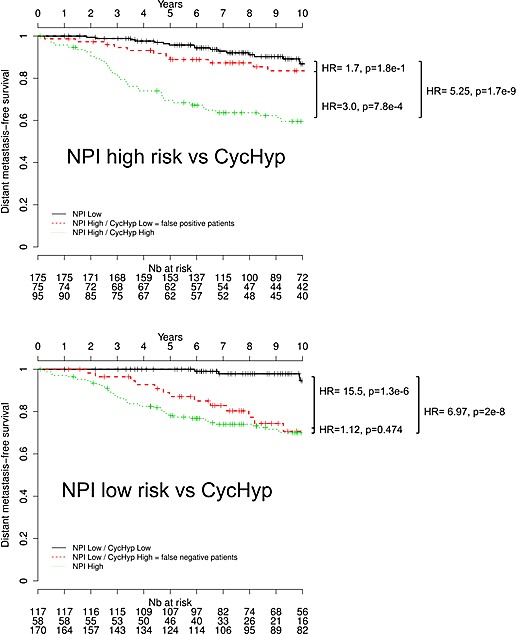
(A.) false positive patients among those identified at high risk based on the NPI nomenclature and (B.) false negative patients among those identified at low risk based on the NPI nomenclature (DFS Mantel-Cox comparison).
DISCUSSION
This study demonstrates that a gene signature derived from the transcriptomic adaptation of tumor cells to cycling hypoxia is prognostic of breast cancer. The CycHyp signature that we have identified and validated in this study has not only prognostic value independently of molecular risk factors but also provides significant additional prognostic information to clinicopathologic criteria. Clinical outcome of breast cancer patients is nowadays largely based on histological grade and the status of ER, PR, and HER2 receptors [12, 13, 22]. In early breast cancer, a lack of expression of ER (and PR) will almost systematically lead to the administration of adjuvant chemotherapy in addition to locoregional treatment [12, 25, 26]. Also, for patients with a tumor expressing HER2, chemotherapy and/or trastuzumab represents the option the most likely to be beneficial based on current clinical knowledge [12]. The impact of chemotherapy is actually more difficult to anticipate for the rest of early-stage breast cancer patients, i.e. those diagnosed with a ER-positive and HER2-negative disease. These patients represent indeed a wide spectrum of different risk profiles: for women with high-risk disease, if chemotherapy is appropriate, others will derive little benefit from it. Our study therefore represents a significant advance for this population of patients, which consists of two third of all breast cancers. We have indeed demonstrated that the CycHyp signature outperforms the existing major prognostic gene expression signatures and offers a unique decision making tool to complement the discrimination of breast cancer patients based on anatomopathologic evaluation.
More generally, the excellent prognostic value of CycHyp confirms the link between cycling hypoxia and cancer aggressiveness [4, 5]. This gives credentials to the phenotypic adaptation of tumors resulting from heterogeneities in blood flow distribution as a trigger of cancer progression [3, 4]. Also, with the recent impetus in the understanding of tumor metabolism [37, 38], it has become obvious that the capacity of a given tumor cell to survive in both aerobic and anaerobic environments represents a critical advantage [39-41]. Interestingly, our study also documents the higher prognostic value of a transcriptomic signature derived from cycling hypoxia vs. continuous hypoxia. This confirms that although hypoxia is a frequent feature of poor-prognosis tumors and was reported to drive gene signature associated with negative outcome [42-45], prognostic markers integrating fluctuations in the hypoxic status of tumors (this study) introduce an additional layer of complexity that better fits the in vivo situation.
Whether the CycHyp signature encompasses genes that actively drive cancer progression or reflects a context of metabolic and hypoxic stress favorable to increased mutagenesis and genetic instability [3], warrants further studies. A few hints can however be gleaned from the comparison of the different signatures.
First, the comparison of the CycHyp and ContHyp signatures indicates that the cycling nature of hypoxia leads to specific alterations in mRNA expression since only 11 common transcripts were found in the two gene lists (see symbols # in Table 1). Furthermore, among these 11 genes, most encode for proteins involved in housekeeping functions such as chromatin packaging (HIST1H 1C, 2AC, 4A and 4C) and RNA processing (RPS13 and 28). The only gene common to the two signatures with a known function related to hypoxia is RBX1 or E3 ubiquitin ligase which mediates the ubiquitination and subsequent proteasomal degradation of target proteins [46], including the misfolded proteins known to accumulate under low pO2. Besides the RBX1 gene, the CycHyp signature does not actually contain genes known to be consistently regulated in response to chronic hypoxia. By contrast, the ContHyp signature contains 14 genes already reported to be overexpressed under low pO2 and even directly under the control of the transcription factor HIF-1α, including those coding for glucose metabolism enzymes (ALDOA, PFKB3, PFKB4, PGK1, PGAM1, GPI) and the angiogenic growth factor VEGFA. This HIF-dependent gene expression program of the ContHyp signature was actually confirmed in the GSEA and MSigBD analyses and was consistent with previously reported hypoxia-driven gene signatures [42, 44, 45]. More generally, these findings position the CycHyp signature far from the conventional hypoxia-derived signatures [29, 30] but instead as a biomarker of a distinct tumor biology process involving adaptation to fluctuations in the tumor microenvironment.
Second, a large amount of transcripts of the CycHyp signature encode for proteins themselves involved in the regulation of transcription. Data mining revealed that more than 18 transcripts of the CycHyp signature are transcription factors/regulators and 13 others are directly involved in RNA processing (see symbols * and § in Table 1, respectively). This represents one third of the genes comprising the CycHyp signature and reflects a major difference with the ContHyp signature. While hypoxia is usually associated with cell cycle arrest and mTOR inhibition, cycling hypoxia may be compatible with a maintained proliferation potential. This is further supported by the suppression of geroconversion (ie, the process leading from proliferative arrest to irreversible senescence) observed in response to hypoxia [47, 48] that offers tumor cells the opportunity to re-enter cell cycle when O2 is again available. Further studies are needed to compare the evolution of mTOR activity and mTOR-dependent genes (including those encoding for ribosomal proteins) during cycling and continuous hypoxia.
Finally, the in vitro conditions at the origin of the establishment of the CycHyp signature may actually have specific bearing on its robustness and applicability. Indeed, we previously documented that fluctuating oxygen levels could also directly impact endothelial cells within a tumor [49, 50] indicating that non-tumor cells may also contribute to the same transcriptomic adaptation as tumor cells, thereby reinforcing the relevance of the CycHyp signature. Also, although we have used the CycHyp signature as a prognostic biomarker for early-stage breast cancer, this signature was identified by integrating the information arising from tumor cells of various origins and characterized by various oncogenic alterations; the prognostic value of the CycHyp signature in other cancers is currently under investigation in our laboratory.
Altogether, the above findings indicate that the CycHyp signature represents a new generation of prognostic biomarker reflecting a generic environmental condition in tumors that differs from the conventional view of a static, continuous hypoxia occurring in tumors. When applied to breast cancer, the CycHyp signature has a powerful prognostic value independently of molecular risk factors but also offers a unique decision making tool to complement the discrimination of patients based on anatomopathologic evaluation. The CycHyp signature is distinct from conventional hypoxia-related gene signature but also from existing prognostic metagenes, and the rationale behind its discovery supports a potential broad applicability to evaluate cancer patient outcomes.
MATERIALS AND METHODS
Tumor cells
Twenty cell lines derived from cancer patients (see Suppl. Table 1 for details) were submitted to cycling hypoxia (CycHyp), i.e. 24 cycles of 30 min incubation under normoxia and 30 min incubation under hypoxic (1% O2) conditions to reproduce tumor hypoxic fluctuations, as previously reported [5, 51]. We also considered control conditions of 24 h continuous exposure of tumor cells to either 21% O2 (Normoxia) or 1% O2 (ContHyp). For each culture condition, cells were immediately snap-frozen at the end of the last incubation period.
Identification of the signatures
mRNA extracts from each tumor cell cultured under the three above conditions (normoxia, cycling hypoxia and continuous hypoxia) were analysed by hybridization on Human Gene 1.0 ST Affymetrix microarrays (GEO access number: GSE42416):
http://www.ncbi.nlm.nih.gov/geo/query/acc.cgi?token=probzowmiyseqxm&acc=GSE42416
The extent of the resulting tumor cell datasets (20 samples in each of the three conditions) led us to resort on a resampling mechanism to increase the robustness of the signatures to be identified. For every resampling experiment, a subset of 90 % of the samples was chosen uniformly at random as a training set and the remaining 10% were used as validation set. Differentially expressed probesets (one probeset = a collection of probes designed to interrogate a given sequence) were assessed on each subset according to a t-test and the corresponding FDR corrected p-values were reported. The 100 probesets with the lowest corrected p-values, averaged over 200 resamplings [52-54], formed the CycHyp (Table 1) or ContHyp (Table 2) signatures. All such expression differences were highly significant (p<1e-4) after Benjamini-Hochberg FDR correction for the multiplicity of the test [55]. Of note, in each resampling, the 10 % data not used to select probesets allowed one to estimate the discrimination potential between (cycling or continuous) hypoxia versus normoxia conditions. The average classification accuracy over all resamplings amounted to 97.5 % for CycHyp and 94.3% for ContHyp.
The 100 HGU1.0 ST probesets forming the CycHyp signature corresponded to 94 unique Entrez GeneID in the NCBI database, out of which 69 genes were available on the HGU133a platform (i.e., the technology used in most clinical studies considered here). Those 69 genes were represented by 87 HGU133a probesets. The few datasets collected on HGU133plus2 were reduced to the probesets also present on HGU133a.
Patient data sets
All breast cancer expression data were summarized with MAS5 and represented in log2 scale (except for GSE6532 already summarized with RMA). Breast cancer subtypes (ER+/HER2-, ER-/HER2- and HER2+) were identified with the genefu R package [56] (see Supplementary R Package). Disease-free survival at 5 years was used as the survival endpoint. The data from all patients were censored at 10 years to have comparable follow-up times across clinical studies [32].
Prognostic models of the clinical outcome
The VDX dataset (GSE2034 and GSE5327 from the GEO database) was considered as a reference because of its large number of node-negative untreated patients [17]. This dataset formed the training set used to estimate a prognostic model of the clinical outcome. A risk score for each patient was computed from a penalized Cox proportional hazards model [57] implemented in the Penalized R package [58]; the parameters of the elastic net penalty were learned on the training set by cross-validation. Prediction into a high risk vs. low risk group resulted from a predefined threshold value on this risk score. The decision threshold was chosen on the training set to maximize the specificity and sensitivity of the discrimination between patients with progressing disease versus disease-free patients at 5 years. Following the methodology described by Haibe-Kains et al. [32], all other datasets were used as validations to assess the prognostic performances on independent samples, i.e. balanced classification rate (BCR), concordance index (CI) [59] and hazard ratio (HR) [60]. The survcomp R packages were used to test the significance of the HR and CI values [33] while a Z-test allowed to infer p-values for the BCR relying on an approximation by a normal distribution.
Prognostic performances of a penalized Cox model defined on the CycHyp signature were also compared with well-established prognosis models for breast cancer, namely Gene 70 (Mammaprint) [14], Gene 76 [17] and Oncotype DX [15] signatures. Those existing signatures were associated to specific prognostic models implemented in the genefu R package [56]. Comparison of CycHyp and ContHyp signatures was also carried out with random gene signatures of the same sizes, i.e. 87 and 123 probesets, respectively. One thousand signatures of each size were generated and analysed using the methodology described by Venet et al. [11]. The objective of those experiments was to assess to which extent the CycHyp and ContHyp signatures had a better discrimination power between risk groups than random signatures. Gene Set Enrichment Assay (GSEA) analysis was also performed using the molecular signature database (MSigDB) and the CycHyp and ContHyp signatures expanded to 2118 and 2065 differentially expressed genes, respectively (after FDR correction and averaged over all resamplings.
SUPPLEMENTARY MATERIAL TABLES AND FIGURES
Acknowledgments
This work was supported by grants from the Fédération Wallonie-Bruxelles (WB Health program HypoScreen), the Fonds de la Recherche Scientifique (F.R.S-FNRS), the Télévie, the Belgian Foundation against cancer, the J. Maisin Foundation, the interuniversity attraction pole (IUAP) research program #UP7-03 from the Belgian Science Policy Office (Belspo) and an Action de Recherche Concertée (ARC 09/14-020), O. Feron and P. Dupont equally supervised this work.
Footnotes
CONFLICT OF INTEREST
The authors declare that they have no conflicts of interest relating to this study.
REFERENCES
- 1.Semenza GL. Oxygen sensing, homeostasis, and disease. N Engl J Med. 2011;365:537–547. doi: 10.1056/NEJMra1011165. [DOI] [PubMed] [Google Scholar]
- 2.Bertout JA, Patel SA, Simon MC. The impact of O2 availability on human cancer. Nat Rev Cancer. 2008;8:967–975. doi: 10.1038/nrc2540. [DOI] [PMC free article] [PubMed] [Google Scholar]
- 3.Bristow RG, Hill RP. Hypoxia and metabolism. Hypoxia, DNA repair and genetic instability. Nat Rev Cancer. 2008;8:180–192. doi: 10.1038/nrc2344. [DOI] [PubMed] [Google Scholar]
- 4.Dewhirst MW, Cao Y, Moeller B. Cycling hypoxia and free radicals regulate angiogenesis and radiotherapy response. Nat Rev Cancer. 2008;8:425–437. doi: 10.1038/nrc2397. [DOI] [PMC free article] [PubMed] [Google Scholar]
- 5.Dewhirst MW. Relationships between cycling hypoxia, HIF-1, angiogenesis and oxidative stress. Radiat Res. 2009;172:653–665. doi: 10.1667/RR1926.1. [DOI] [PMC free article] [PubMed] [Google Scholar]
- 6.Yasui H, Matsumoto S, Devasahayam N, Munasinghe JP, Choudhuri R, Saito K, Subramanian S, Mitchell JB, Krishna MC. Low-field magnetic resonance imaging to visualize chronic and cycling hypoxia in tumor-bearing mice. Cancer Res. 2010;70:6427–6436. doi: 10.1158/0008-5472.CAN-10-1350. [DOI] [PMC free article] [PubMed] [Google Scholar]
- 7.Baudelet C, Cron GO, Ansiaux R, Crokart N, Dewever J, Feron O, Gallez B. The role of vessel maturation and vessel functionality in spontaneous fluctuations of T2*-weighted GRE signal within tumors. NMR Biomed. 2006;19:69–76. doi: 10.1002/nbm.1002. [DOI] [PubMed] [Google Scholar]
- 8.Baudelet C, Ansiaux R, Jordan BF, Havaux X, Macq B, Gallez B. Physiological noise in murine solid tumours using T2*-weighted gradient-echo imaging: a marker of tumour acute hypoxia? Phys Med Biol. 2004;49:3389–3411. doi: 10.1088/0031-9155/49/15/006. [DOI] [PubMed] [Google Scholar]
- 9.Martinive P, De WJ, Bouzin C, Baudelet C, Sonveaux P, Gregoire V, Gallez B, Feron O. Reversal of temporal and spatial heterogeneities in tumor perfusion identifies the tumor vascular tone as a tunable variable to improve drug delivery. Mol Cancer Ther. 2006;5:1620–1627. doi: 10.1158/1535-7163.MCT-05-0472. [DOI] [PubMed] [Google Scholar]
- 10.Chitneni SK, Palmer GM, Zalutsky MR, Dewhirst MW. Molecular imaging of hypoxia. J Nucl Med. 2011;52:165–168. doi: 10.2967/jnumed.110.075663. [DOI] [PMC free article] [PubMed] [Google Scholar]
- 11.Krishna MC, Matsumoto S, Yasui H, Saito K, Devasahayam N, Subramanian S, Mitchell JB. Electron paramagnetic resonance imaging of tumor pO(2) Radiat Res. 2012;177:376–386. doi: 10.1667/rr2622.1. [DOI] [PubMed] [Google Scholar]
- 12.Reis-Filho JS, Pusztai L. Gene expression profiling in breast cancer: classification, prognostication, and prediction. Lancet. 2011;378:1812–1823. doi: 10.1016/S0140-6736(11)61539-0. [DOI] [PubMed] [Google Scholar]
- 13.Prat A, Ellis MJ, Perou CM. Practical implications of gene-expression-based assays for breast oncologists. Nat Rev Clin Oncol. 2012;9:48–57. doi: 10.1038/nrclinonc.2011.178. [DOI] [PMC free article] [PubMed] [Google Scholar]
- 14.van 't Veer LJ, Dai H, van de Vijver MJ, He YD, Hart AA, Mao M, Peterse HL, van der Kooy K, Marton MJ, Witteveen AT, Schreiber GJ, Kerkhoven RM, Roberts C, et al. Gene expression profiling predicts clinical outcome of breast cancer. Nature. 2002;415:530–536. doi: 10.1038/415530a. [DOI] [PubMed] [Google Scholar]
- 15.Paik S, Shak S, Tang G, Kim C, Baker J, Cronin M, Baehner FL, Walker MG, Watson D, Park T, Hiller W, Fisher ER, Wickerham DL, et al. A multigene assay to predict recurrence of tamoxifen-treated, node-negative breast cancer. N Engl J Med. 2004;351:2817–2826. doi: 10.1056/NEJMoa041588. [DOI] [PubMed] [Google Scholar]
- 16.Sotiriou C, Neo SY, McShane LM, Korn EL, Long PM, Jazaeri A, Martiat P, Fox SB, Harris AL, Liu ET. Breast cancer classification and prognosis based on gene expression profiles from a population-based study. Proc Natl Acad Sci USA. 2003;100:10393–10398. doi: 10.1073/pnas.1732912100. [DOI] [PMC free article] [PubMed] [Google Scholar]
- 17.Wang Y, Klijn JG, Zhang Y, Sieuwerts AM, Look MP, Yang F, Talantov D, Timmermans M, Meijer-van Gelder ME, Yu J, Jatkoe T, Berns EM, Atkins D, et al. Gene-expression profiles to predict distant metastasis of lymph-node-negative primary breast cancer. Lancet. 2005;365:671–679. doi: 10.1016/S0140-6736(05)17947-1. [DOI] [PubMed] [Google Scholar]
- 18.Sparano JA, Paik S. Development of the 21-gene assay and its application in clinical practice and clinical trials. J Clin Oncol. 2008;26:721–728. doi: 10.1200/JCO.2007.15.1068. [DOI] [PubMed] [Google Scholar]
- 19.Sotiriou C, Pusztai L. Gene-expression signatures in breast cancer. N Engl J Med. 2009;360:790–800. doi: 10.1056/NEJMra0801289. [DOI] [PubMed] [Google Scholar]
- 20.Liu JC, Egan SE, Zacksenhaus E. A Tumor initiating cell-enriched prognostic signature for HER2+:ERalpha- breast cancer; rationale, new features, controversies and future directions. Oncotarget. 2013;4:1317–1328. doi: 10.18632/oncotarget.1170. [DOI] [PMC free article] [PubMed] [Google Scholar]
- 21.Snijders AM, Langley S, Mao JH, Bhatnagar S, Bjornstad KA, Rosen CJ, Lo A, Huang Y, Blakely EA, Karpen GH, Bissell MJ, Wyrobek AJ. An interferon signature identified by RNA-sequencing of mammary tissues varies across the estrous cycle and is predictive of metastasis-free survival. Oncotarget. 2014;5:4011–4025. doi: 10.18632/oncotarget.2148. [DOI] [PMC free article] [PubMed] [Google Scholar]
- 22.Rakha EA, Reis-Filho JS, Baehner F, Dabbs DJ, Decker T, Eusebi V, Fox SB, Ichihara S, Jacquemier J, Lakhani SR, Palacios J, Richardson AL, Schnitt SJ, et al. Breast cancer prognostic classification in the molecular era: the role of histological grade. Breast Cancer Res. 2010;12:207. doi: 10.1186/bcr2607. [DOI] [PMC free article] [PubMed] [Google Scholar]
- 23.Galea MH, Blamey RW, Elston CE, Ellis IO. The Nottingham Prognostic Index in primary breast cancer. Breast Cancer Res Treat. 1992;22:207–219. doi: 10.1007/BF01840834. [DOI] [PubMed] [Google Scholar]
- 24.Ravdin PM, Siminoff LA, Davis GJ, Mercer MB, Hewlett J, Gerson N, Parker HL. Computer program to assist in making decisions about adjuvant therapy for women with early breast cancer. J Clin Oncol. 2001;19:980–991. doi: 10.1200/JCO.2001.19.4.980. [DOI] [PubMed] [Google Scholar]
- 25.Espinosa E, Vara JA, Navarro IS, Gamez-Pozo A, Pinto A, Zamora P, Redondo A, Feliu J. Gene profiling in breast cancer: time to move forward. Cancer Treat Rev. 2011;37:416–421. doi: 10.1016/j.ctrv.2010.12.009. [DOI] [PubMed] [Google Scholar]
- 26.Eng-Wong J, Isaacs C. Prediction of benefit from adjuvant treatment in patients with breast cancer. Clin Breast Cancer. 2010;10(Suppl 1):E32–E37. doi: 10.3816/CBC.2010.s.005. [DOI] [PubMed] [Google Scholar]
- 27.Ignatiadis M, Singhal SK, Desmedt C, Haibe-Kains B, Criscitiello C, Andre F, Loi S, Piccart M, Michiels S, Sotiriou C. Gene modules and response to neoadjuvant chemotherapy in breast cancer subtypes: a pooled analysis. J Clin Oncol. 2012;30:1996–2004. doi: 10.1200/JCO.2011.39.5624. [DOI] [PubMed] [Google Scholar]
- 28.Subramanian A, Tamayo P, Mootha VK, Mukherjee S, Ebert BL, Gillette MA, Paulovich A, Pomeroy SL, Golub TR, Lander ES, Mesirov JP. Gene set enrichment analysis: a knowledge-based approach for interpreting genome-wide expression profiles. Proc Natl Acad Sci USA. 2005;102:15545–15550. doi: 10.1073/pnas.0506580102. [DOI] [PMC free article] [PubMed] [Google Scholar]
- 29.Seigneuric R, Starmans MH, Fung G, Krishnapuram B, Nuyten DS, van EA, Magagnin MG, Rouschop KM, Krishnan S, Rao RB, Evelo CT, Begg AC, Wouters BG, et al. Impact of supervised gene signatures of early hypoxia on patient survival. Radiother Oncol. 2007;83:374–382. doi: 10.1016/j.radonc.2007.05.002. [DOI] [PubMed] [Google Scholar]
- 30.Starmans MH, Chu KC, Haider S, Nguyen F, Seigneuric R, Magagnin MG, Koritzinsky M, Kasprzyk A, Boutros PC, Wouters BG, Lambin P. The prognostic value of temporal in vitro and in vivo derived hypoxia gene-expression signatures in breast cancer. Radiother Oncol. 2012;102:436–443. doi: 10.1016/j.radonc.2012.02.002. [DOI] [PubMed] [Google Scholar]
- 31.Essaghir A, Demoulin JB. A minimal connected network of transcription factors regulated in human tumors and its application to the quest for universal cancer biomarkers. PLoS One. 2012;7:e39666. doi: 10.1371/journal.pone.0039666. [DOI] [PMC free article] [PubMed] [Google Scholar]
- 32.Haibe-Kains B, Desmedt C, Sotiriou C, Bontempi G. A comparative study of survival models for breast cancer prognostication based on microarray data: does a single gene beat them all? Bioinformatics. 2008;24:2200–2208. doi: 10.1093/bioinformatics/btn374. [DOI] [PMC free article] [PubMed] [Google Scholar]
- 33.Venet D, Dumont JE, Detours V. Most random gene expression signatures are significantly associated with breast cancer outcome. PLoS Comput Biol. 2011;7:e1002240. doi: 10.1371/journal.pcbi.1002240. [DOI] [PMC free article] [PubMed] [Google Scholar]
- 34.Beck AH, Knoblauch NW, Hefti MM, Kaplan J, Schnitt SJ, Culhane AC, Schroeder MS, Risch T, Quackenbush J, Haibe-Kains B. Significance analysis of prognostic signatures. PLoS Comput Biol. 2013;9:e1002875. doi: 10.1371/journal.pcbi.1002875. [DOI] [PMC free article] [PubMed] [Google Scholar]
- 35.Mantel N, Haenszel W. Statistical aspects of the analysis of data from retrospective studies of disease. J Natl Cancer Inst. 1959;22:719–748. [PubMed] [Google Scholar]
- 36.Balslev I, Axelsson CK, Zedeler K, Rasmussen BB, Carstensen B, Mouridsen HT. The Nottingham Prognostic Index applied to 9,149 patients from the studies of the Danish Breast Cancer Cooperative Group (DBCG) Breast Cancer Res Treat. 1994;32:281–290. doi: 10.1007/BF00666005. [DOI] [PubMed] [Google Scholar]
- 37.Koppenol WH, Bounds PL, Dang CV. Otto Warburg's contributions to current concepts of cancer metabolism. Nat Rev Cancer. 2011;11:325–337. doi: 10.1038/nrc3038. [DOI] [PubMed] [Google Scholar]
- 38.Feron O. Pyruvate into lactate and back: from the Warburg effect to symbiotic energy fuel exchange in cancer cells. Radiother Oncol. 2009;92:329–333. doi: 10.1016/j.radonc.2009.06.025. [DOI] [PubMed] [Google Scholar]
- 39.Wise DR, Ward PS, Shay JE, Cross JR, Gruber JJ, Sachdeva UM, Platt JM, DeMatteo RG, Simon MC, Thompson CB. Hypoxia promotes isocitrate dehydrogenase-dependent carboxylation of alpha-ketoglutarate to citrate to support cell growth and viability. Proc Natl Acad Sci USA. 2011;108:19611–19616. doi: 10.1073/pnas.1117773108. [DOI] [PMC free article] [PubMed] [Google Scholar]
- 40.Sonveaux P, Vegran F, Schroeder T, Wergin MC, Verrax J, Rabbani ZN, De Saedeleer CJ, Kennedy KM, Diepart C, Jordan BF, Kelley MJ, Gallez B, Wahl ML, et al. Targeting lactate-fueled respiration selectively kills hypoxic tumor cells in mice. J Clin Invest. 2008;118:3930–3942. doi: 10.1172/JCI36843. [DOI] [PMC free article] [PubMed] [Google Scholar]
- 41.Boidot R, Vegran F, Meulle A, Le Breton A, Dessy C, Sonveaux P, Lizard-Nacol S, Feron O. Regulation of monocarboxylate transporter MCT1 expression by p53 mediates inward and outward lactate fluxes in tumors. Cancer Res. 2012;72:939–948. doi: 10.1158/0008-5472.CAN-11-2474. [DOI] [PubMed] [Google Scholar]
- 42.Chi JT, Wang Z, Nuyten DS, Rodriguez EH, Schaner ME, Salim A, Wang Y, Kristensen GB, Helland A, Borresen-Dale AL, Giaccia A, Longaker MT, Hastie T, et al. Gene expression programs in response to hypoxia: cell type specificity and prognostic significance in human cancers. PLoS Med. 2006;3:e47. doi: 10.1371/journal.pmed.0030047. [DOI] [PMC free article] [PubMed] [Google Scholar]
- 43.Winter SC, Buffa FM, Silva P, Miller C, Valentine HR, Turley H, Shah KA, Cox GJ, Corbridge RJ, Homer JJ, Musgrove B, Slevin N, Sloan P, et al. Relation of a hypoxia metagene derived from head and neck cancer to prognosis of multiple cancers. Cancer Res. 2007;67:3441–3449. doi: 10.1158/0008-5472.CAN-06-3322. [DOI] [PubMed] [Google Scholar]
- 44.Buffa FM, Harris AL, West CM, Miller CJ. Large meta-analysis of multiple cancers reveals a common, compact and highly prognostic hypoxia metagene. Br J Cancer. 2010;102:428–435. doi: 10.1038/sj.bjc.6605450. [DOI] [PMC free article] [PubMed] [Google Scholar]
- 45.Favaro E, Lord S, Harris AL, Buffa FM. Gene expression and hypoxia in breast cancer. Genome Med. 2011;3:55. doi: 10.1186/gm271. [DOI] [PMC free article] [PubMed] [Google Scholar]
- 46.Micel LN, Tentler JJ, Smith PG, Eckhardt GS. Role of ubiquitin ligases and the proteasome in oncogenesis: novel targets for anticancer therapies. J Clin Oncol. 2013;31:1231–1238. doi: 10.1200/JCO.2012.44.0958. [DOI] [PMC free article] [PubMed] [Google Scholar]
- 47.Leontieva OV, Blagosklonny MV. Hypoxia and gerosuppression: the mTOR saga continues. Cell cycle. 2012;11:3926–3931. doi: 10.4161/cc.21908. [DOI] [PMC free article] [PubMed] [Google Scholar]
- 48.Leontieva OV, Natarajan V, Demidenko ZN, Burdelya LG, Gudkov AV, Blagosklonny MV. Hypoxia suppresses conversion from proliferative arrest to cellular senescence. Proc Natl Acad Sci USA. 2012;109:13314–13318. doi: 10.1073/pnas.1205690109. [DOI] [PMC free article] [PubMed] [Google Scholar]
- 49.Martinive P, Defresne F, Bouzin C, Saliez J, Lair F, Gregoire V, Michiels C, Dessy C, Feron O. Preconditioning of the tumor vasculature and tumor cells by intermittent hypoxia: implications for anticancer therapies. Cancer Res. 2006;66:11736–11744. doi: 10.1158/0008-5472.CAN-06-2056. [DOI] [PubMed] [Google Scholar]
- 50.Daneau G, Boidot R, Martinive P, Feron O. Identification of cyclooxygenase-2 as a major actor of the transcriptomic adaptation of endothelial and tumor cells to cyclic hypoxia: effect on angiogenesis and metastases. Clin Cancer Res. 2010;16:410–419. doi: 10.1158/1078-0432.CCR-09-0583. [DOI] [PubMed] [Google Scholar]
- 51.Dewhirst MW. Intermittent hypoxia furthers the rationale for hypoxia-inducible factor-1 targeting. Cancer Res. 2007;67:854–855. doi: 10.1158/0008-5472.CAN-06-4744. [DOI] [PubMed] [Google Scholar]
- 52.Davis CA, Gerick F, Hintermair V, Friedel CC, Fundel K, Kuffner R, Zimmer R. Reliable gene signatures for microarray classification: assessment of stability and performance. Bioinformatics. 2006;22:2356–2363. doi: 10.1093/bioinformatics/btl400. [DOI] [PubMed] [Google Scholar]
- 53.Abeel T, Helleputte T, Van de Peer Y, Dupont P, Saeys Y. Robust biomarker identification for cancer diagnosis with ensemble feature selection methods. Bioinformatics. 2010;26:392–398. doi: 10.1093/bioinformatics/btp630. [DOI] [PubMed] [Google Scholar]
- 54.Bach FR. Bolasso: model consistent Lasso estimation through the bootstrap. Proceedings of the 25th international conference on Machine learning. 2008:33–40. [Google Scholar]
- 55.Benjamini Y, Hochberg Y. Controlling the false discovery rate: a practical and powerful approach to multiple testing. J R Stat Soc. 1995;57:289–300. [Google Scholar]
- 56.Haibe-Kains B, Desmedt C, Rothe F, Piccart M, Sotiriou C, Bontempi G. A fuzzy gene expression-based computational approach improves breast cancer prognostication. Genome Biol. 2010;11:R18. doi: 10.1186/gb-2010-11-2-r18. [DOI] [PMC free article] [PubMed] [Google Scholar]
- 57.Simon N, Friedman J, Hastie T, Tibshirani R. Regularization paths for Cox's proportional hazards model via coordinate descent. Journal of statistical software. 2011:39. doi: 10.18637/jss.v039.i05. [DOI] [PMC free article] [PubMed] [Google Scholar]
- 58.Goeman JJ. L1 penalized estimation in the Cox proportional hazards model. BiomJ. 2010;52:70–84. doi: 10.1002/bimj.200900028. [DOI] [PubMed] [Google Scholar]
- 59.Harrell FE, Jr, Lee KL, Mark DB. Multivariable prognostic models: issues in developing models, evaluating assumptions and adequacy, and measuring and reducing errors. Stat Med. 1996;15:361–387. doi: 10.1002/(SICI)1097-0258(19960229)15:4<361::AID-SIM168>3.0.CO;2-4. [DOI] [PubMed] [Google Scholar]
- 60.Cox D. Regression models and life-tables. J R Stat Soc. 1972;34:187–220. [Google Scholar]
Associated Data
This section collects any data citations, data availability statements, or supplementary materials included in this article.