

Abstract
The comprehension of protein and DNA binding in vivo is essential to understand gene regulation. Chromatin immunoprecipitation followed by sequencing (ChIP-seq) provides a global map of the regulatory binding network. Most ChIP-seq analysis tools focus on identifying binding regions from coverage enrichment. However, less work has been performed to infer the physical and regulatory details inside the enriched regions. This research extends a previous blind-deconvolution approach to develop a post-peak–calling algorithm that improves binding site resolution and predicts cooperative interactions. At the core of our new method is a physically motivated model that characterizes the binding signal as an extreme value distribution. This model suggests a mathematical framework to study physical properties of DNA shearing from the ChIP-seq coverage. The model explains the ChIP-seq coverage with two signals: The first considers DNA fragments with only a single binding event, whereas the second considers fragments with two binding events (a double-binding signal). The model incorporates motif discovery and is able to detect multiple sites in an enriched region with single-nucleotide resolution, high sensitivity, and high specificity. Our method improves peak caller sensitivity, from less than 45% up to 94%, at a false positive rate <11% for a set of 47 experimentally validated prokaryotic sites. It also improves resolution of highly enriched regions of large-scale eukaryotic data sets. The double-binding signal provides a novel application in ChIP-seq analysis: the identification of cooperative interaction. Predictions of known cooperative binding sites show a 0.85 area under an ROC curve.
The success of an organism depends on expressing the right set of genes in response to different environmental challenges. Regulatory proteins, namely, transcription factors (TF), mediate this response. The TFs are able to recognize and bind specific DNA sequences, promoting or blocking the recruitment of RNA polymerase and the initialization of transcription (Browning and Busby 2004). In order to understand the molecular basis of gene regulation, it is important to characterize and identify the mechanisms that drive TF binding in vivo.
Gene regulation can be studied from a thermodynamics point of view. In this context, a DNA sequence contains multiple binding sites and a probability is associated with each possible binding configuration, which describes the sites that are bound and the ones that are not. This approach provides a quantitative understanding of gene regulation and has been used for predicting cell phenotypes, such as gene expression and embryo development (Zinzen et al. 2006; Segal et al. 2008; Segal and Widom 2009; He et al. 2010). The accuracy of such models depends on understanding the underlying factors that contribute to the configuration probabilities and associating the correct probability to each binding configuration.
The probability of each configuration depends on the affinity between a TF and its corresponding binding sites (Maerkl and Quake 2007; Segal and Widom 2009; Zhao et al. 2009; Stormo and Zhao 2010). Motif discovery has been used to study this phenomenon (Segal et al. 2008; He et al. 2010), but motif presence alone is not sufficient to characterize TF binding under physiological conditions (Barski et al. 2007; Robertson et al. 2007; Kaplan et al. 2008; Kim and O’Shea 2008; Visel et al. 2009; Gordon et al. 2010; MacQuarrie et al. 2011). Binding observed in vivo (Valouev et al. 2008) does not correlate well with affinity observed in vitro (Berger and Bulyk 2009). Also, only a fraction of sites are bound under physiological conditions (Robertson et al. 2007; Visel et al. 2009; MacQuarrie et al. 2011). One potential reason for these differences is changes in site accessibility under different physiological conditions (Barski et al. 2007; Kaplan et al. 2008; Kim and O’Shea 2008; Gordon et al. 2010; Pique-Regi et al. 2011).
In addition, binding is affected by the presence and location of multiple sites inside the same regulatory region (Johnson et al. 2007; Chauhan and Tyagi 2008; Valouev et al. 2008; Vasudeva-Rao and McDonough 2008; Chauhan et al. 2011). The presence of multiple sites can lead to cooperative interactions that impact the dynamics of gene regulation (Gertz et al. 2009). Also, the position of a site influences whether binding activates or represses expression (Oppenheim et al. 2005; Larochelle et al. 2006). Thus, an accurate understanding of the gene regulatory network depends on the number and precise location of sites that are bound in vivo as well as possible interactions among them within each regulatory region.
Advances in sequencing technology have provided new opportunities to map gene regulatory networks on a genome scale. Chromatin immunoprecipitation followed by sequencing (ChIP-seq) (Barski et al. 2007; Johnson et al. 2007; Robertson et al. 2007), and more recently, ChIP-exo (Rhee and Pugh 2011) are currently the most advanced technologies for this purpose. The principle of chromatin immunoprecipitation consists of using antibody selection to purify DNA fragments that are bound by the TF of interest, and the sequencing technology provides reads that identify the purified DNA. These reads are then aligned to a reference genome and yield a region of enriched coverage around the TF binding sites.
The initial studies of ChIP-seq (Barski et al. 2007; Johnson et al. 2007; Robertson et al. 2007) focused on identifying and validating the enriched regions for well-characterized DNA binding factors (Hartman et al. 2005; Gaszner and Felsenfeld 2006; Mortazavi et al. 2006; Heintzman et al. 2007). Subsequent papers described the underlying signals of ChIP-seq and developed algorithms to identify enriched regions (also known as peak callers) (Kharchenko et al. 2008; Valouev et al. 2008; Zhang et al. 2008; Lun et al. 2009). One of the most successful signatures identified to date is a peak shift between the coverage of reads mapped to the forward and reverse strand. This signature improves the sensitivity of binding site detection (Kharchenko et al. 2008; Valouev et al. 2008) and was used to develop a benchmark for ChIP-seq analysis (Rye et al. 2011). The integration of sequence motifs and ChIP-seq coverage has also been proposed to improve sensitivity of binding site detection (Boeva et al. 2010; Guo et al. 2012).
Multiple peak callers have been proposed (Pepke et al. 2009; Wilbanks and Facciotti 2010; Rye et al. 2011), but little attention has been given to the physical and regulatory interactions inside each enriched region (Lun et al. 2009; Salmon-Divon et al. 2010). One of the earliest attempts in this direction was csdeconv (Lun et al. 2009). Csdeconv considered ChIP-seq coverage in the context of signal processing and used a blind-deconvolution algorithm to identify multiple binding sites inside an enriched region. However, the application of csdeconv in data sets with a large number of enriched regions has not been practical due to its high computational cost (Wilbanks and Facciotti 2010). Other methods have also been proposed to identify multiple binding sites inside the same region (Guo et al. 2010, 2012; Zhang et al. 2011; Chung et al. 2013).
In this research, we have built on the concepts introduced by csdeconv to develop Binding Resolution Amplifier and Cooperative Interaction Locator (BRACIL), a new method that improves computational performance, refines the spatial resolution of binding site detection, and predicts cooperative interactions. BRACIL is a post-peak–calling method that refines the regulatory information derived from enriched regions and is a complementary step to the current state of ChIP-seq analysis (Furey 2012). Our investigation starts by modeling the physical process that describes how in vivo binding translates into the ChIP-seq coverage. This approach allows a mathematical solution for the binding site impulse response with a physical interpretation for its parameters. Specifically, the parameters are related to physical properties of DNA shearing. The advantages of this model are illustrated in two biological applications: (1) the detection of binding sites with single-nucleotide resolution; and (2) the detection of cooperative interactions. BRACIL is inspired by the blind-deconvolution approach of csdeconv (Lun et al. 2009) and explicitly integrates ChIP-seq coverage with motif discovery. BRACIL takes advantage of the high-resolution information provided by motif conservation and uses the ChIP-seq coverage to identify motifs that contribute to the binding signal. We also modeled a second-order signal that represents DNA fragments with two sites bound simultaneously, the double-binding signal. The double-binding signal improves binding site detection and allows a novel application in the ChIP-seq analysis: detection of cooperative interaction. We validated our method on a reference set of 47 binding sites including well-characterized instances of cooperative interaction (Chauhan et al. 2011).
Results
Decoding model
As in csdeconv (Lun et al. 2009), our method approaches the ChIP-seq process from a signal processing perspective (Fig. 1). In this context, an impulse signal represents a binding site and the process of ChIP-seq emits a corresponding impulse response. The sum of impulse responses from all TF binding sites generates the observed ChIP-seq coverage (see Fig. 1A). We have developed a blind-deconvolution algorithm that identifies the binding site locations and corresponding magnitudes from ChIP-seq coverage (Fig. 1B). In this algorithm, the term “blind” indicates that the parameters for the impulse response have to be learned from the data. Also, our method exploits the information contained in the genome sequence, by means of motif discovery, to constrain the search space and improve the resolution of binding site detection.
Figure 1.
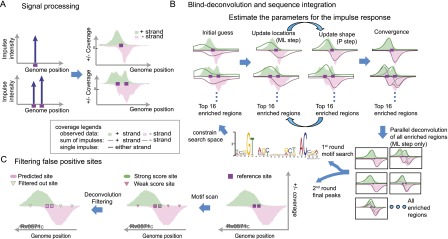
Illustration of the integrated model used to detect binding sites at high resolution. (A) The binding sites are a signal source. Each binding site (purple box) may emit an impulse response (blue upward arrow) that can be observed in the coverage of the ChIP-seq data (right). If two sites are close to each other, the observed data shows an overlap of the impulse responses from each site. (B) Illustration of the algorithm for binding site detection. The blind-deconvolution algorithm is broken into two parts to optimize the computational efficiency (see inset legend for detailed meaning of each line and color). First, both the ML and P steps are applied in a subset of enriched regions to estimate the parameters for the impulse response (top). Following, the ML step predicts the binding site locations for all regions in parallel (bottom right). From the output of the deconvolution process, we are able to predict a binding motif. This motif predicts potential binding sites that constrain the search space for a second round of the blind-deconvolution algorithm. This representation also illustrates the fit of a Gumbel distribution (green/red solid lines) in the ChIP-seq coverage (green/red shaded area). (C) Our method filters out false positives detected by the motif scan. Motif scan predicts binding sites that do not correspond to a true physiological binding. Our algorithm is inclusive with respect to low-affinity sites and uses the ChIP-seq coverage to filter out false positives.
The blind-deconvolution algorithm consists of two iterative steps (Fig. 1B): one that updates the magnitude and location of the binding sites (ML step); and one that updates the shape of the impulse response (P step). These steps are alternated until convergence. This iterative process is computationally expensive and explains why the use of csdeconv (Lun et al. 2009) has been restricted to data sets that contain only a few enriched regions (Wilbanks and Facciotti 2010). Our method improves computational efficiency by training the parameters of the impulse response in only a subset of the enriched regions (see Methods). This simplification reduces the number of regions evaluated in the iterative part of the algorithm and reduces the computational cost from O(2 · i · n) to O(2 · i), where n is the number of enriched regions and i is the number of iterative steps taken until convergence. Moreover, after the parameters of the impulse response are learned, the problem becomes a simple deconvolution process (represented by the ML step) that can be handled in parallel. A summary of the improvements brought by BRACIL and its comparison with csdeconv is shown in Supplemental Table S3.
BRACIL improves the accuracy of binding site detection using the enriched regions predicted by peak callers to constrain the locations where a binding event may occur (see Methods). This analysis defines binding sites and enriched regions as distinct terms. We denote a binding site as a single nucleotide location for a binding event and an enriched region as an interval that is identified by peak callers to likely contain one or more binding sites. We assume that an enriched region contains at least one binding site. The post-peak–calling approach proposed by our method suggests a modular organization of ChIP-seq analysis in which peak identification and peak refinement are represented as two distinct fundamental problems for ChIP-seq studies.
BRACIL identifies binding sites with high spatial resolution by integrating genome sequence and ChIP-seq coverage. Our method utilizes the information contained in the genome sequence by means of de novo motif discovery (Fig. 1C). The principle of our method is that a motif instance carries prior information important in identifying genome location of binding events. Specifically, the motif discovery step scans the enriched regions for potential binding motifs and uses them to constrain the search space for deconvolution. Binding motifs are classified as weak or strong according to motif conservation, and the deconvolution process takes advantage of ChIP-seq coverage to identify which of these correspond to a true binding event (see Methods). A computationally predicted motif is considered a binding site if it helps to maximize the likelihood of the observed ChIP-seq coverage (see Methods). In order to avoid spurious prediction, weak motifs are penalized in accordance with a penalty parameter. This feature provides BRACIL the ability to identify binding events caused by weakly conserved motifs and improves sensitivity and specificity of binding site detection. Finally, for enriched regions that do not contain evidence of motif presence, BRACIL is able to refine binding sites based only on ChIP-seq coverage.
Modeling the impulse response
The quality of the blind-deconvolution process, described in the previous section, depends on the model used to represent the impulse response. The impulse response represents the physical process that transmits the information of in vivo binding into the ChIP-seq coverage (Fig. 2A). A qualitative explanation for this process has already been reported (Kharchenko et al. 2008; Valouev et al. 2008). Accordingly, the impulse response consists of a symmetric shape and a peak shift on the coverage of the positive and the negative strand (Figs. 1A, 2B,C). The sequencing process occurs from the 5′ to 3′ direction and provides strand-specific reads resulting in strand-specific coverage. The peak shift occurs because the coverage on one side of a binding site is associated with reads for the positive strand and the coverage on the other side with reads for the negative strand (Fig. 2B).
Figure 2.
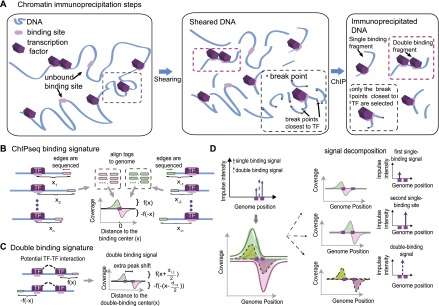
The framework of our method is derived from a physical comprehension of the ChIP-seq process. (A) Illustration of chromatin immunoprecipitation steps. A DNA representation (blue string) contains multiple binding sites (light purple) that may or may not be bound by their corresponding transcription factor (purple hexagon). The pink dashed boxes highlight a DNA fragment that is simultaneously bound by two TFs. This fact motivates the double-binding signal. The black dashed box highlights the break point selection caused by immunoprecipitation. Many break points (solid dark circles) occur, but only the one at each edge that is closest to the binding site is selected for sequencing. This indicates that the impulse response follows an extreme value distribution (see main text). (B) Detailed representation of the impulse response. At each strand ([green] positive stand, [pink] negative strand), the impulse response follows a distribution f(x) that represents the distance from the DNA fragment edges to the center of the binding sites. The coverage at each strand is separated by a peak shift that is equal to twice the distance of the binding site center and the maximum of f(x). The strand-specific coverage and peak shift is a consequence of the directionality of sequencing. (C) Representation of the double-binding signal. At each strand, the impulse response follows the same distribution f(x) observed for the single-binding signal. On the positive strand, it refers to the binding site closer to the 5′ end; on the negative strand, it refers to the binding site closer to the 3′ end. This causes an additional peak shift equal to the distance between the binding sites. (D) The effect of the double-binding signal in the signaling process. A region with two binding sites contains three sources of signal: a single-binding signal (solid blue upward arrow) for each binding site and also a double-binding signal (dashed blue upward arrow, left). The decomposition of the coverage into individual impulse responses and the corresponding impulse representation are also shown (right).
A physical interpretation of the ChIP-seq experiments suggests that the impulse response can be modeled as an extreme value distribution. This interpretation results from studying the position of the DNA edges that are sequenced after the immunoprecipitation step. Starting at the shearing step, multiple break points split the genome into many fragments. Each fragment contains two edges and the position of each edge is associated with a break point. The sequencing step identifies the sequence of DNA edges, and consequently, the genome location of break points. Immunoprecipitation purifies the DNA fragments that are bound by the TF under investigation and thus the break points that are closest to the binding sites. From a mathematical point of view, the position of a break point is a random process, and the immunoprecipitation selects the ones with the minimum distance from a binding event. Thus, the impulse response can be modeled as an extreme value distribution (Fig. 2A, dark highlighted box; Fig. 2B).
The precise solution for the extreme value distribution depends on the probability that a break point occurs at some genome position. Let V(x) be the probability that a break point occurs up to a distance x from a given binding site, and assuming that the number of break points follows a Poisson distribution (with breaking rate λ), the cumulative distribution function (cdf) for the impulse response can be described by the following equation (see Supplemental Material for full derivation):
A simple mathematical manipulation of Equation 1 allows V(x) to be predicted from the ChIP-seq data (Supplemental Equation S6). This provides a physical interpretation for the properties of DNA shearing. It supports the idea that the TF creates a protective region around the DNA it binds (Supplemental Fig. S1). Moreover, if V(x) follows an exponential shape, the impulse response follows a Gumbel distribution (Supplemental Equation S5). A Gumbel distribution describes the impulse response with two parameters: one representing the peak shift (μ) and one representing the peak shape (β). Both parameters have a clear physical interpretation. The parameter β is associated with the breaking resistance around the binding site and μ represents a combination of TF protection zone, breaking rate, and breaking resistance (see Supplemental Material). The physical interpretation of the impulse response is a complementary consequence of our model and does not have a direct effect on the blind-deconvolution process of BRACIL.
We also introduce the double-binding signal (Fig. 2A, purple highlighted box; Fig. 2C). After the shearing step, some of the DNA fragments might contain two sites that are simultaneously bound. These double-bound fragments provide a second-order impulse response that is centered between the two sites. If the break points occur independently from one another, the impulse response for the double-binding signal follows the same shape as the one for the single-binding signal but with an extra peak shift equal to the distance between the binding sites (Fig. 2C). This implies that the coverage at the positive strand refers to the binding site closest to the 5′ prime edge and the coverage at the negative strand to the site closest to the 3′ edge (Fig. 2C). The representation of a region containing two binding sites and its coverage decomposition is shown in Figure 2D.
High-resolution binding site refinement
We first applied our model to show its ability to detect a binding site at high resolution. In order to validate our model, we compared it to a reference set in which binding at single-nucleotide resolution has been confirmed by DNA footprint experiments (Chauhan et al. 2011). This set contains 47 binding sites within 19 intergenic regions for the M. tuberculosis TF DosR. The ChIP-seq data for DosR is taken from a recent study from our laboratory on the regulatory network of M. tuberculosis (Galagan et al. 2013).
We compared the resolution of our method to predictions of current state-of-the-art peak callers (Valouev et al. 2008; Zhang et al. 2008; Wilbanks and Facciotti 2010; Feng et al. 2011). In general, peak callers have not been designed to exploit sequence conservation to identify multiple binding sites within enriched regions and show a higher variance around the precise location when compared to our method (Fig. 3A,B). Our method was also compared to GEM (Guo et al. 2012), a recent algorithm proposed to identify binding sites with high-spatial resolution. Figure 3A and B suggests that BRACIL also improves on the performance of GEM. We also checked the possibility that the performance of other peak callers could be improved by relaxing their cutoff threshold (i.e., P-value < 0.031 for QuEST, PeakRanger, MACS, and Q-value < 0.01 for GEM). GEM showed the best performance by predicting 21 binding sites. We thus further checked GEM’s performance by running analyses with a range of parameters (e.g., –k_min 8 –k_max 14,–k 14,–seed GGG-C-TT-G-CCC, k_win 40, k_win 50, k_win 60, and combinations) and by following the authors’ recommendations to improve motif prediction. The best result from GEM predicted only 21 of the 47 binding sites. Both our method and GEM use sequence integration to improve spatial resolution. However, the signal processing perspective of our model is different from the binding event prediction used by GEM and might explain the difference in performance. BRACIL takes advantage of motif information using a PSSM representation, whereas GEM considers a k-mer count. In addition, BRACIL uses a physically motivated model of the impulse response, explores motifs with weak evidence of conservation, and explicitly models a double-binding signal.
Figure 3.

BRACIL increases the resolution of binding-site detection as well as sensitivity and specificity. The performance achieved by using only ChIP-seq coverage (BRACIL-co) is improved by including motif integration with the single-binding signal (BRACIL-sb), and the best performance occurs when we also consider the double-binding signal (BRACIL-db). A summary of the differences between the three versions can be found in Table 1. In the best scenario, BRACIL detects 44/47 of the reference sites (Chauhan et al. 2011). The potential of our method to refine the output of peak callers can be seen both in terms of the fraction of sites detected (A) as well as the resolution with which they are detected (B). The green bars (A) represent the fraction of sites detected by the corresponding peak caller labeled at the x-axis. The purple bars on the top show the additional refinement provided by our method. The different shades in purple represent performance improvement by specific variations of BRACIL. Enriched regions are defined as the overlapping window of ±150 bp around the single nucleotide prediction obtained by the corresponding peak caller. For BRACIL-co, BRACIL-sb, and BRACIL-db, the enriched regions consist in the ±150-bp overlapping window that surrounds the reference sites. The precision and recall (C) and the ROC (D) plots illustrate that our method is especially important for filtering out low conservation motifs that do not represent real binding.
BRACIL is not specific to a particular peak caller, but complementary. In this sense, our approach is versatile as it can be used in conjunction with the most appropriate peak caller for a specific experimental condition. In Figure 3A, we illustrate the potential of our method to refine the output of peak callers. BRACIL increases the sensitivity of binding site detection from <45% up to 94%. In addition, the high sensitivity of our method is also accompanied by high specificity (Fig. 3C,D).
A comparative analysis of the performance of BRACIL with other methods is summarized in Table 1. In short, our method is able to exploit the prior information contained in weak and strong motif conservation to accurately predict the location of binding events. Our method takes advantage of ChIP-seq coverage to filter out the numerous false binding sites that would arise from motif discovery alone (see Methods, “Motif Integration” section) and increases the sensitivity and specificity of binding site detection (Fig. 3C,D). This effect is particularly important in predicting binding events with weak evidence of motif presence without high specificity cost. Moreover, the binding motif can be observed in the sequence that surrounds the final set of binding sites (Fig. 4). Our method considers a penalty parameter to avoid overfitting and is robust for a large range of parameter values (Supplemental Table S1).
Table 1.
Summary of the performance obtained by different variations of BRACIL compared to the performance obtained by motif discovery and peak callers alone
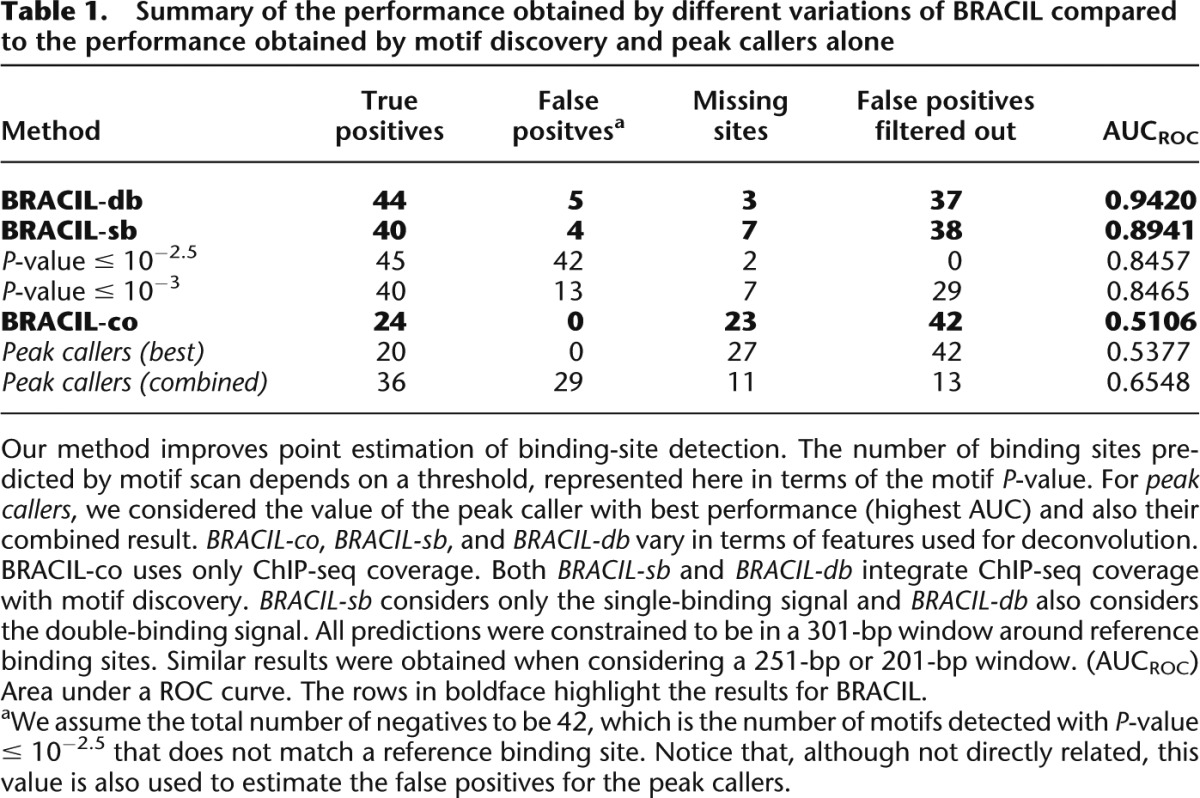
Figure 4.

The binding motif can be observed in the sequence that surrounds the predicted binding site. This figure depicts the high resolution of our method. Each row indicates the sequence surrounding a predicted motif center. Different colors represent a different DNA letter. Results are shown for two distinct ChIP-seq experiments performed for the M. tuberculosis transcription factor DosR (A) and Kstr (B). A small shift at the motif center was allowed to improve visualization. Average shift was < 2 bp and is visualized by gray colors.
Cooperative interaction
Another application of our model is in identifying cooperative interaction between two closely spaced binding sites. Cooperative interaction occurs when binding at one site influences the probability of binding at another site. Mathematically, we assess the presence of cooperative interaction by comparing the probability that both sites are bound simultaneously to the probability that each site is bound independently (see Supplemental Equation S7 and Methods). Cooperative interaction can be estimated based on the relationship of impulse response magnitudes and binding configuration probabilities (Fig. 2C,D; Supplemental Equation S8).
We use a likelihood ratio test to detect cooperative interaction. In this test, the null hypothesis assumes that the binding sites are independent and the alternative hypothesis indicates cooperative interaction (see Methods). Under the assumption of independent binding, the magnitude of a double-binding impulse response is a function of the magnitude of the neighboring single-binding impulse responses (see Methods; Supplemental Equation S10a,b). This constraint does not occur in the case of cooperative interaction. Our method is consistent if the probability of accepting the null hypothesis is low for regions with cooperative interaction and relatively higher for cases without cooperative interaction. Our method was tested on a set of experimentally validated cooperatively interacting sites for the M. tuberculosis TF DosR (Chauhan et al. 2011) and compared to a negative control that simulates enriched regions with two noninteracting binding sites. This set was created from the experimentally observed coverage of enriched regions that contain only a single binding site (see Methods; Supplemental Fig. S4). The ability of our method in distinguishing cooperatively interacting sites from independent binding sites was measured by the area under a ROC curve, with value ≈ 0.85 (Fig. 5; see also Supplemental Figs. S5, S6). Cooperative interaction predictions for the human TFs CTCF, REST, and GABPA are shown in Supplemental Figures S12 and S14.
Figure 5.

The double-binding signal allows the detection of cooperative interaction from the ChIP-seq data. Our method (Equation 8) is able to distinguish regions containing cooperative interacting sites from regions containing independent binding sites. A set of regions with experimentally validated cooperative interaction is used as a positive control (Chauhan et al. 2011). The negative control is obtained from simulation (Supplemental Figs. S3, S4; Supplemental Table S2; also see Methods). (A,B) The P-value output of our method is able to discriminate regions with cooperative interaction (solid lines) from regions with independent binding (dashed lines). Each dashed line represents a different simulated set. Each solid line assumes a different value for the probability of nonbinding configuration (see Methods). The probability of nonbinding configuration is a necessary input to compute the statistical P-value. Independent of the value for nonbinding configuration, our method discriminates the data well. A good discriminative power occurs even for the most conservative case (highlighted by the dashed red and solid blue lines). (C,D) The overall performance of our method is measured in terms of true versus false positive rate. The solid blue line represents the results from A or B. The dashed red line shows what is expected by chance. The area under the curve (AUC) measures the discriminative power of the method. All results support our method. In addition, the method is robust when performance evaluation is specific to each probability of nonbinding configuration (Supplemental Figs. S5, S6). The results at the left (A,C) and right (B,D) panels are obtained assuming low or high immunoprecipitation rate, respectively.
High-throughput application and orphan regions
Our method was designed with a level of computational efficiency that makes it applicable to large data sets, such as ChIP-seq data from large genomes or multiple experiments. Analysis of these data sets was not practical with csdeconv (Wilbanks and Facciotti 2010). We used our method in a high-throughput study to map the regulatory network of M. tuberculosis from ChIP-seq data (Galagan et al. 2013). This study showed that our method estimates binding site locations and magnitudes with high reproducibility. High reproducibility in both the magnitude and location of binding sites has also been observed when our method is applied to eukaryotes, as exemplified in Supplemental Figures S7 and S8 for three human TFs that have recently been defined as benchmarks for peak caller evaluation: MAX, REST, and SRF (Rye et al. 2011). We also validated the performance of our method in the mammalian TFs GABPA and CTCF based on the approach proposed by Guo et al. (2012). The results corroborate the high-resolution performance of our method as shown in Supplemental Figures S15–S19.
Our method improves the consistency between motif discovery and enriched regions found in ChIP-seq data. A common finding in the analysis of ChIP-seq data is that not all enriched regions contain at least one instance of a binding motif (Johnson et al. 2007; Valouev et al. 2008; MacQuarrie et al. 2011). In this study, we use the term “orphan regions” to describe such regions. Different reasons might explain the presence of orphan regions. For example, some might not correspond to a true binding region (Rye et al. 2011) or might not be directly bound by the target factor (Valouev et al. 2008). In addition, the motif cutoff threshold may be too stringent to capture a low-affinity binding site. BRACIL is able to use a weaker threshold for motif detection to identify the consistency of binding motif and ChIP-seq coverage in regions that otherwise would be classified as orphan regions. BRACIL compensates for this weaker threshold by filtering spurious sites using coverage deconvolution and a penalty function (see Methods). The ability of BRACIL to filter out false positives is shown in Table 1. Moreover, owing to the more sensitive motif detection, the orphan regions predicted by our method are more rigorous candidates for indirect binding or artifacts in the ChIP-seq technique.
In the context of orphan regions, we analyzed the ChIP-seq data from the global study of the M. tuberculosis regulatory network (Galagan et al. 2013). For this analysis, we considered only the single-binding signal. Our method is able to use a more inclusive motif P-value threshold (10−2.5 instead of the commonly used 10−3) that, on a global scale, reduces the number of orphan regions by 45% (from 3994 to 2161), while still filtering out false positives. Over 22% of the orphan regions obtained by our method had an instance of a weak motif that was filtered out by the deconvolution step. The average number of binding sites per region is 1.58 ± 1.64 considering a motif P-value < 10−3 and 1.32 ± 0.91 for our method (see Supplemental Fig. S2 for individual experiments). For comparison, an average of 2.95 ± 2.65 potential binding sites per region was found using a motif P-value threshold < 10−2.5.
The ability to identify weak motifs is particularly important because weak sites are not typically identified by standard motif discovery methods (Gertz et al. 2009), although they have been shown to play a key role in gene regulation (Benson and Pirrotta 1988; Schindler and Baichwal 1994; Berman et al. 2002; Tanay 2006; Gertz et al. 2009; Sharon et al. 2012). Reconciling orphan regions with a potential motif may also provide a more accurate assessment of the degree of direct versus indirect binding for a TF.
Discussion
We have utilized a blind deconvolution approach (Lun et al. 2009) to develop a novel method that improves computational efficiency, identifies binding sites at high spatial resolution, and detects cooperative interactions using ChIP-seq data. Both the high-resolution detection of binding sites and the detection of cooperative interactions play key roles in a mechanistic understanding of a gene regulatory network (Oppenheim et al. 2005; Kim and O’Shea 2008; Segal and Widom 2009; Giorgetti et al. 2010). Our method is complementary to peak callers and provides a new step that improves the current pipelines of ChIP-seq analysis (Furey 2012). The gains of our model are consequences of a theoretically refined model of ChIP-seq that is based on a signal processing perspective integrated with physical and thermodynamic concepts. To the best of our knowledge, this is the first method that integrates genome information (via motif discovery) and ChIP-seq coverage to extract regulatory details of an enriched region as a modular complement of peak callers. In addition, our method predicts cooperative interactions, proposing a novel outcome from ChIP-seq analysis. Cooperative interaction prediction is possible due to explicit modeling of the double-binding signal (Fig. 1A, pink dashed box; Fig. 2C). Our results also highlight the contribution of the double-binding signal for improving the sensitivity and specificity of binding site detection. The simplification of the blind-deconvolution algorithm enables its application to large data sets, a feature that was not possible for csdeconv (Lun et al. 2009; Wilbanks and Facciotti 2010).
The proof of principle of our model, both in terms of single-nucleotide resolution binding site detection as well as cooperative interaction prediction, was validated on a data set of 47 binding sites that lie in 19 regulatory regions for the M. tuberculosis TF DosR (Chauhan et al. 2011). The fact that this data set is based on high-resolution experiments motivates our choice and avoids the subjective bias that is introduced by manually curated benchmarks. Our choice is also motivated by the high quality of ChIP-seq coverage available for the testing TF, with signal to noise ratio up to a few hundred times the median coverage (Galagan et al. 2013). BRACIL’s performance was also evaluated in a eukaryotic data set (Supplemental Figs. S15–S18). Notice that, although the sequence refinement step can improve binding site prediction, it is limited in identifying binding sites with at least weak evidence of a motif conservation. For the cooperative interaction test, it was not possible to obtain a reference data set of closely spaced sites that ensures that sites are bound independently. Thus, for a negative control, we used a simulated set of enriched regions with multiple binding sites in which sites are bound independently by design.
Further studies are necessary to evaluate the performance of our method for TFs in which motif alone is not as good a predictor of binding locations as the DosR motif. This evaluation should be particularly important for TFs from eukaryotic organisms in which binding motifs are known to be less predictive (Pique-Regi et al. 2011). This evaluation would also help to improve methods that predict binding site locations based on ChIP-seq coverage integrated with genome sequence. An appropriate evaluation requires a genome-scale benchmark set of binding sites with single-nucleotide resolution, which is currently not available. Although BRACIL is able to predict more than two binding sites in the same region, such a benchmark would permit the investigation of more generalized models, for example, a model that explicitly includes the signal from three or more simultaneously bound sites.
Genome-scale analysis of a gene regulatory network can exploit the advantages of our post-peak–calling algorithm to study nuances of gene regulation. We illustrate a genome-scale application of BRACIL in the study of the M. tuberculosis regulatory network (Galagan et al. 2013). However, other genome-scale investigations such as the ENCODE and modENCODE Projects (Landt et al. 2012; Van Nostrand and Kim 2013) could also benefit from our method. The high occupancy target (HOT) regions (The modENCODE Consortium et al. 2010) are particularly interesting cases for study. Multiple distinct TFs bind these regions simultaneously and BRACIL could be used to unveil the complexity of the resulting regulatory circuits. A modified version of our method could also, in principle, predict cooperative interaction between different TFs. In order to predict interaction between different TFs, however, studies that immunoprecipitate multiple TFs in the same experiment would need to be performed and the predictive model would need to be updated accordingly.
Our analysis proposes a relationship between the impulse response and physical properties of DNA shearing (see Supplemental Material). This relationship is potentially useful in identifying conditions that improve the resolution of ChIP-seq data experimentally. The resolution of ChIP-seq is constrained by the size of DNA fragments (Rhee and Pugh 2011), and a more detailed understanding of physical properties of DNA shearing could guide experiments to obtain smaller fragments.
The next step of our analysis is to explore the biological insights provided by a high-resolution map of gene regulatory networks. The functional impact of TFs on gene regulation depends on the affinity and precise location of the binding sites as well as the interactions between such sites (Oppenheim et al. 2005; Zinzen et al. 2006; Kim and O’Shea 2008; Segal et al. 2008; Lu et al. 2009; He et al. 2010). The importance of a high-resolution mapping of binding sites and cooperative interactions to control cell phenotypes is illustrated by systems in which such a detailed analysis has been performed, such as the well-studied lac operon and the lambda switch (Oppenheim et al. 2005; Yaniv 2011). In the lambda switch, the precise affinity, location, and cooperative interaction of two TFs (Cro and Cl) and three binding sites (OR1, OR2, OR3) decide whether a bacterial infection caused by the lambda phage will be at the lytic or lysogenic state (Oppenheim et al. 2005). We expect that our method may help to obtain similarly biologically meaningful regulatory insights from the ChIP-seq data.
The biological insights that can be extracted from high-throughput biological data depend on the methods and tools available for data analysis. In a time in which a variety of methods to improve the identification of enriched regions have been proposed, our work expands the boundaries of ChIP-seq analysis by focusing on each enriched region individually. Our work incorporates a multidisciplinary approach that links concepts from signal processing, thermodynamics, and statistics to construct methods of data analysis that provide original biological insights. We expect that the thermodynamic understanding of regulatory regions, as provided by our work, will be insightful in guiding hypothesis-driven experiments that elucidate mechanisms of individual regulatory circuits as well as their role in the regulatory network. Finally, we believe our model will be useful in deciphering biological meaning out of the growing number of available ChIP-seq data sets.
Methods
Signaling model
We model the expected ChIP-seq coverage at position x as a sum of weighted contributions from a number of impulse responses. More specifically, each binding site location li emits an impulse response of magnitude mi. The impulse response is represented by a function f(x − li;θ) of parameters θ. In our model, f follows a Gumbel distribution, and θ represents the corresponding parameters (μ and β) (Supplemental Equation S5). Formally, the expected coverage at a genome position x is computed by the following equation:
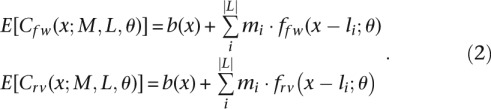 |
The coverage is strand specific and the indices fw and rv represent the forward and reverse strands, respectively. The total number of binding sites is represented by |L| and we use b(x) to represent the background coverage. We assume b(x) to be a constant specific to each enriched region. The symmetry in the strand-specific coverage implies that ffw(x;θ) = frv(−x;θ) = f(x;θ).
We also describe a second-order term, represented by the double-binding signal. The magnitude and location of the double-binding signal are represented by mi,i+1 and li,i+1, respectively. The index indicates that the signal occurs between sites i and i + 1. The double-binding signal depends on the distance between the binding sites (di,i+1) and is limited to a maximum distance (d*). The expected coverage at position x is then computed as
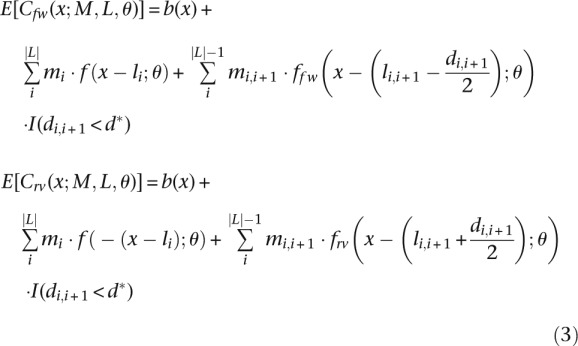 |
Notice that this representation assumes that L is an ordered set, i.e., li < li+1. The term I(S) is an indicator function that takes the value 1 when the condition S is true and 0 otherwise. Also, the extra peak shift caused by the double-binding signal (section “Modeling the Impulse Response”) (Fig. 2C) is readily observable by noticing that li,i+1 − di,i+1/2 = li and li,i+1 + di,i+1/2 = li+1. All other terms follow the same definition as in Equation 2.
Deconvolution model
The location and magnitude of the binding sites are extracted from the ChIP-seq data using a blind deconvolution model (Fig. 1B, top). The parameters are estimated by likelihood maximization of the observed coverage, C, according to the following equation:
We assume that the observed coverage follows a normal distribution around the expected value (Equations 2 and 3), and the maximization of P(C|L, M, θ) becomes a simple minimization of a sum of squared residues. The prior P(L,M,θ) can be converted into a penalty function. For simplicity, we represent this penalty function as αr(L, θ) to indicate that it is specific to each enriched region r and depends on the location of predicted binding sites and motif conservation. A precise definition of αr(L, θ) depends on whether it considers motif refinement or not and is described further in this Methods section. From these simplifications, the likelihood maximization for an enriched region r is equivalent to minimize the following objective function:
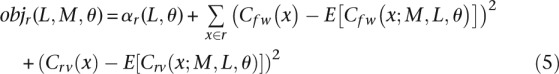 |
and a global objective function is given by
where R represents the set of enriched regions identified by a peak caller. In our analysis, Cfw(x) and Crv(x) indicate the number of reads at the forward and reverse strand, respectively, that align at position x. For example, a 36-bp-long read increases C(x) in a 36-bp interval.
The objective function is minimized in two steps. The ML step is as follows:
and the P step is
The ML step updates the location and magnitude of the binding sites, whereas the P step updates the impulse response parameters. Both steps are repeated iteratively until convergence. The solution for Equations 7a and 7b was achieved by using a constrained interior point algorithm (MATLAB function fmincon). Equation 7a can be solved with improved computational performance by assuming a discrete position for potential binding site locations. This simplification permits a linear least-squared minimization (MATLAB function lsqlin). For cooperative interaction testing, the assumption of independent binding creates a nonlinear constraint in the objective function, and fast minimization is achieved by using nonlinear least-squared minimization (MATLAB function lsqnonlin) (see Supplemental Material).
The iterative process of Equations 7a and 7b is computationally expensive when the number of enriched regions is large. However, the algorithm reduces to just the ML step if the parameters for the impulse response are known. In order to increase the computational efficiency, the full algorithm is used only on a subset of the enriched regions. Unless otherwise stated, our analysis uses the 16 most enriched regions. This subset is informative in estimating the impulse response parameters (Supplemental Fig. S10). The training regions can also be defined as input. For this purpose, we defined a metric that ranks the quality of the enriched regions and eliminates bad quality regions from the training set. In order to evaluate quality of the regions, this metric considers the cross correlation of the coverage between the forward and the reverse strand, the total coverage, and the relative ratio of strand-specific coverage (Supplemental Fig. S11). Following, the ML step is used to perform deconvolution in each enriched region independently.
The penalty parameter, αr(L,θ) (Equation 5), is defined to avoid overfitting, and consequently, false positives. It has a slightly different definition when deconvolution uses only ChIP-seq coverage or when it also considers motif discovery. Using only ChIP-seq coverage, there is no penalty to predict a single binding site and a linearly increasing penalty to predict extra sites. We say a binding site is detected if it contributes with a positive magnitude to minimize the objective function (Equation 7a) and use this definition to count the number of sites detected in an enriched region. The case of sequence-integrated deconvolution is described in detail in the “Motif Integration” section.
Motif discovery
Motif position-specific score matrix (PSSM) was obtained using MEME (Bailey et al. 2009). The input FASTA file was built using the 101-bp sequence that spans 50 bp around each side of the binding site locations predicted by the blind-deconvolution algorithm using only the coverage information.
Motif integration
We used FIMO (Bailey et al. 2009) and the motif PSSM to detect potential binding sites in the sequence of enriched regions. The potential binding sites are used to constrain the space for binding site locations (L in Equation 5). In this context, the location of an impulse response is restricted to occur at the center of a binding motif plus or minus a small window. This window permits deconvolution to capture some variance around the precise location of a potential binding site. The computational performance is optimized when the window size is equal to zero. This assumption simplifies the solution of the objective function to a constrained linear least-squares problem.
In the context of motif integration, the shape of the impulse response was updated by running the ML and P steps (Equations 7a and 7b), with locations constrained to a 5-bp window around sites with motif P-value < 10−3. This step was only performed on a subset of the enriched regions (default is the 16 most enriched regions) (see Supplemental Fig. S10) to obtain the parameters for the impulse response. After that, deconvolution (ML step) was performed in all regions. In this part, the potential binding sites were defined with a more inclusive threshold (motif P-value < 10−2.5) and a penalty function was defined to filter out potential false positives.
The penalty function [αr(L,θ), Equation 5] attributes a higher penalty to weak binding sites and a lower penalty to strong ones. If the ideal penalty function has a logistic growth proportional to the motif conservation (see Supplemental Material), a binary approximation can be used to improve computational performance. In this perspective, we classify the potential binding sites as strong or weak sites. The deconvolution was performed free of penalty for strong sites and with a linear increasing cost for weak sites. We defined αr(L,θ) = α0 · |Lr,w| · K(r), where Lr,w is the number of weak sites predicted in region r, and K(r) normalizes the penalty per enriched region. We decided on a normalized penalty function instead of a constant one because it makes the motif discovery step informative for both high and low coverage regions. A constant penalty function would bring one of the two following limitations: A relatively strong penalty would eliminate motif prior information from regions with poorly enriched regions; or a relatively weak penalty would have no effect in highly enriched regions. The parameter K(r) is defined as the sum of squares of the observed coverage at region r,
The parameter α0 is a constant with value ranging from 0 to 1. Our analysis considered α0 = 0.01 for an analysis that prioritizes sensitivity, and it is used for most of the work presented here. We used the term α0 = 0.1 for a more conservative analysis that prioritizes specificity.
Any site with motif P-value (P) in the range of 10−4 < P < 10−2.5 was defined to be a weak site, and any one with P ≤ 10−4 was defined to be a strong site. This is an inclusive threshold when compared to other papers (e.g., motif P-value < 10−3) (Jothi et al. 2008; Valouev et al. 2008). A site is classified as true only if it contributes to deconvolution, i.e., if it has a nonzero magnitude after the minimization of the objective function. Our algorithm guarantees the most likely solution by exploring all combinations of potential binding sites per region and selecting the one that minimizes the objective function (Equation 7a). For enriched regions without evidence of a binding motif or enriched regions in which binding motifs cannot explain the ChIP-seq coverage beyond a penalty parameter, the location of binding events is predicted based only on ChIP-seq coverage.
Finally, binding sites are allowed to emit a double-binding signal if they are located within a given distance of each other (50 bp by default). The double-binding signal provides no cost (i.e., no penalty) if it is associated with a strong site. This is supported by the strong effect that weak sites have on expression when they act in combination with strong sites (Kim and O’Shea 2008; Gertz et al. 2009).
Detecting cooperative interaction
A likelihood ratio test is used to detect cooperative interaction. The likelihood ratio is defined by
and can be approximated by a χ2 distribution with the number of degrees of freedom equal to the number of double-binding impulse responses. The test is performed at each enriched region. The terms objnull and objalternative represent the objective function for the null hypothesis (assuming independent binding) and the alternative hypothesis (allowing cooperative interaction). The parameter n indicates the number of points used for the fit. Since coverage occurs in both the forward and reverse strands, n is equal to twice the region length. A full derivation is shown in the Supplemental Material.
Simulated enriched regions with two noninteracting binding sites
A simulated set of enriched regions was created to contain two noninteracting binding sites. Each region in this set contained two binding sites, separated from each other by 20 bp. The coverage of each simulated enriched region results from two single-binding signals, one for each site with a double-binding signal between them. Each signal is proportional to the corresponding binding configuration. Thus, the magnitude of the single-binding signal at one site is proportional to the probability that only this site is bound, and the magnitude of the double-binding signal is proportional to the probability that both sites are bound (Supplemental Fig. S4).
To make the simulated set more realistic, it was obtained from the coverage empirically observed in the ChIP-seq data. The coverage of a simulated enriched region corresponds to the sum of empirical impulse responses that represent two single-binding signals and one double-binding signal. This sum is rescaled according to the corresponding binding probabilities (Supplemental Fig. S4). The empirical impulse response for each single-binding signal is defined as the observed coverage surrounding a binding site in a region with strong evidence of containing only one binding site. A region is considered to have only one binding site with strong evidence if it shows low enrichment, passes the filter of a peak caller, and does not show multiple instances of a binding motif. The empirical coverage is normalized so that it would represent an impulse response of area equal to one. This normalization is important because the sum of the impulse responses is rescaled according to the corresponding binding probabilities (Supplemental Fig. S4). The empirical impulse response for the double-binding signal is taken as a mixture of the empirical impulse response for each single-binding signal. Particularly, the coverage of the forward strand follows the corresponding coverage for the impulse response at the binding site closest to the 5′ edge. Similarly, the coverage of the reverse strand follows the corresponding coverage for the impulse response at the binding site closest to the 3′ edge (Supplemental Fig. S4A,B). This is consistent with the double-binding signal theoretically modeled in “Modeling the Impulse Response” section (see also Equation 3).
We created different collections of simulated enriched regions, each one assuming different probabilities of binding configurations (see Supplemental Fig. S3). The magnitude of the empirical impulse responses is associated with the corresponding binding configuration probabilities (Supplemental Fig. S4C). The binding configuration probabilities were chosen to represent a large range of the space of independent binding probabilities (see Supplemental Fig. S3) and are listed in Supplemental Table S2. Each collection of simulated enriched regions contains a total of 15 regions that were created with all possible combinations of five enriched regions.
Peak caller refinement
Our method was used to refine the resolution of enriched regions predicted by different peak callers. In order to create a standardized comparison, the set of enriched regions is defined as the region that spans a 301-bp window around the peak caller single nucleotide prediction, 150 bp at each side. Overlapping regions were clustered into one. Similar results were obtained using a window span of 201 or 251 bp.
For eukaryote data sets, the enriched regions for CTCF and GABPA were obtained from GEM output. The enriched regions for MAX, REST, and SRF were obtained from the benchmark defined by Rye et al. (2011).
Evaluation of binding-site detection
Predictions are evaluated by comparing the binding events predicted by BRACIL with a reference set of single nucleotide resolution binding sites. Details of the evaluation are described in the Supplemental Material: “Evaluating Binding Site Prediction.”
Supplemental Material “Computing Significance of Binding Event Predictions” describes how significance is computed for each binding event and enriched region.
ChIP-seq data
M. tuberculosis data was obtained from our study of the regulatory network of M. tuberculosis (Galagan et al. 2013) and is available at http://tbsysbio.org. The ChIP-seq data for the M. tuberculosis TF DosR, used to validate our method, corresponds to flow cell number 27, lane 8 (data prefixed by 27_8). We used flow cell number 23, lane 1 (data prefixed by 23_1) as input for peak callers that require a negative control. The M. tuberculosis Kstr data used for Figure 4 corresponds to flow cell number 11, lane 1 (data prefixed by 11_1). Human ChIP-seq data set from the benchmark defined by Rye et al. (2011) was obtained at http://tare.medisin.ntnu.no/chipseqbenchmark/. GABPA and CTCF data set was obtained from Chen et al. (2008) and Valouev et al. (2008) as indicated by Guo et al. (2012).
Software availability
The software, manual, and example data is available for download at https://sourceforge.net/projects/bracil/.
Supplementary Material
Acknowledgments
We thank Christopher Garay, Jonathan Dreyfruss, Irina Glotova, and Wen-Han Yu for insightful feedback. We thank Catalina James for the English revision. This project has been funded in whole or in part with federal funds from the National Institute of Allergy and Infectious Diseases, National Institutes of Health, Department of Health and Human Services, under Contract no. HHSN272200800059C. L.C. was funded by NSF grant DMS 1107067. T.A. is a postdoctoral fellow of the Research Foundation Flanders (FWO).
Author contributions: A.L.C.G. and J.E.G. conceived the project idea. A.L.C.G. wrote the paper, developed and implemented the method, and prepared the figures and tables. E.A., T.A., L.C., and J.E.G. contributed to revising the manuscript. M.P. obtained enriched regions used for analysis of orphan regions. E.A., T.A., M.P., and A.L. participated in data management and group discussions for ChIP-seq analysis. L.C. contributed to the formalization of the statistical test to predict cooperative interaction and supervised the statistical aspects of this work. J.E.G. supervised the entire project.
Footnotes
[Supplemental material is available for this article.]
Article published online before print. Article, supplemental material, and publication date are at http://www.genome.org/cgi/doi/10.1101/gr.161711.113.
References
- Bailey TL, Boden M, Buske FA, Frith M, Grant CE, Clementi L, Ren J, Li WW, Noble WS. 2009. MEME SUITE: tools for motif discovery and searching. Nucleic Acids Res 37: W202–W208 [DOI] [PMC free article] [PubMed] [Google Scholar]
- Barski A, Cuddapah S, Cui K, Roh TY, Schones D, Wang Z, Wei G, Chepelev I, Zhao K. 2007. High-resolution profiling of histone methylations in the human genome. Cell 129: 823–837 [DOI] [PubMed] [Google Scholar]
- Benson M, Pirrotta V. 1988. The Drosophila zeste protein binds cooperatively to sites in many gene regulatory regions: implications for transvection and gene regulation. EMBO J 7: 3907–3915 [DOI] [PMC free article] [PubMed] [Google Scholar]
- Berger MF, Bulyk ML. 2009. Universal protein-binding microarrays for the comprehensive characterization of the DNA-binding specificities of transcription factors. Nat Protoc 4: 393–411 [DOI] [PMC free article] [PubMed] [Google Scholar]
- Berman BP, Nibu Y, Pfeiffer BD, Tomancak P, Celniker SE, Levine M, Rubin GM, Eisen MB. 2002. Exploiting transcription factor binding site clustering to identify cis-regulatory modules involved in pattern formation in the Drosophila genome. Proc Natl Acad Sci 99: 757–762 [DOI] [PMC free article] [PubMed] [Google Scholar]
- Boeva V, Surdez D, Guillon N, Tirode F, Fejes A, Delattre O, Barillot E. 2010. De novo motif identification improves the accuracy of predicting transcription factor binding sites in ChIP-Seq data analysis. Nucleic Acids Res 38: e126. [DOI] [PMC free article] [PubMed] [Google Scholar]
- Browning D, Busby S. 2004. The regulation of bacterial transcription initiation. Nat Rev Microbiol 2: 57–65 [DOI] [PubMed] [Google Scholar]
- Chauhan S, Tyagi JS. 2008. Cooperative binding of phosphorylated DevR to upstream sites is necessary and sufficient for activation of the Rv3134c-devRS operon in Mycobacterium tuberculosis: implication in the induction of DevR target genes. J Bacteriol 190: 4301–4312 [DOI] [PMC free article] [PubMed] [Google Scholar]
- Chauhan S, Sharma D, Singh A, Surolia A, Tyagi JS. 2011. Comprehensive insights into Mycobacterium tuberculosis DevR (DosR) regulon activation switch. Nucleic Acids Res 39: 7400–7414 [DOI] [PMC free article] [PubMed] [Google Scholar]
- Chen X, Xu H, Yuan P, Fang F, Huss M, Vega V, Wong E, Orlov Y, Zhang W, Jiang J, et al. 2008. Integration of external signaling pathways with the core transcriptional network in embryonic stem cells. Cell 133: 1106–1117 [DOI] [PubMed] [Google Scholar]
- Chung D, Park D, Myers K, Grass J, Kiley P, Landick R, Keleş S. 2013. dPeak: high resolution identification of transcription factor binding sites from PET and SET ChIP-Seq data. PLoS Comput Biol 9: e1003246. [DOI] [PMC free article] [PubMed] [Google Scholar]
- Feng X, Grossman R, Stein L. 2011. PeakRanger: a cloud-enabled peak caller for ChIP-seq data. BMC Bioinformatics 12: 139. [DOI] [PMC free article] [PubMed] [Google Scholar]
- Furey TS. 2012. ChIP-seq and beyond: new and improved methodologies to detect and characterize protein-DNA interactions. Nat Rev Genet 13: 840–852 [DOI] [PMC free article] [PubMed] [Google Scholar]
- Galagan JE, Minch K, Peterson M, Lyubetskaya A, Azizi E, Sweet L, Gomes A, Rustad T, Dolganov G, Glotova I, et al. 2013. The Mycobacterium tuberculosis regulatory network and hypoxia. Nature 499: 178–183 [DOI] [PMC free article] [PubMed] [Google Scholar]
- Gaszner M, Felsenfeld G. 2006. Insulators: exploiting transcriptional and epigenetic mechanisms. Nat Rev Genet 7: 703–713 [DOI] [PubMed] [Google Scholar]
- Gertz J, Siggia E, Cohen B. 2009. Analysis of combinatorial cis-regulation in synthetic and genomic promoters. Nature 457: 215–218 [DOI] [PMC free article] [PubMed] [Google Scholar]
- Giorgetti L, Siggers T, Tiana G, Caprara G, Notarbartolo S, Corona T, Pasparakis M, Milani P, Bulyk ML, Natoli G. 2010. Noncooperative interactions between transcription factors and clustered DNA binding sites enable graded transcriptional responses to environmental inputs. Mol Cell 37: 418–428 [DOI] [PubMed] [Google Scholar]
- Gordon B, Li Y, Wang L, Sintsova A, van Bakel H, Tian S, Navarre W, Xia B, Liu J. 2010. Lsr2 is a nucleoid-associated protein that targets AT-rich sequences and virulence genes in Mycobacterium tuberculosis. Proc Natl Acad Sci 107: 5154-5159 [DOI] [PMC free article] [PubMed] [Google Scholar]
- Guo Y, Papachristoudis G, Altshuler RC, Gerber GK, Jaakkola TS, Gifford DK, Mahony S. 2010. Discovering homotypic binding events at high spatial resolution. Bioinformatics 26: 3028–3034 [DOI] [PMC free article] [PubMed] [Google Scholar]
- Guo Y, Mahony S, Gifford DK. 2012. High resolution genome wide binding event finding and motif discovery reveals transcription factor spatial binding constraints. PLoS Comput Biol 8: e1002638. [DOI] [PMC free article] [PubMed] [Google Scholar]
- Hartman S, Bertone P, Nath A, Royce T, Gerstein M, Weissman S, Snyder M. 2005. Global changes in STAT target selection and transcription regulation upon interferon treatments. Genes Dev 19: 2953–2968 [DOI] [PMC free article] [PubMed] [Google Scholar]
- He X, Samee M, Blatti C, Sinha S. 2010. Thermodynamics-based models of transcriptional regulation by enhancers: the roles of synergistic activation, cooperative binding and short-range repression. PLoS Comput Biol 6: e1000935. [DOI] [PMC free article] [PubMed] [Google Scholar]
- Heintzman N, Stuart R, Hon G, Fu Y, Ching C, Hawkins D, Barrera L, Van Calcar S, Qu C, Ching K, et al. 2007. Distinct and predictive chromatin signatures of transcriptional promoters and enhancers in the human genome. Nat Genet 39: 311–318 [DOI] [PubMed] [Google Scholar]
- Johnson D, Mortazavi A, Myers R, Wold B. 2007. Genome-wide mapping of in vivo protein-DNA interactions. Science 316: 1497–1502 [DOI] [PubMed] [Google Scholar]
- Jothi R, Cuddapah S, Barski A, Cui K, Zhao K. 2008. Genome-wide identification of in vivo protein–DNA binding sites from ChIP-Seq data. Nucleic Acids Res 36: 5221–5231 [DOI] [PMC free article] [PubMed] [Google Scholar]
- Kaplan N, Moore I, Fondufe-Mittendorf Y, Gossett A, Tillo D, Field Y, LeProust E, Hughes T, Lieb J, Widom J, et al. 2008. The DNA-encoded nucleosome organization of a eukaryotic genome. Nature 458: 362–366 [DOI] [PMC free article] [PubMed] [Google Scholar]
- Kharchenko P, Tolstorukov M, Park P. 2008. Design and analysis of ChIP-seq experiments for DNA-binding proteins. Nat Biotechnol 26: 1351–1359 [DOI] [PMC free article] [PubMed] [Google Scholar]
- Kim H, O’Shea E. 2008. A quantitative model of transcription factor–activated gene expression. Nat Struct Mol Biol 15: 1192–1198 [DOI] [PMC free article] [PubMed] [Google Scholar]
- Landt SG, Marinov GK, Kundaje A, Kheradpour P, Pauli F, Batzoglou S, Bernstein BE, Bickel P, Brown JB, Cayting P, et al. 2012. ChIP-seq guidelines and practices of the ENCODE and modENCODE consortia. Genome Res 22: 1813–1831 [DOI] [PMC free article] [PubMed] [Google Scholar]
- Larochelle M, Drouin S, Robert F, Turcotte B. 2006. Oxidative stress-activated zinc cluster protein Stb5 has dual activator/repressor functions required for pentose phosphate pathway regulation and NADPH production. Mol Cell Biol 26: 6690–6701 [DOI] [PMC free article] [PubMed] [Google Scholar]
- Lu T, Khalil A, Collins J. 2009. Next-generation synthetic gene networks. Nat Biotechnol 27: 1139–1150 [DOI] [PMC free article] [PubMed] [Google Scholar]
- Lun D, Sherrid A, Weiner B, Sherman D, Galagan J. 2009. A blind deconvolution approach to high-resolution mapping of transcription factor binding sites from ChIP-seq data. Genome Biol 10: R142. [DOI] [PMC free article] [PubMed] [Google Scholar]
- MacQuarrie K, Fong A, Morse R, Tapscott S. 2011. Genome-wide transcription factor binding: beyond direct target regulation. Trends Genet 27: 141–148 [DOI] [PMC free article] [PubMed] [Google Scholar]
- Maerkl S, Quake S. 2007. A systems approach to measuring the binding energy landscapes of transcription factors. Science 315: 233–237 [DOI] [PubMed] [Google Scholar]
- The modENCODE Consortium, Roy S, Ernst J, Kharchenko PV, Kheradpour P, Negre N, Eaton ML, Landolin JM, Bristow CA, Ma L, et al. 2010. Identification of functional elements and regulatory circuits by Drosophila modENCODE. Science 330: 1787–1797 [DOI] [PMC free article] [PubMed] [Google Scholar]
- Mortazavi A, Thompson E, Garcia S, Myers R, Wold B. 2006. Comparative genomics modeling of the NRSF/REST repressor network: from single conserved sites to genome-wide repertoire. Genome Res 16: 1208–1221 [DOI] [PMC free article] [PubMed] [Google Scholar]
- Oppenheim AB, Kobiler O, Stavans J, Court DL, Adhya S. 2005. Switches in bacteriophage λ development. Annu Rev Genet 39: 409–429 [DOI] [PubMed] [Google Scholar]
- Pepke S, Wold B, Mortazavi A. 2009. Computation for ChIP-seq and RNA-seq studies. Nat Methods 6: S22–S32 [DOI] [PMC free article] [PubMed] [Google Scholar]
- Pique-Regi R, Degner JF, Pai AA, Gaffney DJ, Gilad Y, Pritchard JK. 2011. Accurate inference of transcription factor binding from DNA sequence and chromatin accessibility data. Genome Res 21: 447–455 [DOI] [PMC free article] [PubMed] [Google Scholar]
- Rhee H, Pugh F. 2011. Comprehensive genome-wide protein-DNA interactions detected at single-nucleotide resolution. Cell 147: 1408–1419 [DOI] [PMC free article] [PubMed] [Google Scholar]
- Robertson G, Hirst M, Bainbridge M, Bilenky M, Zhao Y, Zeng T, Euskirchen G, Bernier B, Varhol R, Delaney A, et al. 2007. Genome-wide profiles of STAT1 DNA association using chromatin immunoprecipitation and massively parallel sequencing. Nat Methods 4: 651–657 [DOI] [PubMed] [Google Scholar]
- Rye M, Sætrom P, Drabløs F. 2011. A manually curated ChIP-seq benchmark demonstrates room for improvement in current peak-finder programs. Nucleic Acids Res 39: e25. [DOI] [PMC free article] [PubMed] [Google Scholar]
- Salmon-Divon M, Dvinge H, Tammoja K, Bertone P. 2010. PeakAnalyzer: genome-wide annotation of chromatin binding and modification loci. BMC Bioinformatics 11: 415. [DOI] [PMC free article] [PubMed] [Google Scholar]
- Schindler U, Baichwal VR. 1994. Three NF-κB binding sites in the human E-selectin gene required for maximal tumor necrosis factor α-induced expression. Mol Cell Biol 14: 5820–5831 [DOI] [PMC free article] [PubMed] [Google Scholar]
- Segal E, Widom J. 2009. From DNA sequence to transcriptional behaviour: a quantitative approach. Nat Rev Genet 10: 443–456 [DOI] [PMC free article] [PubMed] [Google Scholar]
- Segal E, Raveh-Sadka T, Schroeder M, Unnerstall U, Gaul U. 2008. Predicting expression patterns from regulatory sequence in Drosophila segmentation. Nature 451: 535–540 [DOI] [PubMed] [Google Scholar]
- Sharon E, Kalma Y, Sharp A, Raveh-Sadka T, Levo M, Zeevi D, Keren L, Yakhini Z, Weinberger A, Segal E. 2012. Inferring gene regulatory logic from high-throughput measurements of thousands of systematically designed promoters. Nat Biotechnol 30: 521–530 [DOI] [PMC free article] [PubMed] [Google Scholar]
- Stormo G, Zhao Y. 2010. Determining the specificity of protein-DNA interactions. Nat Rev Genet 11: 751–760 [DOI] [PubMed] [Google Scholar]
- Tanay A. 2006. Extensive low-affinity transcriptional interactions in the yeast genome. Genome Res 16: 962–972 [DOI] [PMC free article] [PubMed] [Google Scholar]
- Valouev A, Johnson D, Sundquist A, Medina C, Anton E, Batzoglou S, Myers R, Sidow A. 2008. Genome-wide analysis of transcription factor binding sites based on ChIP-Seq data. Nat Methods 5: 829–834 [DOI] [PMC free article] [PubMed] [Google Scholar]
- Van Nostrand EL, Kim SK. 2013. Integrative analysis of C. elegans modENCODE ChIP-seq data sets to infer gene regulatory interactions. Genome Res 23: 941–953 [DOI] [PMC free article] [PubMed] [Google Scholar]
- Vasudeva-Rao H, McDonough K. 2008. Expression of the Mycobacterium tuberculosis acr-coregulated genes from the DevR (DosR) regulon is controlled by multiple levels of regulation. Infect Immun 76: 2478–2489 [DOI] [PMC free article] [PubMed] [Google Scholar]
- Visel A, Blow M, Li Z, Zhang T, Akiyama J, Holt A, Plajzer-Frick I, Shoukry M, Wright C, Chen F, et al. 2009. ChIP-seq accurately predicts tissue-specific activity of enhancers. Nature 457: 854–858 [DOI] [PMC free article] [PubMed] [Google Scholar]
- Wilbanks E, Facciotti M. 2010. Evaluation of algorithm performance in ChIP-seq peak detection. PLoS ONE 5: e11471. [DOI] [PMC free article] [PubMed] [Google Scholar]
- Yaniv M. 2011. The 50th anniversary of the publication of the operon theory in the Journal of Molecular Biology: past, present and future. J Mol Biol 409: 1–6 [DOI] [PubMed] [Google Scholar]
- Zhang Y, Liu T, Meyer C, Eeckhoute J, Johnson D, Bernstein B, Nusbaum C, Myers R, Brown M, Li W, et al. 2008. Model-based analysis of ChIP-Seq (MACS). Genome Biol 9: R137. [DOI] [PMC free article] [PubMed] [Google Scholar]
- Zhang X, Robertson G, Krzywinski M, Ning K, Droit A, Jones S, Gottardo R. 2011. PICS: probabilistic inference for ChIP-seq. Biometrics 67: 151–163 [DOI] [PubMed] [Google Scholar]
- Zhao Y, Granas D, Stormo G. 2009. Inferring binding energies from selected binding sites. PLoS Comput Biol 5: e1000590. [DOI] [PMC free article] [PubMed] [Google Scholar]
- Zinzen R, Senger K, Levine M, Papatsenko D. 2006. Computational models for neurogenic gene expression in the Drosophila embryo. Current Biol 16: 1358–1365 [DOI] [PubMed] [Google Scholar]
Associated Data
This section collects any data citations, data availability statements, or supplementary materials included in this article.