

Abstract
The selective forces shaping mating systems have long been of interest to biologists. One particular selective pressure that has received comparatively little attention is sexually transmitted infections (STIs). While it has been hypothesized that STIs could drive the evolutionary emergence of monogamy, there is little theoretical support. Here we use an evolutionary invasion analysis to determine what aspects of pathogen virulence and transmission are necessary for serial monogamy to evolve in a promiscuous population. We derive a biologically intuitive invasion condition in terms of population-specific quantities. From this condition, we obtain two main results. First, when pathogen virulence causes mortality rather than sterility, monogamy is more likely to evolve. Second, we find that at intermediate pathogen transmission rates, monogamy is the most selectively advantageous, whereas at high- and low-transmission rates, monogamy is generally selected against. As a result, it is possible for a pathogen to be highly virulent, yet for promiscuity to persist.
Keywords: infectious disease, mating system evolution, promiscuity, sociality
1. Introduction
The evolution of mating systems is a well-studied area of biology, emphasizing the ways in which the sexual behaviour of individuals can be adaptive. Individuals can shape the mating system by preferentially assorting with partners exhibiting specific characteristics (mate choice) or by forming prolonged relationships with a small number of individuals. Mate choice can be adaptive as a by-product of sexual selection for healthy, disease-resistant mates [1], whereas prolonged sexual relationships can be adaptive when resource heterogeneity promotes mate guarding [2] or parental investment is essential for offspring survival [2,3].
A selective pressure upon mating systems that has received comparatively little attention is sexually transmitted infections (STIs) [4–8]. The logic behind STIs as an evolutionary force is simple: the more sexual partners an individual has, the greater the likelihood of procuring an STI. For example, when mate choice is important, ‘attractive’ individuals tend to have more sexual partners and thus a greater probability of becoming infected. As a result, STIs can counteract selective pressure upon mate choice [8–11], or allow the coexistence between risky and safe mating behaviours [10,12]. On the other hand, in the presence of an STI, mating systems such as monogamy can be advantageous if they reduce infection risk. Yet there are fitness consequences to doing so: by limiting the number of mates, an individual potentially misses out on reproductive opportunities.
Despite the fitness complications, STIs have long been hypothesized as a possible selective pressure for the evolutionary emergence of monogamy, particularly when they are more virulent [4,6,7,13] and are sterilizing [7]. However, theoretical support is limited. Previous work on mating systems and STIs has predominantely explored polygamous mating systems and generally assumed additional selective pressures, such as mate choice [9–11]. One exception was work by Thrall et al. [14], which focused specifically upon the evolution of within-season monogamy. Their model indicates that monogamy is not necessarily advantageous, nor is it assured that the optimal mating system minimizes pathogen transmission [14]. However, in order to make their model tractable, they ignored fitness repercussions beyond a single breeding season and assumed that population-disease frequency was fixed and thus independent of transmission probabilities, pathogen virulence and frequency of reproductive events [14]. As such, it is unclear whether, or under what conditions, STIs can drive the emergence of monogamy in a promiscuous population.
Here we examine what aspects of pathogen transmission and virulence are required for STIs to promote the evolution of serial monogamy in an explicit population-dynamic context. In accordance with the empirical evidence for the evolution of monogamy [15], we focus on the transition from a promiscuous population, with global sexual interactions, to a serially monogamous population characterized by pairwise interactions of variable length. The only selective force in our model is the endemic STI whose virulence causes increased sterility and/or mortality. Through an evolutionary invasion analysis, we derive a biologically intuitive condition under which a pair-forming mutant can invade a promiscuous population. We obtain two primary results. First, monogamy is most selectively advantageous for pathogens with intermediate transmission rates. As a result, highly virulent, pervasive pathogens can select against monogamy, contrary to expectations (e.g. [7,13]). Second, pathogens causing mortality tend to select for serial monogamy whereas sterilizing pathogens tend to select for promiscuity.
2. Model
Consider a host–pathogen system in which hosts are either infected or susceptible: once infected, there is no recovery. Pathogen virulence causes host mortality and some level of sterility, while pathogen transmission occurs through sexual contact and is exclusively horizontal. Assume that the host population has a fixed sex-ratio, that pathogen virulence and transmission occur independently of the sex of the parties involved, and that mate availability is not a limiting factor to the reproductive success of either sex. Consequently, we can simplify the mathematical model by considering a population of diploid, sexual hermaphrodites. In what follows, we establish the population dynamics of the promiscuous wild-type population. We then find the conditions under which a mutant exhibiting the ability to form pairs can invade the wild-type population while at its endemic equilibrium. As our focus is upon what pathogen attributes can promote the emergence of serial monogamy, we restrict our analysis to invasion.
(a). Dynamics of promiscuous wild-type population
Let S(t) and I(t) denote the densities of susceptible and infected individuals at time t, respectively. Individuals produce oocytes at a per capita rate of b0, which are immediately fertilized by a randomly chosen member of the population; as such, the population is promiscuous with global sexual interactions. Infection does not alter the rate at which gametes are produced, but it does cause some level of sterility. Let δ be the probability that the gametes of an infected individual are viable: if both parties are infected the probability that fertilization is successful is δ2. In general, infectious diseases exhibiting frequency-dependent transmission (such as STIs) cannot regulate population size [16], so we assume that population growth is limited by a carrying capacity upon birth rate. By doing so, if we let N = S + I denote the total density of individuals, then without loss of generality we can set N ≤ 1. It follows that susceptibles produce new susceptibles at a per capita rate of TS = b0(S + δI)(1 − N)/N, while infected individuals can expect to produce new susceptibles at a per capita rate of TI = δTS.
Production of oocytes is an opportunity for pathogen transmission. Let β be the probability per reproductive event of infection transmission. Then susceptibles become infected at a per capita rate of L = 2βb0I/N, where the presence of the 2 is because individuals can become infected by playing either the role of ‘male’ or ‘female’. Finally, individuals die at a per capita rate of mS or mI, depending upon infection status (with mI ≥ mS).
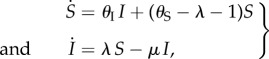
To reduce the number of parameters, we rescale time relative to the mortality rate of susceptible individuals, that is, we define  . Then, letting μ = mI/mS (hence μ ≥ 1), b = b0/mS, θS = TS/mS, θI = TI/mS and λ = L/mS, the promiscuous wild-type population dynamics are
 |
2.1 |
where dots indicate differentiation with respect to  .
.
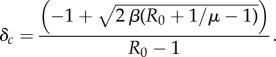
Equations (2.1) admit three equilibria: population extinction, (S, I) = (0, 0), a disease-free equilibrium (DFE), (S, I) = (1 − 1/b, 0), and an endemic equilibrium, which we will denote  . As the dynamics of (2.1) are quite complicated, here we summarize the crucial results (see the electronic supplementary material). If b > 1 and the basic reproductive number, or R0, satisfies R0 = (2βb)/μ > 1, then the DFE is unstable. Let
 |
2.2 |
If δ > δc, then the endemic equilibrium is positive. If the pathogen only causes mortality (i.e. δ = 1), then the endemic equilibrium is locally asymptotically stable (LAS) whenever it exists. If the pathogen causes sterility, then the endemic equilibrium can exist and be unstable, giving rise to periodic solutions. However, for a wide range of parameter space, the endemic equilibrium is LAS, and it is this parameter space we consider in what follows.
(b). Invasion dynamics of serially monogamous mutant
Suppose a rare mutant enters the wild-type population while at its endemic equilibrium,  . The mutant allele is not recessive, occurs at a single autosomal locus, and grants its carriers the ability to form pairs with both wild-type and mutant individuals alike. As the mutant allele is initially rare and the population well mixed, the invasion process can be fully described by the dynamics of solitary heterozygous individuals and heterozygous/wild-type pairings. We will refer to heterozygous individuals as mutants, and will denote quantities related to solitary mutants, or singletons, as
  or
or  depending upon infection status. While awaiting pair-formation opportunities, mutant singletons behave promiscuously, and are thus able to reproduce. There are also four pairing types, which we will denote
  , where
  and j indicate infection status of the paired mutant and wild-type, respectively. While paired, sexual contacts are exclusively between partners. We assume that the mutant allele does not alter either the rate of oocyte production, b, or the probability of transmission, β. Therefore, susceptible mutant singletons become infected at a per capita rate of λ, while infection is transmitted in pairings involving a single infected individual at a per capita rate of λp = 2βb.
Pair-formation occurs at a per capita rate of  where
where  and j indicate the infection status of the mutant and wild-type forming the pair, respectively, and ρ ≥ 0 is the trait encoded for by the mutant allele. The function
  depends upon the wild-type population densities, is non-negative, is increasing in ρ, and satisfies
  . A pairing breaks up following the death of either member. If the wild-type partner dies, then a mutant enters the appropriate singleton class. We do not allow for ‘divorce’; while facultative pairing break-up does occur in some populations [7,17,18], we ignore it for simplicity. We assume that the mutant has full control over the pairing process. Mechanistically, this could correspond to the mutant ‘tagging along’ behind its chosen partner as the partner diffuses randomly about the (homogeneous) environment. Thus, the chosen partner is passively involved in the process, and as such, any costs associated with pair-formation are paid by the mutant (e.g. ‘tagging along’ behind an individual is energetically expensive).
The costs paid by the mutant to form pairs can be subdivided as either catalysis costs, that is, costs paid to actually form the pair and hence paid as a singleton, or maintenance costs, which are costs paid to maintain the pair and paid while paired. Conceptually, these costs can be viewed as attracting/finding a partner (catalysis) and partner retention (maintenance). For the purposes of our model, we assume that both the maintenance and catalysis costs occur through reduced fecundity or increased mortality relative to a wild-type individual. Let  be the reduced fecundity of a solitary (i = q) or paired (i = p) mutant, such that
  is a non-increasing function of ρ satisfying
  . Likewise, let
  be the increased mortality of a solitary (i = q) or paired (i = p) mutant such that
  is a non-decreasing function of ρ satisfying
  (both
(both  and
and  are multiplicative costs).
To determine whether or not the mutant can invade, consider the expected lifetime reproductive success (LRS) of a rare mutant: if greater than the LRS of a wild-type individual, invasion is possible. To arrive at a measure of mutant LRS, we need to count production of susceptible mutant singletons. This production can occur either through reproduction (identical to wild-type, except multiplied by fecundity penalties,  ), or through the break-up of a pairing involving a mutant susceptible (i.e. the mutant gives birth to itself; this occurs in type
  and
and  pairings). We denote expected production of mutant susceptibles while in class
  or
or  as
as  or
or  , respectively. Now, each mutant individual begins its life as a susceptible singleton, whereupon it proceeds through the different mutant classes in a variety of ways, or pathways. In our calculation of mutant LRS, to avoid double counting, each of these pathways is terminated at the class for which we count production of susceptible mutants. As there are six mutant classes, there are six categories of pathways. A pictorial representation of these six categories, comprising all possible routes to mutant fitness returns is shown in figure 1. The sum of the expected fitness returns, from the six categories of pathways in figure 1 is the mutant LRS: if greater than wild-type LRS, the mutant can invade. This is our invasion condition.
Figure 1.

The six categories of pathways through which a mutant can produce susceptible mutant singletons. Blue circles correspond to singleton classes, and red circles to pairs; the letters denote infection status and the constitutive members of the pairings. Arrows indicate movement between classes. Each pathway terminates at the stage at which production is counted; with the exception of pathways (ii) and (iii), the production is of new mutant susceptibles. Pathways (ii) and (iii) also include the possibility of pairing break-up resulting in the production of a previously existing susceptible. The loops involving  are more complicated and are shown in the inset. These loops can consist of all possible combinations and orderings of the sojourns shown. For example, if we took n = 2, j = 1, k = 0, there are two possible loops:
 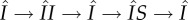 and
and  . (Online version in colour.)
An example of one such pathway to fitness returns is as follows. Mutant susceptibles form  pairings with probability
  , where
  is expected time spent as a susceptible singleton. Type
  pairings last for an average
  time units, during which they can expect to produce susceptible mutants at rate
  . This particular pathway is labelled ii in figure 1. Pathways in which a mutant spends time as an infected singleton are more complicated. If a mutant becomes an infected singleton, it can move back and forth between classes repeatedly (in particular,
  ,
,  and
and  ) before the pathway terminates in reproductive output. In the inset of figure 1, we show the three repeatable loops. Repetition of these loops can occur in any order and combination and each sequence of such loops is of variable length. In the electronic supplementary material, we provide a detailed formulation of the mutant subpopulation dynamics and a proof of the invasion condition, partitioned to match with figure 1.
3. Results
Because of the unwieldy nature of the invasion condition, to ascertain the impact of varying pathogen transmission, R0, and pathogen virulence, μ and δ, upon mutant invasion, we suppose that the mutant behaviour only slightly deviates from that of the wild-type (ρ ≈ 0; a weak selection approximation). Then if we compute the Maclaurin expansion of the invasion condition, second order and higher terms in ρ have negligible impact and can be ignored. Although in this paper we focus exclusively upon a weak selection approximation, we do not believe that relaxing this assumption would dramatically alter our qualitative conclusions. That is, the general biological advantages/disadvantages of pair-formation should remain the same, irrespective of the rate at which rare mutants form pairs.
To apply a weak selection approximation, we will fix attention on a particular pairing formation function, 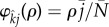 . The choice of
  was made to ensure that pair-formation rates increase linearly with population density rather than quadratically, as would be the case were we to use mass-action kinetics [19,20]. Because our choice of
  does not depend upon infection status of the parties involved, our analysis assumes that the infection is cryptic, which is expected to be adaptive for both STIs and their hosts [21].
Importantly, under weak selection the only non-zero pair formation terms are those involving the derivative of  . In all other cases, since
  , the terms will reduce to zero. As an immediate consequence, maintenance penalties such as
  and
and  do not affect the invasion process. Mathematically, this is because pair-formation is of order ρ; consequently, penalties paid as part of the pairing result in terms of order ρ2, which are negligible under weak selection. Conceptually, since ρ ≈ 0, a mutant can expect to form very few pairs. As a result, the mutant is concerned with any fitness it forfeits as a singleton in terms of catalysis costs, whereas all fitness returns from any potential pairings are viewed purely as benefits. Hence under weak selection the mutant is indifferent to maintenance penalties.
In the electronic supplementary material, we apply a Maclaurin expansion to the invasion condition. In what follows, we consider the cases in which pathogen virulence is exclusively sterility (μ = 1) or exclusively mortality (δ = 1), before examining them in combination. For simplicity, we suppose that there is a single catalysis trade-off with pair-formation: either fecundity,  , or mortality,
  . As these yield qualitatively similar results, in what follows we focus on the fecundity trade-off.
(a). Pathogen causes sterility
Suppose the pathogen affects only host sterility (μ = 1). Then the mutant can invade whenever
 |
3.1 |
holds. If costs are exclusively maintenance ( ), then (3.1) simplifies to
| 3.2 |
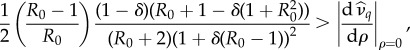
When (3.1) or (3.2) is satisfied, at low levels of STI transmission (R0 close to 1), increases to pathogen transmission, or increases to R0, promote the evolution of monogamy. However, there exists a critical R0 at which the system behaviour changes: above this critical R0, increasing pathogen transmission hinders the evolution of monogamy (figure 2).
Figure 2.
Conditions for the evolution of monogamy when pathogen causes sterility. The invasion coefficient is the left-hand side of (3.1); when it is positive, the mutant can invade. The solution of  provides (a) the
  and (b) the δ*. (b) The δc used is provided in (2.2). Curves in panels (a) and (b) correspond to different values of
  : as the curves are translated downwards, catalysis costs (magnitude of
  ) increase.
Biologically, at low R0, the likelihood of becoming infected is small enough such that there is little incentive for pair-formation, whereas at high R0, the ubiquity of the disease means that a randomly selected partner will likely be infected, thus pair-formation provides little respite from the risk of infection. At intermediate pathogen transmission rates, however, the infection is sufficiently prevalent in the population such that individuals want to avoid it, yet it is not so prevalent that the odds against a randomly selected partner being infection-free are insurmountable.
There also exists a maximum R0,  , above which invasion is not possible (figure 2). For the general case this lacks an explicit solution, however, when costs are exclusively maintenance,
  is the solution of (3.2) set to equality. Indeed, as
  is the ‘best case’ for the evolution of serial monogamy (i.e. the scenario with the smallest penalties), for increasing catalysis costs, (increasing
  ), the cut-off value of R0 for the possibility of invasion will be strictly less than
  . In fact, in conjunction with δc, (2.2), for invasion to be possible δ must satisfy
| 3.3 |
There are a number of observations we can make about (3.3). First, increasing δ (pathogen-induced sterility is reduced) lessens the evolvability of serial monogamy (figure 2). This is logical: for a relatively benign STI it is not worth paying the costs associated with pair-formation. Second, at high pathogen transmission, (3.3) will not be satisfied, irrespective of the value of δ. Therefore, an STI can be both highly virulent and pervasive, yet the host remains promiscuous, maintaining a transmission network optimal for pathogen spread, as noted elsewhere [14].
Because it is not necessarily the case that, independently of δ, (3.3) will be satisfied, from (3.3) we can obtain the maximum probability of transmission per reproductive event, β, in terms of rate of sexual encounters, b. When this maximum β is compared with the proportion of the wild-type population infected at time of invasion,  , invasion is possible for the largest range of β when slightly less than half the population is infected (figure 3). At this frequency of infection, the pathogen is sufficiently established that it poses a real threat to individual fitness, but is not so ubiquitous that a randomly chosen partner will be assured of being infected. As a result, the evolvability of pair-formation will tolerate the largest range of transmission probability, β.
Figure 3.
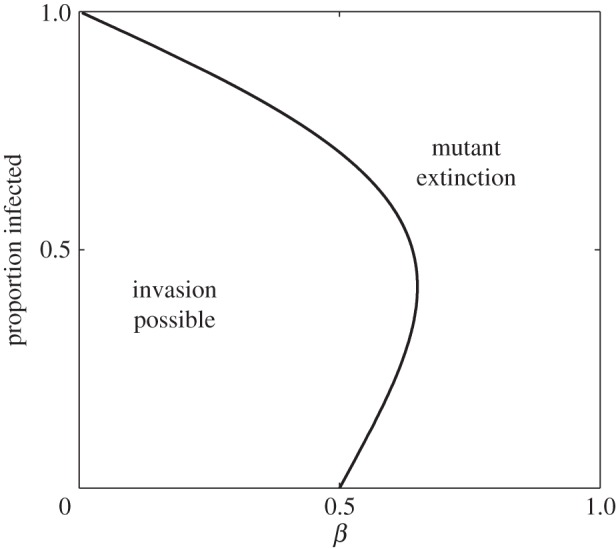
Relationship between the probability of transmission per reproductive event, β, and the proportion of the population infected at the time of invasion. The curve separating the region of invasibility from extinction is given by rearranging (3.3) independently of δ.
(b). Pathogen causes mortality
Suppose pathogen virulence only affects host mortality (δ = 1). Then invasion is possible if
| 3.4 |
Since R0 > 1 and 1/μ < 1, when pair-formation costs are exclusively maintenance (right-hand side of (3.4) is zero), invasion is always possible. This was not true when pathogen virulence caused host sterility (see (3.3)). The reasons are twofold. First, when pathogen virulence causes mortality, if a mutant pairs with an infected individual the lifetime of the pairing is shortened due to the increased likelihood of the death of the partner, thereby reducing the likelihood of infection transmission. Thus, the transmission risks of pair-formation are lessened, something that does not occur for sterilizing pathogens. Second, sterilizing pathogens cause reduced fecundity for the duration of a pairing if the chosen partner is infected and hence sterile. This cost is paid irrespective of the mutant's infection status, thus the proportion of the population infected is critical to the evolvability of monogamy when the STI causes sterility. Indeed, we observed this relationship in figure 2b.
As we vary pathogen virulence, μ, and transmission, R0, in (3.4), we obtain qualitatively similar patterns to the case when the STI is sterilizing. In particular, serial monogamy is the most selectively advantageous at intermediate R0 and declines at both high and low pathogen transmission rates.
(c). Pathogen causes both mortality and sterility
Now suppose the STI affects both host mortality and sterility. As was true when virulence was restricted to sterility or mortality alone, serial monogamy is the most advantageous at intermediate R0 (figure 4). There are a number of key differences however. First, the minimum level of pathogen-induced sterility, given by the upperbound on δ in (3.3), does not necessarily exist when disease-induced mortality is sufficiently high (figure 4). That is, if a pathogen has a small impact upon sterility, monogamy can still be selectively advantageous provided disease-related mortality is large enough. This is logical: at high disease-induced mortality, if a mutant does pair with an infected individual, the lifetime of the pairing is short enough to lessen both the fitness costs of pairing with a sterile individual and the likelihood of disease transmission. Second, at fixed R0, it is possible that at both high and low sterility, monogamy is advantageous, while at intermediate levels of sterility it is not (figure 4). At intermediate levels of sterility, the selective pressure of the disease-induced mortality is insufficient to overcome the double penalty associated with forming a pair with an infected individual, that is, the risk of infection and the reduced fecundity for the duration of the pairing. At low levels of sterility (δ ≈ 1), disease-induced mortality becomes the driving force behind evolution, and from (3.4) we know that monogamy will evolve. At high levels of sterility (δ ≈ δc), both aspects of pathogen virulence work in concert to select for monogamy.
Figure 4.

Conditions for the evolution of monogamy when virulence causes sterility and mortality. The invasion coefficient is the condition for invasion; when positive, the mutant can invade. For all panels, the catalysis costs are zero; increases to these costs will reduce the likelihood of invasion while preserving the qualitative patterns. (a)–(c) Increasing probability of infection, β, while each curve corresponds to a different value of μ, starting from μ = 1 (STI does not affect mortality; thickest black curve) and increasing as indicated by the arrow to the right. The dashed red line corresponds to δc below which STI-induced sterility drives the host population to extinction. (d–f) Increasing values of μ, while each curve corresponds to a different level of sterility, δ. The direction of increase of δ is shown by the arrow to the right; as δ increases, sterility decreases. (Online version in colour.)
4. Discussion
In this paper, we examine the conditions under which an endemic, cryptic STI can promote the evolution of serial monogamy in a sexually reproducing organism. We purposefully restricted our model such that the only selective force was the STI, and there was no mate choice as has been studied elsewhere [9,10,22]. By contrasting the cases when pathogen virulence causes either host mortality or sterility, we found that cryptic STIs causing host mortality are more conducive to the evolution of serial monogamy, contrary to expectations elsewhere [7]. The reasoning is simple. First, when a pathogen causes mortality, if a mutant chooses an infected partner, the partner's increased mortality yields a shortened pairing lifetime, reducing the likelihood of infection transmission. Second, for sterilizing STIs, in the event that a mutant pairs with an infected individual, in addition to the risk of infection transmission there is an additional consequence of pair-formation: the reduced fecundity for the duration of the pairing because the chosen partner is sterile. This penalty exists irrespective of the focal individual's infection status and is exacerbated by higher levels of sterility.
Our model also revealed some of the barriers that pathogen transmission rate, R0, pose to the evolution of serial monogamy. Regardless of the mechanism of pathogen virulence, serial monogamy was most selectively advantageous at intermediate rates of pathogen transmission (figures 2 and 4). At low R0, pathogen transmission is infrequent, hence there is little incentive to form pairs as it is unlikely that even a promiscuous individual will become infected. At high R0, the proportion of the population infected is sufficiently high that a randomly chosen partner will likely be infected, thus pair-formation grants little respite from transmission risks. Conversely, at intermediate R0 the pathogen is sufficiently prevalent that infection poses a risk to fitness, but is not so ubiquitous that randomly selecting an uninfected partner is virtually impossible. This finding holds even when the STI is highly virulent and hence poses the greatest risk to the host. In general, highly virulent STIs are the conditions under which it has been proposed that monogamy should evolve [4,6,7,13,23]. Our results therefore illustrate the adaptive difference between a behaviour practised en masse by the population and a behaviour that is initially rare. Certainly, were serial monogamy practised by the entire population, it would likely deliver superior population-wide fitness benefits, and possibly eradicate the pathogen. However, it is unlikely to emerge in a population when the behaviour is initially rare due to individual-level selection. In general, we would expect this obstacle to limit the ability of an STI to drive the emergence of monogamy. Our findings about the selective advantage of intermediate transmission mirror those found in previous work on host immune investment strategies [24] and host sociality [25]. The similarities are unsurprising: in all cases, the host is weighing the costs of the particular defence against infection (e.g. serial monogamy, immune investment) against the benefits; as argued above, the pathogen must be common enough to pose a threat to individual fitness, but not so pervasive that costs are prohibitive.
In agreement with our findings, previous work has found that monogamy is not always expected to evolve in the presence of an sterilizing STI [14]. However, the model of Thrall et al. [14] was limited to within-season reproductive success, rather than an overall measure of fitness. As a result, they assumed that disease frequency did not change within-season and thus the proportion of the population infected was independent of both the per-contact probability of infection (our β) and the frequency of copulations (our b) [14]. Consequently, they found that the per-contact probability of infection was critical to the evolvability of monogamy (our β): when high, monogamy was not expected to evolve. Our results show that the relationship is more complex, and is dependent upon both the number of copulations, b, as well as the virulence of the pathogen, δ (figure 3).
Although empirical results for host-STI systems are limited, in one well-studied example, ladybird (Adalia bipunctata) populations in Europe are infected with a virulent, highly prevalent STI inducing near-total host sterility [26–28], yet the populations remain promiscuous. Boots & Knell [12] argued that the expectation should be that monogamy evolves, and proposed that the coexistence of risky and safe host behaviour may explain why promiscuity instead dominates. Our results, however, indicate that not only are behavioural polymorphisms not needed, but based upon the characteristics of the ladybird-STI system, monogamy would in general not be expected to evolve.
Our analysis made a number of simplifying assumptions. We assumed that the population sex-ratio was fixed and that there were no sex-specific differences in pathogen transmission. Moreover, multiple failed reproductions can often lead to ‘divorces' in pair-forming species [7,17,18], whereas in our model pairing break-up was only due to death of either party. While divorce would not have an effect upon STIs altering host mortality, it would promote monogamy for sterilizing STIs by reducing time spent in suboptimal pairings.
In summary, our model has revealed a number of previously unconsidered barriers to pathogen-driven emergence of serial monogamy. In particular, we found that crucial to the emergence of serial monogamy are the proportion of the population infected, the probability of infection transmission per reproductive event, the magnitude of pathogen virulence, and the type of virulence (sterility versus mortality).
Supplementary Material
References
- 1.Hamilton WD, Zuk M. 1982. Heritable true fitness and bright birds: a role for parasites. Science 218, 384–386. ( 10.1126/science.7123238) [DOI] [PubMed] [Google Scholar]
- 2.Emlen ST, Oring LW. 1977. Ecology, sexual selection, and the evolution of mating systems. Science 197, 215–223. ( 10.1126/science.327542) [DOI] [PubMed] [Google Scholar]
- 3.Clutton-Brock TH. 1989. Review lecture: mammalian mating systems. Proc. R. Soc. Lond. B 236, 339–372. ( 10.1098/rspb.1989.0027) [DOI] [PubMed] [Google Scholar]
- 4.Freeland WJ. 1976. Pathogens and the evolution of primate sociality. Biotropica 8, 12–24. ( 10.2307/2387816) [DOI] [Google Scholar]
- 5.Hamilton WD. 1990. Mate choice near or far. Am. Zool. 30, 341–352. ( 10.1093/icb/30.2.341) [DOI] [Google Scholar]
- 6.Sheldon BC. 1993. Sexually transmitted diseases in birds: occurrence and evolutionary significance. Phil. Trans. R. Soc. Lond. B 339, 491–497. ( 10.1098/rstb.1993.0044) [DOI] [PubMed] [Google Scholar]
- 7.Loehle C. 1995. Social barriers to pathogen transmission in wild animal populations. Ecology 76, 326–335. ( 10.2307/1941192) [DOI] [Google Scholar]
- 8.Graves B, Duvall D. 1995. Effects of sexually transmitted diseases on heritable variation in sexually selected systems. Anim. Behav. 50, 1129–1131. ( 10.1016/0003-3472(95)80112-X) [DOI] [Google Scholar]
- 9.Thrall PH, Antonovics J, Dobson AP. 2000. Sexually transmitted diseases in polygynous mating systems: prevalence and impact on reproductive success. Proc. R. Soc. Lond. B 267, 1555–1563. ( 10.1098/rspb.2000.1178) [DOI] [PMC free article] [PubMed] [Google Scholar]
- 10.Kokko H, Ranta E, Ruxton G, Lundberg P. 2002. Sexually transmitted disease and the evolution of mating systems. Evolution 56, 1091–1100. ( 10.1111/j.0014-3820.2002.tb01423.x) [DOI] [PubMed] [Google Scholar]
- 11.Ashby B, Gupta S. 2013. Sexually transmitted infections in polygamous mating systems. Phil. Trans. R. Soc. B 368, 20120048 ( 10.1098/rstb.2012.0048) [DOI] [PMC free article] [PubMed] [Google Scholar]
- 12.Boots M, Knell RJ. 2002. The evolution of risky behaviour in the presence of a sexually transmitted disease. Proc. R. Soc. Lond. B 269, 585–589. ( 10.1098/rspb.2001.1932) [DOI] [PMC free article] [PubMed] [Google Scholar]
- 13.Lombardo MP. 1998. On the evolution of sexually transmitted diseases in birds. J. Avian Biol. 29, 314–321. ( 10.2307/3677114) [DOI] [Google Scholar]
- 14.Thrall PH, Antonovics J, Bever JD. 1997. Transmission of disease and host mating systems: within-season reproductive success. Am. Nat. 149, 485–506. ( 10.1086/286001) [DOI] [Google Scholar]
- 15.Lukas D, Clutton-Brock TH. 2013. The evolution of social monogamy in mammals. Science 341, 526–530. ( 10.1126/science.1238677) [DOI] [PubMed] [Google Scholar]
- 16.Getz WM, Pickering J. 1983. Epidemic models: thresholds and population regulation. Am. Nat. 121, 892–898. ( 10.1086/284112) [DOI] [Google Scholar]
- 17.Diamond JM. 1987. A Darwinian theory of divorce. Nature 329, 765–766. ( 10.1038/329765a0) [DOI] [PubMed] [Google Scholar]
- 18.Dubois F, Cézilly F. 2002. Breeding success and mate retention in birds: a meta-analysis. Behav. Ecol. Sociobiol. 57, 357–364. ( 10.1007/s00265-002-0521-z) [DOI] [Google Scholar]
- 19.Dietz K, Hadeler KP. 1988. Epidemiological models for sexually transmitted diseases. J. Math. Biol. 26, 1–25. ( 10.1007/BF00280169) [DOI] [PubMed] [Google Scholar]
- 20.Fredrickson AG. 1971. A mathematical theory of age structure in sexual populations: random mating and monogamous marriage models. Math. Biosci. 10, 117–143. ( 10.1016/0025-5564(71)90054-X) [DOI] [Google Scholar]
- 21.Knell RJ. 1999. Sexually transmitted disease and parasite-mediated sexual selection. Evolution 53, 957–961. ( 10.2307/2640735) [DOI] [PubMed] [Google Scholar]
- 22.Loehle C. 1997. The pathogen transmission avoidance theory of sexual selection. Ecol. Model. 103, 231–250. ( 10.1016/S0304-3800(97)00106-3) [DOI] [Google Scholar]
- 23.Altizer S, et al. 2003. Social organization and parasite risk in mammals: integrating theory and empirical studies. Annu. Rev. Ecol. Evol. Syst. 34, 517–547. ( 10.1146/annurev.ecolsys.34.030102.151725) [DOI] [Google Scholar]
- 24.van Baalen M. 1998. Coevolution of recovery ability and virulence. Proc. R. Soc. Lond. B 265, 317–325. ( 10.1098/rspb.1998.0298) [DOI] [PMC free article] [PubMed] [Google Scholar]
- 25.Bonds MH, Keenan DC, Leidner AJ, Rohani P. 2005. Higher disease prevalence can induce greater sociality: a game theoretic coevolutionary model. Am. Nat. 59, 1859–1866. ( 10.1554/05-028.1) [DOI] [PubMed] [Google Scholar]
- 26.Hurst GDD, Sharpe RG, Broomfield AH, Walker LE, Majerus TMO, Zakharov IA, Majerus MEN. 1995. Sexually transmitted disease in a promiscuous insect, Adalia bipunctata. Ecol. Entomol. 20, 230–236. ( 10.1111/j.1365-2311.1995.tb00452.x) [DOI] [Google Scholar]
- 27.Webberley KM, Hurst GDD, Buszko J, Majerus MEN. 2002. Lack of parasite-mediated sexual selection in a ladybird/sexually transmitted disease system. Anim. Behav. 63, 131–141. ( 10.1006/anbe.2001.1877) [DOI] [Google Scholar]
- 28.Webberley KM, Buszko J, Isham V, Hurst GDD. 2006. Sexually transmitted disease epidemics in a natural insect population. J. Anim. Ecol. 75, 33–43. ( 10.1111/j.1365-2656.2005.01020.x) [DOI] [PubMed] [Google Scholar]
Associated Data
This section collects any data citations, data availability statements, or supplementary materials included in this article.