

Abstract
Novel methods are required for site-specific, quantitative fluorescence labeling of G protein-coupled receptors (GPCRs) and other difficult-to-express membrane proteins. Ideally, fluorescent probes should perturb native structure and function as little as possible. We evaluated bioorthogonal reactions to label genetically encoded p-acetyl-l-phenylalanine (AcF) or p-azido-l-phenylalanine (azF) residues in receptors heterologously expressed in mammalian cells. We found that keto-selective reagents were not truly bioorthogonal, possibly due to posttranslational protein oxidation reactions. In contrast, the strain-promoted [3+2] azide–alkyne cycloaddition (SpAAC) with dibenzocyclooctyne (DIBO) reagents yielded stoichiometric conjugates with azF-rhodopsin while undergoing negligible background reactions. As one useful application, we used Alexa488-rhodopsin to measure the kinetics of ligand uptake and release in membrane-mimetic bicelles using a novel fluorescence-quenching assay.
Keywords: unnatural amino acid, bioorthogonal labeling, fluorescence quenching, rhodopsin, G protein-coupled receptors
INTRODUCTION
The superfamily of heptahelical G protein-coupled receptors (GPCRs) mediates important and diverse physiological actions by transmitting extracellular signals across the membrane.[1] Receptor activation is accompanied by ligand-induced conformational changes.[2] Despite recent advance in crystallography, which has provided high-resolution crystal structures of multiple GPCRs,[3] there is a pressing need for additional biophysical and biochemical techniques to achieve a precise understanding of the molecular basis of receptor activation. Fluorescence-based techniques are powerful tools for probing the conformational states of receptors both in purified conditions[4] and in live cells.[5] Meanwhile, covalent attachment of a fluorescent label at a specific site in a purified receptor can be challenging. Maleimide and methanethiosulfonate chemistries targeting cysteine thiol groups have been exploited to introduce a spin label into rhodopsin[6] and a conformational-sensitive probe into β2-adrenergic receptor.[7] However, as all GPCRs possess multiple cysteines, naturally occurring reactive cysteines often have to be replaced with unreactive amino acids by site-directed mutagenesis,[4] a laborious process that may result in functional alterations.[8] In addition, sulfhydryl chemistry is, of course, not bioorthogonal. An alternate approach is to introduce unique functional groups that are not naturally present in native proteins using unnatural amino acid (uaa) mutagenesis.[9]
In 2002, site-specific incorporation of an uaa into proteins has been achieved by combining a mutant E. coli Tyr-tRNA synthetase (Tyr-RS) that recognize the uaa and B. stearothermophilus suppressor tRNATyr to form an orthogonal pair for amber suppression in mammalian cells.[10] In 2003, the Peter G. Schultz group reported a series of engineered E. coli Tyr-RS variants that recognize a broader range of uaas.[11] Our laboratory has greatly improved the amber suppression efficiency by creating a novel chimera of H. sapiens and B. stearothermophilus tRNATyr that forms an orthogonal pair with the E. coli Tyr-RS in the human HEK293 cell line.[12] We have adapted this orthogonal pair of suppressor tRNA and tRNA synthetase to incorporate p-acetyl-l-Phe (AcF), p-azido-l-Phe (azF), and p-benzoyl-l-Phe (BzF) into various GPCRs heterologously expressed in transiently transfected cells.[12–13] We further developed several applications based on this method, such as utilizing azF as an IR probe to track the conformational change involved in rhodopsin activation,[2, 13a] and using azF and BzF as photocrosslinkers to map the binding modes of HIV entry-blocking ligands for the chemokine receptors CCR5 and CXCR4.[13b, 14]
Here we present results on site-specific fluorescent labeling of a functional GPCR. We utilized rhodopsin, a prototypical class A GPCR as the model system to study the labeling chemistry. We performed a comparative study for two labeling strategies, one targeting the keto group in AcF and the other targeting the azido group in azF. We carried out kinetic analysis of the model reactions, and quantified the extent of non-specific labeling. We demonstrated the bioorthogonality of the azido group, and concluded that strain-promoted [3+2] azide–alkyne cycloaddition (SpAAC) reaction of dibenzocyclooctyne (DIBO) with azF is a suitable choice for labeling discrete sites in azF-rhodopsin with fluorophores. Finally, we utilized the azF-rhodopsin labeled with Alexa488 to measure the kinetics of ligand uptake in a membrane-mimetic bicelle system.
RESULTS
The bioorthogonality of keto group and azido group as labeling handles
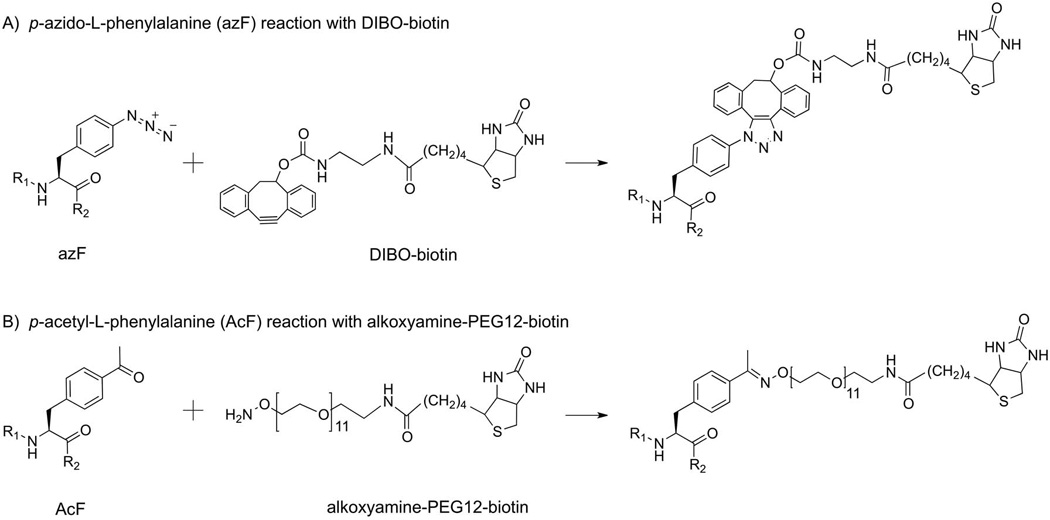
We conducted a comparative study for the labeling chemistries utilizing the two reactive handles incorporated into GPCRs through amber codon suppression (Figure 1). We chose oxime ligation to biotinylate AcF-tagged rhodopsin, and SpAAC for azF-tagged receptor, respectively, with wild-type rhodopsin (wt Rho) as the control (Figure 2). We performed the labeling reactions with detergent-solubilized rhodopsin immobilized on 1D4-Sepharose to facilitate washing away of excess unbound label. We obtained the second-order rate constants for the two labeling strategies by carrying out time-series measurements using dual-color quantitative Western blot (Figure S1). We found that the combination of SpAAC and azF exhibited reaction kinetics that was faster by two orders of magnitude, and also displayed higher specificity (Figure 2). The combination of oxime ligation and AcF resulted in substantial background labeling for wt Rho (~0.1, Figure 2A). Interestingly, the rate of the non-specific reaction was faster than that of the specific reaction and complete within half an hour.
Figure 1.

The structure of bovine rhodopsin (PDB 1U19) with 11-cis-retinal (orange) and the tested sites (red) highlighted
Figure 2.

Comparison of labeling chemistries for azF- and AcF-rhodopsin (Rho). The time-series samples were analyzed using dual-color quantitative Western blot (Figure S1). As the labeling reagents have different linker lengths and detectabilities, the Western blot signals from two chemistries cannot be directly compared. Therefore, to simplify the interpretation of data, the extent of labeling (ξ) was normalized under the assumption that ξ for the specific component for each labeling chemistry, upon the completion of reaction, is assigned to 1.0. A) The kinetic study for the azF-Rho and wt Rho reacted with 50 µm DIBO-biotin. The background labeling for wt Rho was negligible. The second-order reaction rate k2 for Rho S144azF with DIBO-biotin is 8.6 ± 1.3 m−1 s−1. B) Kinetic study for the AcF-Rho and wt Rho reacted with 10 mm alkoxyamine-PEG12-biotin. The specific k2 for Rho S144AcF with alkoxyamine-PEG12-biotin is 0.027 ± 0.006 m−1 s−1, two orders of magnitude lower than that of azF with DIBO-biotin. There was a substantial non-specific component for this reaction, based on the background labeling of wt Rho. The non-specific k2 for wt Rho with alkoxyamine-PEG12-biotin is 0.13 ± 0.04 m−1 s−1. All the rate constants reported here were obtained from two independent sets of experiments. The rate constants are listed in Table S1.
Site-specific fluorescent labeling of rhodopsin
Based on the different reactivities and bioorthogonalities of the two labeling strategies, we decided to further utilize a DIBO derivative of Alexa488 to generate fluorescently labeled rhodopsin by SpAAC (Scheme 2). Figure 2 shows the results obtained for a typical reaction of rhodopsin samples treated for 18 h with 50 µm Alexa488-DIBO at 25°C. The in-gel fluorescence (Figure 3A) shows a prominent fluorescent band for azF incorporated in rhodopsin at positions Y102, S144, or V173, whereas the wt sample does not show a fluorescent band above background level. At the bottom of the gel lanes, variable and very weak bands can be observed, indicating minute amounts of unbound dye remaining after the purification procedure. Comparison of the normalized spectra for wt and S144azF rhodopsin after photoactivation indicates that the Alexa488 content in the wt sample is approximately 25-fold less than in S144azF (Figure 3B). Representative spectra in the dark state (Dark) and after photobleaching (Light) are shown together with the difference spectrum (Dark–Light) are shown for wt, Y102azF, S144azF, and V173azF rhodopsin (Figure 3C).
Scheme 2.
Figure 3.

Fluorescent labeling of Rho with Alexa488-DIBO on azF residues incorporated at various positions. A) After labeling reactions, samples were separated by 4–12% SDS-PAGE and the gel image was taken with a confocal 488-nm laser fluorescence scanner using an emission filter set optimized for Alexa488 detection. Strong fluorescent bands were observed for the mutants S144azF and V173azF, whereas that for Y102azF was significantly weaker. No band was observed for wt Rho treated under the same condition. B) UV-Vis spectra of wt and S144azF Rho labeled with Alexa488-DIBO. The dark state (dark) and illuminated (light) spectra are normalized to the amount of Rho using the 380-nm absorbance of the illuminated sample (light). Comparison of the absorbance at 495 nm illustrates the small amount of Alexa488 present in the purified wt sample mainly due to co-purification and to a lesser extent due to background labeling. C) UV-Vis spectra for Rho labeled at three different sites. The spectra were taken before (red, Dark) and after (green, Light) photobleaching. The label-to-protein ratio was calculated from the 495-nm absorbance in the green spectrum and the 500-nm absorbance in the difference spectrum (blue). The Alexa488-to-Rho ratio for these spectra was 0.04, 0.58, 1.13, and 1.73 for wt, Y102azF, S144azF, and V173azF, respectively.
The azF-tagged rhodopsin mutants exhibited higher degrees of labeling than the wt rhodopsin regardless of labeling position. The three mutants showed different extents of labeling, suggesting site-specific differences in reactivity toward the labeling reagent. A comparison of the molar ratios of Alexa488 to rhodopsin calculated from the difference spectra is presented in Table 1. We obtained a labeling ratio of 1.3 ± 0.2 for S144azF and 1.6 ± 0.2 for V173azF, respectively. The super-stoichiometry possibly resulted from a fraction of receptors that did not regenerate with 11-cis-retinal. To minimize the presence of misfolded, non-functional receptors, we followed a purification procedure shown to reduce such impurities.[15] Alternatively, it is possible that the extinction coefficient of Alexa488 varies with the chemical environment of a particular labeling position. A detailed analysis of this issue is beyond the scope of this paper, but we are confident that this observation is not the result of background reactivity of DIBO with sites other than azF, since the labeling ratio for wt rhodopsin is only 0.04.
Table 1.
Alexa488-DIBO labeling of azF residues in Rho
| Protein | mol Alexa488/ mol Rho |
2nd order rate constant (103 M−1 s−1) |
Quenching efficiency |
|---|---|---|---|
| wt | 0.05 ± 0.03 | n.d. | n.d. |
| Y102azF | 0.72 ± 0.18 | n.d. | n.d. |
| S144azF | 1.3 ± 0.2 | 1.3 ± 0.3 | 0.55 ± 0.04 |
| V173azF | 1.6 ± 0.2 | 1.5 ± 0.1 | 0.72 ± 0.06 |
Kinetic study of SpAAC using Alexa488-DIBO
Labeling stoichiometry can be determined more accurately using UV-Vis spectroscopy. However, it requires large amount of samples (each measurement requires approximately 1 µg of purified rhodopsin). Therefore, for the kinetic study we chose in-gel fluorescence and silver staining for quantification (Figure 4A). As predicted, the conjugation reaction between S144azF and Alexa488-DIBO was pseudo-first order (Figure 4B), giving a k2 of 62 m−1 s−1. It is worth noting that the rate constant is two to three orders of magnitude higher than the value reported in the original literature.[16]
Figure 4.

The kinetic study of strain-promoted alkyne–azide cycloaddition. A) The time course of the reaction shown by in-gel fluorescence. For each time point, 10 µL of sample was loaded to the SDS-PAGE gel. The fluorescence signal was quantified using ImageJ. The amount of protein loading was obtained from silver staining of the same gel, and quantified using ImageJ. The fluorescence intensity corrected for protein loading was calculated as I =F/S. B) The normalized extent of reaction versus the reaction time. The extent of reaction upon completion is assigned to 1.0. The data was fitted using pseudo first-order kinetic model. The k2 for Rho S144azF with Alexa488-DIBO is 62 ± 12 m−1 s−1 based on two independent sets of experiments.
Evaluation of the functionality of the labeled rhodopsin
To examine the functional state of the labeled receptor, we developed a fluorescence-based ligand uptake assay based on earlier studies of fluorescence-quenching experiments.[15b, 17]To determine the kinetics of the binding reaction of chromophore (i.e., 11-cis-retinal) and apoproteinopsin, we utilized Alexa488 as a reporter, which can be attached to a specific site of rhodopsin on either the extracellular or cytoplasmic surface. The emission spectrum of Alexa488 overlaps with the intense 500-nm absorption band of rhodopsin in the dark state, in which the 11-cis-retinal is covalently attached to the protein in the chromophore-binding pocket. Therefore this spectral overlap can cause a significant quenching of the fluorescence signal from Alexa488. Reversely, the fluorescence quenching disappears when rhodopsin is photobleached to generate an activate state of rhodopsin, metarhodopsin (Meta-II), which contains all-trans-retinal that absorbs at 380 nm. Meta-II decays over time, and all-trans-retinal is released from its binding pocket. Because the quenching is dependent on the protonated Schiff base state of the covalent bonding between11-cis-retinal and the apoproteinopsin, Alexa488 signal serves as a probe of the interactions between them.
A typical fluorescent quenching experiment with Rho S144-Alexa488 is shown in Figure 5 (red line). After 5 min (red line, arrow a’) we added 30 µL of rhodopsin sample (typically 0.3– 1.0 µg) into lipid/detergent micelles to a final concentration of 15–50 nm. Upon illumination (red line, arrow b′), we observed a fast increase of fluorescence signal. This is because photoisomerization of 11-cis to all-trans-retinal, accompanied by a change from a protonated Schiff base (rhodopsin state) to a deprotonated Schiff base (Meta-II state), causes disappearance of spectral overlap between rhodopsin and Alexa488, and consequent loss of quenching. While the system was allowed to equilibrate for 45 min, all-trans-retinal was released as the Meta-II state decayed, and the apoproteinopsin became the dominant species. Upon addition of 1.5 µm (1.48–1.59 µm) 11-cis-retinal (30–100-fold excess) (red line, arrow c′), we observed a gradual decrease of the fluorescence signal for the Rho S144-Alexa488 sample, corresponding to the kinetics of 11-cis-retinal binding and formation of the dark state rhodopsin. This regeneration process was fit to a monoexponential model yielding a time constant. This time constant corresponds to the pseudo-first-order process of rhodopsin formation from opsin under excess 11-cis-retinal. The second order rate constant was calculated for each experiment using the exact retinal concentration.[18] The results for at least three independently prepared samples are summarized in Table 1. Control experiments showed that 20 seconds of illumination with the 505-nm light-emitting diode source caused negligible photobleaching of the Alexa488 fluorescence signal (Figure S5).
Figure 5.

Kinetic assay of photoactivation and regeneration of Alexa488-Rho. Time-dependent fluorescence changes in Alexa488-Rho (red line) and wt Rho (turquoise line) and evoked by light illumination and 11-cis-retinal regeneration were measured. The inset shows wt Rho on an expanded y-axis (20-fold). Pigment was added in a buffer containing CHAPS/POPC bicelles (indicated by arrow a′). Alexa488-specific fluorescence was recorded and photobleaching due to the excitation beam was minimized. Pigment was illuminated by a green high-power LED (18 s, 400 mW at 505 nm, Thorlabs) to form the active state Meta-II state (indicated by arrow b′). Subsequent addition of the ligand 11-cis-retinal was indicated by arrow c′. The Alexa488-Rho mutant shows an increase in fluorescence upon photoactivation and subsequent quenching with 11-cis-retinal uptake (the definition of calculation of quenching efficiency is explained in Figure S3). The small increase in fluorescence signal at a′ for the wt Rho is due to free label (~3% as compared to Rho S144-Alexa488), since subsequent illumination or 11-cis-retinal addition did not show significant fluorescence changes (less than 1% of the amplitude compared to Rho S144-Alexa488; cf. Figure S3). Together these results confirm that little or no Alexa488 was covalently attached unless theazF was present and that the site-specifically labeled Rho was fully functional in terms of photoactivation and regeneration.
The Rho wt sample treated under the identical reaction conditions with Alexa488-DIBO was tested using the same fluorescent quenching assay (Figure 5, turquoise line and inset). In contrast to the results from Rho S144-Alexa488, almost no visible change in the fluorescence signal was observed throughout the assay for the wt rhodopsin sample, confirming that little or no Alexa488-DIBO was covalently attached to the wt receptor without an azido handle. This is consistent with the absence of a fluorescent band in the SDS-PAGE gel (Figure 3A) as stated above. To assure there is no significant change in fluorescence for the wt sample, we modified the experiment by increasing the excitation intensity by approximately 4-fold, and found that after correction for the larger excitation intensity, the increase in signal due to photoactivation is approximately 1% relative to the S144azF mutant. The results are shown in Figure 5 and Figure S3 with magnified the ordinate scale.
We also performed the same assay for the mutant Rho V173-Alexa488 (Figure S4), and found no statistically significant difference in the retinal binding kinetics between these two labeling positions, S144 and V173. The results suggest that the chemistry required for the attachment of the fluorophore to the azF-tagged receptor did not perturb the ligand binding function of the receptor. In contrast, the quenching efficiencies differed significantly for the two sites (cf. Table 1), providing clear evidence for the site-specificity of the labeling chemistry. Taken together, the fluorescence-quenching assay demonstrated that the site-specifically labeled rhodopsins are fully functional in terms of photosensitivity and regeneration of the dark state with 11-cis-retinal.
DISCUSSION
The non-specific reactivity of chemistries selective for the keto group
Our aim in this present study was to identify highly selective and robust labeling chemistries that could exploit site-directed uaa mutagenesis of GPCRs. Initially we focused on the keto group in AcF.[12] Because keto groups have been studied for site-specific fluorescent labeling in several model systems.[19] Under roughly physiological conditions, ketones and aldehydes react specifically with hydrazide (or aminooxy) reagents through hydrazone (or oxime) ligation.[20] These reactions have been used to label proteins at genetically encoded N-terminal aldehyde tags,[21] and with more flexibility at site-specifically incorporated uaas.[19a, 22] However, in our initial attempts to label AcF tagged rhodopsin with a fluorescein-hydrazide, we observed substantial covalent modification of wt Rho in the absence of AcF.[12] In order to determine if such background reactivity was specific to a membrane glycoprotein, like rhodopsin, we studied a soluble, non-glycosylated protein, recombinant firefly luciferase. While we were able to label AcF-tagged luciferase, we also found similar background reactivity in wt luciferase with different reagents selective for ketone and aldehyde.[23]
Previous studies have reported that cellular oxidation processes often convert some amino acid residues to carbonyl derivatives (i.e., ketone and aldehyde) that can react with hydrazide reagents.[24] These reactive carbonyl groups normally present in proteins are known to originate from unusual post-translational oxidation processes to the side-chains of lysine, histidine and cysteine residues under oxidative stress.[25] More recently, a role of reactive lipid hydroperoxides has been described in a phenomenon known as “protein carbonylation”.[26] In our study, we obtained the rate constants of the reaction specific for the AcF handle, and the non-specific reaction for the wild-type receptor, and found the latter to be significantly faster than the former. This finding is consistent with the hypothesis that protein oxidation may involve the generation of aldehyde group, which has a more reactive carbonyl group than the ketone group in AcF. We suggested earlier[23] that these reactive carbonyl groups have been previously overlooked as the origin of background labeling in protein tagging experiments, possibly because low molecular weight proteins,[20b, 27] or highly modified components were employed as the model systems.[28] Therefore, the chemistries for aldehyde and ketone should be chosen with caution to achieve the desired protein modification.
A comparative study of labeling chemistries for the azido group
After carefully evaluating the non-specific reaction with labeling ketone, we explored the alternative of using azido groups as reactive handles to label proteins. Azides react specifically with phosphines through the Staudinger-Bertozzi ligation,[29] with alkyne reagents through copper (I)-catalyzed [3+2] azide–alkyne cycloaddition (CuAAC), with oxanorbornadienes through tandem [3+2] cycloaddition–retro-Diels–Alder (tandem crDA),[30] or with cyclooctynes through SpAAC.[31]
Encouraged by the previous reports of Staudinger ligation to label azido-containing proteins,[30, 32] we investigated the possibility of using fluorescein-phosphine to label azF-tagged luciferase and rhodopsin. We found the Staudinger ligation reaction of azF-luciferase with the phosphine reagents gave essentially no background as compared with the hydrazone and oxime ligations, indicating the true bioorthogonality of azido group over the keto group.[23] However, when we applied the Staudinger ligation to label the membrane protein rhodopsin, we experienced difficulties with the hydrophobicity of the fluorescein-phosphine label. Moreover, we found that the overall utility of the Staudinger ligation was limited by its relatively slow reaction kinetics and sub-stoichiometric ratio of labeling. The Staudinger ligation only achieved 30% labeling of rhodopsin after reacting for 12 h at room temperature,[23] in spite of the nearly stoichiometric conjugation of azF in other recombinant proteins with fluorescein-phosphine as reported previously.[32a] In agreement with our findings, a recent report of Staudinger ligations targeting two different azido amino acids showed that azF was only incompletely modified by phosphines, which was attributed to the shorter linker length between the backbone and the azide.[33]
We also considered the CuAAC reaction, commonly referred to as the copper-catalyzed click chemistry. However, we were concerned about the potential damage from Cu to the purified protein and live cells, as Cu can switch its oxidative states easily, thereby inducing undesirable chemical modifications to proteins and cells. This drawback of CuAAC prompted a hunt for reagents that react with azide in the absence of metal catalysts. A report in 1953 mentions an explosive reaction of cyclooctyne with phenyl azide forming a viscous liquid product,[34] later identified as 1-phenyl-4.5-cycloocteno-1.2.3-triazol.[35] In 2004, Bertozzi's group capitalized on these pioneering studies on the chemistry of many-membered rings in 1950s and 1960s and introduced SpAAC of cyclooctynes and azides as efficient bioconjugation reagents.[31a] In order to overcome problems such as low reactivity, poor reagent stability, and difficult synthetic pathways of the earlier cyclooctynes for bioconjugations, Boons and colleagues introduced dibenzocyclooctyne derivatives for bioconjugations by SpAAC[36] based on a 1969 report on the spontaneous reaction of dibenzocyclooctyne with phenyl azide.[37] Despite the reports of degradation of the cyclooctyne BARAC in presence of glutathione,[38] it was generally believed that SpAAC involving the cyclooctynes results in low background labeling.[31c] In a recent study, three cyclooctynes, DIBO, BCN, and DIBAC were used to evaluate azide-independent labeling of proteins, demonstrating that all of these reagents exhibited undesirable reactivities to varying extents, by a radical-based thiol-yne addition mechanism that modifies cysteine residues in proteins.[39] Interestingly, DIBO appeared to have drastically reduced background labeling as compared with BCN and DIBAC.[39] Previous applications of SpAAC for site-specific protein labeling primarily involved highly expressing, soluble proteins such as GFP expressed in E. coli and purified by Ni-NTA affinity chromatography followed by one of two alternative schemes: i) incorporation of azF into the target protein and subsequent labeling with DBCO (a cyclooctyne closely related to DIBAC),[40]or ii) incorporation of BCN derivative of pyrrolysine followed by labeling with an azido-containing label.[41]
In our study, SpAAC with DIBO results in site-specific, quantitative labeling of azF-tagged rhodopsin, a prototypical GPCR, expressed in mammalian cells and purified by immunoaffinity chromatography. While the reaction kinetics of SpAAC with rhodopsin varies with the specific chemical and structural properties of the labeling reagent and the location of the azF residue, it has proven generally satisfactory for our purpose. Interestingly, we noted in our system a substantial rate enhancement effect (from 4-fold to 400-fold) for the SpAAC reaction (8.6 ± 1.3 m−1 s−1 for DIBO-biotin or 62 ± 12 m−1 s−1 for Alexa488-DIBO and rhodopsin-S144azF) as compared with model reactions of DIBO and benzylazide in methanol (0.17 m−1 s−1) or water/acetonitrile (1:4 v/v) (2.3 m−1 s−1).[16a, 31b] A similar effect has been observed for the modification of GFP using a similar cyclooctyne reagent.[40] A straightforward explanation would be that the lipophilic nature of DIBO,[31b] which enables the labeling reagent to partition into the dodecyl maltoside micelles, results in an increased local concentration at sites located in the hydrophobic region of rhodopsin.
We present three independent lines of evidence that can be used to estimate the background labeling by DIBO in wt rhodopsin: 1) the absence of Alexa488 absorbance (<5%) in UV-Vis spectrum; 2) the absence of Alexa488 fluorescence emission in the in-gel fluorescence image (~5%); and 3) negligible change in fluorescence signal upon photoactivation in the fluorescence-quenching assay (<1%). We contend the steady-state fluorescence-quenching assay provided the most accurate information for non-specific covalent labeling, because the energy transfer is critically dependent on the distance between the donor and the receptor.
As mentioned earlier, it has been reported that such azide-independent background labeling of proteins with cyclooctyne reagents was primarily due to reactive cysteine thiols[39] in analogy to radical, photoinitiated thiol-yne additions.[42] In rhodopsin there are four membrane-embedded cysteines, three cytoplasmic cysteines, and three extracellular or intradiscal cysteines.[8] Among them two cytoplasmic cysteines (C140 and C316) have been shown to be highly reactive towards traditional thiol-specific reagents.[43] The normally S-palmitoylated cysteines (C322 and C323) may be incompletely palmitoylated and available for derivatization,[44]since S-palmitoylation is a reversible post-translational modification.[44b] Consequently, except for the two cysteines that form a disulfide bond (C110 and C187), from two to eight remaining cysteines are potentially reactive towards DIBO. We estimate based on 1% background labeling of wild-type rhodopsin that the selectivity factor of DIBO for azF over cysteine is between 200:1 and 800:1, which is sufficient to achieve good bioorthogonality in a chemically defined system.
The present study was primarily focused on labeling purified protein for in vitro experiments, but it also gave some insight into application of cyclooctyne reagents in live cell labeling. Considering the selectivity of DIBO reagents, the applicability of this approach depends on the relative abundance of the targeted azido groups over thiol groups from cysteine-containing proteins. The GPCRs are difficult targets that are generally expressed at low levels on the cell surface. Rhodopsin is among the best-expressing GPCRs in mammalian cells (6×10⁶ molecules/cell) and the expression levels of other GPCRs are likely to be lower than rhodopsin.[45] Moreover, based on our experience, uaa-tagged rhodopsin has significantly lower expression levels (10–20% compared to the wild-type receptor). We do not have direct information regarding the abundance of cysteines reactive to cyclooctyne, but we can estimate the number of cysteines in membrane proteins per cell. Membrane proteins constitute approximately 30% of the human proteome[46] and membrane proteins in the post-nuclear fraction comprise ~9% of total protein mass in human HeLa cells,[47] which corresponds to ~21 pg per cell or ~3.3×10⁸ membrane proteins considering each protein molecule has on average 350 amino acids.[48]Cysteine has been shown to vary from 0.2% to 0.5% in the total amino acid composition of cultured cells.[49]Assuming membrane proteins have a similar length and composition of amino acids, the total number of cysteines in the membrane proteins is no less than 2×10⁸ copies/cell. Therefore, on cell surface the abundance of cysteine is likely to be 2×10²-fold greater than that of azF in the well-expressing GPCR rhodopsin. With about 200:1 selectivity of DIBO for azF over cysteine, we would expect an equal contribution from specific labeling and background reactivity with cysteines. The situation would be much worse for receptor densities typically employed for single-molecule fluorescence tracking experiments (~1 µm−2),[50] which corresponds to only 2500 receptors per cell.[51]The oxidative state of cysteine thiols should also be taken into account; the exposed cysteines in the extracellular side are likely to be oxidized to disulfide bonds, while the transmembrane and intracellular cysteines more likely in the reduced form. However, considering the hydrophobicity of cyclooctynes, we cannot exclude that possibility that these reagents would partition into lipid bilayer and react with the transmembrane cysteines. Also, certain cyclooctyne derivatives are designed to permeate the membrane.[52] Taken together, owing to the cross reactivity with cysteines, it can be challenging to achieve an ideal signal-to-noise ratio for labeling and imaging low-abundance molecules on live cells using cyclooctyne reagents, as the chemistry is selective over the major non-specific reaction by only two orders of magnitude. Not surprisingly, successful applications of cyclooctyne reagents to live cell labeling normally necessitate the choice of high-abundance target molecules (e.g., peracetylated N-azidoacetylmannosamine) in the cell surface,[38] or promiscuous incorporation of azido uaas into multiple protein molecules.[53] Thus, we contend that the cross-reactivity with thiols should be evaluated in parallel with hydrophobicity for the development of new cyclooctyne derivatives for live-cell labeling.
The fluorescent quenching assay based on Alexa488 fluorescence
Earlier kinetics studies of chromophore binding and regeneration in rhodopsin utilized tryptophan (Trp) fluorescence.[17b, 54] However, this approach relies intrinsic Trp residues that are sensitive to ligand-binding or ligand-induced conformational changes and thus has significant limitations. First, due to the low quantum yield of Trp, studying intrinsic fluorescence requires up to 10 times more protein (>10 µg or 0.5 µm)[54] than needed when the receptor is labeled with extrinsic fluorophores with higher quantum yields (<1 µg/50 nm in our study). In addition, native Trp residues are not necessarily well positioned to serve as active-site probes. Moreover, so-called inner filter effects limit the useful concentration of UV-absorbing 11-cis-retinal in Trp-fluorescence experiments. Furthermore, in terms of more general applications, not all GPCR ligands will be able to quench or otherwise alter Trp fluorescence, which limits its general applicability to other GPCR systems. We thus developed a fluorescent quenching assay to circumvent these limitations of Trp quenching studies and subsequently show that the site-specifically labeled azF-rhodopsins remain functional photoreceptors with respect to ligand binding and release. Our results highlight the advantage of utilizing an extrinsic fluorescent reporter, which allows the flexibility of choosing the optimal photophysical properties to address a specific question, instead of relying on the intrinsic Trp fluorescence.
We anticipate this assay to be implemented to study the rhodopsin mutations implicated found in various retinal diseases, such as congenital stationary night blindness.[55] Furthermore, it could potentially provide a general scheme for studying the ligand-receptor interaction in vitro, especially for the peptide ligands available as fluorophore conjugates. While many previously-reported ligand binding assays similarly exploit the energy transfer between ligand and receptor,[56] our methodology is advantageous in two significant ways: 1) it does not involve a fluorescent fusion protein or fluorescent antibody, and is less likely to give an artifact due to extensive modification on native state of receptors; 2) it might provide insights into the mode of binding by comparing receptors specifically labeled at different positions.
CONCLUSION
We have developed a modular and general strategy to attach a fluorophore to rhodopsin, a prototypical GPCR, by combining uaa mutagenesis and strain-promoted alkyne-azide cycloaddition. We also demonstrated that keto group cannot serve as a truly bioorthogonal reactive handle, possibly owing to unexpected post-translational modifications. In order to examine the functionality of the labeled receptor and to provide an exemplary application for the labeling strategy, we designed a fluorescence-quenching assay and confirmed that the site-specifically labeled azF-rhodopsins were functional photoreceptors with respect to ligand binding and release. We believe that our bioorthogonal labeling strategy presented here has many potential general applications in the study of GPCRs. For example, by attaching appropriate biophysical and biochemical probes to the receptor, conformational changes[4, 57] or protein-protein interactions[58] can be followed. We also foresee the application of this approach in single-molecule fluorescence studies of purified receptors.[59]
EXPERIMENTAL SECTION
Materials.E. coli TOP10 (Invitrogen) was used for plasmid propagation and isolation. Oligonucleotides were obtained from eOligo. Plasmid DNA was purified using standard Maxi Prep Kits from Qiagen. AcF (RSP Amino Acids LLC) and azF (Chem-Impex International) were used without further purification. The plasmid pSVB.Yam is a tRNA expression vector carrying a humanized chimeric gene encoding an amber suppressor tRNA derived from the B. stearothermophilus tRNATyr,[12] pcDNA.RS-Tyr is a protein expression vector based pcDNA3.1 (+)/neo (Invitrogen) with a gene encoding E. coli Tyr-RS with a C-terminal FLAG tag,[12] pcDNA.RS-AcF (E. coli Tyr-RS-Y37I/D182G/F183M/L186A) and pcDNA.RS-azF (E. coli Tyr-RS-Y37L/D182S/F183M/L186A) are the tRNA synthetase for AcF and azF, respectively,[12–13] and pMT4 carries the synthetic gene encoding wt bovine rhodopsin.[60] We introduced amber mutations into the rhodopsin gene by QuikChange mutagenesis (Stratagene). All plasmid constructs were confirmed by automated DNA sequencing. The HEK293F cell lines, the transfection reagents (FreeStyle MAX), and expression media (OptiPRO SFM reduced serum medium, serum-free FreeStyle 293 expression medium) were obtained from Invitrogen/Thermo Fisher Scientific. 1D4-Sepharose 2B was prepared from 1D4 mAb and CNBr-activated Sepharose 2B (2 mg IgG per mL packed beads) as described previously.[61] Alexa488-DIBO was obtained from Molecular Probes/Thermo Fisher Scientific as dry powder, and dissolved in DMSO at 5 mm and stored at −20°C.
Amber codon suppression in suspension cells
HEK293F suspension cells were cultured in serum-free FreeStyle 293 expression medium in a 125-mL disposable, sterile, polycarbonate Erlenmeyer flask (Corning) at 37°C in 5% CO2 atmosphere. The cell culture was shaken on an orbital shaker at 125 rpm. Before transfection, the cell culture was diluted to a density of 106 cells/mL in a 30-mL culture supplemented with 1 mm unnatural amino acids (AcF or azF). For amber codon suppression, Plasmid DNA (38.6 µg in total, 18.4 µg of pMT4.Rho containing the amber codon, 18.4 µg of pSVB.Yam, and 1.84 µg pcDNA.RS) was added into OptiPRO SFM (a total volume of 0.6 mL) reduced serum medium. In another sterile tube, transfection reagent FreeStyle MAX (38.6 µL) was diluted in into OptiPRO SFM (a total volume of 0.6 mL). The diluted transfection reagent was gently combined with the DNA. The mixture was let stand at room temperature for 10 minutes and then added into the cell culture (total cell number 3×10⁷). The cells were harvested 96 hours post-transfection. The total cell number upon harvesting normally ranged from 6×10⁷ to 8×10⁷.
Bioorthogonal labeling of rhodopsin
The 11-cis-retinal regenerated cells (see the supplementary information for the regeneration procedures) were lysed with the solubilization buffer (1 mL per 107 cells, 1% (w/v) DM, 50 mM HEPES or Tris-HCl, pH 6.8, 100 mM NaCl, 1 mM CaCl2 with Complete EDTA-free Protease Inhibitor Cocktail, Roche) for at least 1 h at 4°C. The lysate was cleared by centrifugation at 100,000×g for 30 min and incubated overnight at 4°C with 1D4-mAb-sepharose 2B (100 µL). The resin was transferred into a 1.5-mL Eppendorf tube and washed three times for 30 min each with 0.5 mL reaction buffer. Then reaction buffer (200 µL) was mixed with the resin (100 µL) to give 300 µL slurry. The reaction conditions for each chemistry are listed in Table 2.
Table 2.
Reaction conditions for the labeling chemistries
| uaa | Labeling reagent | Labeling reagent concentration |
Reaction buffer |
|---|---|---|---|
| AcF | alkoxyamine-PEG12-biotin | 10 mm | 0.1% (w/v) DM in 20 mm PBS, pH 6.0 |
| azF | DIBO-biotin | 50 µm | 0.1% (w/v) DM in DPBS, pH 7.2 |
| azF | DIBO-Alexa488 | 50 µm | 0.1% (w/v) DM in DPBS, pH 7.2 |
The reaction was stopped by centrifugation and removal of the supernatant fraction. The resin was then transferred into a microporous centrifugal filtering unit (Microcon-MC pore size 0.48 µm, Millipore). The resin was first washed with the reaction/wash buffer for three times (30 min incubation each time) to deplete the unreacted dyes, and then with a low-salt buffer (0.1% (w/v) DM, 2 mm sodium phosphate buffer, pH 6.0). The receptor was eluted with elution buffer (100µL, no less than the volume of the resin; 0.33 mg/mL C9 peptide in 0.1% (w/v) DM, 2 mm sodium phosphate buffer, pH 6.0). The resin was incubated with the elution buffer on ice for at least 1 h. The purified receptor was collected in a clean 1.5-mL Eppendorf tube. The elution was repeated a second time. The combined elutions were supplemented with 150 mm NaCl and characterized by UV-Vis spectroscopy and in-gel fluorescence (see Supplementary Information for experimental details). Purified samples were stored at −80°C and thawed on ice before use.
Kinetic study of SpAAC and oxime ligation
The reaction was performed under the same condition as described above. The starting mixture consists of uaa-tagged Rho or wild-type Rho bound to 1D4-sepharose 2B resin (100 µL), and reaction buffer (200 µL). At different time points, an aliquot of the resin/buffer mixture (30 µL) was taken out and added into 0.4 mL of pre-cooled reaction/wash buffer in a clean 1.5-mL Eppendorf tube to quench the reaction. The resin was centrifuged and the supernatant containing unreacted labeling reagents was removed. The resin was washed once with 0.4 mL of wash buffer (30 minutes) to remove the remaining labeling reagent. The labeled rhodopsin was eluted with the elution buffer containing the C9 peptide (15 µL elution buffer × 2). The time-series samples were separated by SDS-PAGE gel (10 µL eluate for each time point) and analyzed with dual-color quantitative western blot using 1D4 mAb as primary antibody, IRDye800CW goat anti-mouse secondary antibody (Li-Cor), and IRDye680RD Streptavidin (Li-Cor) for biotin detection. The degree of labeling was measured as the ratio of the biotinylation signal to 1D4 signal (protein loading). The extent of labeling reaction (ξ) was calculated as the ratio of biotinylation signal (700-nm channel) to 1D4 signal (800-nm channel) (i.e., ξ= I700/I800). Because the blots from two membranes are subject to random variations for each chemistry, the uaa-tagged Rho and wt Rho time-series samples were further analyzed on the same SDS-PAGE gel for comparison. The ξ was plotted as a function of the reaction time, and fitted using the first-order exponential model to obtain the pseudo first-order rate constant k1. The reaction rate constant k2 was calculated as k1/c(labeling reagent).
Kinetic study of SpAAC using Alexa488-DIBO
The reaction was performed under the same condition as described above. The initial concentration of the labeling reagents (10 µm) was approximately 20-fold excess molarity. At different time points, an aliquot of the resin/buffer mixture (30 µL) was taken out and added into a clean 1.5-mL Eppendorf tube. The reaction was quenched by adding the wash buffer (0.4 mL; 0.1% DM (w/v) DPBS, pH 7.2) and centrifugation. Washing and elution were done as described in the previous section. The labeled rhodopsin was first separated by SDS-PAGE electrophoresis, and then visualized by in-gel fluorescence. Silver staining (see Supplementary Information) was performed for the same gel in order to normalize the sample concentration.
Functional characterization of labeled rhodopsin by steady-state fluorescence
Fluorescence spectroscopy was performed at 28°C on a SPEX Fluorologspectrofluorometer in photon counting mode. The time course experiments were done by adding Alexa488-labeled receptor elutions (30 µL) at a final concentration of 15–50 nm to the assay buffer (450 µL; 10 mg/ml POPC, 10 mg/ml CHAPS, 125 mmKCl, 25 mm MES, 25 mm HEPES, 12.5 mm KOH, pH 6.0) under constant stirring. During time scan experiments the excitation wavelength was 480 nm with 0.2-nm band-pass to minimize photobleaching, and the emission was measured at a wavelength of 525 nm with 15-nm band-pass. The 11-cis-retinal stock solution in ethanol was diluted in the assay buffer, and 20 mL of this working dilution was added to the cuvette to a final concentration of 1.5 µm (1.48–1.59 µm) retinal.
Supplementary Material
Scheme 1.
ACKNOWLEDGMENT
We acknowledge the generous support from the Crowley Family Fund, the Danica Foundation, the Marie Krogh Institute of the NovoNordisk Foundation, and the NIH R01 EY012049 (T.P.S. and T.H.), as well as the Tri-Institutional Training Program in Chemical Biology for supporting H.T.
ABBREVIATIONS
- AcF
p-acetyl-l-phenylalanine
- azF
p-azido-l-phenylalanine
- BzF
p-benzoyl-l-phenylalanine
- CHAPS
3-[(3-cholamidopropyl)-dimethylammonio]-1-propanesulfonate
- CNBr
cyanogen bromide
- CuAAC
copper (I)-catalyzed [3+2] azide–alkyne cycloaddition
- DIBO
dibenzocyclooctyne
- DM
n-dodecyl-β-d-maltoside
- GPCR
G protein-coupled receptor
- IgG
immunoglobulin G
- POPC
1-palmitoyl-2-oleoyl-sn-glycero-3-phosphocholine
- Rho
rhodopsin
- SpAAC
strain-promoted [3+2] azide–alkyne cycloaddition
- Tyr-RS
Tyr-tRNA synthetase
- uaa
unnatural amino acid
- wt
wild-type
Footnotes
SUPPORTING INFORMATION AVAILABLE
Contributor Information
Thomas P. Sakmar, Email: sakmar@rockefeller.edu.
Thomas Huber, Email: hubert@rockefeller.edu.
REFERENCES
- 1.a) Huber T, Menon S, Sakmar TP. Biochemistry. 2008;47:11013–11023. doi: 10.1021/bi800891r. [DOI] [PubMed] [Google Scholar]; b) Menon ST, Han M, Sakmar TP. Physiol. Rev. 2001;81:1659–1688. doi: 10.1152/physrev.2001.81.4.1659. [DOI] [PubMed] [Google Scholar]
- 2.Ye S, Zaitseva E, Caltabiano G, Schertler GFX, Sakmar TP, Deupi X, Vogel R. Nature. 2010;464:1386–1389. doi: 10.1038/nature08948. [DOI] [PubMed] [Google Scholar]
- 3.a) Kobilka B, Schertler GFX. Trends Pharmacol. Sci. 2008;29:79–83. doi: 10.1016/j.tips.2007.11.009. [DOI] [PubMed] [Google Scholar]; b) Hollenstein K, de Graaf C, Bortolato A, Wang MW, Marshall FH, Stevens RC. Trends Pharmacol. Sci. 2014;35:12–22. doi: 10.1016/j.tips.2013.11.001. [DOI] [PMC free article] [PubMed] [Google Scholar]
- 4.Gether U, Lin S, Ghanouni P, Ballesteros JA, Weinstein H, Kobilka BK. EMBO J. 1997;16:6737–6747. doi: 10.1093/emboj/16.22.6737. [DOI] [PMC free article] [PubMed] [Google Scholar]
- 5.Vilardaga J-P, Bunemann M, Feinstein TN, Lambert N, Nikolaev VO, Engelhardt S, Lohse MJ, Hoffmann C. Mol. Endocrinol. 2009;23:590–599. doi: 10.1210/me.2008-0204. [DOI] [PMC free article] [PubMed] [Google Scholar]
- 6.Hubbell WL, Altenbach C, Hubbell CM, Khorana HG. Adv. Prot. Chem. 2003;63:243–290. doi: 10.1016/s0065-3233(03)63010-x. [DOI] [PubMed] [Google Scholar]
- 7.Ghanouni P, Steenhuis JJ, Farrens DL, Kobilka BK. Proc. Natl. Acad. Sci. USA. 2001;98:5997–6002. doi: 10.1073/pnas.101126198. [DOI] [PMC free article] [PubMed] [Google Scholar]
- 8.Karnik SS, Sakmar TP, Chen HB, Khorana HG. Proc. Natl. Acad. Sci. USA. 1988;85:8459–8463. doi: 10.1073/pnas.85.22.8459. [DOI] [PMC free article] [PubMed] [Google Scholar]
- 9.Davis L, Chin JW. Nat. Rev. Mol. Cell. Biol. 2012;13:168–182. doi: 10.1038/nrm3286. [DOI] [PubMed] [Google Scholar]
- 10.Sakamoto K, Hayashi A, Sakamoto A, Kiga D, Nakayama H, Soma A, Kobayashi T, Kitabatake M, Takio K, Saito K, Shirouzu M, Hirao I, Yokoyama S. Nucleic Acids Res. 2002;30:4692–4699. doi: 10.1093/nar/gkf589. [DOI] [PMC free article] [PubMed] [Google Scholar]
- 11.Chin JW, Cropp TA, Anderson JC, Mukherji M, Zhang Z, Schultz PG. Science. 2003;301:964–967. doi: 10.1126/science.1084772. [DOI] [PubMed] [Google Scholar]
- 12.Ye S, Köhrer C, Huber T, Kazmi M, Sachdev P, Yan ECY, Bhagat A, RajBhandary UL, Sakmar TP. J. Biol. Chem. 2008;283:1525–1533. doi: 10.1074/jbc.M707355200. [DOI] [PubMed] [Google Scholar]
- 13.a) Ye S, Huber T, Vogel R, Sakmar TP. Nat. Chem. Biol. 2009;5:397–399. doi: 10.1038/nchembio.167. [DOI] [PMC free article] [PubMed] [Google Scholar]; b) Grunbeck A, Huber T, Sachdev P, Sakmar TP. Biochemistry. 2011;50:3411–3413. doi: 10.1021/bi200214r. [DOI] [PMC free article] [PubMed] [Google Scholar]; c) Naganathan S, Ye S, Sakmar TP, Huber T. Biochemistry. 2013;52:1028–1036. doi: 10.1021/bi301292h. [DOI] [PubMed] [Google Scholar]; d) Ray-Saha S, Huber T, Sakmar TP. Biochemistry. 2014;53:1302–1310. doi: 10.1021/bi401289p. [DOI] [PMC free article] [PubMed] [Google Scholar]
- 14.Grunbeck A, Huber T, Abrol R, Trzaskowski B, Goddard WA, Sakmar TP. ACS Chem. Biol. 2012;7:967–972. doi: 10.1021/cb300059z. [DOI] [PubMed] [Google Scholar]
- 15.a) Ridge KD, Lu Z, Liu X, Khorana HG. Biochemistry. 1995;34:3261–3267. doi: 10.1021/bi00010a016. [DOI] [PubMed] [Google Scholar]; b) Reeves PJ, Hwa J, Khorana HG. Proc. Natl. Acad. Sci. USA. 1999;96:1927–1931. doi: 10.1073/pnas.96.5.1927. [DOI] [PMC free article] [PubMed] [Google Scholar]
- 16.a) Ning X, Guo J, Wolfert MA, Boons GJ. Angew. Chem. Int. Ed. 2008;47:2253–2255. doi: 10.1002/anie.200705456. [DOI] [PMC free article] [PubMed] [Google Scholar]; b) Gordon CG, Mackey JL, Jewett JC, Sletten EM, Houk KN, Bertozzi CR. J. Am. Chem. Soc. 2012;134:9199–9208. doi: 10.1021/ja3000936. [DOI] [PMC free article] [PubMed] [Google Scholar]
- 17.a) Wu CW, Stryer L. Proc. Natl. Acad. Sci. USA. 1972;69:1104–1108. doi: 10.1073/pnas.69.5.1104. [DOI] [PMC free article] [PubMed] [Google Scholar]; b) Farrens DL, Khorana HG. J. Biol. Chem. 1995;270:5073–5076. doi: 10.1074/jbc.270.10.5073. [DOI] [PubMed] [Google Scholar]; c) Alexiev U, Farrens DL. Biochim. Biophys. Acta. 2014;1837:694–709. doi: 10.1016/j.bbabio.2013.10.008. [DOI] [PMC free article] [PubMed] [Google Scholar]
- 18.Henselman RA, Cusanovich MA. Biochemistry. 1976;15:5321–5325. doi: 10.1021/bi00669a019. [DOI] [PubMed] [Google Scholar]
- 19.a) Cornish VW, Hahn KM, Schultz PG. J. Am. Chem. Soc. 1996;118:8150–8151. [Google Scholar]; b) Hang HC, Bertozzi CR. Acc. Chem. Res. 2001;34:727–736. doi: 10.1021/ar9901570. [DOI] [PubMed] [Google Scholar]
- 20.a) Bayer EA, Ben-Hur H, Wilchek M. Anal. Biochem. 1988;170:271–281. doi: 10.1016/0003-2697(88)90631-8. [DOI] [PubMed] [Google Scholar]; b) Wang L, Zhang Z, Brock A, Schultz PG. Proc. Natl. Acad. Sci. USA. 2003;100:56–61. doi: 10.1073/pnas.0234824100. [DOI] [PMC free article] [PubMed] [Google Scholar]
- 21.Shi X, Jung Y, Lin L-J, Liu C, Wu C, Cann IKO, Ha T. Nat. Methods. 2012;9:499–503. doi: 10.1038/nmeth.1954. [DOI] [PMC free article] [PubMed] [Google Scholar]
- 22.Fleissner MR, Brustad EM, Kalai T, Altenbach C, Cascio D, Peters FB, Hideg K, Peuker S, Schultz PG, Hubbell WL. Proc. Natl. Acad. Sci. USA. 2009;106:21637–21642. doi: 10.1073/pnas.0912009106. [DOI] [PMC free article] [PubMed] [Google Scholar]
- 23.Huber T, Naganathan S, Tian H, Ye S, Sakmar TP. Methods Enzymol. 2013;520:281–305. doi: 10.1016/B978-0-12-391861-1.00013-7. [DOI] [PubMed] [Google Scholar]
- 24.a) Ahn B, Rhee SG, Stadtman ER. Anal. Biochem. 1987;161:245–257. doi: 10.1016/0003-2697(87)90448-9. [DOI] [PubMed] [Google Scholar]; b) Stadtman ER, Levine RL. Amino Acids. 2003;25:207–218. doi: 10.1007/s00726-003-0011-2. [DOI] [PubMed] [Google Scholar]
- 25.Stadtman ER. Annu. Rev. Biochem. 1993;62:797–821. doi: 10.1146/annurev.bi.62.070193.004053. [DOI] [PubMed] [Google Scholar]
- 26.Grimsrud PA, Xie H, Griffin TJ, Bernlohr DA. J. Biol. Chem. 2008;283:21837–21841. doi: 10.1074/jbc.R700019200. [DOI] [PMC free article] [PubMed] [Google Scholar]
- 27.a) Zhang Z, Smith BAC, Wang L, Brock A, Cho C, Schultz PG. Biochemistry. 2003;42:6735–6746. doi: 10.1021/bi0300231. [DOI] [PubMed] [Google Scholar]; b) Chen I, Howarth M, Lin W, Ting AY. Nat. Methods. 2005;2:99–9104. doi: 10.1038/nmeth735. [DOI] [PubMed] [Google Scholar]
- 28.Zeng Y, Ramya TNC, Dirksen A, Dawson PE, Paulson JC. Nat. Methods. 2009;6:207–209. doi: 10.1038/nmeth.1305. [DOI] [PMC free article] [PubMed] [Google Scholar]
- 29.a) Kiick KL, Saxon E, Tirrell DA, Bertozzi CR. Proc. Natl. Acad. Sci. USA. 2002;99:19–24. doi: 10.1073/pnas.012583299. [DOI] [PMC free article] [PubMed] [Google Scholar]; b) Saxon E, Bertozzi CR. Science. 2000;287:2007–2010. doi: 10.1126/science.287.5460.2007. [DOI] [PubMed] [Google Scholar]
- 30.van Berkel SS, Dirks ATJ, Debets MF, van Delft FL, Cornelissen JJLM, Nolte RJM, Rutjes FPJT. ChemBioChem. 2007;8:1504–1508. doi: 10.1002/cbic.200700278. [DOI] [PubMed] [Google Scholar]
- 31.a) Agard NJ, Prescher JA, Bertozzi CR. J. Am. Chem. Soc. 2004;126:15046–15047. doi: 10.1021/ja044996f. [DOI] [PubMed] [Google Scholar]; b) Debets MF, van Berkel SS, Dommerholt J, Dirks ATJ, Rutjes FPJT, van Delft FL. Acc. Chem. Res. 2011;44:805–815. doi: 10.1021/ar200059z. [DOI] [PubMed] [Google Scholar]; c) Sletten EM, Bertozzi CR. Acc. Chem. Res. 2011;44:666–676. doi: 10.1021/ar200148z. [DOI] [PMC free article] [PubMed] [Google Scholar]
- 32.a) Tsao M-L, Tian F, Schultz PG. ChemBioChem. 2005;6:2147–2149. doi: 10.1002/cbic.200500314. [DOI] [PubMed] [Google Scholar]; b) Debets MF, van der Doelen CWJ, Rutjes FPJT, van Delft FL. ChemBioChem. 2010;11:1168–1184. doi: 10.1002/cbic.201000064. [DOI] [PubMed] [Google Scholar]; c) Schilling CI, Jung N, Biskup M, Schepers U, Brase S. Chem. Soc. Rev. 2011;40:4840–4871. doi: 10.1039/c0cs00123f. [DOI] [PubMed] [Google Scholar]
- 33.Yanagisawa T, Ishii R, Fukunaga R, Kobayashi T, Sakamoto K, Yokoyama S. Chem. Biol. 2008;15:1187–1197. doi: 10.1016/j.chembiol.2008.10.004. [DOI] [PubMed] [Google Scholar]
- 34.Blomquist AT, Liu LH. J. Am. Chem. Soc. 1953;75:2153–2154. [Google Scholar]
- 35.Wittig G, Krebs A. Chem. Ber. 1961;94:3260–3275. [Google Scholar]
- 36.Brustad EM, Lemke EA, Schultz PG, Deniz AA. J. Am. Chem. Soc. 2008;130:17664–17665. doi: 10.1021/ja807430h. [DOI] [PMC free article] [PubMed] [Google Scholar]
- 37.Seitz G, Pohl L, Pohlke R. Angew. Chem. Int. Ed. 1969;8:447. -&. [Google Scholar]
- 38.Jewett JC, Sletten EM, Bertozzi CR. J. Am. Chem. Soc. 2010;132:3688–3690. doi: 10.1021/ja100014q. [DOI] [PMC free article] [PubMed] [Google Scholar]
- 39.van Geel R, Pruijn GJM, van Delft FL, Boelens WC. Bioconjugate Chem. 2012;23:392–398. doi: 10.1021/bc200365k. [DOI] [PubMed] [Google Scholar]
- 40.Reddington SC, Tippmann EM, Jones DD. Chem. Commun. 2012;48:8419–8421. doi: 10.1039/c2cc31887c. [DOI] [PubMed] [Google Scholar]
- 41.Borrmann A, Milles S, Plass T, Dommerholt J, Verkade JM, Wiessler M, Schultz C, van Hest JC, van Delft FL, Lemke EA. ChemBioChem. 2012;13:2094–2099. doi: 10.1002/cbic.201200407. [DOI] [PubMed] [Google Scholar]
- 42.a) Fairbanks BD, Sims EA, Anseth KS, Bowman CN. Macromolecules. 2010;43:4113–4119. [Google Scholar]; b) Hoogenboom R. Angew. Chem. Int. Ed. 2010;49:3415–3417. doi: 10.1002/anie.201000401. [DOI] [PubMed] [Google Scholar]
- 43.Mielke T, Alexiev U, Glasel M, Otto H, Heyn MP. Biochemistry. 2002;41:7875–7884. doi: 10.1021/bi011862v. [DOI] [PubMed] [Google Scholar]
- 44.a) Resek JF, Farahbakhsh ZT, Hubbell WL, Khorana HG. Biochemistry. 1993;32:12025–12032. doi: 10.1021/bi00096a012. [DOI] [PubMed] [Google Scholar]; b) Blaskovic S, Blanc M, van der Goot FG. FEBS J. 2013;280:2766–2774. doi: 10.1111/febs.12263. [DOI] [PubMed] [Google Scholar]
- 45.a) Oprian DD, Molday RS, Kaufman RJ, Khorana HG. Proc. Natl. Acad. Sci. USA. 1987;84:8874–8878. doi: 10.1073/pnas.84.24.8874. [DOI] [PMC free article] [PubMed] [Google Scholar]; b) Sarramegna V, Talmont F, Demange P, Milon A. Cell. Mol. Life Sci. 2003;60:1529–1546. doi: 10.1007/s00018-003-3168-7. [DOI] [PMC free article] [PubMed] [Google Scholar]
- 46.Almen MS, Nordström KJ, Fredriksson R, Schioth HB. BMC Biol. 2009;7:50. doi: 10.1186/1741-7007-7-50. [DOI] [PMC free article] [PubMed] [Google Scholar]
- 47.Bosmann HB, Hagopian A, Eylar EH. Arch. Biochem. Biophys. 1968;128:51–69. doi: 10.1016/0003-9861(68)90008-8. [DOI] [PubMed] [Google Scholar]
- 48.Milo R. Bioessays. 2013;35:1050–1055. doi: 10.1002/bies.201300066. [DOI] [PMC free article] [PubMed] [Google Scholar]
- 49.Okayasu T, Ikeda M, Akimoto K, Sorimachi K. Amino Acids. 1997;13:379–391. [Google Scholar]
- 50.a) Hern JA, Baig AH, Mashanov GI, Birdsall B, Corrie JE, Lazareno S, Molloy JE, Birdsall NJ. Proc. Natl. Acad. Sci. USA. 2010;107:2693–2698. doi: 10.1073/pnas.0907915107. [DOI] [PMC free article] [PubMed] [Google Scholar]; b) Calebiro D, Rieken F, Wagner J, Sungkaworn T, Zabel U, Borzi A, Cocucci E, Zurn A, Lohse MJ. Proc. Natl. Acad. Sci. USA. 2013;110:743–748. doi: 10.1073/pnas.1205798110. [DOI] [PMC free article] [PubMed] [Google Scholar]
- 51.Sommerhage F, Helpenstein R, Rauf A, Wrobel G, Offenhäusser A, Ingebrandt S. Biomaterials. 2008;29:3927–3935. doi: 10.1016/j.biomaterials.2008.06.020. [DOI] [PubMed] [Google Scholar]
- 52.Beatty KE, Szychowski J, Fisk JD, Tirrell DA. ChemBioChem. 2011;12:2137–2139. doi: 10.1002/cbic.201100277. [DOI] [PMC free article] [PubMed] [Google Scholar]
- 53.Beatty KE, Fisk JD, Smart BP, Lu YY, Szychowski J, Hangauer MJ, Baskin JM, Bertozzi CR, Tirrell DA. ChemBioChem. 2010;11:2092–2095. doi: 10.1002/cbic.201000419. [DOI] [PMC free article] [PubMed] [Google Scholar]
- 54.a) Schadel SA, Heck M, Maretzki D, Filipek S, Teller DC, Palczewski K, Hofmann KP. J. Biol. Chem. 2003;278:24896–24903. doi: 10.1074/jbc.M302115200. [DOI] [PMC free article] [PubMed] [Google Scholar]; b) Sanchez-Martin MJ, Ramon E, Torrent-Burgues J, Garriga P. ChemBioChem. 2013;14:639–644. doi: 10.1002/cbic.201200687. [DOI] [PubMed] [Google Scholar]
- 55.Rattner A, Sun H, Nathans J. Annu. Rev. Genet. 1999;33:89–131. doi: 10.1146/annurev.genet.33.1.89. [DOI] [PubMed] [Google Scholar]
- 56.Middleton RJ, Kellam B. Curr. Opin. Chem. Biol. 2005;9:517–525. doi: 10.1016/j.cbpa.2005.08.016. [DOI] [PubMed] [Google Scholar]
- 57.a) Dunham TD, Farrens DL. J. Biol. Chem. 1999;274:1683–1690. doi: 10.1074/jbc.274.3.1683. [DOI] [PubMed] [Google Scholar]; b) Yao X, Parnot C, Deupi X, Ratnala VR, Swaminath G, Farrens D, Kobilka B. Nat. Chem. Biol. 2006;2:417–422. doi: 10.1038/nchembio801. [DOI] [PubMed] [Google Scholar]
- 58.Janz JM, Farrens DL. J. Biol. Chem. 2004;279:55886–55894. doi: 10.1074/jbc.M408766200. [DOI] [PubMed] [Google Scholar]
- 59.a) Bockenhauer S, Furstenberg A, Yao XJ, Kobilka BK, Moerner WE. J. Phys. Chem. B. 2011;115:13328–13338. doi: 10.1021/jp204843r. [DOI] [PMC free article] [PubMed] [Google Scholar]; b) Huber T, Sakmar TP. Trends Pharmacol. Sci. 2011;32:410–419. doi: 10.1016/j.tips.2011.03.004. [DOI] [PMC free article] [PubMed] [Google Scholar]
- 60.Franke RR, Sakmar TP, Oprian DD, Khorana HG. J. Biol. Chem. 1988;263:2119–2122. [PubMed] [Google Scholar]
- 61.Knepp AM, Grunbeck A, Banerjee S, Sakmar TP, Huber T. Biochemistry. 2011;50:502–511. doi: 10.1021/bi101059w. [DOI] [PMC free article] [PubMed] [Google Scholar]
Associated Data
This section collects any data citations, data availability statements, or supplementary materials included in this article.