

Abstract
Lyme borreliosis is rapidly emerging in Canada, and climate change is likely a key driver of the northern spread of the disease in North America. We used field and modeling approaches to predict the risk of occurrence of Borrelia burgdorferi, the bacteria causing Lyme disease in North America. We combined climatic and landscape variables to model the current and future (2050) potential distribution of the black-legged tick and the white-footed mouse at the northeastern range limit of Lyme disease and estimated a risk index for B. burgdorferi from these distributions. The risk index was mostly constrained by the distribution of the white-footed mouse, driven by winter climatic conditions. The next factor contributing to the risk index was the distribution of the black-legged tick, estimated from the temperature. Landscape variables such as forest habitat and connectivity contributed little to the risk index. We predict a further northern expansion of B. burgdorferi of approximately 250–500 km by 2050 – a rate of 3.5–11 km per year – and identify areas of rapid rise in the risk of occurrence of B. burgdorferi. Our results will improve understanding of the spread of Lyme disease and inform management strategies at the most northern limit of its distribution.
Keywords: climate change, emergence, habitat fragmentation, Lyme disease, range shift, white-footed mouse
Introduction
Climate change is thought to be driving geographic range shifts in many terrestrial species (Walther et al. 2002; Parmesan and Yohe 2003; Chen et al. 2011). In northern temperate regions especially, increasing temperatures are allowing species to expand their distribution poleward. Climate warming may thereby increase the opportunity for invasive species to establish and vector-borne diseases to emerge in new areas (Harvell et al. 2002; Wilcox and Gubler 2005; Jones et al. 2008). As global temperature increases, reservoir hosts and vector species may spread their habitats into more northern or southern latitudes and/or higher elevations (Zell 2004). Because the transmission of many parasites and pathogens depends on free-living wild animal reservoir hosts, a number of vector-borne infectious diseases have recently expanded their geographic range, tracking the range expansion of their hosts whose distribution is tied to climate (Ogden et al. 2006; Gage et al. 2008; Mills et al. 2010; Altizer et al. 2013).
Lyme borreliosis is a vector-borne disease caused by the spirochete Borrelia burgdorferi sensu lato and is an emerging disease in North America (Ogden et al. 2009; Ostfeld 2011). The main vector for Lyme disease in eastern and central North America is the black-legged tick Ixodes scapularis (Barbour and Fish 1993; Ostfeld 2011). The black-legged tick has a life cycle with three feeding stages. Small mammals and birds are hosts for the juvenile life stages of the tick (i.e., larvae and nymphs) and act as reservoir for the pathogen. The white-footed mouse (Peromyscus leucopus), a widespread rodent native of eastern North America (Desrosiers et al. 2002), is often the most common host for I. scapularis juvenile stages in woodlands of northeastern North America (Jones et al. 1998; Bouchard et al. 2011). The white-footed mouse is a highly efficient reservoir host for B. burgdorferi, being highly susceptible to infections (Shaw et al. 2003; Eisen et al. 2012) that are persistent (often lifelong) and transmissible with high efficiency to uninfected larval ticks (with up to 90% of larvae acquiring infection) that subsequently feed on the infected mouse (Donahue et al. 1987; Ostfeld 2011).
Both the white-footed mouse and the black-legged tick are essential components of the transmission cycle of B. burgdorferi. Historical records (Roy-Dufresne et al. 2013) and molecular evidence (unpublished data) show that the white-footed mouse is currently expanding its range poleward, presumably in response to milder winters (Myers et al. 2009; Roy-Dufresne et al. 2013). The black-legged tick is also expanding its geographic range northward, tracking climate warming over the last few decades (Ogden et al. 2006; Leighton et al. 2012).
As exemplified by the ongoing and concurrent shifts of the white-footed mouse and black-legged tick in Southern Québec, environmental change is considered as the main driver of the shifts in the distribution of vectors and hosts, and hence of disease emergence (Gould and Higgs 2009). Climate and the local habitat change could interact and affect the dispersal and movement of the species involved in the transmission cycle of Lyme disease in a complex manner. For example, a warmer climate with milder winters and earlier spring snowmelt may shift the phenology of the white-footed mouse breeding activity and dispersal, with higher activity and movement earlier in the season. Increased activity in turn alters the rate of encounter between this host and its pathogens, affecting the dynamics of transmission cycle of B. burgdorferi (Ogden et al. 2007, 2008a). On the other hand, fragmentation of host habitat may reduce host population size, limit host dispersal, and alter host densities and diversity (Daszac et al. 2001; Li et al. 2012), reducing encounter rate between hosts and pathogens and the transmission rate of the pathogen. Conversely, the spread of the pathogen may occur faster if range expansion occurs in host species such as the white-footed mouse that thrives in fragmented landscapes (Allan et al. 2003; Chen et al. 2011).
Disease occurrence is thus constrained by a number of interacting environmental factors. In addition, the different species involved in a multispecies host–pathogen system may not respond similarly to changes in the environment (Slenning 2010). Different species are expected to shift their ranges at different rates (Chen et al. 2011), depending on their physiological tolerance, life-history traits or dispersal ability (Altizer et al. 2013). Vector-borne disease occurs in environments where the geographic range of competent vectors and wildlife reservoir hosts overlap, and understanding the factors that constrain this region of overlap is thus key to predicting the effect of global changes on vector-borne diseases. Risk maps of population establishment for the black-legged tick in Canada have been published (Ogden et al. 2008b). These have been used as a proxy for Lyme disease risk because both I. scapularis and B. burgdorferi are host generalists. However, these models did not account for the shift in the distribution of the white-footed mouse in Eastern Canada. Yet, changes in P. leucopus host distribution and abundance could be key for determining the level of risk from B. burgdorferi because these mice are such efficient reservoir hosts.
Here, we use an integrated approach and combine climate niche modeling with landscape models to estimate the relative contributions of climate and habitat change on the distribution of two key components in the Lyme disease system in northeastern America, the white-footed mouse and the black-legged tick. Concurrent with recent and rapid climate warming, we expect a higher prevalence of B. burgdorferi in hosts and ticks in more disturbed, fragmented landscapes, which favors the white-footed mouse over other forest small mammals (Allan et al. 2003; Killilea et al. 2008). We predict that climate is limiting the most northern limit of expansion of B. burgdorferi, but that this expansion is locally modulated by landscape fragmentation. To test this hypothesis, we apply our model to predict the current and future distribution of B. burgdorferi. By combining both empirical data from multiple species and field sites, as well as modeling approaches, we aimed to better predict patterns of emergence and spread of Lyme disease at the most northern limit of its distribution in Southern Québec, to better inform management strategies in a zone of emergence of the disease.
Materials and methods
We first used field data to identify the parameters related to the black-legged tick, the white-footed mouse and small mammals that best explained the observed pattern of B. burgdorferi occurrence at our study sites. We then modeled the relation between landscape variables and those variables for the white-footed mouse and the black-legged tick. Our landscape models were then combined with climate niche models for these species to estimate the risk of occurrence of B. burgdorferi over our study area. Finally, we extrapolated the risk index at a larger provincial scale, for today and the future (2050).
Study sites
We surveyed a total of 34 sites in southern Québec from May to October 2011 (Fig. 1). The Système d’information écoforestière (SIEF) was used as a spatial representation of the study area (MRNF 2004). The study area covers 26 682 km2 and is characterized mostly by woodlands (41.28%), agricultural fields (39.94%) and urban areas (9.79%). The study sites were located in forest fragments of different size and degree of isolation within a matrix dominated by agricultural fields (Fig. 1). The study area included the most northern known distribution limit of the white-footed mouse and the black-legged tick in eastern Canada.
Figure 1.
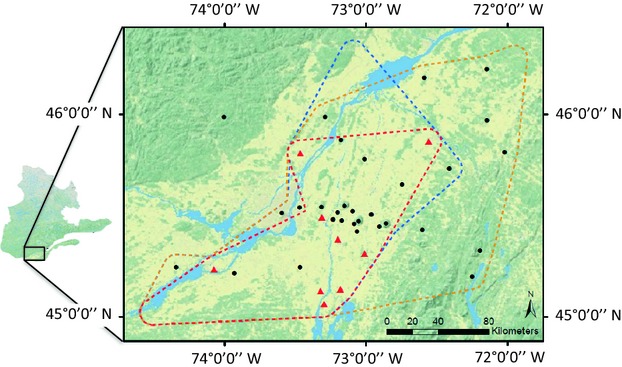
Study area and sampling site in Southern Québec, Canada, between 45.00–46.25°N and 72.00–74.50°W. The study extent is covered by 41.3% woodlands, 39.9% agriculture fields and 9.8% urban areas. Symbols for field sites: black circles = Borrelia burgdorferi absent, red triangle = B. burgdorferi present. The distribution limits of Ixodes scapularis (orange dotted line), Peromyscus leucopus (blue dotted line) and B. burgdorferi (red dotted line) were drawn using the ArcGIS toolbox with a buffer of 5 km around the study site where each was detected.
Small mammal and tick sampling
Small mammals were trapped from June to early September. At each site, four grids of 28 Sherman™ live traps were placed for one night in four parallels transects of seven traps each separated by 10 m (thus forming 60 × 30 m grids). Trapping occurred for another two consecutive nights if no Peromyscus spp. mice were captured on the first night. All captured individuals were assigned to a species using a molecular method to differentiate Peromyscus species (Rogic et al. 2013).
Questing (host-seeking) ticks were collected from the vegetation using a standard drag sampling method (Falco and Fish 1992; Ostfeld et al. 1995). Each site was visited for drag sampling three times (spring, summer and fall); this frequency follows the recommendation of the Public Health Agency of Canada for the surveillance of tick populations in the country. This sampling accounts for the seasonality of adult, nymphal and larval ticks, which occurs at different seasons.
In the spring (May–June) and fall (September–October) visits, the sampling occurred over an area of 105 × 500 m. We established a set of four parallel transects of 500 m and 25–35 m apart. Ticks were collected from the drag every 25 m. During the summer (July–August), questing ticks were sampled by dragging over the small mammals trapping grids. Feeding ticks were collected directly from small mammals examined under the microscope. All ticks sampled were assigned to a species on examination in the laboratory using standard keys (Keirans et al. 1996) and to one of the three life stages (i.e., larval, nymph, or adult).
Detection of Borrelia burgdorferi
All mammals, questing ticks, and feeding ticks collected were tested for the presence of B. burgdorferi following a method described in Ogden et al. (2011). Briefly, DNA was extracted from ticks and mammal tissues (heart) and screened for B. burgdorferi with a multiplex real-time polymerase chain reaction (PCR) targeting the 23s rRNA of B. burgdorferi. We screened the heart of small mammals as it has been shown to be a reliable tissue to target for the detection of systemic infection of individuals (Barthold et al. 1993; Baum et al. 2012). Borrelia burgdorferi infection was confirmed in positive samples using a B. burgdorferi specific primer targeting the ospA gene (Ogden et al. 2011). All PCR assays were performed at the National Microbiology Laboratory of the Public Health Agency (Winnipeg, MB, Canada).
Modeling the relations between small mammals, ticks and Borrelia burgdorferi distribution patterns
We used our field data to investigate the relationships between the presence of B. burgdorferi at a site and a number of variables related to ticks and small mammals, specifically the white-footed mouse P. leucopus. For ticks, we considered the number of questing ticks (all life stage included), the number of feeding larvae, and the total number of ticks (i.e., both questing and feeding on small mammals, all life stages included). We then calculated the prevalence of small mammals infested with ticks (the number of individual small mammal carrying ticks per total number of individual small mammal captured at a site), as well as the mean tick infestation of small mammals at a site (the mean number of ticks feeding per small mammal individual captured). Values for infestation prevalence and infestation levels were estimated for P. leucopus alone, and for all other small mammals collectively. We also considered the density of small mammals, the density of P. leucopus, small mammal diversity (estimated with the Shannon index), species richness (the total number of small mammal species at a site), and the proportion of P. leucopus in the community relative to other small mammal species. As trapping effort varied across site due to unequal number of trap nights, we estimated small mammal and P. leucopus densities as the mean number of individuals captured per night per square km. Although likely a biased estimate of the actual density of small mammals at our trapping sites, this estimate was corrected for trapping effort in order to be comparable across sites. We also corrected the number of feeding ticks by the number of trapping night at each site by dividing the number of ticks by the number of trapping nights.
Some of the variables were correlated with each other, and thus, we performed a hierarchical partitioning analysis using the hier.part package In R (Walsh and MacNally 2013) to estimate their contribution to the total variance, both independently and jointly (MacNally 2000, 2002). We used a logistic regression model with all our field data as explanatory variables, and the presence of B. burgdorferi at a site as the dependent variable. We evaluated the significance level of the independent contribution of each variable to the variance in the model with a randomization test (1000 permutations), using the rand.hp function in the hier.part package in R.
Predicting the distribution of the black-legged tick and the white-footed mouse from the climate
Black-legged tick
Temperature has been described as a good predictor of the abundance of the black-legged tick I. scapularis at the northern limit of its geographic range in Canada (Ogden et al. 2005, 2006, 2008b). We used the linear relation between the maximum number of adult female ticks, an index of tick abundance, and the annual cumulative degree-day (DD) > 0°C (NumberT = 0.436 × DD > 0–1232; Ogden et al. 2005) to estimate the abundance of ticks over our study area. DD > 0 data were averaged over 1961–2005 and were derived from the ANUSPLIN dataset version 4.3 (The Australian National University, Canberra, Australia) based on Environment Canada’s historical monthly ~10 × 10 km gridded weather data covering the entire territory of Québec (McKenney et al. 2006). Tick abundance was considered null when DD was lower than 2800 (Ogden et al. 2005). This model was validated by testing the fit between the predicted abundance from the model and the total tick abundance measured at our study sites, using a Spearman’s rank correlation coefficient. We used the observed total abundance of ticks of all developmental stages rather than just the number of adult females. This was because these values were correlated but also because adult ticks are the least abundant instar (with high levels of mortality) and are at particularly low density at sites where the ticks have only recently become established (Ogden et al. 2010). The use of adult ticks alone would have resulted in some sites having zero values for ticks, when in fact ticks were present.
White-footed mouse
We used the predictions from a climate niche model for the white-footed mouse based on a combination of climatic variables related to winter conditions (Roy-Dufresne et al. 2013). The white-footed mouse appeared to be primarily limited by the winter length and average maximum temperature in the winter, the probability of occurrence of the mouse decreasing with longer (>125 to 160 days) and colder (maximal temperature <−5°C) winters. We used the occurrence probability from this model projected at a resolution of 10 km2, the same resolution we used to predict tick abundance over our study area. A Spearman’s rank correlation coefficient was then used to test the fit between the predicted presence probability of P. leucopus and density observed at our study sites for this species.
Predicting the distribution of the blacklegged tick and the white-footed mouse from the landscape
We used the Data Management Tool in ArcGis 10.1 (ESRI 2013) to estimate the proportion of woodlands, agricultural fields and urban areas around each of the 34 study sites within a buffer of 5 km, a distance much larger than reported natal dispersal distances of the white-footed mouse (~100 m on average, Keane 1990). The mean landscape resistance—a proxy for the impediments to the migration of individuals between breeding sites—was then estimated around each forest patch, using values from R. R. Marrotte, A. Gonzalez, and V. Millien (unpublished data). A patch was defined in the study area as a forested area surrounded by nonforested areas. The genetic differentiation between 11 populations of the white-footed mouse found in forest patches within our study area was previously estimated in Rogic et al. (2013) using 11 microsatellite loci. We then used these results to estimate resistance values for the three main landcover categories (R. R. Marrotte, A. Gonzalez, and V. Millien unpublished data). Woodlands were assigned a resistance of 0 (no resistance), while the resistance was 0.49 for agricultural fields and 4 for urban areas. Using the same method, we then calculated the mean resistance for all (9043) forest patches in our study area. We extracted the area, perimeter, and minimum distance to the nearest neighbor (MDNN) calculated between the centroids of each forest patch. Lastly, we estimated the connectivity of all 9043 forest patches using the one to all modeling mode and an eight neighbors and average resistance connection scheme in CircuitScape (McRae 2006). We aggregated the SIEF data into five classes (agriculture, forest, orchard, urban, water and other, a class which is an aggregate of the remaining land uses). We then rasterized this spatial data to a resolution of 300 m using the raster package in R (Hijmans & vanEtten 2012) and assigned circuit resistance values from R. R. Marrotte, A. Gonzalez, and V. Millien (unpublished data) to each class. Finally, we used the conductance, or the inverse of the estimated resistance, as an estimate of connectivity.
We performed a principal component analysis (PCA) on landscape variables at our study sites (proportion of forest, agriculture and urban habitat, area, perimeter, MDNN, resistance, and connectivity). The fit between the white-footed mouse density and the total tick abundance measured at a site and the loading of this site on the first three axes of the PCA was evaluated with a Spearman’s rank correlation test. We then used a linear model to predict the white-footed mouse density at a site from the PCA axes with which mouse density was significantly correlated. Similarly, we used a generalized linear model with a negative-binomial distribution to predict tick abundance at a site from the PCA axes with which tick abundance was significantly correlated. Next, we measured our landscape variables within a 5 km buffer for each of the 9043 forest patches in our study area. Using the models described above between mouse density, tick abundance, and the PCA axes, we then estimated the coordinates of these patches on the first two PCA axes from these landscape variables and calculated the predicted density of white-footed mouse and maximum abundance of black-legged tick for each of these patches. Finally, both the mouse density and the tick abundance were extrapolated over the entire study area by calculating the mean value for all forest patches in each pixel of 10 km × 10 km on a grid of 1052 cells.
Predicting the current distribution of Borrelia burgdorferi
We calculated the risk index for B. burgdorferi presence as a linear combination of the four factors described above: (i) the predicted tick abundance from the climate, (ii) the predicted P. leucopus presence probabilities from climatic variables, (iii) the predicted P. leucopus density from the landscape variables, and (iv) the predicted tick abundance from the landscape variables. To do so, we used a hierarchical variance partitioning analysis to assess the variance contribution of each of these four factors (MacNally 2000, 2002). We used the percentage of variance explained by each factor (independent contribution) as a coefficient of importance in the final linear model. At the local scale, we used the four factors to estimate the risk index and the resulting risk index value was rescaled to range from 0 to 1. At the regional scale, only the first two factors were used to estimate the risk index. This risk index provides a relative estimate of the risk that can be used to compare risk among different locations.
Predicting the future distribution of Borrelia burgdorferi
Future climate scenarios for 2050 were created using simulated future climate data from the Canadian Regional Climate Model (CRCM version 4.2.3) (Music and Caya 2007) and an ensemble of global climate simulations from the Coupled Model Intercomparison Project (CMIP3) (Meehl et al. 2007). As in Roy-Dufresne et al. (2013), we used a total of 37 simulations divided among three SRES emissions scenarios (12 A1b, 15 A2, and 10 B1; Nakicenovic et al. 2000).
The projected future distribution and abundance of I. scapularis in Quebec was estimated from the linear model linking DD > 0 and maximum tick abundance published by Ogden et al. (2005). The future distribution of the white-footed mouse was obtained from the projected presence probabilities in Roy-Dufresne et al. (2013). We kept the landscape constant for future projections and estimated the future risk index for the presence of B. burgdorferi in Southern Québec by 2050, based on future scenarios of climate change and associated future distributions of the black-legged tick and white-footed mouse.
Results
Wild small mammals trapping and tick collection
We captured a total of 520 small mammals at the 34 sites representing six different species, and species richness at a site ranged from one to four species (Table S1). Peromyscus leucopus was the most common species (n = 312) and was present at 24 sites with a mean capture rate (i.e., number of captured P. leucopus/total number of captured mammals) of 60%. Other species captured were the deer mouse (Peromyscus maniculatus, n = 60), the red-backed vole (Myodes gapperi, n = 62), the short-tailed shrew (Blarina brevicauda, n = 43), smoky and/or masked shrews (Sorex sp., n = 33) and the woodland jumping mouse (Napaeozapus insignis, n = 10), with capture rates of 11.5%, 11.9%, 8.3%, 6.3%, and 1.9%, respectively.
We collected a total of 1417 ticks of seven species from the vegetation and from small mammals at 31 of our 34 field sites. Ixodes scapularis was the most common species (n = 1130), followed by Dermacentor albipictus (n = 264), Haemaphysalis leporispalustris (n = 12), Ixodes angustus (n = 7), Ixodes marxi (n = 2), Ixodes muris (n = 1), and Ixodes cookei (n = 1). We collected a total of 311 I. scapularis feeding on hosts at 20 sites. A vast majority (n = 724) of I. scapularis were larvae (429 questing and 295 feeding on small mammals), 311 were nymphs (295 questing and 16 feeding) and 95 were adults (all questing). An exceptionally high number of I. scapularis was collected from one site (n = 504), and the number of collected ticks ranged from 1 to 137 in the other 30 sites where ticks where detected.
On average, P. leucopus tended to carry ticks more often than other small mammals (average Prevalence L = 16.67 vs average Prevalence M = 6.34, Wilcoxon rank test, W = −431.5, P < 0.04), but when carrying ticks, P. leucopus did not carry a larger number of ticks than other small mammals (P = 0.14).
Borrelia burgdorferi prevalence
Borrelia burgdorferi was detected at nine of our study sites (Fig. 1, Table S1). Five mammals (four P. leucopus and one P. maniculatus) tested positive for B. burgdorferi. These five mice all carried feeding I. scapularis larvae and only one of those was positive for B. burgdorferi.
Fifty-three of the 390 questing I. scapularis captured in the vegetation and screened for the bacterium (questing larvae were not processed) tested positive for B. burgdorferi, an infection rate of 13.6% (23.2% in adults and 10.2% in nymphs). Of the 311 I. scapularis sampled on small mammals and screened for B. burgdorferi, only two tested positive. These two ticks were larvae feeding on two individuals of P. leucopus.
Small mammals and tick distribution patterns and occurrence of Borrelia burgdorferi
There was no spatial autocorrelation between any of the small mammal, ticks or habitat variables in our dataset (z Moran’s index ranging from −0.03 to 0.94, all P > 0.35, with a buffer of 66.32 km corresponding to the minimal Euclidean threshold distance for which each site had at least one neighbor), and thus, all variables were considered statistically independent.
We performed a hierarchical partitioning analysis considering a total of 12 explanatory tick, mouse and small mammal variables we measured in the field. Three variables contributed most to the model predicting the presence of B. burgdorferi at a site (Table 1): the proportion of P. leucopus carrying ticks (PrevalenceL, independent contribution to the variance I = 20.06%, P < 0.05), the total number of ticks (Total T, I = 14.86%, P < 0.05) and the number of questing ticks (QuestingT, independent contribution to the variance I = 13.30%, P < 0.05). This result is in line with our observation that the presence of B. burgdorferi was most likely at sites where both the white-footed mouse and the blacklegged tick co-occurred (Fig. 1).
Table 1.
Explanatory variables ranked according to their independent effect. I is the percentage of explained variance accounted for by the variable calculated using a hierarchical partitioning analysis performed with the tick, small mammals and Peromyscus leucopus variables as explanatory variables and the probability of occurrence of Borrelia burgdorferi as the response variable.
| Variable | I (%) | Z-score |
|---|---|---|
| Prevalence L | 20.06 | 7.83* |
| Total T | 14.86 | 4.13* |
| Questing T | 13.30 | 3.95* |
| Feeding L | 9.75 | 2.46* |
| Prevalence M | 9.56 | 3.25* |
| Burden L | 6.79 | 1.81* |
| Diversity | 5.61 | 1.30 |
| Burden M | 4.49 | 0.64 |
| Proportion | 4.36 | 0.78 |
| Density M | 4.24 | 0.78 |
| Richness | 3.90 | 0.55 |
| Density L | 3.06 | 0.13 |
Prevalence L: number of individual P. leucopus carrying ticks per total number of individual small mammal captured at a site, Total T: Number of ticks collected at a site both in the vegetation and on small mammals and of all life stages, Questing T: Number of ticks of all life stages collected in the vegetation at a site, Feeding L: Number of larvae collected on small mammals at a site divided by the number of trap nights, Prevalence M: number of individual small mammal carrying ticks per total number of individual small mammal captured at a site, Burden L: mean number of ticks feeding per P. leucopus individual captured at a site, Diversity: small mammal diversity at a site estimated with the Shannon index, Burden M: mean number of ticks feeding per small mammal individual captured at a site, Proportion: proportion of P. leucopus in the community relative to other small mammal species, Density M: mean number of small mammal individuals captured at a site per night per unit area (1 km2), Richness: total number of small mammal species at a site, Density L: mean number of P. leucopus individuals captured at a site per night per unit area (1 km2).
Z-scores were calculated to estimate the significance level of I for each explanatory variable, using 1000 randomizations and significant variables are in bold (*P < 0.05).
Predicted distribution of the blacklegged tick and the white-footed mouse
Climatic models
The maximum annual number of feeding female ticks at equilibrium predicted by the current average DDs > 0°C ranged from 0 to 206 over the study area (Fig. 2A) and in Québec (Figure S1A). Tick abundance gradually decreases from the southwestern to the northeastern part of the region. Higher abundances are observed south of the Saint-Lawrence River and extend from the border with the United States to the south, to the northwestern limit of the Montérégie. The predicted abundance of ticks was the lowest in the Estrie region, and intermediate in the Centre du Québec region (Fig. 2A). These predicted values were correlated with the total tick abundance observed at our sites (ρ = 0.45, P < 0.007). Using this model between DDs > 0°C and tick abundance, the distribution of the tick is expected to shift northward by up to 300 km by 2050 (Figure S1B).
Figure 2.
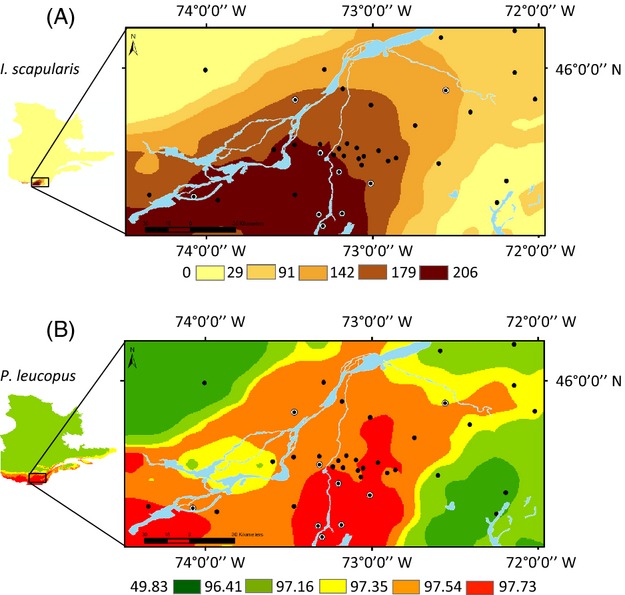
Current predicted distribution of the black-legged tick, that is, the maximum annual number of feeding female ticks at equilibrium (A) and the probability of presence of the white-footed mouse (B) within the study area, based on climatic variables. On both panels, filled black circles are field sites where Borrelia burgdorferi was not detected and black circles with a white outline are field sites where B. burgdorferi was detected.
The predicted probability of presence of the white-footed mouse obtained from the climate distribution model ranged from 49.83% to 97.51% over the study area (Fig. 2B) and rapidly decreased above 45°N (Figure S2A). Two areas appeared to be highly suitable for the establishment of P. leucopus: the center of the Montérégie and the South of the Saint-Lawrence River to the southwestern tip of the Montérégie, where presence probabilities were >80%. The current predicted presence probability of the white-footed mouse was significantly correlated with the mouse density observed at our study sites (ρ = 0.45, P < 0.007). By 2050, the distribution of the white-footed mouse is predicted to shift poleward by approximately 250 km (Figure S2B, Roy-Dufresne et al. 2013).
Landscape models
The first two components of the PCA performed on the landscape variables explained a cumulative variance of 73.07% (Figure S3). The first axis represented a landscape gradient from agricultural to woodland, with increasing forest patch size and edge habitat and decreasing degree of fragmentation. It was positively correlated with the proportion of woodlands (r = 0.96), the forest patch area (r = 0.94) and the forest patch perimeter (r = 0.94), and was negatively correlated with the proportion of agricultural fields (r = −0.76). The second axis was positively correlated with the proportion of urban areas (r = 0.95) and the mean resistance (r = 0.87), and negatively correlated with connectivity (r = −0.51) and the proportion of agriculture fields (r = −0.52). The minimal distance to the nearest neighbor was correlated with the third component (r = 0.98), which further explained 12.59% of the variance.
There was a negative relation between the first PCA axis and tick abundance and we used a negative-binomial model to predict tick abundance (Total T = 2.55–0.37 PC1, Residual deviance = 39.05, P(estimate) < 0.004).
The observed density of white-footed mice was negatively correlated with the first axis (ρ = −0.55, P < 0.0008). We used the first axis of the PCA to predict the density of the white-footed mouse, using a linear model (Density L = 0.41–0.10 PC1; R2 = 0.24, F = 10.29, P < 0.003). Both the density of the white-footed mouse and the abundance of ticks were larger in a fragmented landscape of small forest patches within an agricultural matrix and decreased in areas predominantly covered with large continuous forest patches.
Current distribution of Borrelia burgdorferi
We used a combination of our four factors to model the risk of occurrence of B. burgdorferi: (i) the predicted maximum abundance of ticks obtained from DD > 0, (ii) the presence probability of the white-footed mouse obtained from the climate distribution modeling, (iii) the estimated white-footed mouse density predicted from the first PCA axis of the landscape variables, and (iv) the estimated tick abundance from the first PCA axis of the landscape variables.
These four variables were correlated with each other (all ρ > 0.42 and all P < 0.012), and we used a hierarchical partitioning analysis to evaluate both the independent and joint contribution of the four variables on the presence of B. burgdorferi. The independent contribution of P. leucopus presence probability predicted by the climate was the largest (64.32%, z = 4.33, P < 0.05). The independent contribution of the tick abundance by the climate was 18.96%, the independent contribution of P. leucopus densities predicted by the landscape was 8.38% and the contribution of the tick abundance from the landscape was 8.35%, but they were not significant. We nevertheless kept all the four factors in our model, as they also contributed jointly to the variance in the risk of occurrence of B. burgdorferi at a site, a contribution whose significance level cannot be estimated with the analysis.
Next, we used these coefficients to estimate a risk index for the presence of B. burgdorferi over the study area. We used the following formula to calculate this index:
where Number T is the tick abundance (maximum number of feeding females) estimated from the mean annual DD, Probability L is the presence probability of the mouse estimated from the climate niche model, Density L is the density of the mouse at a site estimated from the landscape variables and Total T is the tick abundance estimated from the landscape variables. The risk index was considered null when the estimated tick abundance Number T = 0.
The risk index was null at one of the field sites and ranged from 0.63 to 0.97 at the other 33 study sites (Fig. 3A). A higher risk of presence was predicted in the southwestern part of the Montérégie, rapidly decreasing from the Canadian border to the northwestern end of the Montérégie (Fig. 3A). All nine positives sites, where B. burgdorferi was detected in the field, were located in an area of higher predicted risk (>0.87).
Figure 3.

Current (A, B) and future (2050) (C) risk index for the presence of Borrelia burgdorferi. The future risk was estimated for a change in climate under a combination of A2, A1b, and B1 greenhouse gas emissions scenarios from the IPCC (Nakicenovic et al. 2000) (WGS 1984 World Mercator). The risk index at the local scale (panel A) was estimated from the distribution patterns of the tick and the mouse with both climatic and landscape variables. The risk index at the regional scale (panels B and C) was estimated from the distribution patterns of the mouse and the tick with climatic variables only. Both risk indices have been bounded from 0 to 1 and are relative estimates of the risk within a region that can be used to compare the relative risk between two specific areas within the region. The risk maps were generated with risk index classified into quintiles.
Lastly, we estimated the risk index at the scale of Québec, without taking into account the effect of the landscape on the density of the mouse or the abundance of the ticks, since landscape variables were not available at this large geographical scale. We performed a hierarchical partitioning analysis considering only the distribution of the mouse and the tick estimated from the climate and found that independent contributions of the mouse probability of occurrence and the tick abundance to the variance in the presence of B. burgdorferi were both significant. The probability of presence of the mouse obtained from the climate niche modeling explained 69.60% of the variance (z = 4.07, P < 0.05), and the maximum tick abundance estimated from the DD > 0 was 30.40% (z = 1.73, P < 0.05). The risk index for B. burgdorferi was thus as follow: risk QC = (0.3040 × Number T) + (0.6960 × Probability L). The risk index was considered null when Number T = 0. At this scale, the maximum risk index was 0.74 and rapidly decreased with latitude (Fig. 3B). The risk index was null across most of the province of Quebec.
Future Borrelia burgdorferi distribution
We predict a shift of approximately 1.5 degrees of latitude or 150 km north of the zone of high risk (risk index >0.65) by 2050 (Fig. 3C) in Southern Québec. This represents a rate of northern expansion of approximately 3.5 km per year. A greater shift is predicted to occur in the northeastern direction, along the shores of the St Lawrence River, where zones with a risk index >0.65 are predicted to shift by 450 km, at a rate of approximately 11 km per year. Another region of greater increase in the risk index is along the shores of the Saguenay River. Regions above 49 degree latitude will not likely be exposed to B. burgdorferi by 2050.
Discussion
We predict a northward shift of B. burgdorferi into Southern Québec at a rate of approximately 3.5–11 km per year over the next 40 years. Using empirical evidence and data collected in the field, we provide a first quantitative estimate of the relative importance of climate versus landscape variables on the distribution of the white-footed mouse and the black-legged tick. We combined these to estimate a risk index for the presence of B. burgdorferi hot spots. The environmental risk for Lyme disease, estimated from the abundance of ticks, the presence of B. burgdorferi and the proportion of ticks infected at a site (Tsao 2009), is a strong predictor of human Lyme disease case incidence in the USA (Pepin et al. 2012). Here, we show that in our study area this risk is also dependent on the distribution and abundance of the white-footed mouse, a rapidly expanding species in southern Québec. Our results therefore provide essential information for efforts to anticipate and manage the spread of Lyme disease in this region of emergence.
Current status of Lyme borreliosis and active surveillance in Québec
The first human case of Lyme disease acquired in Québec was reported in 2008 (Milord et al. 2013; INSPQ 2013). The number of cases reported in the province has increased from 2 in 2004 to 112 in 2013 (incomplete data for 2013, Jodoin et al. 2013); of the 245 cases reported in Québec since 2004, 80 were indigenous (49 in 2013). Based on this evidence for an increase in Lyme disease in Southern Québec, public health agencies recommended the continuation of active surveillance in the region (Milord et al. 2013). Active surveillance in Québec has been focused on the detection of established tick populations in the province (e.g. Ogden et al. 2010), as well as identifying the presence B. burgdorferi and the prevalence of infection in ticks toward a better understanding of environmental risk for the pathogen. With the assumption that there is a link between the abundance and spread of the black-legged tick and the occurrence of Lyme disease in humans, some have attempted to predict the risk of B. burgdorferi estimated from tick distribution and abundance (e.g. Glass et al. 1995; Kitron and Kazmierczak 1997). These models however, did not take into account other key agents in the transmission cycle of Lyme disease.
The importance of the white-footed mouse and black-legged ticks
The transmission cycle of B. burgdorferi is complex, and involves a suite of obligatory hosts for the vector tick, for which suitable habitat and environmental conditions must exist. Ticks hatch from eggs as larvae, then develop into nymphs and finally adults over a two and a half- to 3-year life cycle. At each transition from one life stage to the next, they require a single blood meal taken from a host. B. burgdorferi transmission cycles involve acquisition of infection from an infected host by a larval tick, maintenance of infection through development and molting to a host seeking nymph, and transmission of infection to a new host by the infected nymph. The efficiency of the transmission cycle in a given location is then determined by the relationships between the tick and its stage-specific host, in particular by the proportion of ticks that feed on competent reservoir hosts, and the efficiency of the competent reservoir host species to transmit the infection to feeding ticks. In northeastern USA, the white-footed mouse is a very common host for I. scapularis larvae and is also a highly efficient reservoir for B. burgdorferi, infecting 75–90% of the larvae it feeds, and maintaining infection lifelong (Donahue et al. 1987; Ostfeld 2011). We thus expect the white-footed mouse to be highly influential in the efficiency of cycles of B. burgdorferi transmission among different vertebrate reservoir hosts and in the proportion of host-seeking ticks in any one location that are infected. The white-footed mouse can therefore be key in determining Lyme disease risk for humans.
Leighton et al. (2012) estimated a range expansion of 46 km per year over the next decade for I. scapularis in Canada. The predicted rate of expansion for the white-footed mouse is lower, at an estimated 15 km per year in Michigan (Myers et al. 2009) and 10 km per year in Southern Québec (Roy-Dufresne et al. 2013). We attribute this difference to the difference in dispersal behavior of the two species. Ticks benefit from long-distance dispersal by migratory birds (Ogden et al. 2008c), which may be responsible for the rapid range expansion estimated by Leighton et al. (2012). Yet, while migratory birds disperse ticks from populations in the US into southern Canada, they mostly disperse ticks during the spring at the peak of activity of nymphal stage (Ogden et al. 2008c; Brinkerhoff et al. 2011). These nymphs then molt into adults that then feed on white-tailed deer, which are dead-end hosts for B. burgdorferi. Furthermore, the environmental conditions at most northern locations where ticks are dropped may preclude the establishment of reproducing tick population at these sites. As long as the habitat is suitable (i.e. it provides a duff layer that acts as a refuge protecting ticks from far subzero temperatures), I. scapularis readily survive over winter even when air temperatures reach −30°C, so minimum winter temperatures have a limited impact on where I. scapularis populations can establish (Lindsay et al. 1995; Brunner et al. 2012). However if spring, summer, and autumn temperatures are too low, the temperature-dependent duration of development from one life stage to another becomes too long and the probability that a larva survives to be a reproducing adult falls below unity beyond a certain northern latitudinal limit (Ogden et al. 2005). So while ticks are potentially able to disperse over large distances, several hundreds of kilometers, the local environmental conditions constitute a hard boundary for their development and survival. Mice, on the other hand, rely solely on their own dispersal ability to shift their range. We found that the presence of B. burgdorferi at a site was related to the proportion of white-footed mice carrying ticks, which in turn was correlated with mouse density at a site. Other host present at our study sites in this region (e.g., the deer mouse, shrews, voles, sciurids, or ground-dwelling birds) are also competent reservoirs of B. burgdorferi (see Ostfeld 2011) but are likely less efficient in transmitting B. burgdorferi to feeding larval ticks than P. leucopus (Rand et al. 1993). Both our results and previous work (reviewed by Ostfeld 2011) thus point to the importance of the white-footed mouse in determining the presence of B. burgdorferi.
The drivers: climate warming
The key potential role of climate warming on the northern expansion of Lyme borreliosis in Europe and North-America has been noted (e.g., Lindgren et al. 2000). The average temperature during the growing season has increased by 0.8°C over the last four decades in Montérégie (Almaraz et al. 2008). This recent increase in average annual temperature has created more favorable conditions for the establishment of tick and white-footed mouse populations and contributed to the northern expansion of the distribution range of these two species (Brownstein et al. 2005; Ogden et al. 2006; Roy-Dufresne et al. 2013). Migratory birds are breeding further north in Québec each year (DesGranges and Morneau 2010), dropping ticks that face new environmental conditions compared with their site of origin. Ambient temperature is limiting the distribution of ticks by affecting their rate of development from one life stage to the next (Ogden et al. 2005). In particular, the temperature during the summer must be warm enough for the ticks to complete their lifecycle (Ogden et al. 2005), and cold temperature during the winter may preclude the survival of overwintering ticks in the far north (but see Brunner et al. 2012). Likewise, the presence of the white-footed mouse is favored by short winter and warm temperature and its range is rapidly shifting poleward (Roy-Dufresne et al. 2013). Overall, there is thus an increasing body of empirical evidence to support the hypothesis that climate warming is a key driver of Lyme disease emergence, acting upon many levels of the transmission cycle of the disease. Although rates of northward range expansion of high risk zones for B. burgdorferi in eastern Canada may be limited by the rates at which P. leucopus can expand its range with climate change, it is also apparent from our study that relatively modest changes in northward range expansion will likely be accompanied by very much greater expansion of the range of the rodent eastwards and westward (Figure S2). Clearly, in large areas of southern Québec, winters are currently too cold or long for P. leucopus survival; however, only small warming changes will be needed for a wide geographic area to become suitable for this species. This has considerable public health significance because, as for most of Canada, most of the human population in Québec lives within a few hundred kilometers of the US border and along the shores of the St Lawrence River. Therefore changes in Lyme disease risk in this region will likely have the greatest influence on Lyme disease incidence in Canada.
The drivers: habitat change
Coincident with recent climate warming, is the intensification of agriculture and deforestation that has led to the fragmentation of the landscapes and a mosaic of agriculture lands and forested patches. In Southern Québec, the degree of forest habitat lost is high, with a 70% decrease in old growth forest in the Montérégie alone over the last 70 years (Wampach 1988). While climate, especially temperature, plays a key role in limiting the distribution of the tick, we found that landscape variables (including both land use, patch area and connectivity measures) were a significant predictor of the abundance of the tick. The connectivity between habitat patches in a fragmented landscape has been shown to affect tick densities, which are higher in this type of mosaic landscape than in more homogeneous and continuous forested landscapes (e.g., Barbour and Fish 1993; Brownstein et al. 2005). A higher tick density in fragmented areas (Killilea et al. 2008) presumably reflects a higher abundance of hosts for feeding and reproduction in these habitats (e.g., Nupp and Swihart 1996; Allan et al. 2003; Anderson and Meikle 2006); the white-footed mouse benefits from higher edge habitats in small forest fragments (Wilder et al. 2005). Small forest patches are often surrounded by less suitable habitats which may hinder dispersion and promote genetic and morphological differentiation between isolated populations (Klein and Cameron 2012; Munshi-South 2012; Ledevin and Millien 2013; Rogic et al. 2013; R. R. Marrotte, A. Gonzalez, and V. Millien unpublished data). There is thus empirical evidence that features of the landscape such as less favorable habitats or physical barriers (e.g., rivers and roads) are limiting dispersal of the white-footed mouse. Habitat fragmentation is thus expected to affect the pattern of the spread of Lyme disease in Southern Québec, as it is limiting the distribution of both the tick and the mouse. However, we found that habitat-related variables were much less influential than climatic-related ones in predicting the presence of B. burgdorferi.
Other factors and the limits of our approach
While our study provides robust evidence for the combined effects of the expansion of both the tick and the mouse on the rate of emergence of Lyme disease, our approach has several limitations.
First, our risk index at the regional-Québec scale was estimated from the potential distribution of the tick and mouse, which is limited by climatic factors. Yet, the realized distribution of the tick and the mouse is likely constrained by a number of other interacting factors, in addition to climatic ones (Elith and Leathwick 2009; Araujo and Peterson 2012); these include landscape structure and the existence of geographic barriers (Bennie et al. 2013; Reino et al. 2013; Rioux-Paquette et al. 2014), the interaction with coexisting species (e.g. competition, Araujo and Peterson 2012), and dispersal behavior (Elith and Leathwick 2009). At the landscape scale, we found that the landscape was limiting the distribution of both the white-footed mouse and the black-legged tick, but to a lesser extent than climate variables. Overall, there is a considerable body of evidence that climate plays a major role in determining species distribution (Araujo and Peterson 2012), an hypothesis confirmed by our results.
Second, the climate model we used for the back-legged tick was a simple model linking tick abundance and temperature. Temperature is a key factor limiting the current distribution, establishment rate and future northern expansion of tick populations. However, other climatic factors are also important at limiting the distribution of the black-legged tick. Ticks, for example, are sensitive to desiccation while questing and require a minimum level of humidity. On the other hand, an excess of rain will hinder activity levels of the ticks, and decrease their chances of obtaining the blood meal they require to transition to their next life stage. Leighton et al. (2012) found that temperature was the main factor contributing to the establishment of tick population, but other variables such as rainfall and elevation were also included in their model. These conclusions are in agreement with the conclusion of Ogden et al. (2005) who found that when taken alone, temperature likely over-predicts the actual suitable range of black-legged ticks in Southern Canada.
Third, as noted in Paull et al. (2012), climate-driven changes in disease ecology are constrained by a number of other underlying and interacting factors (Ogden et al. 2013). For example, in her study of tick populations in Europe, Randolph (2008) found that Ixodes ricinus quested earlier in response to climate warming. However, this resulted in a mismatch between the timing of questing of larvae and the rise of small mammal host abundance, which in turn resulted in an increased mortality rate in ticks, and a decreased prevalence of tick-borne encephalitis (TBE) in their hosts (Randolph 2008). In this case, climate warming was not linked to an increase risk in human cases of TBE.
Here, we argue that while the presence of ticks is essential for B. burgdorferi transmission, ticks alone cannot predict the occurrence of B. burgdorferi, and that the white-footed mouse is a key element driving the distribution of the pathogen in this area of rapid invasion. However, other hosts that we did not consider may be equally important. The main host for the adult, reproductive stage of the tick, is the white-tailed deer (Odocoileus virginianus). There has been an increase in abundance of the white-tailed deer in North America during the 20th century (Ostfeld 2011), and in southern Québec, white-tailed deer populations have exceeded historical records of abundance in recent years (Huot and Lebel 2012).
Finally, we hypothesized that the magnitude of the effects of climate on the tick and mouse distribution does not change with time. Yet, this remains to be confirmed, especially in the context of range expansion when local adaptation of marginal populations may occur (e.g., Hill et al. 2011). Using neutral genetic markers and landmark data from the skull, we detected a strong geographical differentiation of populations of the white-footed mouse across forest patches within our study area (Ledevin and Millien 2013; Rogic et al. 2013). Interestingly, the patterns of genetic and morphological differentiation matched each other, hinting to a possible rapid—over the last few decades—evolution of populations isolated in favorable forested habitat within a landscape of less favorable habitat. With that scenario, each isolated population of white-footed mouse would have adapted to the local biotic and abiotic conditions, which could potentially alter its relationship with the black-legged tick (e.g. through behavioral adaptation) and ultimately the efficiency of the transmission cycle of B. burgdorferi locally. Alternatively, the local genetic and phenotypic differentiation we observed in the white-footed mouse could be the result of multiple independent founder events within an heterogeneous landscape, where each propagule and founding population would only carry a subset of the gene pool and phenotypic traits found in the original core population (Bell 2013). In this case as well, both the relation between the white-footed mouse and the black-legged tick and the transmission rate of B. burgdorferi may vary across populations. A change in disease spread within these isolated populations could occur for example in response to a change in the genetic diversity of the white-footed mouse populations (e.g., King and Lively 2012). Predictions about the future risk of spread of Lyme disease in Southern Québec should consider the potential for evolutionary change in the multiple species involved in the transmission of B. burgdorferi, and how evolution can alter the consequences of shifts in distributions of these species in response to environmental changes on disease occurrence (e.g., Hendry et al. 2011; Lankau et al. 2011). An effort to integrate both ecological and evolutionary responses of hosts, vectors and their pathogens will improve management of Lyme disease; a conclusion that likely extends more generally to the effects of diseases on wildlife (e.g., Vander Wal et al. 2014).
Conclusion
Our study aimed at combining both field and modeling approaches to better understand the pattern and rate of Lyme disease spread in Southern Québec in the next few decades. Here, we have identified a strong association of B. burgdorferi with the presence of P. leucopus in a zone of emergence of Lyme disease risk. Clearly, the presence of P. leucopus is not a sine qua non for B. burgdorferi invasion; this bacterium is a host generalist (Hanincova et al., 2006), it is emerging in a number of locations in Manitoba where P. leucopus does not occur (and P. maniculatus is the dominant rodent species: L. R. Lindsay, unpublished data), and the bacterium was identified at one of our sites where P. leucopus was not found. Nevertheless, here B. burgdorferi was most often found in locations where both I. scapularis and P. leucopus occurred, which suggests that the presence of P. leucopus facilitates B. burgdorferi invasion. Communities where P. leucopus occur are likely producing more efficient B. burgdorferi transmission cycles, resulting in higher infection prevalence in small mammals and ticks. These P. leucopus-rich communities are therefore hot spots for Lyme disease risk, and we predict that the geographic scope of these hot spots will spread north with climate change. While our risk maps are helpful for identifying areas of highest risk for Lyme disease, our work also provides a baseline for comparison to future studies of surveillance and thus helps at quantifying the rate of emergence of Lyme disease in the region. We recommend that combined studies of the distribution of ticks and white-footed mouse are conducted to assist decision-making on managing Lyme disease risk in Québec. Such studies will facilitate the identification of current and future areas of high risk of occurrence of B. burgdorferi in the region. While the overall prevalence of B. burgdorferi host-seeking ticks in Southern Québec is still low (~13%, this study; Ogden et al. 2010) in comparison with the rates of >20% typically observed in the United States (Gatewood et al. 2009), the risk of acquiring Lyme disease in Québec is now real and growing (Bourre-Tessier et al. 2011). Future work should be designed to integrate data on human recreational and professional activities and link the environmental risk (i.e., the presence of B. burgdorferi) with Lyme disease risk in humans (Medlock and Jameson 2010).
Acknowledgments
All procedures were approved by the Québec government (SEG Permit # 2011-05-15-014-00-S-F) and McGill University Animal Care Committee (AUP # 5420). We would like to thank all students who assisted in field work and data collection, landowners, the National Defense from the Government of Canada, the MDDEFP-Québec government, Environment Canada, Nature Action, CIME Haut-Richelieu, Parcs Québec (SEPAQ), D. Maneli, M. Duval and M. Lechowicz (Gault Reserve at Mont St-Hilaire) for access to study sites. The CRCM data was generated and supplied by the Ouranos Consortium. Funding for this project was provided by research grants from the Quebec Government/Ouranos Consortium (Fonds Vert, PACC 26 – Ouranos) to VM and AG.
Author contributions
VM, FJL, NHO, AG, LRL, FM, JKK, ND, TL and NT: designed the research; DS, VM and PL: coordinated field work sampling; RMM, JAS, ERD, AR, JF, JG, DS and VM: conducted field work and performed the analyses; JAS, VM, AG and NHO: wrote the manuscript.
Data archiving statement
Data for this study are available in the supporting information online.
Supporting Information
Additional Supporting Information may be found in the online version of this article:
Figure S1. Current (A) and future (B) predicted abundance (the maximum annual number of feeding female ticks at equilibrium) of the black-legged tick, based on DD > 0.
Figure S2. Probability of presence for the current (A) and future (B) projected distribution of the white-footed mouse, based on climatic variables.
Figure S3. Factor map of the principal component analysis performed on landscape variables.
Table S1. Field data for the 34 field sites.
Literature cited
- Allan BF, Keesing F. Ostfeld RS. Effect of forest fragmentation on Lyme disease risk. Conservation Biology. 2003;17:267–272. [Google Scholar]
- Almaraz JJ, Mabood F, Zhou X, Gregorich EG. Smith DL. Climate change, weather variability and corn yield at a higher latitude locale: Southwestern Quebec. Climate Change. 2008;88:187–197. [Google Scholar]
- Altizer S, Ostfeld RS, Johnson PTJ, Kutz S. Harvell D. Climate change and infectious diseases: from evidence to a predictive framework. Science. 2013;341:514–518. doi: 10.1126/science.1239401. [DOI] [PubMed] [Google Scholar]
- Anderson CS. Meikle DB. Annual changes in structural complexity of understory vegetation and relative abundance of Peromyscus leucopus in fragmented habitats. Acta Theriologica. 2006;51:43–51. [Google Scholar]
- Araujo MB. Peterson AT. Uses and misuses of bioclimatic envelope modeling. Ecology. 2012;93:1527–1539. doi: 10.1890/11-1930.1. [DOI] [PubMed] [Google Scholar]
- Barbour AG. Fish D. The biological and social phenomenon of Lyme disease. Science. 1993;260:1610–1616. doi: 10.1126/science.8503006. [DOI] [PubMed] [Google Scholar]
- Barthold SW, de Souza MS, Janotka JL, Smith AL. Persing DH. Chronic Lyme borreliosis in the laboratory mouse. American Journal of Pathology. 1993;143:959–971. [PMC free article] [PubMed] [Google Scholar]
- Baum E, Hue F. Barbour AG. Experimental infections of the reservoir species Peromyscus leucopus with diverse strains of Borrelia burgdorferi, a Lyme disease agent. mBio. 2012;3:e00434–12. doi: 10.1128/mBio.00434-12. [DOI] [PMC free article] [PubMed] [Google Scholar]
- Bell G. The incidental response to uniform natural selection. Biology Letters. 2013;9:20130215. doi: 10.1098/rsbl.2013.0215. [DOI] [PMC free article] [PubMed] [Google Scholar]
- Bennie J, Hodgson JA, Lawson CR, Holloway CTR, Roy DB, Brereton T, Thomas CD, et al. Range expansion through fragmented landscapes under variable climate. Ecology Letters. 2013;16:921–929. doi: 10.1111/ele.12129. [DOI] [PMC free article] [PubMed] [Google Scholar]
- Bouchard C, Beauchamp G, Nguon S, Trudel L, Milord F, Lindsay LR, Belanger D, et al. Associations between Ixodes scapularis ticks and small mammal hosts in a newly endemic zone in southeastern Canada: implications for Borrelia burgdorferi transmission. Ticks and Tick-Borne Diseases. 2011;2:183–190. doi: 10.1016/j.ttbdis.2011.03.005. [DOI] [PubMed] [Google Scholar]
- Bourre-Tessier J, Milord F, Pineau C. Vinet E. Indigenous Lyme disease in Quebec. The Journal of Rheumatology. 2011;38:183. doi: 10.3899/jrheum.100768. [DOI] [PubMed] [Google Scholar]
- Brinkerhoff RJ, Folsom-O’Keefe CM, Tsao K. Diuk-Wasser MA. Do birds affect Lyme disease risk? Range expansion of the vector-borne pathogen Borrelia burgdorferi. Frontiers in Ecology and the Environment. 2011;9:103–110. [Google Scholar]
- Brownstein JS, Holford TR. Fish D. Effect of climate change on Lyme disease risk in North America. EcoHealth. 2005;2:38–46. doi: 10.1007/s10393-004-0139-x. [DOI] [PMC free article] [PubMed] [Google Scholar]
- Brunner JL, Killilea M. Ostfeld RS. Overwintering survival of nymphal Ixodes scapularis (Acari: Ixodidae) under natural conditions. Journal of Medical Entomology. 2012;49:981–987. doi: 10.1603/me12060. [DOI] [PubMed] [Google Scholar]
- Chen I-C, Hill JK, Ohlemuller R, Roy DB. Thomas CD. Rapid range shifts of species associated with high levels of climate warming. Science. 2011;333:1024–1026. doi: 10.1126/science.1206432. [DOI] [PubMed] [Google Scholar]
- Daszac P, Cunningham AA. Hyatt AD. Anthropogenic environmental change and the emergence of infectious diseases in wildlife. Acta Tropica. 2001;78:103–116. doi: 10.1016/s0001-706x(00)00179-0. [DOI] [PubMed] [Google Scholar]
- DesGranges J. Morneau F. Potential sensitivity of Quebec’s breeding birds to climate change. Avian Conservation and Ecology. 2010;5:5. [Google Scholar]
- Desrosiers N, Morin R. Jutras J. Atlas des micromammifères du Québec. Québec City, QC: Société de la Faune et des Parcs du Québec, Direction du Développement de la Faune; 2002. p. 92. [Google Scholar]
- Donahue JG, Piesman J. Spielman A. Reservoir competence of white-footed mice for Lyme disease spirochetes. American Journal of Tropical Medicine and Hygiene. 1987;36:92–96. doi: 10.4269/ajtmh.1987.36.92. [DOI] [PubMed] [Google Scholar]
- Eisen R, Piesman J, Zielinski-Gutierrez E. Eisen L. What do we need to know about disease ecology to prevent Lyme disease in the northeastern United States? Journal of Medical Entomology. 2012;49:11–22. doi: 10.1603/me11138. [DOI] [PubMed] [Google Scholar]
- Elith J. Leathwick JR. Species distribution models: ecological explanation and prediction across space and time. Annual Review of Ecology, Evolution, and Systematics. 2009;40:677–697. [Google Scholar]
- ESRI. ArcGIS Desktop: Release 10.1. Redlands, CA: Environmental Systems Research Institute; 2013. [Google Scholar]
- Falco RC. Fish D. A comparison of methods for sampling the deer tick, Ixodes dammini, in a Lyme disease endemic area. Experimental & Applied Acarology. 1992;14:165–173. doi: 10.1007/BF01219108. [DOI] [PubMed] [Google Scholar]
- Gage KL, Burkot TR, Eisen RJ. Hayes EB. Climate and vector-borne diseases. American Journal of Preventive Medicine. 2008;35:436–450. doi: 10.1016/j.amepre.2008.08.030. [DOI] [PubMed] [Google Scholar]
- Gatewood AG, Liebman KA, Vourc’h G, Bunikis J, Hamer SA, Cortinas R, Melton F, et al. Climate and tick seasonality are predictors of Borrelia burdorferi genotype distribution. Applied and Environmental Microbiology. 2009;75:2476–2483. doi: 10.1128/AEM.02633-08. [DOI] [PMC free article] [PubMed] [Google Scholar]
- Glass GE, Schwartz BS, Morgan JM, Johnson DT, Noy PM. Israel E. Environmental risk factors for Lyme disease identified with geographic information systems. American Journal of Public Health. 1995;85:944–948. doi: 10.2105/ajph.85.7.944. [DOI] [PMC free article] [PubMed] [Google Scholar]
- Gould EA. Higgs S. Impact of climate change and other factors on emerging arbovirus diseases. Transactions of the Royal Society of Tropical Medicine & Hygiene. 2009;103:109–121. doi: 10.1016/j.trstmh.2008.07.025. [DOI] [PMC free article] [PubMed] [Google Scholar]
- Hanincova K, Kurtenbach K, Diuk-Wasser M, Brei B. Fish D. Epidemic spread of Lyme Borreliosis, Northeastern United States. Emerging Infectious Diseases. 2006;12:604–611. doi: 10.3201/eid1204.051016. [DOI] [PMC free article] [PubMed] [Google Scholar]
- Harvell CD, Mitchell CE, Ward JR, Altizer S, Dobson AP, Ostfeld RS. Samuel MD. Climate warming and disease risks for terrestrial and marine biota. Science. 2002;296:2158–2162. doi: 10.1126/science.1063699. [DOI] [PubMed] [Google Scholar]
- Hendry AP, Kinnison MT, Heino M, Day T, Smith TB, Fitt G, Bergstrom CT, et al. Evolutionary principles and their practical application. Evolutionary Applications. 2011;4:159–183. doi: 10.1111/j.1752-4571.2010.00165.x. [DOI] [PMC free article] [PubMed] [Google Scholar]
- Hijmans RJ. vanEtten J. 2012. raster: Geographic data analysis and modeling. R Package version 2.2-31. http://CRAN.R-project.org/package=raster (accessed on 28 February 2014)
- Hill JK, Griffiths HM. Thomas CD. Climate change and evolutionary adaptations at species’ range margins. Annual Review of Entomology. 2011;56:143–159. doi: 10.1146/annurev-ento-120709-144746. [DOI] [PubMed] [Google Scholar]
- Huot M. Lebel F. Plan de gestion du cerf de Virginie au Québec 2010–2017. Québec: Ministère des Ressources naturelles et de la Faune – secteur Faune Québec, Direction générale de l’expertise sur la faune et ses habitats; 2012. p. 578. [Google Scholar]
- Institut national de Sante publique (INSPQ) 2013. pp. 1–12. Laboratoire de santé publique du Québec, (LSPQ). Borrelia burgdorferi. Bulletin STATLABO. Statistiques d’analyses du LSPQ. 12.
- Jodoin S, Leblanc M-A. Markowski F. 2013. p. 4. Hausse des cas de maladie de Lyme. Flash Vigie 8, pp. Bureau de surveillance et de vigie de la Direction de la protection de la santé publique du ministère de la Sante et des Services sociaux du Québec. Gouvernement du Québec.
- Jones CG, Ostfeld RS, Richard MP, Schauber EM. Wolff JO. Chain reactions linking acorns to gypsy moth outbreaks and Lyme disease risk. Science. 1998;279:1023–1026. doi: 10.1126/science.279.5353.1023. [DOI] [PubMed] [Google Scholar]
- Jones KE, Patel NG, Levy MA, Storeygard A, Balk D, Gittleman JL. Daszak P. Global trends in emerging infectious diseases. Nature. 2008;451:990–993. doi: 10.1038/nature06536. [DOI] [PMC free article] [PubMed] [Google Scholar]
- Keane B. Dispersal and inbreeding avoidance in the white-footed mouse, Peromyscus leucopus. Animal Behavior. 1990;40:143–152. [Google Scholar]
- Keirans JE, Hutcheson HJ, Durden LA. Klompen JS. IxodesIxodesscapularis (Acari: Ixodidae): redescription of all active stages, distribution, hosts, geographical variation, and medical and veterinary importance. Journal of Medical Entomology. 1996;33:297–318. doi: 10.1093/jmedent/33.3.297. [DOI] [PubMed] [Google Scholar]
- Killilea M, Swei A, Lane B, Briggs C. Ostfeld R. Spatial dynamics of Lyme disease: a review. EcoHealth. 2008;5:167–195. doi: 10.1007/s10393-008-0171-3. [DOI] [PubMed] [Google Scholar]
- King KC. Lively CM. Does genetic diversity limit disease spread in natural host populations? Heredity. 2012;109:199–203. doi: 10.1038/hdy.2012.33. [DOI] [PMC free article] [PubMed] [Google Scholar]
- Kitron U. Kazmierczak JJ. Spatial analysis of the distribution of Lyme disease in Wisconsin. American Journal of Epidemiology. 1997;145:558–566. doi: 10.1093/oxfordjournals.aje.a009145. [DOI] [PubMed] [Google Scholar]
- Klein GP. Cameron GN. Effect of habitat gradients on space use by white-footed mice (Peromyscus leucopus. Journal of Mammalogy. 2012;93:706–715. [Google Scholar]
- Lankau R, Jorgensen PS, Harris DJ. Sih A. Incorporating evolutionary principles into environmental management and policy. Evolutionary Applications. 2011;4:315–325. doi: 10.1111/j.1752-4571.2010.00171.x. [DOI] [PMC free article] [PubMed] [Google Scholar]
- Ledevin R. Millien V. Congruent morphological and genetic differentiation as a signature of range expansion in a fragmented landscape. Ecology and Evolution. 2013;3:4172–4182. doi: 10.1002/ece3.787. [DOI] [PMC free article] [PubMed] [Google Scholar]
- Leighton PA, Koffi JK, Pelcat Y, Lindsay LR. Ogden NH. Predicting the speed of tick invasion: an empirical model of range expansion for the Lyme disease vector Ixodes scapularis in Canada. Journal of Applied Ecology. 2012;49:457–464. [Google Scholar]
- Li S, Hartemink N, Speybroeck N. Vanwambeke SO. Consequences of landscape fragmentation on Lyme disease risk: a cellular automata approach. PLoS ONE. 2012;7:e39612. doi: 10.1371/journal.pone.0039612. [DOI] [PMC free article] [PubMed] [Google Scholar]
- Lindgren E, Talleklint L. Polfeldt T. Impact of climatic change on the Northern latitude limit and population density of the disease-transmitting European tick Ixodes ricinus. Environmental Health Perspectives. 2000;108:119–123. doi: 10.1289/ehp.00108119. [DOI] [PMC free article] [PubMed] [Google Scholar]
- Lindsay LR, Barker IK, Surgeoner GA, McEwen SA, Gillespie TJ. Robinson JT. Survival and development of Ixodes scapularis (Acari: Ixodidae) under various climatic conditions in Ontario, Canada. Journal of Medical Entomology. 1995;32:143–152. doi: 10.1093/jmedent/32.2.143. [DOI] [PubMed] [Google Scholar]
- MacNally R. Regression and model building in conservation biology, biogeography and ecology: the distinction between and reconciliation of ‘predictive’ and ‘explanatory’ models. Biodiversity and Conservation. 2000;9:655–671. [Google Scholar]
- MacNally R. Multiple regression and inference in conservation biology and ecology: further comments on identifying important predictor variables. Biodiversity and Conservation. 2002;11:1397–1401. [Google Scholar]
- McKenney DW, Pedlar JH, Papadopol P. Hutchinson MF. The development of 1901–2000 historical monthly climate models for Canada and the United States. Agricultural and Forest Meteorology. 2006;138:69–81. [Google Scholar]
- McRae BH. Isolation by resistance. Evolution. 2006;60:1551–1561. [PubMed] [Google Scholar]
- Medlock JM. Jameson LJ. Ecological approaches to informing public health policy and risk assessments on emerging vector-borne zoonoses. Emerging Health Threats Journal. 2010;3:e1. doi: 10.3134/ehtj.10.001. [DOI] [PMC free article] [PubMed] [Google Scholar]
- Meehl GA, Covey C, Taylor KE, Delworth T, Stouffer RJ, Latif M, McAvaney B, et al. 2007. pp. 1383–1394. The WCRP CMIP3 multimodel dataset – a new era in climate change research. Bulletin of the American Meteorological Society September 2007.
- Mills JN, Gage KL. Khan AS. Potential influence of climate change on vector-borne and zoonotic diseases: a review and proposed research plan. Environmental Health Perspectives. 2010;118:1507–1514. doi: 10.1289/ehp.0901389. [DOI] [PMC free article] [PubMed] [Google Scholar]
- Milord F, Leblanc M-A, Markowski F, Rousseau M, Levesque S. Dio R. 2013. p. 5. Surveillance de la maladie de Lyme au Québec – Bilan 2004–2012. Flash Vigie 8, pp. Bureau de surveillance et de vigie de la Direction de la protection de la santé publique du ministère de la Santé et des Services sociaux du Québec. Gouvernement du Québec.
- MRNF; forestiers Ddi. Système d’information écoforestière (SIEF) – Produits de diffusion – Spécifications techniques. Québec City, QC: Ministère des Ressources naturelles, de la Faune et des Parcs; 2004. [Google Scholar]
- Munshi-South J. Urban landscape genetics: canopy cover predicts gene flow between white-footed mouse (Peromyscus leucopus) populations in New York City. Molecular Ecology. 2012;21:1360–1378. doi: 10.1111/j.1365-294X.2012.05476.x. [DOI] [PubMed] [Google Scholar]
- Music B. Caya D. Evaluation of the hydrological cycle over the Mississippi River Basin as simulated by the Canadian Regional Climate Model (CRCM) Journal of Hydrometeorology. 2007;8:969–988. [Google Scholar]
- Myers P, Lundrigan BL, Hoffman SMG, Haraminac AP. Seto SH. Climate-induced changes in the small mammal communities of the Northern Great Lakes Region. Global Change Biology. 2009;15:1434–1454. [Google Scholar]
- Nakicenovic N, Alcamo J, Davis G, de Vries B, Fenhann J, Gaffin S, Gregory K, et al. Emissions scenarios rapport special du Groupe de Travail III du Groupe d’experts intergouvernemental sur l’évolution du climat. Cambridge: Cambridge University Press; 2000. p. 599. [Google Scholar]
- Nupp TE. Swihart RK. Effect of forest patch area on population attributes of white-footed mice (Peromyscus leucopus) in fragmented landscapes. Canadian Journal of Zoology. 1996;74:467–472. [Google Scholar]
- Ogden NH, Bigras-Poulin M, O’Callaghan CJ, Barker IK, Lindsay LR, Maarouf A, Smoyer-Tomic KE, et al. A dynamic population model to investigate effects of climate on geographic range and seasonality of the tick Ixodes scapularis. International Journal for Parasitology. 2005;35:375–389. doi: 10.1016/j.ijpara.2004.12.013. [DOI] [PubMed] [Google Scholar]
- Ogden NH, Maarouf A, Barker IK, Bigras-Poulin M, Lindsay LR, Morshed MG, O’Callaghan CJ, et al. Climate change and the potential for range expansion of the Lyme disease vector Ixodes scapularis in Canada. International Journal for Parasitology. 2006;36:63–70. doi: 10.1016/j.ijpara.2005.08.016. [DOI] [PubMed] [Google Scholar]
- Ogden NH, Bigras-Poulin M, O’Callaghan CJ, Barker IK, Kurtenbach K, Lindsay LR. Charron DF. Vector seasonality, host infection dynamics and fitness of pathogens transmitted by the tick Ixodes scapularis. Parasitology. 2007;134:209–227. doi: 10.1017/S0031182006001417. [DOI] [PubMed] [Google Scholar]
- Ogden NH, Bigras-Poulin M, Hanincová K, Maarouf A, O’Callaghan CJ. Kurtenbach K. Projected effects of climate change on tick phenology and fitness of pathogens transmitted by the North American tick Ixodes scapularis. Journal of Theoretical Biology. 2008a;254:621–632. doi: 10.1016/j.jtbi.2008.06.020. [DOI] [PubMed] [Google Scholar]
- Ogden NH, St-Onge L, Barker IK, Brazeau S, Bigras-Poulin M, Charron DF, Francis CM, et al. Risk maps for range expansion of the Lyme disease vector, Ixodes scapularis, in Canada now and with climate change. International Journal of Health Geographics. 2008b;7:1–15. doi: 10.1186/1476-072X-7-24. [DOI] [PMC free article] [PubMed] [Google Scholar]
- Ogden NH, Lindsay LR, Hanincová K, Barker IK, Bigras-Poulin M, Charron DF, Heagy A, et al. Role of migratory birds in introduction and range expansion of Ixodes scapularis ticks and of Borrelia burgdorferi and Anaplasma phagocytophilum in Canada. Applied and Environment Microbiology. 2008c;74:1780–1790. doi: 10.1128/AEM.01982-07. [DOI] [PMC free article] [PubMed] [Google Scholar]
- Ogden NH, Lindsay LR, Morshed MG, Sockett P. Artsob H. The emergence of Lyme disease in Canada. Canadian Medical Association Journal. 2009;180:1221–1224. doi: 10.1503/cmaj.080148. [DOI] [PMC free article] [PubMed] [Google Scholar]
- Ogden NH, Bouchard C, Kurtenbach K, Margos G, Lindsay LR, Trudel L, Nguon S, et al. Active and passive surveillance and phylogenetic analysis of Borrelia burgdorferi elucidate the process of Lyme disease risk emergence in Canada. Environmental Health Perspectives. 2010;118:909–914. doi: 10.1289/ehp.0901766. [DOI] [PMC free article] [PubMed] [Google Scholar]
- Ogden NH, Margos G, Aanensen DM, Drebot MA, Feil EF, Hanincova K, Schwartz I, et al. Investigation of genotypes of Borrelia burgdorferi in Ixodes scapularis ticks collected during surveillance in Canada. Applied and Environmental Microbiology. 2011;77:3244–3254. doi: 10.1128/AEM.02636-10. [DOI] [PMC free article] [PubMed] [Google Scholar]
- Ogden NH, Meichai S. Margos G. Changing geographic ranges of ticks and tick-borne pathogens: drivers, mechanisms and consequences for pathogen diversity. Frontiers in Cellular and Infection Microbiology. 2013;3:46. doi: 10.3389/fcimb.2013.00046. [DOI] [PMC free article] [PubMed] [Google Scholar]
- Ostfeld RS. Lyme Disease: The Ecology of a Complex System. New York, NY: Oxford University Press; 2011. p. 216. [Google Scholar]
- Ostfeld RS, Cepeda OM, Hazler KR. Miller MC. Ecology of Lyme disease habitat associations of ticks (Ixodes scapularis) in a rural landscape. Ecological Applications. 1995;5:353–361. [Google Scholar]
- Parmesan C. Yohe G. A globally coherent fingerprint of climate change impacts across natural systems. Nature. 2003;421:37–42. doi: 10.1038/nature01286. [DOI] [PubMed] [Google Scholar]
- Paull SH, LaFonte BE. Johnson PTJ. Temperature-driven shifts in a host–parasite interaction drive nonlinear changes in disease risk. Global Change Biology. 2012;18:3558–3567. [Google Scholar]
- Pepin KM, Eisen RJ, Mead PS, Piesman J, Fish D, Hoen AG, Barbour AG, et al. Geographic variation in the relationship between human Lyme disease incidence and density of infected host-seeking Ixodes scapularis nymphs in the Eastern United States. American Journal of Tropical Medicine and Hygiene. 2012;86:1062–1071. doi: 10.4269/ajtmh.2012.11-0630. [DOI] [PMC free article] [PubMed] [Google Scholar]
- Rand PW, Lacombe EH, Rich RP, Smith SM, Kilpatrick CW, Dragoni CA. Caporale D. Competence of Peromyscus maniculatus (Rodentia: Cricetidae) as a reservoir host for Borrelia burgdorferi (Spirochaetares: Spirochaetaceae) in the wild. Journal of Medical Entomology. 1993;30:614–618. doi: 10.1093/jmedent/30.3.614. [DOI] [PubMed] [Google Scholar]
- Randolph SE. Dynamics of tick-borne disease systems: minor role of recent climate change. Revue scientifique et technique (International Office of Epizootics) 2008;27:367–381. [PubMed] [Google Scholar]
- Reino L, Beja P, Araujo MB, Dray S. Segurado P. Does local habitat fragmentation affect large-scale distributions? The case of a specialist grassland bird. Diversity and Distributions. 2013;19:423–432. [Google Scholar]
- Rioux-Paquette S, Garant D, Talbot B, Mainguy J. Pelletier F. Modelling the dispersal of the two main hosts of the raccoon rabies variant in heterogeneous environments with landscape genetics. Evolutionary Applications. 2014 doi: 10.1111/eva.12161. [DOI] [PMC free article] [PubMed] [Google Scholar]
- Rogic A, Tessier N, Lapointe F-J. Millien V. Genetic structure of the white-footed mouse in the context of the emergence of Lyme disease in southern Québec. Ecology and Evolution. 2013;3:2075–2088. doi: 10.1002/ece3.620. [DOI] [PMC free article] [PubMed] [Google Scholar]
- Roy-Dufresne E, Logan T, Simon JA, Chmura GL. Millien V. Poleward expansion of the white-footed mouse (Peromyscus leucopus) under climate change: implications for the spread of Lyme disease. PLoS ONE. 2013;8:e80724. doi: 10.1371/journal.pone.0080724. [DOI] [PMC free article] [PubMed] [Google Scholar]
- Shaw MT, Keesing F, McGrail R. Ostfeld RS. Factors influencing the distribution of larval blacklegged ticks on rodent hosts. American Journal of Tropical Medicine and Hygiene. 2003;68:447–452. [PubMed] [Google Scholar]
- Slenning BD. Global climate change and implications for disease emergence. Veterinary Pathology. 2010;47:28–33. doi: 10.1177/0300985809354465. [DOI] [PubMed] [Google Scholar]
- Tsao JL. Reviewing molecular adaptations of Lyme borreliosis spirochetes in the context of reproductive fitness in natural transmission cycles. Veterinary Research. 2009;40:36. doi: 10.1051/vetres/2009019. [DOI] [PMC free article] [PubMed] [Google Scholar]
- Vander Wal E, Garant D, Calme S, Chapman CA, Festa-Bianchet M, Rioux-Paquette S, Millien V, et al. Applying evolutionary concepts to wildlife disease ecology and management. Evolutionary Applications. 2014;7:856–868. doi: 10.1111/eva.12168. [DOI] [PMC free article] [PubMed] [Google Scholar]
- Walsh C. MacNally R. Hiert.part: Hierarchical Partitioning. R Package v1.0-4. 2013. http://cran.r-project.org/package=hier.part (accessed on 28 February 2014) [Google Scholar]
- Walther GR, Post E, Convey P, Menzel A, Parmesan C, Beebee TJ, Fromentin JM, et al. Ecological responses to recent climate change. Nature. 2002;416:389–395. doi: 10.1038/416389a. [DOI] [PubMed] [Google Scholar]
- Wampach J-P. Deux siècles de croissance agricole au Québec, 1760–1985. Recherches Sociographiques. 1988;29:181–199. [Google Scholar]
- Wilcox BA. Gubler DJ. Disease ecology and the global emergence of zoonotic pathogens. Environmental Health and Preventive Medicine. 2005;10:263–272. doi: 10.1007/BF02897701. [DOI] [PMC free article] [PubMed] [Google Scholar]
- Wilder SM, Abtahi AM. Meikle DB. The effects of forest fragmentation on densities of white-footed mice (Peromyscus leucopus) during the winter. The American Midland Naturalist. 2005;153:71–79. [Google Scholar]
- Zell R. Global climate and the emergence/re emergence of infectious diseases. International Journal of Medical Microbiology. 2004;293:37–1626. doi: 10.1016/s1433-1128(04)80005-6. [DOI] [PubMed] [Google Scholar]
Associated Data
This section collects any data citations, data availability statements, or supplementary materials included in this article.
Supplementary Materials
Figure S1. Current (A) and future (B) predicted abundance (the maximum annual number of feeding female ticks at equilibrium) of the black-legged tick, based on DD > 0.
Figure S2. Probability of presence for the current (A) and future (B) projected distribution of the white-footed mouse, based on climatic variables.
Figure S3. Factor map of the principal component analysis performed on landscape variables.
Table S1. Field data for the 34 field sites.