Abstract
We report automated and time efficient (2 h per sample) profiling of muscle using ultra-performance liquid chromatography (LC) coupled directly with high-definition mass spectrometry (HDMSE). Soluble proteins extracted from rat gastrocnemius (n=10) were digested with trypsin and analysed in duplicate using a 90 min RPLC gradient. Protein identification and label-free quantitation were performed from HDMSE spectra analysed using TransOmics Informatics for Proteomics software. In total 1,514 proteins were identified. Of these, 811 had at least 3 unique peptides and were subsequently used to assess the dynamic range and precision of LC-HDMSE label-free profiling. Proteins analysed by LC-HDMSE encompass the entire complement of glycolytic, beta-oxidation and tricarboxylic acid enzymes. In addition, numerous components of the electron transport chain and protein kinases involved in skeletal muscle regulation were detected. The dynamic range of protein abundances spanned 4 orders of magnitude. The correlation between technical replicates of the 10 biological samples was R2 = 0.9961 ± 0.0036 (95 % CI = 0.9940 – 0.9992) and the technical coefficient of variation averaged 7.3 ± 6.7 % (95 % CI = 6.87 – 7.79 %). This represents the most sophisticated label-free profiling of skeletal muscle to date.
Keywords: data-independent acquisition, ion mobility, LC-MS
Skeletal muscle accounts for ~40 % of adult body mass and is the major site of both protein turnover and insulin-mediated glucose disposal. As such, abnormalities in muscle insulin sensitivity and protein metabolism contribute to the pathogenesis of diseases, such as type 2 diabetes, and age-related declines in physical function. Conversely, the protective effects of exercise against non-communicable diseases and frailty are in part underpinned by muscle adaptations. Therefore proteome profiling of physiological and patho-physiological muscle adaptations may discover clinically relevant biomarkers. Despite its importance, skeletal muscle is a relatively understudied area in proteomics, somewhat due to the relative difficulty in achieving deep analysis of the muscle proteome. Thus, there remains a need for a reproducible and time-efficient method for screening muscle samples.
Currently, the majority of muscle proteome data comes from 2DE (e.g. [1]), which affords robust comparative analysis of protein species but does not easily resolve proteins at the extremes of the MW and pI ranges. Moreover, because 2DE separates proteins to their constituent species, the number of non-redundant proteins identified may be relatively small (e.g. <300 proteins). In contrast, orthogonal separation by SDS-PAGE and RPLC coupled to ESI tandem mass spectrometry (i.e. GeLCMS/ MS) is able to catalogue larger numbers of muscle proteins. For instance, Højlund et al. [2] identified 945 proteins encompassing the entire complement of metabolic enzymes and some regulatory kinases. However, the number of proteins that can be differentially profiled using label-free GeLC-MS/MS is much fewer. Primarily this is because the extensive sample fractionation makes it difficult to measure equivalent proteins or peptides in each biological replicate. At present, the largest number of skeletal muscle proteins to be differentially profiled by GeLC-MS/MS is 438, reported in [3], wherein spectral counting was used to investigate responses to aerobic exercise in patients with type 2 diabetes. Interestingly, Parker et al. [4] reports that the efficiency of data-dependent acquisition (DDA) tandem mass spectrometry (MS/MS) to identify muscle proteins is essentially consistent across 3 different experimental designs (i.e. 1D LC-MS/MS, 2D LC-MS/MS and GeLC-MS/MS). This suggests the mass spectrometer may be a limiting factor in the analysis of the muscle proteome.
Herein we used a Q-TOF mass spectrometer incorporating an additional gas-phase separation (i.e. ion mobility separation; IMS), which improves the resolution of complex peptide mixtures [5]. In addition, data-independent acquisition (DIA) was used whereby the instrument was programmed to alternate between low-energy (MS) and elevated-energy (MSE) modes to record parent- and product-ion data, respectively. Finally, we performed the first label-free profiling of muscle using the recently released Progenesis QI for Proteomics (QIP) application (Nonlinear Dynamics, Newcastle, UK) that has been specifically developed to combine the strengths of IMS and DIA, i.e. HDMSE. QIP accurately aligns data to a common reference chromatogram so there are no missing values, and samples are normalized using a global scaling factor that improves the signal:noise ratio over ratiometric scaling to a spiked purified protein (e.g. ‘hi-3” method advocated in [6]). We combined these advances in mass spectrometry and bioinformatics with 1D nano-flow RP UPLC to create a time-efficient and robust technique for routine comparative analysis of skeletal muscle samples.
Gastrocnemius muscles were obtained from genetically heterogeneous N:NIH rats (described in [7]) and in-solution trypsin digestion was performed according to [8]. Peptide mixtures were analysed by ultra performance LC (nanoACQUITY, Waters, Milford, MA) and online IMS mass spectrometry (SYNAPT G2-S, Waters, Manchester, UK). Samples (200 ng tryptic peptides) were loaded in aqueous 0.1% (v/v) formic acid via a Symmetry C18 5 µm, 2 cm × 180 µm trap column (Waters, Milford, MA). Separation was conducted at 35 °C through an HSS T3 C18 1.8 µm, 25 cm×75 µm analytical column (Waters, Milford, MA). Peptides were eluted using a gradient rising to 40 % acetonitrile 0.1% (v/v) formic acid over 90 min at a flow rate of 300 nL/min. Additionally, a Lockmass reference (100 fmol/ µL Glu-1-fibrinopeptide B) was delivered to the NanoLockSpray source of the mass spectrometer at a flow rate of 500 nL/min, and was sampled at 60 s intervals.
For all measurements, the mass spectrometer was operated in a positive ESI mode at a resolution of >25,000 FWHM. Prior to analysis, the time of flight analyser was calibrated with a NaCsI mixture from m/z 50 to 1990. HDMSE analyses were conducted within the Triwave ion guide. Accumulated ions were separated according to their drift time characteristics in the N2 gas-filled mobility cell prior to collision induced dissociation (CID) alternating between low (4 eV) and elevated (14–40 eV) collision energies at a scan speed of 0.9 s per function over 50–2000 m/z.
Analytical data were LockMass corrected post-acquisition using the doubly charged monoisotopic ion of the Glu-1-fibrinopeptide B. Charge reduction and deconvolution of potential parent-fragment correlation was achieved in the first instance by means of retention and drift time alignment, as described previously [9].
HDMSE spectra were aligned using Progenesis QIP. Prominent ion features (approximately 1200 per chromatogram) were used as vectors to match each dataset to a common reference chromatogram. An analysis window of 10 min – 100 min and 50 m/z – 1650 m/z was selected, which encompassed a total of 47,109 features (charge states of +2, +3 or +4) and 3,924 of these features were separated by IMS. Protein identifications and quantitative information were extracted using the dedicated algorithms in ProteinLynx GlobalSERVER (PLGS) v3.0 (Waters, Milford, MA). Peak lists were searched against the Uniprot database (date 2nd July 2012) restricted to ‘Rattus’ (7500 entries). The initial ion-matching requirements were ≧1 fragment per peptide, ≧3 fragments per protein and ≧1 peptide per protein. The enzyme specificity was trypsin allowing 1 missed cleavage, carbamidomethyl of cysteine (fixed) and oxidation of methionine (variable). Parent- and fragment-ion ppm errors were calculated empirically and decoy databases were used to calculate the identification error rate. Scoring of the database searches was refined by correlation of physicochemical properties of fragmented peptides from theoretical and experimental data. Peptide identifications were imported to Progenesis QIP and filtered to exclude peptides with scores less than 5.5 [10]. In total, 16, 749 peptides were identified and 1,018 had been resolved by IMS.
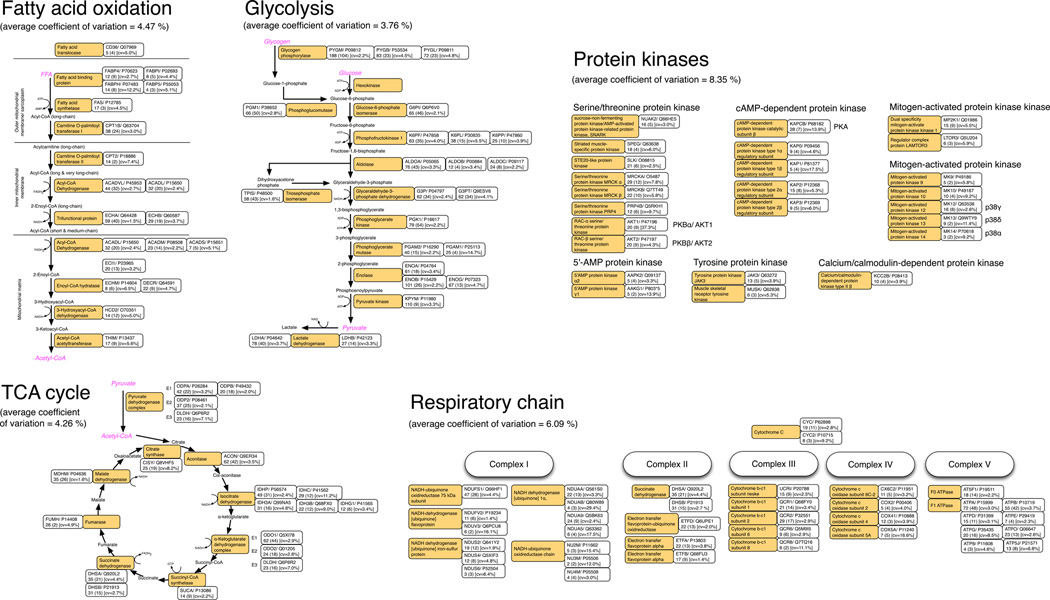
Proteins were grouped if they were identified by similar sets of peptides and, in total, HDMSE identified 1,514 protein groups. Of these, 811 had 3 or more unique peptides and were subsequently used to investigate the breadth and precision of label-free profiling. Metabolic enzymes were the most numerous gene ontology phrase and proteins in this subset encompassed the entire complement of glycolytic, betaoxidation and tricarboxylic acid enzymes. In addition, numerous components of the electron transport chain and protein kinases important in skeletal muscle regulation were detected (Figure 1). Consistent with the fast-twitch phenotype of the gastrocnemius, the relative abundance (RA) of enzymes involved in glycolysis and the tricarboxylic acid cycle were an order of magnitude greater than enzymes of fatty acid β-oxidation. Furthermore, the ratio of heart-type lactate dehydrogenase B (RA = 63,302) and the muscle isoform of lactate dehydrogenase A (RA = 557,602) was approximately 1:8. Kinases involved in skeletal muscle regulation were also detected, the most abundant (RA = 254,111) was sucrose-non-fermenting protein kinase/AMPactivated protein kinase-related protein kinase, SNARK (Q66HE5). This protein is implicated in contraction-induced glucose transport in skeletal muscle [11], but is not currently listed as expressed in skeletal muscle in the Uniprot knowledge base. Consistent with the known order of abundance of p38 mitogen-activated protein kinase isoforms, p38γ (Q63538; RA = 25,332) was more abundant that p38δ (Q9WTY9; RA = 7,118) and p38α (P70618; RA = 2,171).
Figure 1. Profiling of soluble muscle proteins.
The metabolic pathways of fatty acid β-oxidation, glycolysis and the tricarboxylic acid (TCA) cycle are redrawn from the Kyoto Encyclopaedia of Genes and Genomes (KEGG). For clarity the respiratory chain is not shown in its entirety, instead only subunits detected by HDMSE profiling are highlighted. In addition, protein kinases important in muscle regulation are displayed. Orange boxes display the common name of each enzyme, the adjacent boxes detail the UniProt protein ID and accession number, below these the total number of peptides is given. Numbers in parentheses represent the number of detected peptides that were unique to that protein and subsequently used for quantitative analyses. The technical coefficient of variation for each protein is also given.
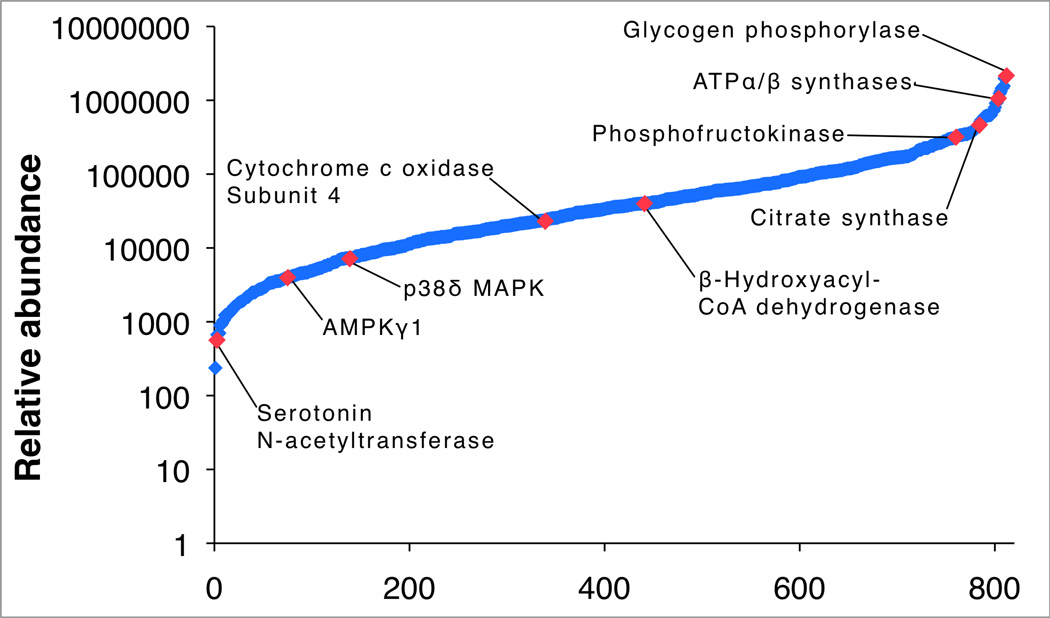
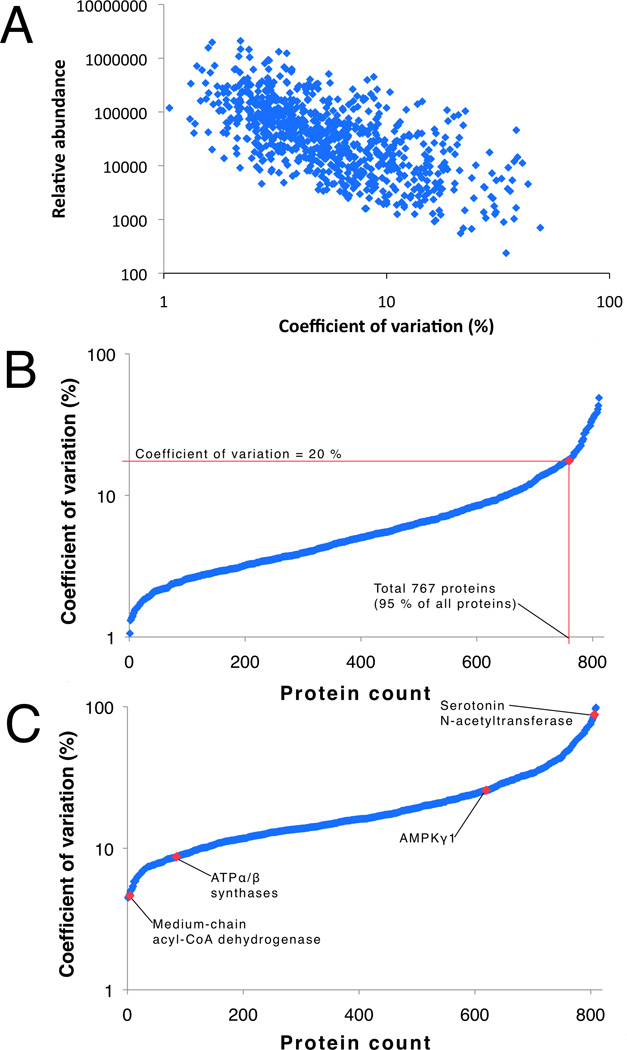
The dynamic range of protein abundance spanned 4 orders of magnitude (Figure 2), There was a trend for variation to be greater in low abundance proteins (Figure 3A), nonetheless, the correlation between technical replicates of 10 biological samples was R2 = 0.9961 ± 0.0036 (95 % CI = 0.9940 – 0.9992). The coefficient of variation averaged 7.3 ± 6.7 % (95 % CI = 6.87 – 7.79 %) and ~95 % (767 of 811) of proteins had a technical coefficient of variation of less than 20 % (Figure 3B). Herein we used genetically heterogeneous animals, and when data were organised to encompass both biological and technical variability the average coefficient of variation was 21.3 ± 15.9 % (range 4.5 % to 104.4 %; Figure 3C). The variability of 95 % of proteins (770 proteins) was <54 %, therefore, we estimate [12] a sample size of n = 9 would be sufficient to detect a 40 % difference (α = 0.05, 80 % power) in protein abundance between 2 independent groups.
Figure 2. Dynamic range of HDMSE profiling.
The relative abundance of proteins identified by HDMSE spanned 4 orders of magnitude. The most abundant protein was glycogen phosphorylase (2.1e06 AU). Consistent with the expected fast/ glycolytic phenotype of gastrocnemius, glycolytic and TCA enzymes were more abundant (~3.5e05 AU) than enzymes of fatty acid oxidation such as β-hydroxyacyl-CoA dehydrogenase (3.6e04 AU). Regulatory proteins, including mitogen activated protein kinase (MAPK) p38δ and the gamma 1 subunit of AMP kinase were detected at an abundance of ~5.0e03.
Figure 3. Technical and biological variability.
The relative abundance of a protein was inversely related to the level of technical variation (A). Technical coefficient of variation (B) was normally distributed, and 95 % (767 of 881) proteins identified had coefficient of variation of less than 20 %. Biological variability (range 4 – 104 %; C) was greater than technical variation.
The major strengths of our HDMSE technique include its precision, time-efficiency and applicability to archived muscle including unlabelled human samples. LCMS/ MS analysis of stable isotope-labelled amino acids [either in culture (SILAC) or mammals (SILAM)] is considered the gold-standard approach for differential proteome profiling. Differences between archetypal fast- and slow-twitch muscles have been investigated using the ‘SILAC’ mouse [13], and recently 2,474 proteins were identified [14] in mixed-fibre muscles of these animals. This unprecedented level of muscle proteome coverage was achieved by high-resolution LC-MS/MS of muscle digests separated in to 12 fractionations by off-gel isoelectric focusing. The correlation between replicate muscle samples was not provided but values of R2 = 0.93 and 0.95 were reported from equivalent analysis of lung and liver proteins.
Here, we report a correlation of R2 >0.99 between technical replicates and an average coefficient of variation of 7.3 %. This high level of reproducibility may be due to our use of a simpler 1D RPLC and IMS separation strategy alongside DIA, which does not rely on stochastic selection of precursor ions so suffers less from inconsistent sampling of peptides. Moreover, because the instrument alternates between MS and MSE this greatly improves the MS duty-cycle compared to DDA and affords more detailed detection of peak profiles, further increasing measurement precision [10]. These factors each contribute toward enhancing reproducibility of Progenesis QIP analysis. The current profiling compares favorably against DIGE of skeletal muscle [15] where 70 % of spots had a coefficient of variation less than 14 %. Using HDMSE, the average coefficient of variation of enzymes in the glycolytic, tricarboxylic acid cycle and fatty acid β-oxidation pathways was 3.8 %, 4.3 % and 4.5 %, respectively (Figure 1). This level of precision is equivalent to spectrophotometric assays optimised for individual ‘key/ rate-limiting’ metabolic enzymes. Importantly, because HDMSE profiling simultaneously monitors all enzymes within each pathway, bioinformatic analysis of this highly parallel data may be used to discover novel interactions that correlate with changes in muscle (patho-) physiology.
Skeletal muscle is an accessible and clinically relevant tissue but proteomic analysis of muscle is challenging because approximately half of the total protein mass is occupied by just 10 highly abundant contractile and metabolic proteins. Indeed, and the dynamic range of muscle protein abundance is thought to be equivalent to that of the plasma proteome (i.e. spanning ~12 orders of magnitude). Our HDMSE profiling of soluble muscle proteins spanned 4 orders of magnitude in protein abundance, which is equivalent to DIGE analysis of similar samples in our hands [15] and GeLCMS/ MS analysis using spectral counting [3]. Orthogonal separation of SILAC peptides [14] achieved 6 orders of magnitude but required 20 h instrument time per sample. Similarly, label-free GeLC-MS/MS [3] required approximately 30 h per sample and profiled 438 proteins. Here, 1D RPLC of less than 2 h duration was used to analyse 811 soluble muscle proteins. This substantial increase in time efficiency and proteome coverage achieved at a high level of precision.
In conclusion we report a time-efficient method for precise profiling of >750 skeletal muscle proteins. Specifically, the current work represents a 20-fold increment in time efficiency and almost 2-fold improvement in proteome coverage compared to the equivalent exemplary label-free analyses using GeLC-MS/MS. Moreover, our technique does not require stable isotope labelling so can be applied to studies in both human and non-human animal models.
References
- 1.Burniston JG, Hoffman EP. Proteomic responses of skeletal and cardiac muscle to exercise. Expert Rev Proteomics. 2011;8:361–377. doi: 10.1586/epr.11.17. [DOI] [PMC free article] [PubMed] [Google Scholar]
- 2.Højlund K, Yi Z, Hwang H, Bowen B, et al. Characterization of the human skeletal muscle proteome by one-dimensional gel electrophoresis and HPLC-ESI-MS/MS. Mol Cell Proteomics. 2008;7:257–267. doi: 10.1074/mcp.M700304-MCP200. [DOI] [PMC free article] [PubMed] [Google Scholar]
- 3.Hussey SE, Sharoff CG, Garnham A, Zhengping Y, et al. Effect of Exercise on the Skeletal Muscle Proteome in Patients with Type 2 Diabetes. Med Sci Sports Exerc. 2012;45:1069–1076. doi: 10.1249/MSS.0b013e3182814917. [DOI] [PMC free article] [PubMed] [Google Scholar]
- 4.Parker KC, Walsh RJ, Salajegheh M, Amato AA, et al. Characterization of human skeletal muscle biopsy samples using shotgun proteomics. J Proteome Res. 2009;8:3265–3277. doi: 10.1021/pr800873q. [DOI] [PubMed] [Google Scholar]
- 5.Shliaha PV, Bond NJ, Gatto L, Lilley KS. Effects of Traveling Wave Ion Mobility Separation on Data Independent Acquisition in Proteomics Studies. J Proteome Res. 2013;12:2323–2339. doi: 10.1021/pr300775k. [DOI] [PubMed] [Google Scholar]
- 6.Silva JC, Gorenstein MV, Li GZ, Vissers JP, Geromanos SJ. Absolute quantification of proteins by LCMSE: a virtue of parallel MS acquisition. Mol Cell Proteomics. 2006;5:144–156. doi: 10.1074/mcp.M500230-MCP200. [DOI] [PubMed] [Google Scholar]
- 7.Koch LG, Pollott GE, Britton SL. A selectively bred rat model system for low and high response to exercise training. Physiol Genomics. 2013;45:606–614. doi: 10.1152/physiolgenomics.00021.2013. [DOI] [PMC free article] [PubMed] [Google Scholar]
- 8.Malik Z, Cobley J, Morton J, Close G, et al. Label-Free LC-MS Profiling of Skeletal Muscle Reveals Heart-Type Fatty Acid Binding Protein as a Candidate Biomarker of Aerobic Capacity. Proteomes. 2013;1:290–308. doi: 10.3390/proteomes1030290. [DOI] [PMC free article] [PubMed] [Google Scholar]
- 9.Li GZ, Vissers JP, Silva JC, Golick D, et al. Database searching and accounting of multiplexed precursor and product ion spectra from the data independent analysis of simple and complex peptide mixtures. Proteomics. 2009;9:1696–1719. doi: 10.1002/pmic.200800564. [DOI] [PubMed] [Google Scholar]
- 10.Levin Y, Hradetzky E, Bahn S. Quantification of proteins using data-independent analysis (MSE) in simple and complex samples: a systematic evaluation. Proteomics. 2011;11:3273–3287. doi: 10.1002/pmic.201000661. [DOI] [PubMed] [Google Scholar]
- 11.Koh HJ, Toyoda T, Fujii N, Jung MM, et al. Sucrose nonfermenting AMPK-related kinase (SNARK) mediates contraction-stimulated glucose transport in mouse skeletal muscle. Proc Natl Acad Sci U S A. 2010;107:15541–15546. doi: 10.1073/pnas.1008131107. [DOI] [PMC free article] [PubMed] [Google Scholar]
- 12.van Belle G, Millard SP. STRUTS: Statistical rules of thumb. Departments of Environmental Health and Biostatistics, University of Washington; 1998. [Google Scholar]
- 13.Drexler HC, Ruhs A, Konzer A, Mendler L, et al. On marathons and Sprints: an integrated quantitative proteomics and transcriptomics analysis of differences between slow and fast muscle fibers. Mol Cell Proteomics. 2012;11 doi: 10.1074/mcp.M111.010801. M111.010801. [DOI] [PMC free article] [PubMed] [Google Scholar]


