

Abstract
Background
Understanding the molecular basis of craniofacial variation can provide insights into key developmental mechanisms of adaptive changes and their role in trophic divergence and speciation. Arctic charr (Salvelinus alpinus) is a polymorphic fish species, and, in Lake Thingvallavatn in Iceland, four sympatric morphs have evolved distinct craniofacial structures. We conducted a gene expression study on candidates from a conserved gene coexpression network, focusing on the development of craniofacial elements in embryos of two contrasting Arctic charr morphotypes (benthic and limnetic).
Results
Four Arctic charr morphs were studied: one limnetic and two benthic morphs from Lake Thingvallavatn and a limnetic reference aquaculture morph. The presence of morphological differences at developmental stages before the onset of feeding was verified by morphometric analysis. Following up on our previous findings that Mmp2 and Sparc were differentially expressed between morphotypes, we identified a network of genes with conserved coexpression across diverse vertebrate species. A comparative expression study of candidates from this network in developing heads of the four Arctic charr morphs verified the coexpression relationship of these genes and revealed distinct transcriptional dynamics strongly correlated with contrasting craniofacial morphologies (benthic versus limnetic). A literature review and Gene Ontology analysis indicated that a significant proportion of the network genes play a role in extracellular matrix organization and skeletogenesis, and motif enrichment analysis of conserved noncoding regions of network candidates predicted a handful of transcription factors, including Ap1 and Ets2, as potential regulators of the gene network. The expression of Ets2 itself was also found to associate with network gene expression. Genes linked to glucocorticoid signalling were also studied, as both Mmp2 and Sparc are responsive to this pathway. Among those, several transcriptional targets and upstream regulators showed differential expression between the contrasting morphotypes. Interestingly, although selected network genes showed overlapping expression patterns in situ and no morph differences, Timp2 expression patterns differed between morphs.
Conclusion
Our comparative study of transcriptional dynamics in divergent craniofacial morphologies of Arctic charr revealed a conserved network of coexpressed genes sharing functional roles in structural morphogenesis. We also implicate transcriptional regulators of the network as targets for future functional studies.
Electronic supplementary material
The online version of this article (doi:10.1186/2041-9139-5-40) contains supplementary material, which is available to authorized users.
Keywords: Arctic charr, Coexpression, Craniofacial development, Divergent evolution, Gene network, Morphogenesis, Salvelinus alpinus
Background
Unravelling the developmental and genetic basis of morphological and functional diversity is a fundamental step in understanding the evolutionary processes involved at both intra- and interspecific levels. The extensive diversity of teleost fish has been a fertile model system for studying such variation [1–5]. Closely related species or subspecies of fish are frequently distinguished by differences in the trophic apparatus, such as the shape and dynamics of jaws and pharyngeal elements [6]. We are interested in genes and mechanisms underlying the evolution of such differences. Explaining these mechanisms is a formidable challenge, however, as the trophic apparatus is a highly complex and integrated musculoskeletal system formed through interactions between derivatives of all three germ layers. Significant progress has already been made in studying the development of craniofacial elements in model species such as zebrafish, where genetic research has allowed detailed dissection of craniofacial development at the molecular level (reviewed in [7]). The accumulating knowledge about the structure and role of signalling pathways and gene expression differences in development is also becoming a significant tool for addressing questions at interspecific and phylogenetic levels. For example, such evidence was recently used in advancing a hypothesis about a developmental trade-off (constraints versus flexibility) influencing the radiation of the trophic apparatus in cichlids, a model species group for studying trophic radiation [8]. Recent advances in molecular techniques, such as whole-transcriptome sequencing (RNA-Seq) have opened new avenues for studying nonmodel species [9, 10]. In this respect, the polymorphic freshwater fish of northern postglacial lakes offer exciting opportunities for studying the developmental and genetic bases of rapid diversification in trophic structures and their relation to evolutionary forces [11].
Arctic charr (Salvelinus alpinus) is a highly suitable species for such studies. It shows extensive morphological variation throughout its geographic distribution and sports many cases of distinct polymorphisms which have evolved rapidly and repeatedly [12–14]. A striking example is seen in Lake Thingvallavatn in Iceland, where four resident morphs of Arctic charr are found: A large benthivorous (LB) morph, a small benthivorous (SB) morph, a planktivorous (PL) morph and a piscivorous (PI) morph [15]. In some ways, these morphs bear the hallmarks of separate subspecies, as they exhibit different ecological, behavioural and morphological characteristics [15–19] and show significant genetic divergence in neutral markers as well as in genes related to immunity [20, 21]. The two benthivorous morphs that appear to be derived have an overshot mouth, whereas the two limnetic morphs have a terminal mouth as well as shorter pectoral fins and a higher number of gill rakers [16]. Common garden experiments have shown that both variation in trophic morphology and feeding behaviour have a genetic basis, although maternal and environmental components also play a role [22–24]. Furthermore, these experiments show that some of the morphological differences arise early and are rooted in differential embryonic processes that could, for instance, evolve through heterochrony [22, 23]. Transcriptional heterochrony has been shown to contribute to craniofacial divergence in other fish species [25–27] and is likely to contribute to divergence of the Arctic charr morphs as well [23, 28].
Adaptations can arise through structural or regulatory changes in individual genes, several loci or coordinated deployment of coregulated genes [29, 30]. In developmental profiles, this would be reflected in differences in the timing, levels or patterns of gene expression. Previous studies on such differences between Arctic charr morphs have been focused on early embryonic development or posthatching stages in specific tissues [28, 31]. Data obtained from a preliminary transcriptome sequencing experiment indicated differential expression patterns during four developmental stages in two contrasting morphotypes of Arctic charr. Among these genes were Mmp2 and Sparc, and, as a proof of principle, their differential expression in the developing head of benthic and limnetic morphotypes was verified by reverse transcription quantitative PCR (RT-qPCR) analysis [32]. Several studies suggest that both genes play an important role in craniofacial morphogenesis in vertebrates [33–37], and a positive correlation of Mmp2 and Sparc expression levels has been reported [38–40], suggesting coregulation or synchronized biological function.
In view of this information, we decided to further investigate the expression dynamics and potential regulators of these genes. We wanted to find out whether Mmp2 and Sparc might be part of a larger network of genes with correlated expression during craniofacial morphogenesis and test whether such a network would show differential expression in developing heads of contrasting Arctic charr morphotypes. To accomplish this goal, we identified genes with strong expressional correlation to Mmp2 and Sparc in other species and selected those which also showed differential expression in developmental transcriptome profiles in contrasting Arctic charr morphotypes. Here we report that a network of functionally related genes shows coexpression in the developing head of Arctic charr embryos and is differentially expressed between benthic and limnetic morphotypes. The network genes share conserved binding motifs for a set of transcription factor (TFs), including Ap1 and Ets2. Interestingly, Ets2 itself is differentially expressed between the benthic and limnetic Arctic charr morphs during craniofacial development and shows strong expressional correlation with the network as well as spatiotemporal overlap in expression pattern.
Methods
Fish stocks, embryonic staging and sampling
Ripe parent fish from three of the Lake Thingvallavatn Arctic charr morphs—PL (small limnetic) morph, SB morph and LB morph—were sampled in 2010 during their respective spawning periods. For each morph, eggs from several females were pooled and fertilized using milt from several males. We also set up pooled crosses from a limnetic aquaculture stock (AC) from the Hólar College breeding programme. Eggs were reared at approximately 4°C to 5°C in hatching trays (EWOS, Bergen, Norway) under constant water flow and in complete darkness at Hólar College experimental facilities in Verið, Sauðárkrókur, Iceland. The water temperature was recorded twice daily, and the average was used to estimate the relative age of the embryos using tau-somite (τs) units, defined as the time it takes for one somite pair to form at a given temperature [41].
Morphometric analysis of the developing head
For morphometric comparisons of PL, LB, SB and AC morphs, we selected newly hatched embryos (305 τs). Samples were fixed in 4% paraformaldehyde. A total of 53 individuals (about 13 individuals per morph) were stained for cartilage (Alcian blue) and bone (Alizarin red) using a modified protocol for zebrafish [42]. The head of each individual was photographed ventrally under a dissecting microscope, and the same magnification (2.0×) was used for each photograph. Landmarks were selected to describe the shape of the lower jaw, its distance from the anterior tip of the ethmoid plate and the shape of the hyoid arch (Figure 1A) and digitised with tps.DIG2 [43]. Every individual was digitised three times, and the results from the repeated measurements were averaged in the final data set. The shape information for each specimen was extracted using a generalized Procrustes analysis in MorphoJ [44], where, after accounting for scale, position and orientation, all specimens were superimposed to a common coordinate system [45]. Only the symmetric component of shape variation [46] was used for subsequent statistical analysis. The centroid size (defined as the square root of the sum of the squared distances of all landmarks from their centroid) of each specimen was retained after the Procrustes fit and used as a measure of individual size. To remove the effect of allometry (morphological variation caused by differences in size), we used the residuals from the regression of shape on size for subsequent analysis. The differences between morphs were assessed using two statistical methods. First relative warp analyses were performed in tpsRelw [43], and the morph effect of each warp was tested with a generalized linear model in R [47]. Next, we generated two distances—(1) Mahalanobis distance (which measures the distances of separation between two groups scaled by the standard deviation in the respective directions) and (2) Procrustes distances (which measures the absolute amount of shape variation)—and assessed their statistical significance with 10.000 permutations. To visualize the differences between morphs, we used canonical variate analysis (CVA) in MorphoJ [44] and used differences between extremes to illustrate shape differences for CVA.
Figure 1.
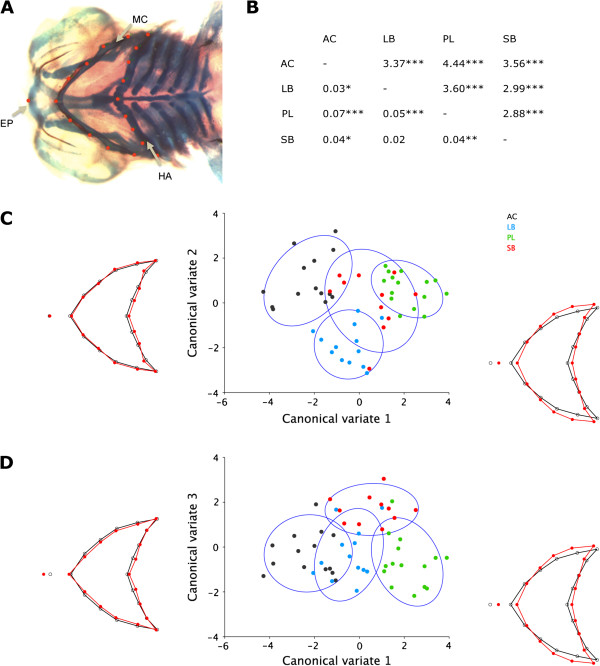
Shape differences between morphs assessed with geometric morphometrics. (A) Landmarks marking the anterior tip of the ethmoid plate (EP, leftmost landmark), lower jaw (MC, Meckel’s cartilage) and hyoid arch (HA). (B) Pairwise Mahalanobis (upper panel) and Procrustes distances (lower panel) between morphs and their significance obtained with 10.000 permutations. AC, Aquaculture charr from the Hólar breeding stock; LB and SB, Large and small benthivorous charr, respectively; PL, Planktivorous charr. ***P <0.001; **P <0.01; *P <0.05. (C) and (D) Scatterplots of the canonical variate (CV) analysis scores for four morphs of Arctic charr (AC, Black dots; LB, Blue dots; PL, Green dots; SB, Red dots). Wireframes depict shape changes associated with the two CVs shown in each graph (CV1 and CV2 in part (C) and CV1 and CV3 in part (D)). In the wireframes, the shape corresponding to the extreme negative CV score is shown in black, and the shape corresponding to the extreme positive CV score is shown in red. The scale factor is in units of Mahalanobis distance and is set to 6. Confidence ellipses are set to 90%.
Databases, gene coexpression and overrepresentation analysis
To gauge a potential network of coexpressed craniofacial genes, we searched COXPRESdb (http://coxpresdb.jp/) version 5.0 using orthologs of Mmp2 and Sparc [48]. The 500 genes with tightest coexpression with both Mmp2 and Sparc were retrieved for the three vertebrates with the largest available data sets (human, mouse and zebrafish) using the mutual rank (that is, the geometric mean of the correlation rank of gene A to gene B and of gene B to gene A). Genes with reliability scores less than three were discarded [48]. A total of 347 coexpressed genes were retained: 226 in humans, 176 in mice and 78 in zebrafish. In subsequent filtering steps, we selected genes showing differential expression between morphotypes in developmental transcriptome profiles of SB and AC morphs (see the Background section above; see also Gudbrandsson et al., unpublished data) that also show craniofacial expression in zebrafish (according to the Zebrafish Model Organism Database (ZFIN) up to August 2013) [49].
The coexpression relationships between genes from the resulting list, along with selected glucocorticoid (GC) effectors (see reasoning below), were visualized across divergent vertebrate species using FunCoup version 2.0 [50]. FunCoup uses Bayesian statistics to estimate the probability of functional coupling between two genes, based on multiple data sets containing information on mRNA and protein interactions, and presents this as a probabilistic confidence value (pfc). We used FunCoup to map an interaction network based on mRNA coexpression consensus for several vertebrate species using a pfc cutoff above 0.5.
To characterize the coexpression module, we performed Gene Ontology (GO) overrepresentation analysis on top-ranked genes coexpressed with both Mmp2 and Sparc in humans and mice (226 and 178 genes, respectively) using the Database for Annotation, Visualization and Integrated Discovery (DAVID) v6.7 [51]. The GO category used was ‘biological process’ at levels 3 to 5. Furthermore, to predict the potential regulators of the genes, TF enrichment analysis was conducted using the list of genes coexpressed with both Mmp2 and Sparc in humans and mice, as well as the WEB-based GEne SeT AnaLysis Toolkit (WebGestalt) v2 [52].
RNA isolation, cDNA synthesis and primer design for RT-qPCR
We studied embryos of four morphs, collected at seven time points spanning early craniofacial cartilage formation to a prehatching time point (155, 178, 200, 216, 238, 256 and 275 τs), and, for simplicity, these time points will be referred to as stages 1, 2, 3, 4, 5, 6 and 7, respectively. Extraembryonic membranes were punctured, and the embryos were stored in RNAlater solution (Ambion, Austin, TX, USA) at -20°C. For RNA extraction, embryos were dechorionated and decapitated in front of the pectoral fin under a light microscope (Leica S6 E; Leica Microsystems, Wetzlar, Germany). Two separate extractions were made for each morph and time point. For each replicate, six heads were placed in TRI Reagent (Sigma-Aldrich, St Louis, MO, USA) and homogenized with a disposable Kontes Pellet Pestle cordless motor tissue grinder (Kimble Chase, Rockwood, TN, USA). RNA was prepared according to the manufacturer’s instructions and dissolved in 50 μl of RNase-free water. To remove DNA contamination, the RNA was treated with DNase I (New England Biolabs, Ipswich, MA, USA). The quantity of the resulting RNA was measured using a NanoDrop ND-1000 UV/VIS spectrophotometer (NanoDrop Technologies, Wilmington, DE, USA). The quality of the RNA was evaluated by agarose gel electrophoresis by determining the integrity of the 18S and 28S RNA bands. cDNA was prepared from 1 μg of RNA in a total reaction volume of 20 μl using the High Capacity cDNA Reverse Transcription kit (Applied Biosystems, Foster City, CA, USA) according to the manufacturer’s protocol. The absence of genomic DNA was confirmed by preparing several samples without addition of reverse transcriptase. cDNA was diluted threefold in nuclease-free water for further use in qPCR experiments.
For qPCR primer design, we used a draft assembly of the Arctic charr transcriptome (Gudbrandsson et al., unpublished data). We used the high conservation of exon–intron boundaries between orthologous genes and aligned charr contigs to the genomic sequences of zebrafish and salmon orthologs from the Ensembl database (http://useast.ensembl.org/Danio_rerio/Info/Index) and salmonids species database (http://salmondb.cmm.uchile.cl/) using the National Center for Biotechnology Information Spidey software (http://www.ncbi.nlm.nih.gov/spidey). Primers were designed using Primer Express 3.0 software (Applied Biosystems) and checked for self-annealing, heterodimers and hairpin structures by using OligoAnalyzer 3.1 (Integrated DNA Technologies, Coralville, IA, USA) (Additional file 1).
Quantitative RT-PCR and analysis of expression data
RT-qPCR was performed in 96-well PCR plates on an 7500 Real-Time PCR System (Applied Biosystems) using 2× Fermentas Maxima SYBR Green qPCR Master Mix (Fisher Scientific, Pittsburgh, PA, USA) with a 10-μl final reaction volume. Each biological replicate was run in duplicate together with a no-template control in each run for each gene. RT-qPCR was performed as described previously [32]. Fluorescence signal baseline and threshold values were set manually using 7500 System SDS software (Applied Biosystems), generating a quantification of cycle (Cq) for each sample. Primer efficiency values (E) were calculated by using the LinRegPCR v11.0 programme (http://LinRegPCR.nl) [53] to analyse the fluorescence data from the exponential phase of PCR amplification for each primer pair (Additional file 1). The difference between Cq values (ΔCq) of the reference genes and the target genes was calculated for each gene t (target) as follows: ΔCqtarget = Cqtarget – Cqreference. The geometric mean of Cq values of two validated craniofacial reference genes, If5a1 and Actb, was used for ΔCq calculations [32]. All samples were then normalized to the ΔCq value of a calibrator sample to obtain a ΔΔCq value (ΔCqtarget – ΔCqcalibrator). A biological replicate from AC at 155 (τs) was chosen as the calibrator sample to calculate the differential mRNA expression of each target gene. Relative expression quantities (RQ) were calculated based on the expression level of the calibrator sample (E-ΔΔCq) [54]. The RQ values were transformed to logarithmic base 2 values (or fold differences, FD) [55] for statistical analysis. However, the nontransformed RQ values were preferred to visualize the relative expression differences. A two-way analysis of variance (ANOVA) test for the effects of morph, developmental stage (time) and morph × time interaction on expression of the candidate genes was implemented with a generalized linear model in R. Tukey’s honest significant difference (HSD) post hoc tests were used to contrast benthic and limnetic morphotypes. To assess expression similarity of the RT-qPCR-amplified genes, Pearson correlation coefficients (r) were calculated for all gene pairs using the data from all morphs and time points. R (http://www.r-project.org) was used for all statistical analyses [47].
In silicoanalysis of transcriptional binding sites
Tests for the enrichment of motifs, aimed at uncovering potential transcriptional regulators, were conducted for 17 genes in the coexpression module showing expression differences between limnetic and benthic charr. The conserved noncoding regions of each gene (including sequences in promoter and 5′ untranslated regions conserved across fish species) were retrieved using the UCSC Genome Browser (http://genome.ucsc.edu) [56]. The conserved segments for each gene were concatenated and separated by strings of ‘N’ characters to avoid generating false binding sites. The motif enrichment analysis was conducted with two programs: SCOPE (http://genie.dartmouth.edu/scope) [57] and BioProspector [58]. SCOPE utilizes three algorithms—BEAM, PRISM and SPACER—to identify nondegenerate, degenerate and bipartite motifs, respectively. The results from all three algorithms were merged and ranked based on a significance value (Sig) in SCOPE using three fish species—Danio rerio, Tetraodon nigroviridis and Oryzias latipes—with annotated genome and available background sequences in SCOPE. We retained motifs that were present in noncoding regions near at least 12 (70%) of the 17 genes. We screened for potential TF binding sites using STAMP [59], with the motifs’ position weight matrices (PWMs) retrieved from the TRANSFAC database [60]. Similar analysis was carried out using the Gibbs sampling program BioProspector [58] by setting the motif width to 8 bp. BioProspector allows using the input sequences themselves as background, so we also ran a similar analysis on a fourth fish species, Gasterosteus aculeatus, which has high-quality genome sequences available for the conserved noncoding sequences of the genes under study.
Whole-mount in situhybridization
Whole-mount in situ hybridization was performed following a standard procedure adapted for Atlantic salmon [61]. Embryos from three time points representing the early craniofacial bone and cartilage formation were fixed in 4% (m/v) paraformaldehyde/phosphate-buffered saline, dehydrated in a graded methanol series and stored in 100% methanol. Primers designed for cDNA of selected Arctic charr genes (Ctsk, Ets2, Mmp2, Ogn, Sfrp1, Sparc and Timp2) generated PCR products of around 400 to 700 bp (Additional file 1), which were cloned into a pCR4-TOPO vector (Invitrogen, Carlsbad, CA, USA) and transcribed to antisense/sense digoxigenin (DIG)-labelled cRNA probes with T3/T7 RNA polymerases (Roche Diagnostics, Basel, Switzerland). Depending on the gene, four to six embryos from each tested morph were used for in situ hybridization at each time point. After rehydration and dechorination, embryos were treated with 20 to 40 μg/ml proteinase K (New England Biolabs) for 20 to 60 minutes, depending on the developmental stage. The hybridization was performed with 1 μg/ml DIG-labelled RNA probes at 70°C for 12 hours. The hybridized embryos were incubated with alkaline phosphatase-conjugated anti-DIG antibody (Roche Diagnostics) at 4°C overnight, and the hybridization signals were visualized using nitro blue tetrazolium chloride/5-bromo-4-chloro-3-indolyl-phosphate, toluidine salt (NBT/BCIP; Roche Diagnostics). The specificity of antisense probes was also verified by running control experiments with sense probes. Samples were imaged on a Leica MZ10 F binocular microscope (Leica Microsystems).
Results
Our primary goal in this study was to analyse differences in gene expression which might contribute to the benthic–limnetic craniofacial divergence in Arctic charr. We first set out to test whether morphological differences in craniofacial elements, particularly in the feeding apparatus, are present from an early developmental stage and are not the result of plasticity induced by different feeding behaviours. Embryos reared under identical conditions were sampled upon hatching, long before first feeding, and geometric morphometrics were performed to quantify differences in craniofacial morphology (Figure 1). Our results show differences between Arctic charr morphs in both jaw and hyoid arch morphology. The first three warps (essentially principal components of shape) accounted for 71.56% of the variance. W1 (warp 1), which accounted for the largest amount of variance (44.70%) had a highly significant (P <0.001 by ANOVA) morph effect and W2 (16.59%) also differed between morphs (P <0.05), whereas W3 (10.27%) did not. Pairwise comparisons using Mahalanobis distances showed significant differences between morphs (Figure 1B, upper panel). Although significant for most comparisons (the Procrustes distances between LB and SB were not statistically significant), the shape changes between morph pairs measured by Procrustes distances were subtle (Figure 1B, lower panel). The craniofacial shape differences between morphs were further characterized with CVA. Shape changes associated with CV1 (58.5%) included changes in both the lower jaw and the hyoid arch (Figure 1C). The lower jaw is more pointed and not as wide laterally in AC as in the Thingvallavatn morphs. CV2 (25.5%) showed more subtle changes in the shape of the lower jaw and hyoid arch (Figure 1C). CV3 (16%) showed subtle changes in the shape of the hyoid arch and the distance to the ethmoid plate (Figure 1D). SB showed signs of a more subterminal mouth at this early stage. Taken together, these data confirm that distinct morphological differences are present upon hatching, well before the juveniles start active foraging and become exposed to different environmental factors that can induce differential plastic responses that affect morphology.
A conserved gene expression network with a potential link to glucocorticoid signalling
As outlined in the Background section above, we previously showed that two matrix remodelling factors, Mmp2 and Sparc, are differentially expressed between benthic and limentic Arctic charr morphotypes during the morphogenesis of craniofacial elements [32]. The expression of Mmp2 and Sparc was further analysed in dense series of samples, spanning early craniofacial chondrogenesis up to a prehatching stage (Additional file 2). The expression dynamics of these two genes were highly similar, and clear differences between benthic and limnetic morphs were observed. We therefore decided to test the hypothesis that Mmp2 and Sparc are a part of a larger expression module, or network of genes, differentially regulated between Arctic charr morphs during this stage of development. We asked which genes have conserved coexpression relationships with Mmp2 and Sparc across divergent vertebrate species. We used COXPRESdb [48] to retrieve the genes showing the strongest coexpression with both Mmp2 and Sparc in three vertebrate species (human, mouse and zebrafish). Of 347 genes coexpressed with both genes in at least one of these species, 150 were expressed during Arctic charr embryonic development, and 31 of those genes were among the genes suggested to be differentially expressed between benthic and limnetic morphotypes, based on preliminary transcriptome profiles from the SB and AC morphs (Figure 2A and Additional file 3; Gudbrandsson et al. unpublished data). Twenty-two of these genes were selected for further analysis, based on craniofacial expression pattern in zebrafish (according to the ZFIN database [49]). Figure 2B depicts the reported expression relationship between these genes, based on FunCoup analysis [50]. To characterize this coexpression module, we performed GO overrepresentation analysis on the top-ranking coexpressed genes in humans and mice (Additional file 3). The coexpression module is enriched for genes involved in extracellular matrix (ECM) organization, bone development and ossification. TF enrichment analysis on the same genes predicted several TFs as potential upstream regulators of the genes in both humans and mice (Additional file 3).
Figure 2.
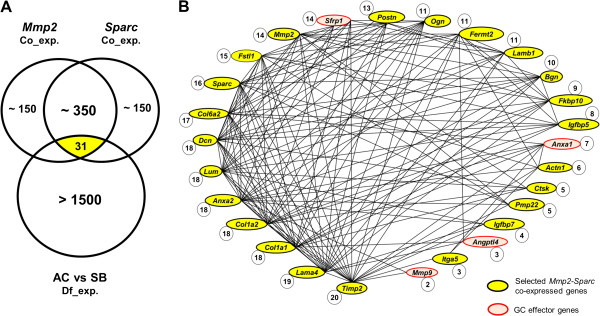
Selection of genes coexpressed with Mmp2 and Sparc in three vertebrate species. (A) A Venn diagram illustrating the overlap between Mmp2-Sparc coexpressed genes and genes showing expression differences between Arctic charr morphs in a transcriptome profile. Of the 350 genes coexpressed with both Mmp2 and Sparc, 31 genes (yellow) are differentially expressed between the aquaculture (AC) and small benthivorous (SB) morphs. (B) Of the 31 differentially expressed genes, 22 were selected on the basis of craniofacial expression in zebrafish (yellow circles), and their coexpression relationship in three vertebrate species (humans, mice and zebrafish) was depicted using FunCoup. Genes associated with glucocorticoid (GC) signalling were included in the analysis, and four of those (red circles) showed significant connection to the network. The number of connections within the network is shown beside each gene. A cutoff probabilistic confidence value of 0.5 was applied to remove the weak interactions.
Potential regulators of the developmental differences between Arctic charr morphotypes are of particular interest. Three observations led us to include GC signalling in the analysis. First, both Mmp2 and Sparc are known to be directly responsive to GC [35, 62]. Second, several of the 31 genes coexpressed with both Mmp2 and Sparc, which also showed benthic–limnetic differential expression, are known to be responsive to GC (for example, Anxa2, Ctsk, Dcn, Igfbp7, Itga5, Ogn and Pmp22 [63–68]). Third, GC signalling itself has profound effects on craniofacial morphogenesis in different vertebrate species [35, 69, 70]. Thus, we decided to examine whether other target genes and upstream effectors of GC signalling might fit to the network and show similar differences between morphs. We selected eight transcriptional targets: Mmp9, Mif, Ocln and Sfrp1, all of which show expression in the head mesenchyme and/or pharyngeal arch skeleton during zebrafish development; and Anxa1, Angptl4, Nr4a1 and Sgk1, which have less restricted expression patterns, according to the ZFIN database [35, 49, 71–77]. The eight GC upstream effectors include the GC receptor Nr3c1, two enzymes predicted to control GC levels (Hsd11b1l and Hsd11b2) and a few known modulators of GC activity, that is, the TFs P300, Cebpa, Ets1 and Ets2, and Star, an upstream component of steroidogenesis [78–84]. In addition, the TF Srebp1, which regulates the expression of Star [85] and showed differential expression between morphs in the transcriptome profiles, was selected for further analysis.
FunCoup was used to address the potential relationship between the previously selected coexpression network genes and these GC-related genes using the same cutoff value as before (pfc >0.5). Four of the GC target genes showed conserved coexpression with the network (Angptl4, Anxa1, Mmp9 and Sfrp1) (Figure 2B).
Proposed network genes show differential expression in the head of benthic and limnetic morphs
To characterize the expression of the conserved coexpression network in the developing head of Arctic charr, we profiled the relative expression of Mmp2, Sparc and ten other members of the network in four morphs at seven consecutive time points (spanning early craniofacial bone and cartilage formation to the prehatching stage). qPCR was performed on samples extracted from dissected heads of SB, LB, PL and AC embryos, and the relative expression of the genes was normalized to the expression of two stable craniofacial reference genes, Actb and If5a1 [32] (Additional file 2). The expression of all 12 genes differed significantly, both between two or more morphs and over time (by overall ANOVA and Tukey’s HSD post hoc tests) (Additional files 2 and 4). Interestingly, all of the genes showed consistently higher expression in the benthic morphs (LB and SB). The magnitude of the expression differences varied, and, for instance, Lum and Igfbp5 displayed only slight but significantly higher expression in benthic heads, whereas Timp2 had the largest expression difference (3.8-fold). The expression over time also varied by morph for all genes (morph × time effect in Additional file 4). Furthermore, an ANOVA on morphotypes confirmed significant expression differences between benthic (LB and SB) and limnetic (PL and AC) morphotypes for all 12 genes (Additional file 5). All of the proposed network genes except Lum clustered (Figure 3, black gene symbols). Nine of the genes clustered tightly, whereas Pmp22 and Timp2 were on a distinct branch together with genes associated with GC signalling (Figure 3, red gene symbols). We also clustered on samples (morph and time point) and observed significant associations of morphotypes on the two major branches (there were 4 benthic stages among 11 limnetic on one branch, and 10 benthic stages with 3 limentic on the other branch; χ2 test, df = 1, P = 0.023). A closer look at the clusters revealed that gene expression in the PL and benthic morphs was more similar at the first two time points (stages 1 and 2), whereas AC showed expression similar to benthic morphs at the last time point (stage 7) (Figure 3). Taken together, these results show significantly higher expression of members of the coexpression network in developing heads of benthic morphs.
Figure 3.
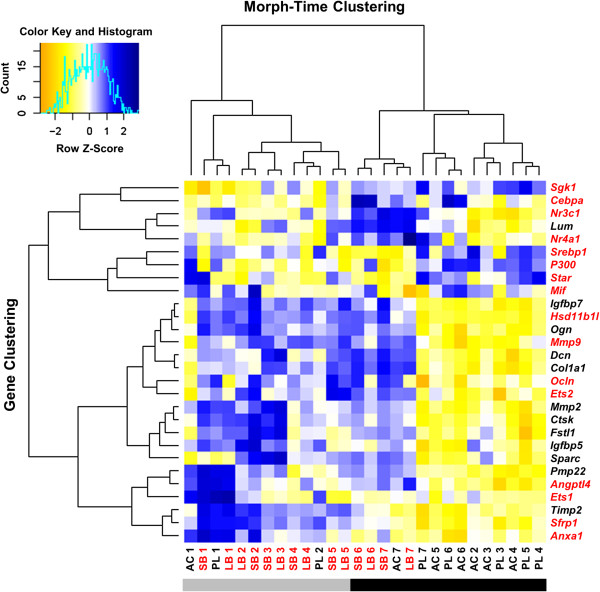
Distinct morph- and time-dependent gene expression in the developing head of Arctic charr. Heat map showing the relative expression of candidate network genes (black) and 16 genes associated with glucocorticoid (GC) signalling (red) in two limnetic morphs (black) and two benthic morphs (red) at seven developmental stages. Hierarchical clustering was performed on genes (vertical axis) and on samples (morph and timepoint, horizontal axis). Blue represents higher expression and yellow lower expression relative to the average levels across all samples. The bar below the figure underlines the two major branches of sample clustering.
Genes related to glucocorticoid signalling show transcriptional correlation with the network genes
To test whether the GC signalling pathway is involved in the observed differences in head development among Arctic charr morphs, we studied the expression of the 16 selected effectors and targets of the GC pathway. The expression of Hsd11b2 was below the detection limit of qPCR in all samples and was therefore not studied further. All of the eight downstream targets of the GC signalling pathway showed differential expression between the morphs at one or more time points (Additional files 4 and 6). Five of those—Angptl4, Anxa1, Mmp9, Ocln and Sfrp1—had higher expression in benthic morphs, similar to the twelve coexpressed genes described above (see Additional files 5 and 6). This is consistent with the coexpression data from other vertebrates, which place these genes (except Ocln) in the conserved coexpression network (Figure 2B). Sgk1 was the only gene with significantly lower expression in benthic morphs over several time points (P <0.01) (Additional files 5 and 6).
Two of the eight selected effectors of the GC pathway (the enzyme Hsd11b1l and the TF Ets2) showed consistently higher expression in developing heads of the benthic morphs (Additional files 5 and 7). Both genes also clustered tightly with the members of the conserved coexpression network (Figure 3). The expression of the GC receptor (Nr3c1) differed slightly but significantly between the limnetic and benthic morphs, but the receptor did not cluster with genes from the coexpression network. As shown in Figure 3, most of the GC-related genes are arranged on a separate branch in the hierarchical clustering. In summary, several targets of the GC pathway showed tight clustering with genes of the proposed coexpression network. Expression of the GC receptor Nr3c1 did not overlap completely with differences in network gene expression between morphs, but two effectors of the pathway—the activator Hsd11b1l, and Ets2, which can function as a coactivator for Nr3c1 transcriptional activity [79, 83]—show expression dynamics highly similar to those of the network genes.
Expression correlation analysis confirms a gene expression module differentially expressed between morphotypes
To confirm that the genes in the network identified above in other species are indeed coexpressed in Arctic charr, we calculated the Pearson correlations of expression levels of the entire data set (all 28 genes) over all morphs and time points (Figure 4). A strong correlation was seen between the genes of the proposed network (blue in Figure 4), whereas most of the GC effectors with no predicted relation to the network (according to FunCoup analysis) showed either little or negative correlation with the network genes. However, three genes from the GC set, for which less data are available in the coexpression databases (Ets2, Hsd11b1l and Ocln), had strong positive correlation with almost all of the genes in the network. Interestingly, a few genes showed significant negative correlation with the network genes (whereby the increased expression of one gene is associated with decreased expression of another), most notably P300 and Sgk1. Lum, which was originally predicted to show coexpression with Mmp2 and Sparc, does not appear to form a part of this coexpression module in developing Arctic charr heads. To conclude, the analysis confirms the existence of a coexpression network conserved between vertebrates (Figure 2B), which appears to be differentially regulated during the development of morphologically distinct groups of Arctic charr.
Figure 4.
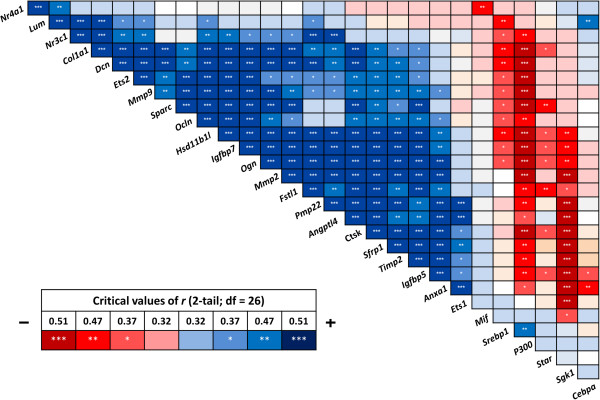
Correlation analysis reveals significant positive or negative coexpression of the candidate genes. Pearson correlation coefficient (r) was used to assess the pairwise expression similarity between the candidate genes during craniofacial development. Blue represents positive and red represents negative expression correlation. A scale showing critical values of r is depicted with corresponding colours. *P <0.05; **P <0.01; ***P <0.001.
Bioinformatics analysis reveals potential upstream regulators of the network
The data suggest that a conserved coexpression module, including bone formation genes and GC signalling components, may be associated with morphological differences in the heads of benthic and limnetic Arctic charr morphs. The tight coexpression of those 17 genes differentially expressed in benthic versus limnetic charr points to the involvement of upstream regulators. In pursuit of TFs that may regulate this expression module, we screened for overrepresented motifs in conserved noncoding regions of these 17 genes. For each gene, sequences from three fish species (D. rerio, T. nigroviridis and O. latipes) were retrieved, and SCOPE was used to screen for enriched motifs. From a list of 40 to 60 significantly enriched motifs in each fish species (Additional file 8), we retained only those present in noncoding regions of at least 12 (70%) of 17 genes. The 12 to 23 motifs per species were queried against known TF PWMs, and, by retaining only those present in all 3 species, a total of 9 potential TFs remained (Table 1). A complementary analysis with BioProspector, in which a fourth fish species, Gasterosteus aculeatus, could be added, yielded predicted binding sites for only four TFs: Atf2, Ets1, Ets2 and Tel2 (Additional file 8). In summary, the results of the motif sequence enrichment analysis suggest several TFs which may regulate most of the 17 coexpressed genes studied (Table 1). It is particularly interesting to see Ets2 among those potential regulators, as this TF is more highly expressed in benthic Arctic charr morphs and shows tight coexpression with the network genes.
Table 1.
Transcription factors binding sites identified in noncoding regions of coexpressed genes in three fish species
| Transcription factor | Transcription factor family | Motifs (coverage) and species | Matrix ID | D. rerio | O. latipes | T. nigroviridis |
|---|---|---|---|---|---|---|
| E-value | E-value | E-value | ||||
| Ap1 | Basic region leucine zipper | M00925 | 3.40E-05 | 2.98E-03 | 2.98E-03 | |
| AACTCA (82%)_D.re | M00174 | 1.00E-04 | – | – | ||
| CCTCA (94%)_O.la | M00199 | 1.40E-04 | – | – | ||
| CCTCA (88%)_T.ni | M00924 | 1.70E-04 | – | – | ||
| Ets2 | E-26 transformation specific | CTTCA (94%)_D.re | M00340 | – | 1.40E-08 | 9.18E-05 |
| ACAGGAA (75%); | ||||||
| CTTCA (100%)_O.la | M00771 | 1.00E-04 | 7.38E-06 | – | ||
| ACAGG (94%)_T.ni | ||||||
| Lmaf | Basic region leucine zipper | GTTGAC (71%)_D.re | M01139 | 5.80E-04 | 1.91E-03 | 2.06E-03 |
| AGCAA (88%); CCAGC (88%)_O.la | ||||||
| CCTGA (88%)_T.ni | ||||||
| Lyf1 | Zinc finger DNA binding | CTCTCC (77%)_D.re | M00141 | 3.20E-04 | 5.27E-06 | 5.08E-05 |
| CTCCC (81%)_O.la | ||||||
| GGAGA (100%)_T.ni | ||||||
| Maz | RGGKANNGA (77%); CTCTCC (77%); CTCHNTCC (71%)_D.re | M00649 | 2.50E-05 | 8.92E-07 | 1.18E-03 | |
| CCTCA (94%); CTCCC (81%)_O.la | ||||||
| CAGGG (88%); GGAGA (100%); CCTCA (88%); AAGGG (88%)_T.ni | ||||||
| Nfkb | Rel homology domain | M00051 | – | 8.21E-03 | – | |
| CTCTCC (77%)_D.re | M00052 | – | – | 4.49E-06 | ||
| DGRADB (100%)_O.la | M00054 | – | – | 7.14E-05 | ||
| GGAAA (88%)_T.ni | M00194 | 3.80E-03 | – | 3.87E-05 | ||
| M00208 | 3.30E-04 | – | 3.49E-05 | |||
| Sf1 | Nuclear hormone receptor | CAAGC (100%)_D.re | M00727 | 1.00E-03 | 2.15E-06 | 1.00E-03 |
| AGGTC (100%)_O.lat | M01132 | 2.02E-03 | 4.56E-06 | 1.32E-03 | ||
| CATGG (77%); AAGGG (88%); AGGCC (71%)_T.ni | ||||||
| Smad3 | Mothers against decapentaplegic | CAGAC (94%); TCTGG (88%); TCTGT (88%)_D.re | M00701 | 2.60E-06 | 6.00E-06 | 2.32E-03 |
| TCTGT (100%)_O.la | ||||||
| CAGAG (94%); CAGAA_T.ni | ||||||
| Smad4 | CAGAC (94%)_D.re | M00733 | 1.38E-03 | 8.52E-04 | 8.52E-04 | |
| GCAGC (81%)_O.la | ||||||
| GCAGC (88%)_T.ni |
Conserved noncoding regions of 17 genes, with differential expression between morphs and positive expression correlation were analysed in three fish species (D. rerio, T. nigroviridis and O. latipes). Motifs present in at least 12 of 17 genes (70% coverage) were identified by SCOPE and run against position weight matrices in the TRANSFAC database to identify known transcription factor binding sites.
Selected network genes show similar spatiotemporal expression patterns
After demonstrating quantitative differences in gene expression between morphs, we set out to analyse spatial and temporal expression patterns of the coexpression network genes in the developing head of Arctic charr. We wanted to know whether the network genes were expressed in the same tissues within the head and whether any detectable expression pattern differences would be seen between morphs. Five differentially expressed network genes (Mmp2, Sparc, Ctsk, Ogn and Sfrp1) were initially selected for whole-mount in situ hybridization studies to investigate their expression patterns, using AC as a reference morph. The expression pattern of the genes was profiled at the earliest, intermediate and latest time points under study (that is, stages 1, 3 and 7) (Figure 5A and Additional file 9). All five genes showed craniofacial expression, which was particularly pronounced in anterior and ventral facial elements and pharyngeal arches. Overlap in expression pattern was most evident in the facial area anterior to and surrounding the mouth, as well as in the lower jaw. Interestingly, at stage 3, all five genes showed a pronounced perichondrial pattern in the lower jaw (red arrows in Figure 5A).
Figure 5.
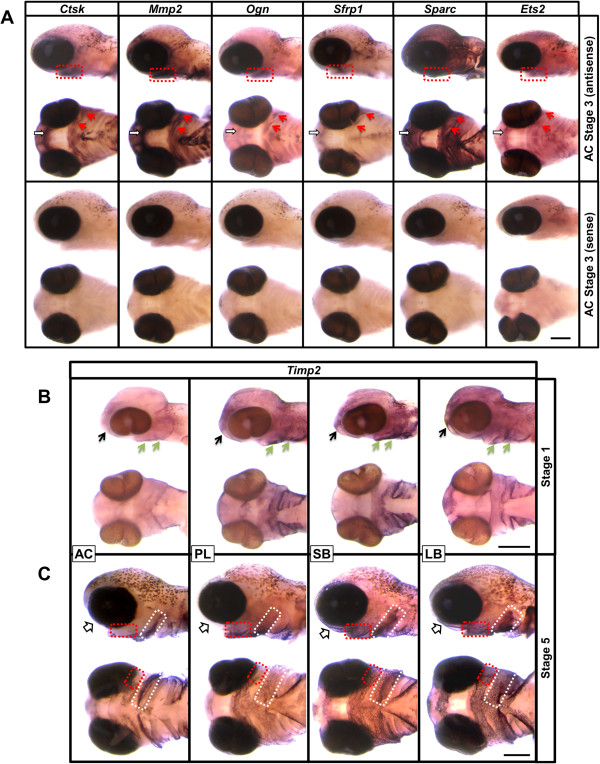
Craniofacial expression pattern of selected members of the coexpression network. (A) Whole-mount in situ hybridization for Ctsk, Mmp2, Ogn, Sfrp1 and Sparc at stage 3 in the aquaculture (AC) morph, ventral and lateral views. Expression of all genes can be seen anterior to and surrounding the mouth (white arrows), as well as in the pharyngeal arches. Overlapping expression is highly pronounced in the perichondrial region of the lower jaw (red arrows and dashed squares). (B) Comparison of Timp2 expression between the four morphs at stage 1. An overall weaker staining is obtained for Timp2 in AC compared with the other morphs. Pronounced expression of Timp2 can be seen in the frontonasal region (black arrows) and at the pharyngeal arches (green arrows). (C) At stage 5, both AC and the planktivorous (PL) morph show weaker expression of Timp2 in an area anterior to the mouth (white arrows). A clear difference between the benthic and limnetic morphs can also be seen in the expression pattern and levels of Timp2 in the pharyngeal arch region (red and white dashed squares highlight some of the differences). LB, Large benthivorous morph; SB, Small benthivorous morph. Scale bar = 1 mM.
As Ets2 was identified as a potential regulator of the network which also showed expression dynamics that correlated with the other network genes under study, we were interested in analysing its expression in situ. Indeed, we found Ets2 to be expressed in a pattern highly similar to that of the other genes (Figure 5A), which further supports our suggestion that Ets2 may be a key component in driving expression of the network genes.
No major spatial expression pattern differences were observed between the morphs (data not shown), indicating that the differential expression observed in qPCR experiments was caused mainly by differences in expression levels within tissues and not due to spatiotemporal differences in expression patterns. However, when the expression of Timp2, the factor that showed the strongest expression differences between benthic and limnetic morphs by qPCR (Additional file 2) was analysed in situ, we did observe significant differences in expression patterns between AC and the other morphs (Figures 5B and 5C). Timp2 expression was most pronounced on the ventral surface of the head. Consistent with the qPCR results, Timp2 had the lowest expression in AC at stage 1, whereas the expression was weaker in AC and PL at stage 5 than in the benthic morphs. It should be noted that at stage 5 the pattern of Timp2 expression also differed between AC and the other three morphs, with more restricted expression in posterior pharyngeal arch regions and less expression in the first pharyngeal arch and the area surrounding the mouth. Although the expression pattern of Timp2 in PL was more similar to the benthic morphs, it was reduced in an area anterior to the mouth and certain regions around the pharyngeal arches (see Figures 5B and 5C). In summary, five selected network genes (Mmp2, Sparc, Ctsk, Ogn and Sfrp1) and Ets2, a potential upstream regulator, showed similar overlapping craniofacial expression in anterior and ventral facial elements and pharyngeal arches in all four charr morphs. Only Timp2 showed spatiotemporal differences between the morphs.
Discussion
In this study, we have taken steps towards uncovering molecular mechanisms associated with the rapid and extensive phenotypic divergence of Arctic charr in Icelandic lakes. Following up on our previous finding that two ECM-associated factors related to bone development, Mmp2 and Sparc, are expressed at higher levels in benthic than in limnetic morphs [32], we asked whether they might be part of a larger set of developmental genes under common regulation, which might have a function in craniofacial development and thus contribute to the trophic differences between the benthic and limnetic morphotypes. We mined coexpression databases for genes showing coexpression with both Mmp2 and Sparc in different vertebrate species. Coexpressed genes showing craniofacial expression in zebrafish and differential expression in transcriptional profiles of two contrasting Arctic charr morphs (Gudbrandsson et al., unpublished data) were then selected for further study. This allowed the identification of a conserved network of genes which is differentially expressed between benthic and limnetic Arctic charr morphs, as well as the identification of potential upstream transcriptional regulators.
Differential expression of network genes in the developing heads of contrasting Arctic charr morphs
The fact that all the genes from the initial list of coexpression candidates that we examined in this study showed correlated expression dynamics and significantly higher expression in benthic than limnetic morphs supports the idea that a coexpression network including Mmp2 and Sparc is differentially regulated in the morphotypes. Distinct coexpression modules have been found to correlate with specific developmental stages or structures, such as in the zebrafish blastula and segmentation [86]. Although some coexpression modules are highly conserved, drift or natural selection can affect key regulators and bring about evolutionary changes [87, 88]. For instance, analyses of lake whitefish transcriptomes from adult tissues found associations between bone morphogenetic protein and calcium signalling coexpression modules, as well as the evolution of differences in the trophic apparatus and behaviour [30].
Despite the generally tight expressional correlation between the network genes, a few of the initially predicted network genes showed only partial pairwise correlation with the rest of the network. Lum is one of these genes (Figures 3 and 4). In spite of tight association with the expression of other genes of the network in other species, Lum expression dynamics correlated with only a few of them in developing Arctic charr heads. As with many of the other network genes, Lum is an ECM component and affects collagen fibril formation [89]. In Atlantic salmon, Lum is expressed at sites of endochondral and intramembranous ossification [90] and is a component of developing bone tissue in other vertebrate species [89], similarly to many of the other network genes. However, Lum is also a major proteoglycan in the cornea and sclera [91, 92], where it is likely to be independently regulated. This could mask more subtle expression dynamics and differences in other tissues of the developing head.
Potential involvement of glucocorticoids in network gene expression
The association of multiple GC transcription targets with the network led us to ask whether GC activity might be different between benthic and limnetic morphs. This is, of course, a difficult question to approach at the transcriptional level, but higher expression of an activating factor, together with higher expression of multiple target genes, might imply differential GC activity in the morphs. Sixteen genes with different association with GC signalling (steoroidogenic enzymes, the GC receptor, several transcriptional cofactors and well-established GC target genes) were selected for further study. We found that five of the eight additional GC transcriptional targets were differentially expressed between benthic and limnetic morphs and showed strong expressional correlation with the network genes (see Figure 3). Furthermore, the GC effectors Hsd11b1l and Ets2 showed a similar pattern.
During cranial skeletal development of the mouse, GC signalling has been suggested to regulate Wnt signalling in early osteoblastogenesis [69]. Wnt signalling is a pivotal pathway in controlling cranial bone formation [93] and has recently been strongly associated with the evolution of distinct craniofacial phenotypes in Lake Malawi cichlids [8]. The regulation of Wnt signalling by GCs might be conducted through an effect on the expression of the Wnt antagonist Sfrp1 [77, 94]. In zebrafish, supraphysiological GC treatment during development can lead to craniofacial abnormalities [35]. Moreover, the craniofacial abnormalities might be exerted through the other GC-responsive genes, such as Anxa1, Ctsk and Dcn, which have known effects on craniofacial formation [95–97]. GCs activate transcription through the cognate receptor Nr3c1 (GR) [98]. In addition to the action of GC through the receptor, the enzymes Hsd11b1 and Hsd11b2 modulate GC metabolism within the cell at the prereceptor level by catalysing the interconversion of hormonally active cortisol and inactive cortisone [99]. In fish, an ancestral enzyme gene named 11β-hsd3 (Hsd11b1l) is present instead of Hsd11b1 [79]. Our findings show that Hsd11b1l expression correlates well with the network genes and that Nr3c1 is expressed at higher levels in benthic morphs at certain timepoints. It is therefore possible that higher levels of GCs are present in the benthic morphs as well as a more robust response (higher GR levels).
Together, the data imply a possible interplay of GC signalling with the coexpression network which would be either direct, by driving network gene expression, or indirect, as a consequence of affecting effectors of GC activity. Analysis of conserved noncoding regions of the genes under study did not show significant enrichment for motifs matching GC-responsive elements. However, GC transcriptional activation can be mediated through interaction of the monomeric GC receptor with other DNA-bound TFs, such as Ap1 and Nfkb [98]. In addition, a synergistic transcriptional activation has been reported between the GC receptor and members of the ETS TF family in different vertebrate species (summarized in Additional file 10). It should also be noted that the genes categorised in the present study as GC targets share several different TF binding sites with other network genes, and their expression might therefore have nothing to do with GC activity.
Differences in network expression may affect matrix remodelling and ossification in the lower jaw and other orofacial elements
Common garden experiments focused on posthatching development have shown how head shape diverges among the Lake Thingvallavatn morphs. The contrasts are especially clear between the benthic and limnetic morphotypes and are reflected in functional elements, such as the relative length of the lower jaw [23]. This may be the result of a heterochronic effect whereby ossification of the dentary is initiated earlier in the benthic morphotypes (Eiriksson et al. and KHK unpublished data). At the molecular level, such divergences in the orofacial compartment can be directly associated with the network we have identified. During the morphogenetic process, the shape and size of craniofacial elements is rapidly changing, and these shape changes are likely to involve substantial matrix remodelling. Our results show that genes known to affect craniofacial morphogenesis that also play important roles in ECM deposition and remodelling display differential expression in the developing head of benthic and limnetic morphotypes. Mmp2, Mmp9, Timp2, Ctsk and Sparc all play roles in ECM remodelling [96, 100–103], and Col1a1 and the proteoglycans Lum, Ogn and Dcn are components of the ECM [89, 104, 105]. Furthermore, many of these genes are directly and indirectly associated with the ossification process itself, for example, Col1a1, Ctsk and Mmp2, which play roles in intramembranous ossification [106].
Because of this tight association of the network with osteogenic and ECM sculpting processes, we postulate that the network could play an important role in the development of subtle differences in the trophic apparatus between morphotypes via spatial and/or temporal differences in ECM deposition and ossification. This is further supported by the observed overlap in expression patterns of selected genes from the network in the perichondrial region of the forming lower jaw (Figure 5), where ossification takes place. Thus, the differences in expression levels of the network genes might result in differences in the timing and level of ossification between the morphs, as well as other effects on cell shape, cellular arrangement and migration via matrix remodelling. Such variation may play a key role in speciation via trophic divergence. For example, transcriptional heterochrony causing a delay in ossification of the lower jaw has been associated with benthic to pelagic evolution in Antarctic notothenioid fish [26]. Similar suggestions have been voiced concerning trophic divergence in cichlids [8].
The overlapping expression of the proposed network genes in developing craniofacial elements in different morphotypes both supports the network model and indicates that differences in activity, rather than spatial expression patterns, underlie the observed differences in expression levels. This does not, however, exclude the possibility that differences in expression patterns of other genes may be of importance for shaping differences between morphotypes. Interestingly, the expression pattern of Timp2 differed between the AC morph and the Lake Thingvallavatn morphs and showed visible differences in expression levels between the limnetic (PL) and benthic (SB and LB) morphs. Timp2 has a highly conserved expressional correlation with the other network genes (see Figure 2) and was also the gene showing the strongest differences between benthic and limnetic morphs in the qPCR analysis (Additional file 2). It is conceivable that some members of a gene coexpression network are more sensitive than others to variation in the expression of regulatory genes, thus showing loss of expression in tissues where the expression of other members is still retained. Depending on chromatin state and the expression of other regulatory factors, this sensitivity may vary between tissues. This might explain how differences in expression levels could relate to morphological differences.
Transcriptional regulators of the expression network
Having identified a network of differentially expressed genes with a potential role in crucial events which may underlie some of the differences between Arctic charr morphotypes, we were interested in discovering how this network might be differentially regulated between the morphs. A search for conserved motifs in three distant teleost fish species revealed potential binding sites for nine known TFs in the majority of the coexpressed genes (Table 1). Among these TFs, we found Ap1 (Jun), ETS family, Nfkb and Smad3/4 particularly interesting because of their characterized genetic interaction with genes of the network in other vertebrate species (summarized in Additional file 11). Ap1 (activating protein 1) TFs are heterodimers of Jun, Fos or Atf that bind to a common DNA site [107]. Different Ap1 factors can regulate different target genes in distinct biological processes, including normal development, depending on the relative abundance of Ap1 subunits [107]. In addition, SMAD proteins are transcriptional modulators activated by transforming growth factor β (Tgfβ) that play a crucial role in regulating the specification of cranial neural crest cells [108]. Interestingly, interdependent cooperation and synergistic transactivation between Ap1, ETS family, Nfkb and SMADs have been reported by analysis of several responsive gene promoters in other vertebrates (Additional file 10). Two ETS family members (Ets1 and Ets2) had already been selected for the present study as examples of less specific upstream effectors of GC transcriptional activity and because Ets2 overexpression in mice has been reported to cause craniofacial abnormalities [109]. The fact that Ets2 fits completely to the network described here is therefore of great interest. Ets2 expression is higher in developing heads of benthic morphs and shows both positive correlation and spatiotemporal overlap with other network genes, which suggests a functional relationship. However, more detailed analysis is needed to evaluate whether Ets2 (or some of the other predicted TFs) holds a potential master regulatory status in the coexpression network and morph-related differences and whether genetic separation in those or other regulators/binding sites have played a role in morph formation.
Evolution of gene expression networks affecting craniofacial structures in teleost fish
Gene expression studies can provide novel and valuable insights into the molecular circuitry involved in the fine-tuning of variable morphology. Nevertheless, they can only imply, not directly identify, the triggers of the molecular cascades underlying variation and divergence. In general, causative genetic or environmental differences must underlie observed differences such as those seen in the tropic apparatus of Arctic charr morphs. The identification of causal genetic changes is not trivial [110]. Such changes can, for instance, affect the regulatory regions of the genes under study, regulatory regions of other genes and coding regions of genes or noncoding RNA genes. We recently profiled microRNA (miRNA) expression at four developmental stages in the AC and SB morphs and found significant expression differences in 53 previously described and 19 novel miRNA genes [111]. We are currently examining possible links between genes of the expression network described here and differentially expressed miRNAs. Furthermore, detailed analysis of coding and noncoding regions of the different charr populations is needed to identify potentially causal genetic variation. Recently, Attanasio and colleagues [112] demonstrated how distant acting enhancers act together to generate a complex pattern of gene expression in the craniofacial compartment during mouse development. Variations in regulatory regions were experimentally shown to cause changes in craniofacial morphology and were postulated to contribute to the diversity of craniofacial shape, not only in mice but also in humans [112]. These findings also support the common notion that changes in noncoding regulatory regions, which translate to differences in developmental gene expression, are at the heart of shaping morphological differences within and between species.
The upstream regulators of the gene network shown here to be differentially expressed in charr morphotypes are obviously of focal interest, the causalities of later developmental events are also of importance when studying morph-related differences. Using a common garden setup, Parsons et al. [24, 113] studied how different ‘food environments’ could affect shape variation within and among juveniles of Arctic charr morphs and morphotypes. In general, they found that the environment could have a considerable effect on morphology, indicating phenotypic plasticity at work. However, their results also strongly suggest that the more derived morphs (such as the benthic morphs) were less responsive to differences in the food environment, potentially indicating stronger canalization of developmental trajectories. We hypothesize that the genetic and developmental roots of such canalization, which appears to be further advanced in diverging systems such as the Lake Thingvallavatn morphs [113], could reside in differential deployment or tuning of networks of coregulated genes such as the ones described here.
Conclusion
Our present study addresses the molecular mechanisms underlying the craniofacial divergence in the highly polymorphic Arctic charr. We have identified a network of coexpressed genes which are differentially expressed in benthic and limnetic morphotypes during developmental stages, spanning the emergence of craniofacial skeletal elements to hatching. Members of the gene network share biological functions mainly involved in ECM organization and skeletal formation. Moreover, coexpression connection between members of the network is conserved across distant vertebrate species, which suggests a crucial role of the genes in different developmental and physiological processes. The results of this study also predict a set of potential upstream TFs regulating the network. In particular, Ets2, a differentially expressed member of the ETS TF family shows a strong expression correlation and overlapping expression pattern in craniofacial structures with network genes. Identification of genetic differences, such as in Ets2 or other regulators, influencing this conserved expression network can cast light on the agents used by evolution to shape trophic apparatus diversity in salmonids and possibly other fishes.
Electronic supplementary material
Additional file 1: Arctic charr–specific primers for cDNA cloning and qPCR. (XLSX 13 KB)
Additional file 2: Relative expression of candidate genes in the developing head of four Arctic charr morphs. Relative expression of 12 candidate genes (with strong coexpression relationship in vertebrates) in the developing head of AC, PL, SB and LB at seven developmental stages. Gene expression was measured by qPCR, and expression levels were normalized with respect to the geometric means of two craniofacial reference genes (Actb and If5a1). The relative expression level for each gene is depicted by setting a replicate of the AC morph at stage 1 to an arbitrary unit of 1. Error bars represent standard deviation calculated from two biological replicates. The letters A, L, P and S above the bars indicate significantly higher expression than for AC, LB, PL and SB, respectively (P <0.05 calculated by Tukey’s HSD post hoc tests. (TIFF 499 KB)
Additional file 3: Ranking of genes coexpressed with both Mmp2 and Sparc , Gene Ontology (GO) and TF enrichment analyses. Genes coexpressed with both Mmp2 and Sparc in humans, mice and zebrafish were retrieved using COXPRESdb. The genes were filtered by setting the mutual rank (MR) to the top-ranked 500 and the reliability score of 3. In the list of Mmp2 and Sparc coexpressed genes, the column titled ‘Transcriptome Presence’ indicates that an orthologous gene was present in Arctic charr transcriptome profiles. ‘Differential Expression’ indicates differences in expression levels between the AC and SB morphs in the same data. ‘Craniofacial Expression’ indicates craniofacial expression in zebrafish. The last two columns were used to select genes for further analysis in Arctic charr. The top-ranked (MR scores) of genes coexpressed with both Mmp2 and Sparc for humans and mice were used as input for GO enrichment analysis using DAVID v6.7. GO terms with direct link to skeletal formation are highlighted in blue. Similar input lists of genes were used for transcription factor enrichment analysis in humans and mice through WebGestalt v2. Enriched TFs that were later predicted to be the potential regulators of the network are highlighted in orange. (XLSX 163 KB)
Additional file 4: Analyses of candidate gene expression using two-way ANOVA for effects of morph and time. Results show significant effects of morph, time and morph × time interaction on the expression of genes coexpressed with both Mmp2 and Sparc, as well as selected GC downstream genes and upstream effectors. (XLSX 15 KB)
Additional file 5: Analyses of candidate gene expression using two-way ANOVA for effects of morphotypes and time. Results show significant effects of benthic and limnetic morphotypes, time and, to lesser extent, morphotype × time interaction on the expression of genes coexpressed with Mmp2 and Sparc, as well as selected GC downstream genes and upstream effectors. (XLSX 15 KB)
Additional file 6: Relative expression of eight downstream transcriptional targets of GC signalling. Relative expression of candidate genes in the developing head of AC, PL, SB and LB at seven developmental stages, as measured by qPCR. Gene expression levels were normalized with respect to the geometric means of two craniofacial reference genes (Actb and If5a1). The relative expression level for each gene is depicted by setting a replicate of the AC morph at stage 1 to an arbitrary unit of 1. Error bars represent standard deviation calculated from two biological replicates. The letters A, L, P and S above the bars indicate significantly higher expression than in AC, LB, PL and SB, respectively (P <0.05) as calculated by Tukey’s HSD post hoc tests. (TIFF 358 KB)
Additional file 7: Relative expression of eight upstream effectors of GC signalling. Relative expression of candidate genes in the developing head of AC, PL, SB and LB at seven developmental stages, as measured by qPCR. Gene expression levels were normalized with respect to the geometric means of two craniofacial reference genes (Actb and If5a1). The relative expression level for each gene is depicted by setting a replicate of the AC morph at stage 1 to an arbitrary unit of 1. Error bars represent standard deviation calculated from two biological replicates. The letters A, L, P and S above the bars indicate significantly higher expression than in AC, LB, PL and SB, respectively (P <0.05) as calculated by Tukey’s HSD post hoc tests. (TIFF 339 KB)
Additional file 8: Motif sequence enrichment analysis of candidate genes. Two lists of motif sequences identified by SCOPE and transcription factor binding sites predicted by BioProspector in conserved noncoding regions of 17 coexpressed genes in three and four teleost fish species, respectively. The motifs identified by BioProspector were run against known PWMs in the TRANSFAC database using the STAMP tool. (XLSX 36 KB)
Additional file 9: Craniofacial expression pattern of selected members of the coexpression network. In situ hybridization revealing the anterior and ventral craniofacial expression pattern of Ctsk, Mmp2, Ogn, Sfrp1, Sparc and Ets2 at stage 1 (A) and stage 7 (B), ventral and lateral views showing the overlapping expression of the genes in the facial area anterior to and surrounding the mouth, as well as in the pharyngeal arches. Sparc displays ubiquitous and relatively less specific expression pattern during head development, and the expression of Sfrp1 is hardly detectable at the last time point. Dashed red boxes emphasize on important expression patterns. Scale bar = 1 mM. (TIFF 6 MB)
Additional file 10: A summary of known interactions between the predicted transcription factors in different vertebrate species. (PDF 448 KB)
Additional file 11: Regulatory interactions between predicted transcription factors and candidate genes in different vertebrate species. (PDF 476 KB)
Acknowledgements
This project was supported by The Icelandic Centre for Research (RANNIS/IRF, grant 100204) and The University of Iceland Research Fund. The authors thank James McEwan, Dan Macqueen and Ian Johnston for their help with various aspects of setting up the in situ staining and Laurene Alicia Lecaudey for assistance in the laboratory. They also acknowledge Bjarni K Kristjánsson, Einar Svavarsson and Soizic Le Deuff for their assistance with sampling the parents, setting up crosses and maintenance and sampling of the embryos.
Abbreviations
- AC
Aquaculture fish stock
- Cq
Cycle quantification
- ECM
Extracellular matrix
- GC
Glucocorticoid
- LB
Large benthivorous charr
- PI
Piscivorous charr
- PL
Planktivorous charr
- PWM
Motifs position weight matrix
- RT-qPCR
reverse transcription quantitative polymerase chain reaction
- RQ
Relative expression quantity
- SB
Small benthivorous charr
- TF
Transcription factor
- τs
Tau-somite relative age.
Footnotes
Competing interests
The authors declare that they have no competing interests.
Authors’ contributions
EPA performed most experiments, conducted data analysis and drafted the manuscript. KHK performed morphometric analysis. AP and JG assisted in statistical data analysis. VHM set up in situ hybridization experiments. AP, SRF, SSS, VHM and ZOJ conceived of and designed the experiments, acquired funding and edited and revised the manuscript. All authors read and approved the final manuscript.
Contributor Information
Ehsan Pashay Ahi, Email: epa1@hi.is.
Kalina Hristova Kapralova, Email: khk2@hi.is.
Arnar Pálsson, Email: apalsson@hi.is.
Valerie Helene Maier, Email: valerie@hi.is.
Jóhannes Gudbrandsson, Email: jog7@hi.is.
Sigurdur S Snorrason, Email: sigsnor@hi.is.
Zophonías O Jónsson, Email: zjons@hi.is.
Sigrídur Rut Franzdóttir, Email: sirrut@hi.is.
References
- 1.Albertson RC, Kocher TD. Genetic and developmental basis of cichlid trophic diversity. Heredity. 2006;97:211–221. doi: 10.1038/sj.hdy.6800864. [DOI] [PubMed] [Google Scholar]
- 2.Mabuchi K, Miya M, Azuma Y, Nishida M. Independent evolution of the specialized pharyngeal jaw apparatus in cichlid and labrid fishes. BMC Evol Biol. 2007;7:10. doi: 10.1186/1471-2148-7-10. [DOI] [PMC free article] [PubMed] [Google Scholar]
- 3.Ward AJW, Webster MM, Hart PJB. Intraspecific food competition in fishes. Fish Fish. 2006;7:231–261. doi: 10.1111/j.1467-2979.2006.00224.x. [DOI] [Google Scholar]
- 4.Whiteley AR. Trophic polymorphism in a riverine fish: morphological, dietary, and genetic analysis of mountain whitefish. Biol J Linn Soc. 2007;92:253–267. doi: 10.1111/j.1095-8312.2007.00845.x. [DOI] [Google Scholar]
- 5.Jeffery WR. Chapter 8. Evolution and development in the cavefish Astyanax. Curr Top Dev Biol. 2009;86:191–221. doi: 10.1016/S0070-2153(09)01008-4. [DOI] [PMC free article] [PubMed] [Google Scholar]
- 6.Helms JA, Cordero D, Tapadia MD. New insights into craniofacial morphogenesis. Development. 2005;132:851–861. doi: 10.1242/dev.01705. [DOI] [PubMed] [Google Scholar]
- 7.Yelick PC, Schilling TF. Molecular dissection of craniofacial development using zebrafish. Crit Rev Oral Biol Med. 2002;13:308–322. doi: 10.1177/154411130201300402. [DOI] [PubMed] [Google Scholar]
- 8.Parsons KJ, Trent Taylor A, Powder KE, Albertson RC. Wnt signalling underlies the evolution of new phenotypes and craniofacial variability in Lake Malawi cichlids. Nat Commun. 2014;5:3629. doi: 10.1038/ncomms4629. [DOI] [PMC free article] [PubMed] [Google Scholar]
- 9.Ekblom R, Galindo J. Applications of next generation sequencing in molecular ecology of non-model organisms. Heredity. 2011;107:1–15. doi: 10.1038/hdy.2010.152. [DOI] [PMC free article] [PubMed] [Google Scholar]
- 10.Hinaux H, Poulain J, Da Silva C, Noirot C, Jeffery WR, Casane D, Rétaux S. De novo sequencing of Astyanax mexicanus surface fish and Pachón cavefish transcriptomes reveals enrichment of mutations in cavefish putative eye genes. PLoS One. 2013;8:e53553. doi: 10.1371/journal.pone.0053553. [DOI] [PMC free article] [PubMed] [Google Scholar]
- 11.Snorrason SS, Skúlason S. Adaptive speciation in northern freshwater fishes. In: Dieckmann U, Doebeli M, Metz JAJ, Tautz D, editors. Adaptive Speciation (Cambridge Studies in Adaptive Dynamics No. 3) Cambridge, UK: Cambridge University Press; 2004. pp. 210–228. [Google Scholar]
- 12.Skúlason S, Smith TB. Resource polymorphisms in vertebrates. Trends Ecol Evol. 1995;10:366–370. doi: 10.1016/S0169-5347(00)89135-1. [DOI] [PubMed] [Google Scholar]
- 13.Jonsson B, Jonsson N. Polymorphism and speciation in Arctic charr. J Fish Biol. 2001;58:605–638. doi: 10.1111/j.1095-8649.2001.tb00518.x. [DOI] [Google Scholar]
- 14.Brunner PC, Douglas MR, Osinov A, Wilson CC, Bernatchez L. Holarctic phylogeography of Arctic charr (Salvelinus alpinus L.) inferred from mitochondrial DNA sequences. Evolution. 2001;55:573–586. doi: 10.1554/0014-3820(2001)055[0573:HPOACS]2.0.CO;2. [DOI] [PubMed] [Google Scholar]
- 15.Skúlason S, Snorrason SS, Noakes DLG, Ferguson MM, Malmquist HJ. Segregation in spawning and early life history among polymorphic Arctic charr, Salvelinus alpinus, in Thingvallavatn, Iceland. J Fish Biol. 2006;35(Suppl sA):225–232. doi: 10.1111/j.1095-8649.1989.tb03065.x. [DOI] [Google Scholar]
- 16.Snorrason SS, Skúlason S, Jonsson B, Malquist HJ, Jonasson PM, Sandlund OT, Lindem T. Trophic specialization in Arctic charr Salvelinus alpinus (Pisces; Salmonidae): morphological divergence and ontogenetic niche shifts. Biol J Linn Soc. 1994;52:1–18. doi: 10.1111/j.1095-8312.1994.tb00975.x. [DOI] [Google Scholar]
- 17.Malmquist H, Snorrason S, Skúlason S, Jonsson B, Sandlund O, Jonasson P. Diet differentiation in polymorphic Arctic charr in Thingvallavatn, Iceland. J Anim Ecol. 1992;61:21–35. doi: 10.2307/5505. [DOI] [Google Scholar]
- 18.Sandlund T, Gunnarsson K, Jónasson P, Jonsson B, Lindem T, Magnússon K, Malmquist H, Sigurjónsdóttir H, Skúlason S, Snorrason S. The Arctic charr Salvelinus alpinus in Thingvallavatn. Oikos. 1992;64:305–351. doi: 10.2307/3545056. [DOI] [Google Scholar]
- 19.Jonsson B, Skúlason S, Snorrason SS, Sandlund OT, Malmquist HJ, Jónasson PM, Cydemo R, Lindem T. Life history variation of polymorphic Arctic charr (Salvelinus alpinus) in Thingvallavatn, Iceland. Can J Fish Aquat Sci. 1988;45:1537–1547. doi: 10.1139/f88-182. [DOI] [Google Scholar]
- 20.Kapralova KH, Morrissey MB, Kristjánsson BK, Olafsdóttir GÁ, Snorrason SS, Ferguson MM. Heredity (Edinb) 2011. Evolution of adaptive diversity and genetic connectivity in Arctic charr (Salvelinus alpinus) in Iceland; pp. 472–487. [DOI] [PMC free article] [PubMed] [Google Scholar]
- 21.Kapralova KH, Gudbrandsson J, Reynisdottir S, Santos CB, Baltanás VC, Maier VH, Snorrason SS, Palsson A. Differentiation at the MHCIIα and Cath2 loci in sympatric Salvelinus alpinus resource morphs in Lake Thingvallavatn. PLoS One. 2013;8:e69402. doi: 10.1371/journal.pone.0069402. [DOI] [PMC free article] [PubMed] [Google Scholar]
- 22.Skúlason S, Noakess D, Snorrason S. Ontogeny of trophic morphology in four sympatric morphs of Arctic charr Salvelinus alpinus in Thingvallavatn, Iceland. Biol J Linn Soc. 1989;38:281–301. doi: 10.1111/j.1095-8312.1989.tb01579.x. [DOI] [Google Scholar]
- 23.Eiriksson GM, Skulason S, Snorrason SS. Heterochrony in skeletal development and body size in progeny of two morphs of Arctic charr from Thingvallavatn, Iceland. J Fish Biol. 1999;55:175–185. doi: 10.1111/j.1095-8649.1999.tb01054.x. [DOI] [Google Scholar]
- 24.Parsons KJ, Skúlason S, Ferguson M. Morphological variation over ontogeny and environments in resource polymorphic Arctic charr (Salvelinus alpinus) Evol Dev. 2010;12:246–257. doi: 10.1111/j.1525-142X.2010.00410.x. [DOI] [PubMed] [Google Scholar]
- 25.Boughton DA, Collette BB, McCune AR. Heterochrony in jaw morphology of needlefishes (Teleostei: Belonidae) Syst Biol. 1991;40:329–354. doi: 10.1093/sysbio/40.3.329. [DOI] [Google Scholar]
- 26.Albertson RC, Yan YL, Titus TA, Pisano E, Vacchi M, Yelick PC, Detrich HW, 3rd, Postlethwait JH. Molecular pedomorphism underlies craniofacial skeletal evolution in Antarctic notothenioid fishes. BMC Evol Biol. 2010;10:4. doi: 10.1186/1471-2148-10-4. [DOI] [PMC free article] [PubMed] [Google Scholar]
- 27.Gunter HM, Koppermann C, Meyer A. Revisiting de Beer’s textbook example of heterochrony and jaw elongation in fish: calmodulin expression reflects heterochronic growth, and underlies morphological innovation in the jaws of belonoid fishes. EvoDevo. 2014;5:8. doi: 10.1186/2041-9139-5-8. [DOI] [PMC free article] [PubMed] [Google Scholar]
- 28.Sibthorpe D, Sturlaugsdóttir R, Kristjansson BK, Thorarensen H, Skúlason S, Johnston IA. Characterisation and expression of the paired box protein 7 (Pax7) gene in polymorphic Arctic charr (Salvelinus alpinus) Comp Biochem Physiol B Biochem Mol Biol. 2006;145:371–383. doi: 10.1016/j.cbpb.2006.08.013. [DOI] [PubMed] [Google Scholar]
- 29.Stern DL. The genetic causes of convergent evolution. Nat Rev Genet. 2013;14:751–764. doi: 10.1038/nrg3483. [DOI] [PubMed] [Google Scholar]
- 30.Filteau M, Pavey SA, St-Cyr J, Bernatchez L. Gene coexpression networks reveal key drivers of phenotypic divergence in lake whitefish. Mol Biol Evol. 2013;30:1384–1396. doi: 10.1093/molbev/mst053. [DOI] [PubMed] [Google Scholar]
- 31.Macqueen DJ, Kristjánsson BK, Paxton CGM, Vieira VLA, Johnston IA. The parallel evolution of dwarfism in Arctic charr is accompanied by adaptive divergence in mTOR-pathway gene expression. Mol Ecol. 2011;20:3167–3184. doi: 10.1111/j.1365-294X.2011.05172.x. [DOI] [PubMed] [Google Scholar]
- 32.Ahi EP, Guðbrandsson J, Kapralova KH, Franzdóttir SR, Snorrason SS, Maier VH, Jónsson ZO. Validation of reference genes for expression studies during craniofacial development in Arctic charr. PLoS One. 2013;8:e66389. doi: 10.1371/journal.pone.0066389. [DOI] [PMC free article] [PubMed] [Google Scholar]
- 33.Rotllant J, Liu D, Yan Y, Postlethwait JH, Westerfield M, Du S. Sparc (Osteonectin) functions in morphogenesis of the pharyngeal skeleton and inner ear. Matrix Biol. 2008;27:561–572. doi: 10.1016/j.matbio.2008.03.001. [DOI] [PMC free article] [PubMed] [Google Scholar]
- 34.Renn J, Schaedel M, Volff JN, Goerlich R, Schartl M, Winkler C. Dynamic expression of sparc precedes formation of skeletal elements in the Medaka (Oryzias latipes) Gene. 2006;372:208–218. doi: 10.1016/j.gene.2006.01.011. [DOI] [PubMed] [Google Scholar]
- 35.Hillegass JM, Villano CM, Cooper KR, White LA. Glucocorticoids alter craniofacial development and increase expression and activity of matrix metalloproteinases in developing zebrafish (Danio rerio) Toxicol Sci. 2008;102:413–424. doi: 10.1093/toxsci/kfn010. [DOI] [PubMed] [Google Scholar]
- 36.Bonventre JA, White LA, Cooper KR. Craniofacial abnormalities and altered wnt and mmp mRNA expression in zebrafish embryos exposed to gasoline oxygenates ETBE and TAME. Aquat Toxicol. 2012;120–121:45–53. doi: 10.1016/j.aquatox.2012.04.008. [DOI] [PMC free article] [PubMed] [Google Scholar]
- 37.Mosig RA, Dowling O, DiFeo A, Ramirez MCM, Parker IC, Abe E, Diouri J, Al AA, Wylie JD, Oblander SA, Madri J, Bianco P, Apte SS, Zaidi M, Doty SB, Majeska RJ, Schaffler MB, Martignetti JA. Loss of MMP-2 disrupts skeletal and craniofacial development and results in decreased bone mineralization, joint erosion and defects in osteoblast and osteoclast growth. Hum Mol Genet. 2007;16:1113–1123. doi: 10.1093/hmg/ddm060. [DOI] [PMC free article] [PubMed] [Google Scholar]
- 38.Seet LF, Su R, Toh LZ, Wong TT. In vitro analyses of the anti-fibrotic effect of SPARC silencing in human Tenon’s fibroblasts: comparisons with mitomycin C. J Cell Mol Med. 2012;16:1245–1259. doi: 10.1111/j.1582-4934.2011.01400.x. [DOI] [PMC free article] [PubMed] [Google Scholar]
- 39.Li B, Li F, Chi L, Zhang L, Zhu S. The expression of SPARC in human intracranial aneurysms and its relationship with MMP-2/-9. PLoS One. 2013;8:e58490. doi: 10.1371/journal.pone.0058490. [DOI] [PMC free article] [PubMed] [Google Scholar]
- 40.Yamanaka M, Kanda K, Li NC, Fukumori T, Oka N, Kanayama HO, Kagawa S. Analysis of the gene expression of SPARC and its prognostic value for bladder cancer. J Urol. 2001;166:2495–2499. doi: 10.1016/S0022-5347(05)65623-6. [DOI] [PubMed] [Google Scholar]
- 41.Gorodilov YN. Description of the early ontogeny of the Atlantic salmon, Salmo salar, with a novel system of interval (state) identification. Environ Biol Fishes. 1996;47:109–127. doi: 10.1007/BF00005034. [DOI] [Google Scholar]
- 42.Walker MB, Kimmel CB. A two-color acid-free cartilage and bone stain for zebrafish larvae. Biotech Histochem. 2007;82:23–28. doi: 10.1080/10520290701333558. [DOI] [PubMed] [Google Scholar]
- 43.Rohlf FJ: tps series software.http://life.bio.sunysb.edu/morph/soft-tps.html (accessed 25 September 2014)
- 44.Klingenberg CP. MorphoJ: an integrated software package for geometric morphometrics. Mol Ecol Resour. 2011;11:353–357. doi: 10.1111/j.1755-0998.2010.02924.x. [DOI] [PubMed] [Google Scholar]
- 45.Rohlf FJ, Slice D. Extensions of the Procrustes method for the optimal superimposition of landmarks. Syst Zool. 1990;39:40–59. doi: 10.2307/2992207. [DOI] [Google Scholar]
- 46.Klingenberg CP, Barluenga M, Meyer A. Shape analysis of symmetric structures: quantifying variation among individuals and asymmetry. Evolution. 2002;56:1909–1920. doi: 10.1111/j.0014-3820.2002.tb00117.x. [DOI] [PubMed] [Google Scholar]
- 47.R Core Team . R: A Language and Environment for Statistical Computing. Vienna: R Foundation for Statistical Computing; 2013. [Google Scholar]
- 48.Obayashi T, Kinoshita K. COXPRESdb: a database to compare gene coexpression in seven model animals. Nucleic Acids Res. 2011;39(Database issue):D1016–D1022. doi: 10.1093/nar/gkq1147. [DOI] [PMC free article] [PubMed] [Google Scholar]
- 49.Bradford Y, Conlin T, Dunn N, Fashena D, Frazer K, Howe DG, Knight J, Mani P, Martin R, Moxon SAT, Paddock H, Pich C, Ramachandran S, Ruef BJ, Ruzicka L, Bauer Schaper H, Schaper K, Shao X, Singer A, Sprague J, Sprunger B, Van Slyke C, Westerfield M. ZFIN: enhancements and updates to the Zebrafish Model Organism Database. Nucleic Acids Res. 2011;39(Database issue):D822–D829. doi: 10.1093/nar/gkq1077. [DOI] [PMC free article] [PubMed] [Google Scholar]
- 50.Alexeyenko A, Sonnhammer ELL. Global networks of functional coupling in eukaryotes from comprehensive data integration. Genome Res. 2009;19:1107–1116. doi: 10.1101/gr.087528.108. [DOI] [PMC free article] [PubMed] [Google Scholar]
- 51.Huang DW, Sherman BT, Lempicki RA. Systematic and integrative analysis of large gene lists using DAVID bioinformatics resources. Nat Protoc. 2009;4:44–57. doi: 10.1038/nprot.2008.211. [DOI] [PubMed] [Google Scholar]
- 52.Wang J, Duncan D, Shi Z, Zhang B. WEB-based GEne SeT AnaLysis Toolkit (WebGestalt): update 2013. Nucleic Acids Res. 2013;41(Web Server issue):W77–W83. doi: 10.1093/nar/gkt439. [DOI] [PMC free article] [PubMed] [Google Scholar]
- 53.Ramakers C, Ruijter JM, Deprez RHL, Moorman AF. Assumption-free analysis of quantitative real-time polymerase chain reaction (PCR) data. Neurosci Lett. 2003;339:62–66. doi: 10.1016/S0304-3940(02)01423-4. [DOI] [PubMed] [Google Scholar]
- 54.Pfaffl MW. A new mathematical model for relative quantification in real-time RT-PCR. Nucleic Acids Res. 2001;29:e45. doi: 10.1093/nar/29.9.e45. [DOI] [PMC free article] [PubMed] [Google Scholar]
- 55.Bergkvist A, Rusnakova V, Sindelka R, Garda JMA, Sjögreen B, Lindh D, Forootan A, Kubista M. Gene expression profiling–clusters of possibilities. Methods. 2010;50:323–335. doi: 10.1016/j.ymeth.2010.01.009. [DOI] [PubMed] [Google Scholar]
- 56.Meyer LR, Zweig AS, Hinrichs AS, Karolchik D, Kuhn RM, Wong M, Sloan CA, Rosenbloom KR, Roe G, Rhead B, Raney BJ, Pohl A, Malladi VS, Li CH, Lee BT, Learned K, Kirkup V, Hsu F, Heitner S, Harte RA, Haeussler M, Guruvadoo L, Goldman M, Giardine BM, Fujita PA, Dreszer TR, Diekhans M, Cline MS, Clawson H, Barber GP, et al. The UCSC Genome Browser database: extensions and updates 2013. Nucleic Acids Res. 2013;41(Database issue):D64–D69. doi: 10.1093/nar/gks1048. [DOI] [PMC free article] [PubMed] [Google Scholar]
- 57.Carlson JM, Chakravarty A, DeZiel CE, Gross RH. SCOPE: a web server for practical de novo motif discovery. Nucleic Acids Res. 2007;35(Web Server issue):W259–W264. doi: 10.1093/nar/gkm310. [DOI] [PMC free article] [PubMed] [Google Scholar]
- 58.Liu X, Brutlag DL, Liu JS. BioProspector: discovering conserved DNA motifs in upstream regulatory regions of co-expressed genes. Pac Symp Biocomput. 2001;6:127–138. [PubMed] [Google Scholar]
- 59.Mahony S, Benos PV. STAMP: a web tool for exploring DNA-binding motif similarities. Nucleic Acids Res. 2007;35(Web Server issue):W253–W258. doi: 10.1093/nar/gkm272. [DOI] [PMC free article] [PubMed] [Google Scholar]
- 60.Matys V, Fricke E, Geffers R, Gößling E, Haubrock M, Hehl R, Hornischer K, Karas D, Kel AE, Kel-Margoulis OV, Kloos DU, Land S, Lewicki-Potapov B, Michael H, Münch R, Reuter I, Rotert S, Saxel H, Scheer M, Thiele S, Wingender E. TRANSFAC: transcriptional regulation, from patterns to profiles. Nucleic Acids Res. 2003;31:374–378. doi: 10.1093/nar/gkg108. [DOI] [PMC free article] [PubMed] [Google Scholar]
- 61.Macqueen DJ, Johnston IA. Evolution of follistatin in teleosts revealed through phylogenetic, genomic and expression analyses. Dev Genes Evol. 2008;218:1–14. doi: 10.1007/s00427-007-0194-8. [DOI] [PubMed] [Google Scholar]
- 62.Ng KW, Manji SS, Young MF, Findlay DM. Opposing influences of glucocorticoid and retinoic acid on transcriptional control in preosteoblasts. Mol Endocrinol. 1989;3:2079–2085. doi: 10.1210/mend-3-12-2079. [DOI] [PubMed] [Google Scholar]
- 63.Yao W, Cheng Z, Busse C, Pham A, Nakamura MC, Lane NE. Glucocorticoid excess in mice results in early activation of osteoclastogenesis and adipogenesis and prolonged suppression of osteogenesis: a longitudinal study of gene expression in bone tissue from glucocorticoid-treated mice. Arthritis Rheum. 2008;58:1674–1686. doi: 10.1002/art.23454. [DOI] [PMC free article] [PubMed] [Google Scholar]
- 64.Kimoto S, Cheng SL, Zhang SF, Avioli LV. The effect of glucocorticoid on the synthesis of biglycan and decorin in human osteoblasts and bone marrow stromal cells. Endocrinology. 1994;135:2423–2431. doi: 10.1210/endo.135.6.7988427. [DOI] [PubMed] [Google Scholar]
- 65.Pereira RC, Blanquaert F, Canalis E. Cortisol enhances the expression of mac25/insulin-like growth factor-binding protein-related protein-1 in cultured osteoblasts. Endocrinology. 1999;140:228–232. doi: 10.1210/endo.140.1.6411. [DOI] [PubMed] [Google Scholar]
- 66.Hamidouche Z, Fromigué O, Ringe J, Häupl T, Vaudin P, Pagès JC, Srouji S, Livne E, Marie PJ. Priming integrin α5 promotes human mesenchymal stromal cell osteoblast differentiation and osteogenesis. Proc Natl Acad Sci U S A. 2009;106:18587–18591. doi: 10.1073/pnas.0812334106. [DOI] [PMC free article] [PubMed] [Google Scholar]
- 67.Zhang XN, Xue LQ, Jiang H, Yang SY, Song HD, Ma QY. The mechanism of mimecan transcription induced by glucocorticoid in pituitary corticotroph cells. Mol Cell Biochem. 2012;360:321–328. doi: 10.1007/s11010-011-1071-3. [DOI] [PubMed] [Google Scholar]
- 68.Désarnaud F, Bidichandani S, Patel PI, Baulieu EE, Schumacher M. Glucocorticosteroids stimulate the activity of the promoters of peripheral myelin protein-22 and protein zero genes in Schwann cells. Brain Res. 2000;865:12–16. doi: 10.1016/S0006-8993(00)02130-2. [DOI] [PubMed] [Google Scholar]
- 69.Zhou H, Mak W, Kalak R, Street J, Fong-Yee C, Zheng Y, Dunstan CR, Seibel MJ. Glucocorticoid-dependent Wnt signaling by mature osteoblasts is a key regulator of cranial skeletal development in mice. Development. 2009;136:427–436. doi: 10.1242/dev.027706. [DOI] [PubMed] [Google Scholar]
- 70.Hillegass JM, Villano CM, Cooper KR, White LA. Matrix metalloproteinase-13 is required for zebra fish (Danio rerio) development and is a target for glucocorticoids. Toxicol Sci. 2007;100:168–179. doi: 10.1093/toxsci/kfm192. [DOI] [PubMed] [Google Scholar]
- 71.Calandra T, Bernhagen J, Metz CN, Spiegel LA, Bacher M, Donnelly T, Cerami A, Bucala R. MIF as a glucocorticoid-induced modulator of cytokine production. Nature. 1995;377:68–71. doi: 10.1038/377068a0. [DOI] [PubMed] [Google Scholar]
- 72.Koliwad SK, Kuo T, Shipp LE, Gray NE, Backhed F, So AYL, Farese RV, Jr, Wang JC. Angiopoietin-like 4 (ANGPTL4, fasting-induced adipose factor) is a direct glucocorticoid receptor target and participates in glucocorticoid-regulated triglyceride metabolism. J Biol Chem 2009, 284:25593–25601. A published erratum appears in. J Biol Chem. 2012;287:4394. doi: 10.1074/jbc.A109.025452. [DOI] [PMC free article] [PubMed] [Google Scholar]
- 73.Webster MK, Goya L, Ge Y, Maiyar AC, Firestone GL. Characterization of sgk, a novel member of the serine/threonine protein kinase gene family which is transcriptionally induced by glucocorticoids and serum. Mol Cell Biol. 1993;13:2031–2040. doi: 10.1128/MCB.13.4.2031. [DOI] [PMC free article] [PubMed] [Google Scholar]
- 74.Martin LJ, Tremblay JJ. Glucocorticoids antagonize cAMP-induced Star transcription in Leydig cells through the orphan nuclear receptor NR4A1. J Mol Endocrinol. 2008;41:165–175. doi: 10.1677/JME-07-0145. [DOI] [PubMed] [Google Scholar]
- 75.Chasiotis H, Wood CM, Kelly SP. Cortisol reduces paracellular permeability and increases occludin abundance in cultured trout gill epithelia. Mol Cell Endocrinol. 2010;323:232–238. doi: 10.1016/j.mce.2010.02.030. [DOI] [PubMed] [Google Scholar]
- 76.Perretti M, D’Acquisto F. Annexin A1 and glucocorticoids as effectors of the resolution of inflammation. Nat Rev Immunol. 2009;9:62–70. doi: 10.1038/nri2470. [DOI] [PubMed] [Google Scholar]
- 77.Wang FS, Lin CL, Chen YJ, Wang CJ, Yang KD, Huang YT, Sun YC, Huang HC. Secreted frizzled-related protein 1 modulates glucocorticoid attenuation of osteogenic activities and bone mass. Endocrinology. 2005;146:2415–2423. doi: 10.1210/en.2004-1050. [DOI] [PubMed] [Google Scholar]
- 78.Beato M, Klug J. Steroid hormone receptors: an update. Hum Reprod Update. 2000;6:225–236. doi: 10.1093/humupd/6.3.225. [DOI] [PubMed] [Google Scholar]
- 79.Baker ME. Evolutionary analysis of 11β-hydroxysteroid dehydrogenase-type 1, -type 2, -type 3 and 17β-hydroxysteroid dehydrogenase-type 2 in fish. FEBS Lett. 2004;574:167–170. doi: 10.1016/j.febslet.2004.08.023. [DOI] [PubMed] [Google Scholar]
- 80.Kino T, Nordeen SK, Chrousos GP. Conditional modulation of glucocorticoid receptor activities by CREB-binding protein (CBP) and p300. J Steroid Biochem Mol Biol. 1999;70:15–25. doi: 10.1016/S0960-0760(99)00100-4. [DOI] [PubMed] [Google Scholar]
- 81.Rüdiger JJ, Roth M, Bihl MP, Cornelius BC, Johnson M, Ziesche R, Block L-H. Interaction of C/EBPα and the glucocorticoid receptor in vivo and in nontransformed human cells. FASEB J. 2002;16:177–184. doi: 10.1096/fj.01-0226com. [DOI] [PubMed] [Google Scholar]
- 82.Geng C, Vedeckis WV. c-Myb and members of the c-Ets family of transcription factors act as molecular switches to mediate opposite steroid regulation of the human glucocorticoid receptor 1A promoter. J Biol Chem. 2005;280:43264–43271. doi: 10.1074/jbc.M508245200. [DOI] [PubMed] [Google Scholar]
- 83.Mullick J, Anandatheerthavarada HK, Amuthan G, Bhagwat SV, Biswas G, Camasamudram V, Bhat NK, Reddy SE, Rao V, Avadhani NG. Physical interaction and functional synergy between glucocorticoid receptor and Ets2 proteins for transcription activation of the rat cytochrome P-450c27 promoter. J Biol Chem. 2001;276:18007–18017. doi: 10.1074/jbc.M100671200. [DOI] [PubMed] [Google Scholar]
- 84.Hasegawa T, Zhao L, Caron KM, Majdic G, Suzuki T, Shizawa S, Sasano H, Parker KL. Developmental roles of the steroidogenic acute regulatory protein (StAR) as revealed by StAR knockout mice. Mol Endocrinol. 2000;14:1462–1471. doi: 10.1210/mend.14.9.0515. [DOI] [PubMed] [Google Scholar]
- 85.Shea-Eaton WK, Trinidad MJ, Lopez D, Nackley A, McLean MP. Sterol regulatory element binding protein-1a regulation of the steroidogenic acute regulatory protein gene. Endocrinology. 2001;142:1525–1533. doi: 10.1210/endo.142.4.8075. [DOI] [PubMed] [Google Scholar]
- 86.Piasecka B, Lichocki P, Moretti S, Bergmann S, Robinson-Rechavi M. The hourglass and the early conservation models—co-existing patterns of developmental constraints in vertebrates. PLoS Genet. 2013;9:e1003476. doi: 10.1371/journal.pgen.1003476. [DOI] [PMC free article] [PubMed] [Google Scholar]
- 87.Tanay A, Regev A, Shamir R. Conservation and evolvability in regulatory networks: the evolution of ribosomal regulation in yeast. Proc Natl Acad Sci U S A. 2005;102:7203–7208. doi: 10.1073/pnas.0502521102. [DOI] [PMC free article] [PubMed] [Google Scholar]
- 88.Ihmels J, Bergmann S, Gerami-Nejad M, Yanai I, McClellan M, Berman J, Barkai N. Rewiring of the yeast transcriptional network through the evolution of motif usage. Science. 2005;309:938–940. doi: 10.1126/science.1113833. [DOI] [PubMed] [Google Scholar]
- 89.Raouf A, Ganss B, McMahon C, Vary C, Roughley PJ, Seth A. Lumican is a major proteoglycan component of the bone matrix. Matrix Biol. 2002;21:361–367. doi: 10.1016/S0945-053X(02)00027-6. [DOI] [PubMed] [Google Scholar]
- 90.Pedersen ME, Ytteborg E, Kohler A, Baeverfjord G, Enersen G, Ruyter B, Takle H, Hannesson KO. Small leucine-rich proteoglycans in the vertebrae of Atlantic salmon Salmo salar. Dis Aquat Organ. 2013;106:57–68. doi: 10.3354/dao02638. [DOI] [PubMed] [Google Scholar]
- 91.Ying S, Shiraishi A, Candace W, Converse RL, James L, Swiergiel J, Mary R, Conrad GW, Winston W, Chem JB, Kao CWC, Funderburgh JL, Roth MR, Kao WWY. Characterization and expression of the mouse lumican gene. J Biol Chem. 1997;272:30306–30313. doi: 10.1074/jbc.272.48.30306. [DOI] [PubMed] [Google Scholar]
- 92.Yeh LK, Liu CY, Kao WWY, Huang CJ, Hu FR, Chien CL, Wang IJ. Knockdown of zebrafish lumican gene (zlum) causes scleral thinning and increased size of scleral coats. J Biol Chem. 2010;285:28141–28155. doi: 10.1074/jbc.M109.043679. [DOI] [PMC free article] [PubMed] [Google Scholar]
- 93.Brugmann SA, Goodnough LH, Gregorieff A, Leucht P, ten Berge D, Fuerer C, Clevers H, Nusse R, Helms JA. Wnt signaling mediates regional specification in the vertebrate face. Development. 2007;134:3283–3295. doi: 10.1242/dev.005132. [DOI] [PubMed] [Google Scholar]
- 94.Zhou H, Mak W, Zheng Y, Dunstan CR, Seibel MJ. Osteoblasts directly control lineage commitment of mesenchymal progenitor cells through Wnt signaling. J Biol Chem. 2008;283:1936–1945. doi: 10.1074/jbc.M702687200. [DOI] [PubMed] [Google Scholar]
- 95.Zoeller JJ, Pimtong W, Corby H, Goldoni S, Iozzo AE, Owens RT, Ho S-Y, Iozzo RV. A central role for decorin during vertebrate convergent extension. J Biol Chem. 2009;284:11728–11737. doi: 10.1074/jbc.M808991200. [DOI] [PMC free article] [PubMed] [Google Scholar]
- 96.Petrey AC, Flanagan-Steet H, Johnson S, Fan X, De la Rosa M, Haskins ME, Nairn AV, Moremen KW, Steet R. Excessive activity of cathepsin K is associated with cartilage defects in a zebrafish model of mucolipidosis II. Dis Model Mech. 2012;5:177–190. doi: 10.1242/dmm.008219. [DOI] [PMC free article] [PubMed] [Google Scholar]
- 97.Damazo AS, Moradi-Bidhendi N, Oliani SM, Flower RJ. Role of annexin 1 gene expression in mouse craniofacial bone development. Birth Defects Res A Clin Mol Teratol. 2007;79:524–532. doi: 10.1002/bdra.20368. [DOI] [PubMed] [Google Scholar]
- 98.Kassel O, Herrlich P. Crosstalk between the glucocorticoid receptor and other transcription factors: molecular aspects. Mol Cell Endocrinol. 2007;275:13–29. doi: 10.1016/j.mce.2007.07.003. [DOI] [PubMed] [Google Scholar]
- 99.Draper N, Stewart PM. 11β-hydroxysteroid dehydrogenase and the pre-receptor regulation of corticosteroid hormone action. J Endocrinol. 2005;186:251–271. doi: 10.1677/joe.1.06019. [DOI] [PubMed] [Google Scholar]
- 100.Lane T, Sage E. The biology of SPARC, a protein that modulates cell-matrix interactions. FASEB J. 1994;8:163–173. [PubMed] [Google Scholar]
- 101.Mott JD, Werb Z. Regulation of matrix biology by matrix metalloproteinases. Curr Opin Cell Biol. 2004;16:558–564. doi: 10.1016/j.ceb.2004.07.010. [DOI] [PMC free article] [PubMed] [Google Scholar]
- 102.Saftig P, Hunziker E, Wehmeyer O, Jones S, Boyde A, Rommerskirch W, Moritz JD, Schu P, von Figura K. Impaired osteoclastic bone resorption leads to osteopetrosis in cathepsin-K-deficient mice. Proc Natl Acad Sci U S A. 1998;95:13453–13458. doi: 10.1073/pnas.95.23.13453. [DOI] [PMC free article] [PubMed] [Google Scholar]
- 103.Filanti C, Dickson GR, Di Martino D, Ulivi V, Sanguineti C, Romano P, Palermo C, Manduca P. The expression of metalloproteinase-2, -9, and -14 and of tissue inhibitors-1 and -2 is developmentally modulated during osteogenesis in vitro, the mature osteoblastic phenotype expressing metalloproteinase-14. J Bone Miner Res. 2000;15:2154–2168. doi: 10.1359/jbmr.2000.15.11.2154. [DOI] [PubMed] [Google Scholar]
- 104.Hocking AM, Shinomura T, McQuillan DJ. Leucine-rich repeat glycoproteins of the extracellular matrix. Matrix Biol. 1998;17:1–19. doi: 10.1016/S0945-053X(98)90121-4. [DOI] [PubMed] [Google Scholar]
- 105.Keen RW, Woodford-Richens KL, Grant SF, Ralston SH, Lanchbury JS, Spector TD. Association of polymorphism at the type I collagen (COL1A1) locus with reduced bone mineral density, increased fracture risk, and increased collagen turnover. Arthritis Rheum. 1999;42:285–290. doi: 10.1002/1529-0131(199902)42:2<285::AID-ANR10>3.0.CO;2-3. [DOI] [PubMed] [Google Scholar]
- 106.Nakashima K, de Crombrugghe B. Transcriptional mechanisms in osteoblast differentiation and bone formation. Trends Genet. 2003;19:458–466. doi: 10.1016/S0168-9525(03)00176-8. [DOI] [PubMed] [Google Scholar]
- 107.Hess J, Angel P, Schorpp-Kistner M. AP-1 subunits: quarrel and harmony among siblings. J Cell Sci. 2004;117:5965–5973. doi: 10.1242/jcs.01589. [DOI] [PubMed] [Google Scholar]
- 108.Chai Y, Ito Y, Han J. TGF-β signaling and its functional significance in regulating the fate of cranial neural crest cells. Crit Rev Oral Biol Med. 2003;14:78–88. doi: 10.1177/154411130301400202. [DOI] [PubMed] [Google Scholar]
- 109.Sumarsono SH, Wilson TJ, Tymms MJ, Venter DJ, Corrick CM, Kola R, Lahoud MH, Papas TS, Seth A, Kola I. Down’s syndrome-like skeletal abnormalities in Ets2 transgenic mice. Nature. 1996;379:534–537. doi: 10.1038/379534a0. [DOI] [PubMed] [Google Scholar]
- 110.Rockman MV. The QTN program and the alleles that matter for evolution: all that’s gold does not glitter. Evolution. 2012;66:1–17. doi: 10.1111/j.1558-5646.2011.01486.x. [DOI] [PMC free article] [PubMed] [Google Scholar]
- 111.Kapralova KH, Franzdóttir SR, Jónsson H, Snorrason SS, Jónsson ZO. Patterns of miRNA expression in Arctic charr development. PLoS One. 2014;9:e106084. doi: 10.1371/journal.pone.0106084. [DOI] [PMC free article] [PubMed] [Google Scholar]
- 112.Attanasio C, Nord AS, Zhu Y, Blow MJ, Li Z, Liberton DK, Morrison H, Plajzer-Frick I, Holt A, Hosseini R, Phouanenavong S, Akiyama JA, Shoukry M, Afzal V, Rubin EM, FitzPatrick DR, Ren B, Hallgrímsson B, Pennacchio LA, Visel A. Fine tuning of craniofacial morphology by distant-acting enhancers. Science. 2013;342:1241006. doi: 10.1126/science.1241006. [DOI] [PMC free article] [PubMed] [Google Scholar]
- 113.Parsons KJ, Sheets HD, Skúlason S, Ferguson MM. Phenotypic plasticity, heterochrony and ontogenetic repatterning during juvenile development of divergent Arctic charr (Salvelinus alpinus) J Evol Biol. 2011;24:1640–1652. doi: 10.1111/j.1420-9101.2011.02301.x. [DOI] [PubMed] [Google Scholar]
Associated Data
This section collects any data citations, data availability statements, or supplementary materials included in this article.
Supplementary Materials
Additional file 1: Arctic charr–specific primers for cDNA cloning and qPCR. (XLSX 13 KB)
Additional file 2: Relative expression of candidate genes in the developing head of four Arctic charr morphs. Relative expression of 12 candidate genes (with strong coexpression relationship in vertebrates) in the developing head of AC, PL, SB and LB at seven developmental stages. Gene expression was measured by qPCR, and expression levels were normalized with respect to the geometric means of two craniofacial reference genes (Actb and If5a1). The relative expression level for each gene is depicted by setting a replicate of the AC morph at stage 1 to an arbitrary unit of 1. Error bars represent standard deviation calculated from two biological replicates. The letters A, L, P and S above the bars indicate significantly higher expression than for AC, LB, PL and SB, respectively (P <0.05 calculated by Tukey’s HSD post hoc tests. (TIFF 499 KB)
Additional file 3: Ranking of genes coexpressed with both Mmp2 and Sparc , Gene Ontology (GO) and TF enrichment analyses. Genes coexpressed with both Mmp2 and Sparc in humans, mice and zebrafish were retrieved using COXPRESdb. The genes were filtered by setting the mutual rank (MR) to the top-ranked 500 and the reliability score of 3. In the list of Mmp2 and Sparc coexpressed genes, the column titled ‘Transcriptome Presence’ indicates that an orthologous gene was present in Arctic charr transcriptome profiles. ‘Differential Expression’ indicates differences in expression levels between the AC and SB morphs in the same data. ‘Craniofacial Expression’ indicates craniofacial expression in zebrafish. The last two columns were used to select genes for further analysis in Arctic charr. The top-ranked (MR scores) of genes coexpressed with both Mmp2 and Sparc for humans and mice were used as input for GO enrichment analysis using DAVID v6.7. GO terms with direct link to skeletal formation are highlighted in blue. Similar input lists of genes were used for transcription factor enrichment analysis in humans and mice through WebGestalt v2. Enriched TFs that were later predicted to be the potential regulators of the network are highlighted in orange. (XLSX 163 KB)
Additional file 4: Analyses of candidate gene expression using two-way ANOVA for effects of morph and time. Results show significant effects of morph, time and morph × time interaction on the expression of genes coexpressed with both Mmp2 and Sparc, as well as selected GC downstream genes and upstream effectors. (XLSX 15 KB)
Additional file 5: Analyses of candidate gene expression using two-way ANOVA for effects of morphotypes and time. Results show significant effects of benthic and limnetic morphotypes, time and, to lesser extent, morphotype × time interaction on the expression of genes coexpressed with Mmp2 and Sparc, as well as selected GC downstream genes and upstream effectors. (XLSX 15 KB)
Additional file 6: Relative expression of eight downstream transcriptional targets of GC signalling. Relative expression of candidate genes in the developing head of AC, PL, SB and LB at seven developmental stages, as measured by qPCR. Gene expression levels were normalized with respect to the geometric means of two craniofacial reference genes (Actb and If5a1). The relative expression level for each gene is depicted by setting a replicate of the AC morph at stage 1 to an arbitrary unit of 1. Error bars represent standard deviation calculated from two biological replicates. The letters A, L, P and S above the bars indicate significantly higher expression than in AC, LB, PL and SB, respectively (P <0.05) as calculated by Tukey’s HSD post hoc tests. (TIFF 358 KB)
Additional file 7: Relative expression of eight upstream effectors of GC signalling. Relative expression of candidate genes in the developing head of AC, PL, SB and LB at seven developmental stages, as measured by qPCR. Gene expression levels were normalized with respect to the geometric means of two craniofacial reference genes (Actb and If5a1). The relative expression level for each gene is depicted by setting a replicate of the AC morph at stage 1 to an arbitrary unit of 1. Error bars represent standard deviation calculated from two biological replicates. The letters A, L, P and S above the bars indicate significantly higher expression than in AC, LB, PL and SB, respectively (P <0.05) as calculated by Tukey’s HSD post hoc tests. (TIFF 339 KB)
Additional file 8: Motif sequence enrichment analysis of candidate genes. Two lists of motif sequences identified by SCOPE and transcription factor binding sites predicted by BioProspector in conserved noncoding regions of 17 coexpressed genes in three and four teleost fish species, respectively. The motifs identified by BioProspector were run against known PWMs in the TRANSFAC database using the STAMP tool. (XLSX 36 KB)
Additional file 9: Craniofacial expression pattern of selected members of the coexpression network. In situ hybridization revealing the anterior and ventral craniofacial expression pattern of Ctsk, Mmp2, Ogn, Sfrp1, Sparc and Ets2 at stage 1 (A) and stage 7 (B), ventral and lateral views showing the overlapping expression of the genes in the facial area anterior to and surrounding the mouth, as well as in the pharyngeal arches. Sparc displays ubiquitous and relatively less specific expression pattern during head development, and the expression of Sfrp1 is hardly detectable at the last time point. Dashed red boxes emphasize on important expression patterns. Scale bar = 1 mM. (TIFF 6 MB)
Additional file 10: A summary of known interactions between the predicted transcription factors in different vertebrate species. (PDF 448 KB)
Additional file 11: Regulatory interactions between predicted transcription factors and candidate genes in different vertebrate species. (PDF 476 KB)