

Abstract
Proteins from thermophilic organisms are stable and functional well above ambient temperature. Understanding the molecular mechanism underlying such a resistance is of crucial interest for many technological applications. For some time, thermal stability has been assumed to correlate with high mechanical rigidity of the protein matrix. In this work we address this common belief by carefully studying a pair of homologous G-domain proteins, with their melting temperatures differing by 40 K. To probe the thermal-stability content of the two proteins we use extensive simulations covering the microsecond time range and employ several different indicators to assess the salient features of the conformational landscape and the role of internal fluctuations at ambient condition. At the atomistic level, while the magnitude of fluctuations is comparable, the distribution of flexible and rigid stretches of amino-acids is more regular in the thermophilic protein causing a cage-like correlation of amplitudes along the sequence. This caging effect is suggested to favor stability at high T by confining the mechanical excitations. Moreover, it is found that the thermophilic protein, when folded, visits a higher number of conformational substates than the mesophilic homologue. The entropy associated with the occupation of the different substates, along with the thermal resilience of the protein intrinsic compressibility, provide a qualitative insight on the thermal stability of the thermophilic protein as compared to its mesophilic homologue. Our findings potentially open the route to new strategies in the design of thermostable proteins.
Keywords: Molecular Dynamics, Protein Conformation, Protein Thermostability, Unfolding, Network Analysis, Protein Diffusion
Introduction
Proteins are marginally stable, with the free energies of folded and unfolded states differing by only few kcal/mol.1,2 Therefore, the design of proteins of enhanced stability3-6 has a strong appeal for biotechnology and chemical processes that exploit enzymatic activities in harsh conditions. Because of their intrinsically higher stability, proteins from hyper- and thermophilic organisms provide a natural template for these purposes.
Thermophiles and hyperthermophiles are organisms that thrive at high temperatures, typically from 50° to 100°C, and their molecular machinery is suitably adjusted to be both stable and functional at these extreme conditions.7 Yet, a complete understanding of the molecular mechanism underlying such a resistance is still lacking.7-9 Nowadays it is accepted that no single thermodynamic strategy or molecular factor lies at the basis of thermal resistance.10
Earlier hydrogen/deuterium exchange experiments have suggested that (hyper)thermophilic proteins are more rigid at room temperature than their mesophilic counterparts.11,12 Such mechanical rigidity was suggested as the leading cause to heat resistance, correlating with the reduced protein activity at room temperature generally observed for thermophiles.
Extensive research has questioned this picture: subsequent hydrogen/deuterium exchange experiments, probing conformational fluctuations at the ms timescale and longer, reported that rubredoxin13,14 and α-amylase15 have comparable or even enhanced flexibilities of the (hyper)thermophilic species with respect to the mesophilic ones. Moreover, NMR 15N experiments on two homologue ribonucleases with different thermal stabilities showed that in a broad range of timescales – from ps to ms – flexible and rigid backbone regions are found in both proteins but partitioned differently.16 Larger atomistic fluctuations were found in thermophilic proteins than in mesophilic ones, as monitored by neutron scattering in the ps timescale near room temperature.15,17,18 The weak temperature dependence of these fluctuations – or resilience17 – was considered to be a general dynamical hallmark of thermal resistance, a view that was later questioned.18
Computer simulations are continuously providing a wealth of information about the protein dynamics of mesophilic and (hyper)thermophilic homologues at different timescales. Extended comparisons of meso/thermophilic counterparts have revealed the important role of molecular factors such as ion-pairs,19-23 internal packing,24,25 hydration,24,26,27 crowding28 and protein flexibility.29-31 Most of these computational studies suggest that (hyper)thermophiles do not present more rigid structures than the mesophilic counterparts, at least on the time scales sampled by the simulations that extended from tenths of nanoseconds to a few hundreds of nanoseconds. Moreover, investigation of the relationship between protein dynamics and catalysis showed that the reduced activity at ambient condition of the thermophilic dihydrofolate reductase is due to the higher kinetic barrier for the chemical step and not the suppressed protein mobility.32 However some recent investigations endorse the rigidity paradigm and the “corresponding-states” view.30,31
In the present work, we investigate the correlation between protein rigidity/flexibility and thermostability by extensive simulations reaching up to the microsecond timescale. The targets of our study are the G-domains from the Elongation-Factor (EF) –thermo unstable (Tu) and –1α proteins. The former belongs to the mesophilic Escherichia coli bacterium while the latter belongs to the hyperthermophilic Sulfolobus solfataricus archaea. The G-domain is the catalytic core of the EFs and confers the stability to the whole multi-domain protein.33 When isolated, the G-domain is still able to perform GTPase activity and to vary its catalytic power upon ribosome binding. The domains from the two proteins share high structural homology (see Fig. S1) and 34% of sequence identity.24 The large stability gap (40 K) between them is comparable to the gap of the whole proteins, making these domains suitable systems to study the effect of protein flexibility on stability and function.
As a preliminary step, we verify if the simulations are able to reproduce the thermal stabilities of the two proteins and then focus on the flexibility/rigidity features at ambient conditions. Given the complex nature of a protein whose conformational landscape is characterized by a hierarchy of states, the flexibility of the molecules is investigated at several time and length-scales. The main finding of our work is that at ambient condition the hyperthermophilic protein exhibits comparable or even enhanced flexibility with respect to the less stable mesophilic domain. However, depending on the length scale, specific behaviors emerge. Our results indicate that at the atomistic length-scale the thermostable protein, while showing comparable fluctuations to the mesophilic one, is characterized by a regular cage-like distribution of rigid and flexible amino-acid stretches that stabilize a key region of the protein. When focusing at the molecular length scale, the conformational landscape of the hyperthermophilic G-domain presents a rich network of kinetically separated sub-states, while the conformations of the mesophilic protein remain confined in a unique basin. It is also observed that the landscape morphology of the hyperthermophilic protein can be associated to a high frictional conformational motion and a slow diffusion. Moreover, we explore the correlation between protein flexibility and cofactor binding propensity where for the conformations sampled at ambient condition we estimate a favorable GTP binding energy for both proteins. The general implications of these findings are discussed in the following.
Methods
We study two homologous proteins, the G-domains of the Elongation Factor -thermo unstable (EF-Tu) and of −1α (EF-1α). The mesophilic protein (EF-Tu, Pdbcode 1EFC34) belongs to Escherichia coli bacterium while the hyperthermophilic one (EF-1α, Pdbcode 1SKQ35) belongs to the Sulfolobus solfataricus archae. The G-domain corresponds to the N-terminal part of the protein, and in our simulations the mesophilic homologue was cut at the level of the residues T8-E203 while the hyperthermophilic G-domain encompasses the stretch of residues K4-V229. In the remainder of the manuscript the residue numbering refers to our simulated systems and a shift of 7 or 3 residues is needed in order to match the numbering in the 1EFC and 1SKQ crystallographic structures, respectively (see Fig. S1).
Simulation Setup
Molecular Dynamics simulations (MD) were performed using the CHARMM22 Force Field for proteins36 and TIP3P-CHARMM model for water. The mesophilic domain (M,196 a.a.) was solvated with 7440 water molecules and the hyperthermophilic one (H,226 a.a.) with 10673. Counter-ions were added to neutralize the systems. Details of the systems preparation can be found in ref.24,27 The systems were simulated in the temperature range T = 300 – 390 K and variable simulation durations depending on T. In order to explore the high temperature stability (T = 360 K), the M and H proteins were simulated for about 1.5 μs and 1.0 μs, respectively; 7 shorter extra runs of duration 300 – 500 ns were performed to estimate the characteristic timescale of the early unfolding event. At this T a run using the AMBER99sb Force Field37 was also produced (see Fig. S2). To sample the long timescale behavior in the folded state at ambient condition (T=300 K), the proteins were simulated for 0.6 μs. At the intermediate temperature 330 K the simulations were carried out for about 250 ns. In order to study the temperature dependence of the protein compressibility, a set of independent trajectories of about 50 ns each were produced at intermediate temperatures separated from one another by 10 K and ranging from 310 to 380 K.
All simulations were performed using the NAMD software package.38,39 The equations of motion were integrated using a timestep of 2 fs, with all bonds treated as flexible except for those involving hydrogen atoms which were kept rigid. Temperature and pressure were kept constant by a Langevin thermostat (with dumping coefficient τT = 5 ps−1) and a barostat (with oscillation period of τP = 100 fs), respectively. Electrostatics in a periodic simulation box was solved via the Ewald summation method and handled by the PME algorithm with a grid spacing of 1 Å. The production phases were preceded by 1 ns equilibration. Volumetric properties were calculated using the program trjVoronoi.40,41 For the mesophilic protein, the calculations of the RMSF and the volumetric properties at high temperatures were restrained to the part of the trajectory where the protein maintained a folded structure.
Collective variables (CV)
The Root Mean Square Displacement (RMSD) was computed via the following expression
| (1) |
where NCα is the number of Cα atoms in the chain, ri(t) is the position of the i-th atom at time t and is its position in the crystallographic structure. Rigid body motions were removed by super-imposing the full set of Cα atoms of the protein configuration at time t on those of the native structure.
The Root Mean Square Fluctuations (RMSF) were computed via the following expression
| (2) |
where the two brackets denote a double time average. The inner average 〈…〉w was calculated over a time window of 350 ps, ensuring the unimodal distribution of the atomic fluctuations. The outer average 〈…〉 was calculated along the trajectory over blocks of 10 ns each. This averaging allowed to estimate the long time-scale variability of the RMSF.
The number of native contacts for a given Cα site is the number of Cα atoms located within a cut-off distance of 8 Å in the crystallographic structure. Thus, the fraction of native contacts, referring to the whole chain, is defined as
| (3) |
where NCα is the number of Cα atoms, having native Cα contacts in the reference state and li(t) of them appearing also at time .
The fraction of native torsion angles is given by
| (4) |
where Nθ is the number of torsion angles θ, having values in the crystallographic structure and values θi(t) at time t and σ = 60°. In our calculations the torsion angles along the sequence include both ϕ and ψ dihedrals.
Clustering
For the clustering procedure, we used two different algorithms and three different CV, the RMSD, the fraction of native contacts Q and the fraction of native torsion angles n.
The clustering was done using the well-established leader algorithm.42 Our results were also verified to be robust to both an hierarchical agglomerative scheme and the kmeans algorithm.43
For the straightforward case of the RMSD variable, the clustering procedure was based on the pairwise root mean square deviations, as defined in Eq. 1, between different snapshots of the trajectory after removing rigid body motions.
For the case of fraction of native contacts Q, each snapshot was represented by a vector of length equal to the number of Cα atoms (NCα), whose i–th component of the vector was the quantity of Eq. 3. Then, the distance between two snapshots was defined as
| (5) |
Equivalently, for the fraction of native torsion angles n of {ϕ, ψ}, each snapshot was represented by a vector of length equal to the number of torsion angles along the sequence (NΤ) where the i–th component of the vector was given by the quantity of Eq. 4. Then the distance between two snapshots was defined as
| (6) |
The calculations were also performed separately for ϕ, and ψ with same qualitative results.
In order to verify the robustness of our results, we repeated the leader clustering using at least three different cutoff values for each variable.
Markov clustering algorithm (MCL)
The CV clustering of the MD trajectories was fed as an input to the Markov clustering algorithm (MCL)44 in order to group together the most kinetically relevant substates. MCL is based on a random walk on a network and works as follows.
From the original network of clusters a transition matrix Aij is constructed, where element Aij is the number of transitions from cluster i to j. This matrix is then transformed into a stochastic one by normalizing its columns to one, , with N the number of substates.
Then the matrix is squared, to yield the probabilities of transition from node j to node i in a two-step path. This operation is called expansion.
The elements of the squared matrix are raised to the power p, with p > 1, in order to promote the most probable paths at the cost of the less probable ones and the resulting matrix is again column-normalized, . This operation is the so-called inflation.
and steps (ii), (iii) and (iv) are repeated until convergence where the matrix is invariant upon the two operations.
Recurrent application of the expansion and inflation operators results to a matrix with exactly one non-zero entry per column and isolated paths. Each of these paths includes the most connected substates with respect to a certain granularity defined by the exponent p. Within the free energy landscape picture, the granularity parameter determines the minimum height of the kinetic barriers detected by the algorithm that confine the walkers in separate parts of the network. Small values of p result in a very coarse-grained final representation while large values of p result in a more detailed one. In the present discussion the testing of several exponents yielded robustness to our results.44,45
Diffusion
The diffusion coefficient for the proteins in the folded state was calculated for all the three CVs (RMSD, Q and n). Given the collective variable X, in the harmonic approximation46,47 the diffusion coefficient is given by , where δX = X − 〈X〉 is the instantaneous fluctuation of the collective variable and τcorr its correlation time, being defined as:
| (7) |
For Q and n the autocorrelation in Eq. 7 decays exponentially after an initial short transient time (~300 ps). We used an exponential fit to estimate τcorr. The correlation functions were calculated for both CVs on a long stationary stretch of the trajectory of equal lengths. For the RMSD variable, we noticed a rather unsteady behavior and the stationary intervals were not sufficiently long to correctly estimate τcorr. We performed additional simulations (50 ns) with a harmonic restraint on the RMSD variable and biasing its motion around its average value (RMSD=3.4 and 3.7 Å for M and H, respectively) by applying a force constant KRMSD = 100 kcal/(mol A2). The diffusion constant D was evaluated as above47 but it provided only a very local information due to the applied restraint. We also estimated τcorr via Eq. 7, and found the same differences between the M and H proteins.
Substrate Binding
As target receptors for docking, 1,000 different configurations were extracted for both systems using a regular interval of 0.26 ns from the MD trajectories at temperatures T = 300, 330 and 360 K. AutoDock4.248,49 was used to predict the binding free energies at the experimental GTP binding site. For each configuration, AutoGrid was used to generate the grid maps using a box centered at the binding site with grid spacing 0.375 Å and 60 × 60 × 60 points. A genetic algorithm was used for the docking calculations with maximum number of energy evaluations set to 2, 500, 000 and the other parameters set to their default values. There were 8 rotatable bonds in the ligand and all of them were allowed to rotate during the docking trials. The loss of torsional freedom upon binding was evaluated to be 2.4 Kcal/mol for both proteins. For the protein, the “rigid” formulation of docking was used since the receptor flexibility was already considered by the molecular dynamics simulations. Among the 20 lowest energy docked poses, we have selected those resembling the experimental GDP/GTP bound configuration by introducing distance dependent geometric criterion on the purine ring, and also on the phosphate groups, with respect to selected residues in the binding site, see panels C1 and C2 in Fig. S1. A scoring function (AutoDock41) was then applied to identify the pose with the lowest binding free energy among the selected poses. We verified that the obtained results did not change qualitatively when the geometric criterion was removed. Data are reported in table S1.
The analysis of the MD trajectories was done with in-house codes and functions from the R package, Bio3d.50,51
Results and discussion
Stability versus Early Step of Unfolding
A preliminary analysis was performed to verify that the hyperthermophilic protein (H) is more stable – in a kinetic sense – in its high functional temperature regime (T = 360 K) than the mesophilic homologue (M). In the μs timescale the fold of the H protein remains close to its crystallographic structure and exhibits a steady root mean square displacement of its Cα atoms (Cα-RMSD) averaging at 3.8 Å, see Fig. 1A. At the same temperature, the mesophilic protein exhibits the early onset of unfolding: the time-evolution of the Cα-RMSD is first marked by a sequence of jumps until a further highly fluctuating drift toward larger Cα-RMSD values, ~ 10 Å. The opposite stabilities of the two proteins were reproduced in additional independent simulations (see Fig. S2). Fig. 1B reports the conformational free energy landscape sampled by the two proteins and projected on two routinely used collective variables (CV), the fraction of native contacts (Q) and the fraction of native torsion angles (n).52,53
Figure 1. Microsecond simulations at T = 360 K.

(A) Cα-RMSD for the mesophilic (M) and hyperthermophilic (H) proteins. The horizontal dotted arrow indicates the time window M over which the first RMSD “jump” for M takes place in a collection of 7 independent simulations. Above the respective RMSD values, two snapshots of the folded (left) and partially unfolded (right) M protein are shown with the indication of the square root of the first principal moment of their gyration tensor. (B) Dimensionless 2-D free energy landscape at T = 360 K for the two systems with collective variables the fraction of native torsion angles, n, against the fraction of native contacts, Q.
The early steps of unfolding of M take place in the protein’s “Achilles’ heel”: the stretch G33-A45. This region unpacks at approximately 150 ns, rapidly followed by the disruption of the F39-D43 helix and a gradual unpacking of the residues A45-C74. Reaching 1 μs of simulation, the stretch G33-C74 loses its secondary structure motifs and expands in the form of a random-coil with the first moment of the protein’s gyration tensor being 40% larger than at previous times (see the snapshot at the top of Fig. 1). The finally disrupted sequence includes a key region for the protein activity, the so-called switch I region (in our numbering G33-I55, see Fig. S1), that is known to undergo a large conformational change during GTPase activity.54-56
Local Fluctuations
In search for signatures of the alleged enhanced rigidity of the hyperthermophilic homologue, we shift our attention to the behavior of the proteins in the folded states. We initially monitor the atomistic motion occurring on the sub-nanosecond timescale by analyzing the root mean square fluctuation (RMSF) of the backbone Cα atoms. The fluctuations are evaluated in the 350 ps simulation window, ensuring the unimodal distribution of the atomic positions.57 The average RMSF at T = 300 K is reported in Fig. 2A along with its min/max variability (dotted bars) evaluated by block analysis.
Figure 2. Atomistic fluctuations: mesophilic protein (left column) and hyperthermophilic (right column).

(A) The top of the figure displays the secondary structure of each protein as well as the most stable salt-bridges in the form of connecting black lines. In the secondary structure bar β-strands and Helix secondary structures are represented as yellow and magenta bars while Turn and Coil regions are represented as thinner cyan and black lines, respectively. Right below, the continuous lines show the mean atomistic Cα RMSF for M and H at T = 300 K while the dotted lines correspond to its min/max variation (axis on the left). The bars below the RMSF indicate the relative frequency of formation of a salt-bridge (axis on the right). (B) Autocorrelation of the atomistic RMSF as a function of the residue-lag along the sequence. The darker colors correspond to the mean RMSF autocorrelation while the lighter colors to the min/max variation.
The magnitude of the larger fluctuations as well as the average value along the sequence are comparable for both proteins. However, a striking difference emerges when the auto-correlation of the RMSF values is taken along the protein sequence, see Fig. 2B. Namely the H protein shows a remarkable anti-correlating behavior in the RMSFs between groups of neighboring residues with a characteristic sequence length ξ of about 10 residues. This behavior persists at higher temperatures (see Fig. S3) and, borrowing a concept from the theory of liquids, features a caging effect along the sequence. For the H protein, flexible and rigid parts of the sequence alternate more regularly than in the mesophilic homologue. This finding suggests that a regular distribution of rigid/flexible fragments can possibly suppress the propagation of mechanical stresses along the protein matrix, thus preventing progressive unfolding at high temperature. If verified for other pairs of homologous proteins, this feature could inspire new procedures to design thermostable proteins by tuning the local rigidity/flexibility pattern.
The different correlation profiles of the atomistic flexibility of the two proteins should be traced back to the structural differences distinguishing the two homologues. A sketch of the secondary structure for the two systems is drawn in Fig. 2A, top panel. From a quantitative point of view, the number of amino acids belonging to flexible motifs, i.e. Turn or Coil, are more frequent in H (44%) than in M (25%). Moreover, they are more uniformly distributed along the sequence (see SI text and Fig. S5). On closer inspection, the pairs of residues (i, i+15) in H that mostly contribute to the anticorrelation of RMSF (Fig. 2B) span uniformly the first part of the sequence (from residue 1 to residue 120) (see Fig. S4). For all those pairs but one, when one member belongs to a well defined secondary structure (α-Helix or β-strand) its partner belongs to either a Turn or a Coil. Only exception is the stretch K36-K43 that belongs to a short α-helix but exhibits higher RMSF values. Interestingly enough, this stretch is part of a key region of the H protein formed by two helices (α1 [E32-L45] and α2 [E48-E63]) that although preserves well its secondary structure, shows high mobility and intermittent unwinding of its terminal 3 residues. This is due to its large concentration of charged residues that results in frequent partner exchange of the ion-pairings. Typical example is the E40 that exchanges partners between K36 and K44 in nanosecond timescales. On the contrary, in the M protein the region G33-A45 shows large fluctuations and gives the small positive correlation at residue-separation 15-17 with other highly fluctuating amino-acids, see Fig. 2B and Fig. S4. We have already pointed out that this region represents the protein’s weak spot where the high-temperature unfolding begins. Single-point or more extended mutations can be designed to confirm the stabilizing effect of a regular alternation of rigid and flexible fragments in this region of the protein. It would be also intriguing to examine experimentally via pump-probe experiments whether the local caging effect that we report herein, has an impact on the energy transfer processes along the protein backbone, i.e. by monitoring the vibration of labeled carbonyl C=O bonds following the photo-excitation of a linked chromophore,58 or during the progressive thermal unfolding via multi-dimensional spectroscopy.59
Electrostatic Interactions
The local rigidity/flexibility in the protein matrix was probed by investigating the network of electrostatic interactions, namely hydrogen-bonds (HB) and salt-bridges (SB). At room temperature, the density of HB per unit of volume is comparable for the two proteins, being with fluctuations of the order of 10%. In nHB we considered both intraprotein and protein-solvent HBs, and the protein volume vp was evaluated by Voronoi tessellation.60 However, as a consequence of its chemical composition, the H protein is cross-linked by a higher number of instantaneous SBs (~16) than the M species (~7). Fig. 2A illustrates the frequency of SB formation for each residue in the form of bars underneath the RMSF profile. There is a clear correlation between the low-RMSF fragments of the sequence and a high probability for SB formation – with the exception of the K36-K43 region of H – suggesting that the SBs act as structural clamps. The high density of SBs localized at the level of the H switch I region (L29-P73), as mentioned above, although resulting in a higher mobility of this region, confers a long term resistance to the secondary structure of this key stretch of amino-acids. A few SBs are long-lived and particularly stable, as schematically shown in Figure 2A as black straight lines above and below the secondary structure inset.
It is worth noting that for H, the interaction E77-K1 keeps the N-terminus closely packed to the body of the protein for the whole range of temperatures 300 – 390 K, while the stable interactions D217-K79 and D217-K80 ensure the effective packing of the C-terminus. On the contrary, for the M protein, the interactions D63-K2 and E194-R67 that link the terminals to the protein body at room temperature, gradually weaken with increasing temperature. The stable anchorage of C- and N-terminals is a recognized structural peculiarity of thermophilic proteins,7 and in the context of our investigation, the link of the N-terminal to the switch I region is individuated as the key stabilizing interaction for the G-domain of the EF-Tu from the thermophilic Bacillus stearothermophilus bacterium.61
In the H protein the larger number of charged amino acids favors a variety of SB patterns at the protein surface. At any given instant, the maximum number of residues involved in a SB network, is of 4 – 5 for both proteins; but when the SB formation is averaged over time, the surface of the H protein is covered by extended SB networks while at the M surface small SB clusters remain disconnected (Fig. S1, panels D1 and D2). In other words, the side-chain flexibility of the ionic amino-acids – that we have verified to be comparable among the two proteins by computing their conformational entropy as in ref.23 – favors SB partner exchange in the H protein. Conversely, in the M protein the breakage of a SB is not compensated by the formation of a new ion-pairing. It was previously suggested by studying a coil-coiled system23 that the fluctuations of the ion-pair patterns at the interfaces of three aggregated helices help accommodating the high-temperature entropy and therefore maintain the system stable.
In conclusion, we observed that ion-pairs contribute to the enhanced stability of the H protein, not only via short-range permanent links, but also forming, as a result of side-chain flexibility, dynamic extended network of electrostatic interactions.
Compressibility
The number and the spatial distribution of charged groups are generally correlated to the unfolding heat capacity62,63 and protein compressibility.64 Fluctuation of the protein packing is therefore a natural candidate to monitor protein flexibility and its contribution to stability.65,66 For the homologous G-domains at room temperature we obtain a comparable and quite high apparent compressibility, as estimated by the method introduced in ref.,67 βa=8.7−9.2(2) 10−5 Mpa−1, that correlates to the presence of large water-filled cavities in the protein structures. The weighted fluctuations of the protein volume, or intrinsic protein compressibility, , slightly increase at higher temperatures, as reported in Fig. 3, but for the H protein we observe a milder T dependence than for the M protein: βT(T)/T=0.9 10−5 and 0.5 10−5Mp−1K−1, respectively. It has been previously pointed out that the protein’s intrinsic compressibility is inversely correlated to the enthalpy (ΔHunf) and entropy (ΔSunf) of unfolding.64,66 Thus, proteins with a resilient internal packing are enthalpically more stable. Our finding suggests that while at ambient temperature the two proteins have a similar enthalpy of unfolding, as temperature increases ΔHunf decreases less for the H protein than for the M protein, implying a broader stability curve ΔGunf vs temperature for the hyperthermophile.10,68 The H protein is characterized by a better atomic packing at all temperatures,24 with the volume per atom being about 2% smaller than in the M protein and a thermal expansion of ~ 4×10⁻³Å3K−1.
Figure 3. Intrinsic protein compressibility βT versus temperature for the M (green) and the H (red) protein. Inset: specific volume per atom versus temperature.

Conformational states
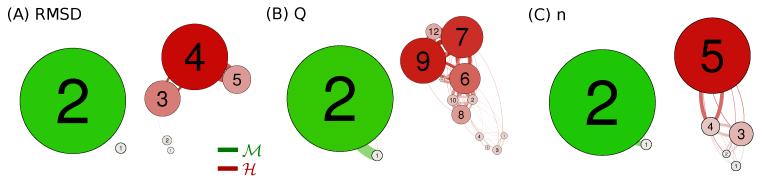
The long-time fluctuations of the two protein conformations are now compared. A clustering analysis performed on trajectories of equal duration (0.6 μs) returns a clear result: the conformational landscape of the H protein is characterized by a larger number of substates than that of the M counterpart (Fig. 4A and 4B). This finding is robust for different tested algorithms (see Methods) and for several order parameters used for the clustering (the RMSD, the fraction of native contact Q and the fraction of native torsion angle n). We have also verified that the number of clusters saturates within a few hundreds of nanoseconds according to a simple exponential evolution, . From the data of Fig. 4A, the timescale τ is in the range of 170-350 ns.
Figure 4. Conformational substates.

(A) Number of clusters versus time (dotted lines) as obtained with the leader/follower algorithm at T = 300 K. The clustering variables are RMSD in (a), fraction of native contacts Q in (b) and fraction of native torsion angles n in (c). The solid lines correspond to the exponential fitting of the form N = N∞(1 − e−t/τ). (B) Network representations for the M and H proteins after clustering with the Q variable. The two networks have been represented in a 2D space using a force based algorithm with its parameters set the same for both systems.71
The observed differences in the conformational landscapes mark the structural properties of the two homologues, with the H protein having a larger number of Turn and Coil residues whose fluctuations result in visiting a larger number of conformational states.
Fig. 4B illustrates for the native contact parameter Q, a representative example of the clustering analysis. The clusters are depicted as interconnected nodes in the network. The size and color intensity are proportional to their occupancy. The edges represent the transitions from one substate to another and are weighted with the respective transition frequencies computed along the trajectories. The conformational landscape of the M protein projected on the network is compact with the majority of substates organized around a main local basin. On the contrary, for the H protein, more basins of attraction are visible. The two types of organization can be distinguished by computing the transitivity coefficient C of the network, quantifying the tendency of the nodes to cluster together. It is defined as the probability that for any node two adjacent ones are also connected to each other.69 The results are reported in Table 1. For the two networks the coefficient C is found to be higher for M than for H. We have also evaluated the Shannon entropy70 for the obtained networks , where the summation runs over all the different clusters N and pi is the relative occupation of the ith cluster. The normalized quantity H/Hmax, where Hmax corresponds to a uniform distribution of occupancies, is reported in Table 1 for both systems and for the three order parameters. Systematically higher values are associated to the H protein indicating a more uniform distribution of substate occupancies as consequence of the higher number of attractive basins.
Table 1. Transitivity coefficient of conformational networks and Shannon entropy of the node memberships.
| CV | Transitivity C | H/Hmax | |
|---|---|---|---|
| M | RMSD | 0.65 | 0.83 |
| Q | 0.73 | 0.74 | |
| n | 0.79 | 0.79 | |
| H | RMSD | 0.62 | 0.91 |
| Q | 0.52 | 0.85 | |
| n | 0.73 | 0.87 |
For the calculation of the transitivity coefficient the weights of the edges (i.e. frequencies of transition) were taken into account
One point should be made concerning the small difference in the sequence length of the two proteins, 196 (M) vs 226 (H) residues. Although for a polymer the possible number of clusters should grow exponentially with the length of the chain, in the compact fold this dependency is expected to be much weaker. However, in order to observe possible size effects, we performed additional validations. At first we excluded the last 3 highly fluctuating residues in the C-terminal of the H protein and compared with the original clustering of the M protein; next we clustered several equal-length residue-stretches for both systems. Both tests confirmed the main finding: the landscape of the H protein is characterized by a larger number of conformational states.
From the thermodynamic point of view, thermophiles can achieve high thermal stability via three possible strategies or a combination thereof. In a simple two-state model the unfolding free energy as a function of temperature, ΔGunf(T), resembles an inverted parabola with its maximal value () at the temperature of maximun stability, Ts.10 The zero of the parabola at high temperature corresponds to the melting temperature Tm at which unfolded and folded states have equal probabilities. Thermophiles increase the value of Tm by either i) increasing the value of , ii) shifting Ts to higher values or iii) reducing the curvature of ΔGunf(T).10,72 It was found that a large class of thermophiles adopt the latter strategy and therefore manifests a smaller heat capacity of unfolding, ΔCp, with respect to the mesophilic counterparts.10 Several microscopic mechanisms might cause a smaller ΔCp of unfolding. For example, a study of the Ribonuclease H protein proposed that thermophiles could preserve partial secondary structures in the unfolded state that shield hydrophobic groups from water;73 on the other hand it was shown that the higher content of polar groups generally found in thermophiles suffices to explain the observed lower ΔCp.62 Finally, and more related to the analysis presented above, on the basis of NMR experiments probing the backbone bonds orientation74,75 it was proposed that a broadening of the stability curve could be related to high conformational fluctuations in the folded state, as discussed in ref.9,76,77 The larger number of conformational states along with its chemical composition suggest that ΔCp of unfolding for the H G-domain should be smaller than that for the M protein. Unfortunately, to the best of our knowledge, a systematic comparison of calorimetric data for the isolated G-domains is still lacking. The few previous calorimetric studies available in the literature78-80 focused on the role of inter-domain interactions, flexibility and ligand binding on the EF proteins’ thermal stability but data of ΔCp are not available. For the entire hyperthermophilic EF-1α protein the presence of secondary structures was observed in the denatured ensemble for pH > 4.580 but it is not clear if those are located in the G-domain or elsewhere. It is also worth mentioning that from the experimental side, an accurate estimate of ΔCp is possibly compromised by the irreversible nature of the thermal unfolding process of the EFs proteins.79,80
Diffusion in the folded landscape
The network analysis presented above is a powerful comparative tool in order to gain information on the conformational fluctuations and the free energy landscape for homologous proteins. However it is important to verify in a more robust way if the landscape is representative of the kinetic separation between substates.81 To this end, for each observable and protein, the original clustering is coarse grained via an iterative procedure based on a Markov clustering algorithm44,45(see Methods) which separates the states depending on their effective kinetic barriers. The clusters with fast interconversions are merged and represented as a unique node, as shown in Fig. 5. The obtained results confirm for all the CVs that the landscape of M constitutes a unique main basin while at the same level of resolution the H protein has many kinetically separated states.
Figure 5. Coarse-grained network representations of the folded substates.
The above networks were generated using the Markov Clustering Algorithm (MCL)44 on the respective collective variable clustering (see Methods). Thus they represent a coarse grained description of the initial clustering where the more kinetically relevant substates have been merged into one node. In particular, depicted in (C) are the coarse grained representations of the two networks in Fig. 5. The single control parameter for the MCL algorithm, namely the granularity, was set equal to 1.3, 2.0 and 1.7 for RMSD, Q and n respectively. Note that for each variable and for the same granularity, the hyperthermophilic system is always decomposed in more substates.
The number of substates and the distribution of the separating kinetic barriers impact the diffusivity in the free energy landscape pertaining to the folded state. The motion with respect to a given collective variable is here associated to a diffusion coefficient D47 (see Methods). Within the harmonic approximation, D is given by the fluctuations of the CV divided by its characteristic decorrelation time, D = 〈δX2〉/τcorr. For the Q and n variables this approximation is valid and the time-correlation function of their fluctuations decays exponentially, c(t) = 〈δX(t) · δX(0)〉 ≃ e−t/τc, where X indicates either n or Q (see Fig. S6). While the fluctuations of the CVs are rather comparable between the two systems, the decorrelation times are systematically longer for the H G-domain mirroring a higher internal protein friction, see Table 2. For the RMSD variable the fluctuations are largely anharmonic, and it is somewhat arbitrary to individuate a time-window of a stationary behavior. Thus, an external harmonic bias is applied to restrain the RMSD around the respective averages for M and H; the resulting τcorr and D reproduce the trend observed for n and Q CVs.
Table 2. Diffusion constant for the protein conformational motion.
| CV | 〈 δX 2 〉 | τcorr (ns) | D | |
|---|---|---|---|---|
| M | RMSD * | 5.0×10⁻³ | 0.6 | 8.4×10⁻³ |
| Q | 25.5×10⁻⁵ | 1.8 | 143×10−6 | |
| n | 5.0×10⁻⁵ | 3.2 | 15.6×10⁻⁶ | |
| H | RMSD * | 4.0×10⁻³ | 7.1 | 6.0×10⁻⁴ |
| Q | 19.8×10⁻⁵ | 4.3 | 46×10−6 | |
| n | 10.0×10⁻⁵ | 23.1 | 3.9×10⁻⁶ |
The RMSD fluctuations were computed by applying an harmonic restraint (KRMSD=100 kcal/mol) around the value RMSD0=3.3 Å and RMSD0=3.7 Å for the M and H proteins, espectively.
The intramolecular diffusion over a conformational landscape is a key parameter in the theory of protein folding.82 Experiments based on atomic force microscopy83 and Föster resonance energy transfer84 have tentatively provide estimates for the coefficient D for unfolded and transition state configurations along the end-to-end distance reaction coordinate. By using atomic force spectroscopy it would be of great interest to observe if thermophilic proteins exhibit a slower motion along the pulling direction than their mesophilic homologues.
Substrate binding
Up to here we investigated the flexibility/rigidity of the two G-domains at different time and length scales. However, as a common belief, the rigidity paradigm, which is invoked to rationalise the enhanced thermal stability of thermophiles, is also adopted to explain the lack of activity at ambient condition. Therefore, as a necessary final step we examine the correlation between the protein conformational fluctuations and its activity. We specifically focus on the binding process of the GTP substrate. A detailed study of the chemical step of the GTPase activity is beyond the scope of the present work as it requires an adequate computational machinery and modelling.85 Moreover, it was shown for the dihydrofolate reductase enzyme that when the chemical step is considered, the lack of activity at ambient condition of the thermophilic variant results from a higher kinetic barrier with respect to the mesophilic protein, with no need to appeal for special mechanical rigidity of the protein.32 In our approach we estimate the binding free-energy of the substrate by performing docking experiments on a large set of protein conformations extracted from the MD trajectories. The poses are filtered according to the best score and to their similarity with respect to the orientation of the GDP/GTP purine ring in the holo protein, and referred to as native-like,35 a representative pose is given in Fig. S1.
At ambient temperature, a stronger GTP binding is predicted on average for the H protein than for M, with ΔG=7.1 kcal/mol and ΔG=4.7 kcal/mol, respectively. The fluctuations of the protein conformation induce a deviation of the binding energy of the order of 20% for both G-domains. The decomposition of the binding free energy49 indicates that the stronger binding in the hyperthermophilic protein is mostly due to the the electrostatic interaction between the GTP and the binding site, see Table S1. This first result shows that the conformations sampled by the H protein at ambient conditions are favorable to GTP binding. In future work specific attention should be payed to the binding path and verify whether barriers could hinder the diffusion of the substrate at the active site of the H protein at ambient T.
At high temperature, T = 360 K, we monitor the GTP binding capability along longer trajectories up to 1.5 μs and 1.0 μs for M and H, respectively. When the poses were filtered according to the location of the purine ring, we did not observe an important effect of the unfolding early steps on the binding energy. However, when looking at the correct location of the phosphates in the binding site, we notice for the M protein a dramatic decreases in the number of low energy poses. This means that the unfolding of the switch I region, and the consequent reorganization of the helix A and the P loop33,85(Fig. S1), degrade the binding capability of the mesophilic protein.
Concluding Remarks
By using extensive simulations and several different indicators we investigated the degree of thermostability of two homologous G-domains, belonging to the mesophilic EF-Tu and the hyperthermophilic EF-1α proteins, respectively. In particular, we questioned the common view according to which thermophilic proteins are more rigid than their mesophilic homologues at ambient conditions. In this view, an enhanced rigidity of thermophiles confers resistance to thermal stress and is the cause for the lack of activity of this class of proteins at ambient temperature. We first verified that the two homologous proteins exhibit different thermal stabilities in silico, with the mesophilic protein signalling the onset of unfolding at a high, but physical, melting temperature (T = 360 K) while the hyperthermophilic domain preserves its native structure.
The weak spot of the mesophilic protein, that is, the region where unfolding initiates, involves the so-called switch I region, a key motif for both the catalytic GTPase catalysis and the long range allosteric conformational displacement occurring upon ribosome binding.54-56 The equivalent region in the hyperthemophilic protein is structurally stabilized by the insertion of two small helices (α1 [E32-L45] and α2 [E48-E63], see Fig. S1) and by frequent ion-pairing between charged amino-acids.24,34 This first result indicates that the flexibility and structure of the switch I region is optimized in the mesophilic protein for enhancing the catalytic activity at room temperature. When temperature is raised, the early unfolding of this region undermines the pre-organisation of the active site.85 In the hyperthermophilic protein, the switch I region is more resistant to temperature increase, thus its potential contribution to optimal catalysis is preserved at high temperatures.
When focusing on the behavior of the folded state at ambient condition, we noted that the hyperthermophilic protein shows comparable or even enhanced flexibility with respect to the mesophilic protein, depending on the time- and length-scale considered. Average atomistic fluctuations were comparable in magnitude among the two proteins but rigid and flexible stretches of amino acids are differently partitioned over the matrix, with the H species being characterized by an alternation of atomistic flexibility, recalling a caging effect along the sequence. This alternation is an effect of the specific structural motives α1 and α2 that differentiate the H G-domain and, as discussed above, contribute to stabilizing this region. The caging attitude of the investigated thermophile suggests a new strategy to enhance the stability of proteins by tuning the extension and distribution of flexible/rigid parts along the primary sequence.
When analyzing the global protein dynamics, we represented the conformational landscapes of the two proteins as a network of substates. Such an approach catered a direct evidence that the hyperthermophilic protein is characterized by a larger number of conformational substates kinetically separated; on the contrary the M protein fluctuates in an isolated conformational basin. The observed enhanced conformational flexibility of the H protein should cause a smaller heat capacity of unfolding75 with respect to the M species and therefore a reduced curvature of the stability curve along with a higher melting temperature. The smaller temperature dependency of the protein’s intrinsic compressibility observed for the H protein supports this mechanism of stabilization as well. Unfortunately, up to now the thermodynamic mechanism10 underlying the higher stability of the Solfolobus solfataricus G-domain with respect to that from E. coli has not been experimentally probed.
In future work we plan to investigate more closely the relationship between calorimetric data10 and the morphology of the conformational landscape as well as the correlation between mechanical and thermal stability by extending our investigation to other homologous proteins.
Supplementary Material
Acknowledgement
The research leading to these results has received funding from the European Research Council under the European Community’s Seventh Framework Programme (FP7/2007-2013 Grant Agreement no. 258748.) This work was performed using HPC resources from GENCI [CINES] (grants 2012 c2012086818 and 2013 ×2013076818) and CINECA supercomputing centre (ISCRA grant FLEXPROT). We acknowledge the financial support for infrastructures from ANR-11- LABX-0011-01. We are grateful to F. Rao, A. Taly, C. Robert, G. Stirnemann and P. Derreumaux for useful discussions.
References
- (1).Yang A-S, Sharp KA, Honig B. Analysis of the Heat Capacity Dependence of Protein Folding. J. Mol. Biol. 1992;227:889–900. doi: 10.1016/0022-2836(92)90229-d. [DOI] [PubMed] [Google Scholar]
- (2).Robertson AD, Murphy KP. Protein Structure and the Energetics of Protein Stability. Chem. Rev. 1997;97:1251–1268. doi: 10.1021/cr960383c. [DOI] [PubMed] [Google Scholar]
- (3).Gribenko AV, Patel MM, Liu J, McCallum SA, Wang C, Makhatadze GI. Rational Stabilization of Enzymes by Computational Redesign of Surface Charge-Charge Interactions. Proc. Natl. Acad. Sci. USA. 2009;106:2601–6. doi: 10.1073/pnas.0808220106. [DOI] [PMC free article] [PubMed] [Google Scholar]
- (4).Li Y, Drummond DA, Sawayama AM, Snow CD, Bloom JD, Arnold FH. A Diverse Family of Thermostable Cytochrome P450s Created by Recombination of Stabilizing Fragments. Nat. Biotechnol. 2007;25:1051–1056. doi: 10.1038/nbt1333. [DOI] [PubMed] [Google Scholar]
- (5).Reetz MT, Carballeira JD, Vogel A. Iterative Saturation Mutagenesis on the Basis of B Factors as a Strategy for Increasing Protein Thermostability. Angew Chem Int Ed Engl. 2006;45:7745–7751. doi: 10.1002/anie.200602795. [DOI] [PubMed] [Google Scholar]
- (6).Marshall SA, Mayo SL. Achieving Stability and Conformational Specificity in Designed Proteins via Binary Patterning. J. Mol. Biol. 2001;305:619–631. doi: 10.1006/jmbi.2000.4319. [DOI] [PubMed] [Google Scholar]
- (7).Vieille C, Zeikus GJ. Hyperthermophilic enzymes: Sources, Uses, and Molecular Mechanisms for Thermostability. Microbiol. Mol. Biol. Rev. 2001;65:1–43. doi: 10.1128/MMBR.65.1.1-43.2001. [DOI] [PMC free article] [PubMed] [Google Scholar]
- (8).Jaenicke R, Böhm G. The Stability of Proteins in Extreme Environments. Curr. Opin. Struct. Biol. 1998;8:738–748. doi: 10.1016/s0959-440x(98)80094-8. [DOI] [PubMed] [Google Scholar]
- (9).Sterpone F, Melchionna S. Thermophilic Proteins: Insight and Perspective from In Silico Experiments. Chem. Soc. Rev. 2012;41:1665–1676. doi: 10.1039/c1cs15199a. [DOI] [PMC free article] [PubMed] [Google Scholar]
- (10).Razvi A, Scholtz JM. Lessons in Stability from Thermophilic Proteins. Protein Sci. 2006;15:1569–1578. doi: 10.1110/ps.062130306. [DOI] [PMC free article] [PubMed] [Google Scholar]
- (11).Wrba A, Schweiger A, Schultes V, Jaenicke R, Zavodszky P. Extremely Thermostable D-glyceraldehyde-3-phosphate Dehydrogenase from the Eubacterium Thermotoga Maritima. Biochemistry. 1990;29:7584–7592. doi: 10.1021/bi00485a007. [DOI] [PubMed] [Google Scholar]
- (12).Závodszky P, Kardos J, Svingor A, Petsko GA. Adjustment of Conformational Flexibility is a Key Event in the Thermal Adaptation of Proteins. Proc. Natl. Acad. Sci. USA. 1998;95:7406–7411. doi: 10.1073/pnas.95.13.7406. [DOI] [PMC free article] [PubMed] [Google Scholar]
- (13).Hernandez G, Jenney FE, Adams MWW, LeMaster DM. Millisecond Time Scale Conformational Flexibility in a Hyperthermophile Protein at Ambient Temperature. Proc. Natl. Acad. Sci. USA. 2000;97:3166–3170. doi: 10.1073/pnas.040569697. [DOI] [PMC free article] [PubMed] [Google Scholar]
- (14).Jaenicke R. Do Ultrastable Proteins from Hyperthermophiles Have High or Low Conformational Rigidity? Proc. Natl. Acad. Sci. USA. 2000;97:2962–2964. doi: 10.1073/pnas.97.7.2962. [DOI] [PMC free article] [PubMed] [Google Scholar]
- (15).Fitter J, Heberle J. Structural Equilibrium Fluctuations in Mesophilic and Thermophilic a-Amylase. Biophys. J. 2000;79:1629–1636. doi: 10.1016/S0006-3495(00)76413-7. [DOI] [PMC free article] [PubMed] [Google Scholar]
- (16).Butterwick JA, Loria JP, Astrof NS, Kroenke CD, Cole R, Rance M, Palmer AG., III Multiple Time Scale Backbone Dynamics of Homologous Thermophilic and Mesophilic Ribonuclease HI Enzymes. J. Mol. Biol. 2004;339:855–871. doi: 10.1016/j.jmb.2004.03.055. [DOI] [PubMed] [Google Scholar]
- (17).Tehei M, Madern D, Franzetti B, Zaccai G. Neutron Scattering Reveals the Dynamic Basis of Protein Adaptation to Extreme Temperature. J. Biol. Chem. 2005;280:40974–40979. doi: 10.1074/jbc.M508417200. [DOI] [PubMed] [Google Scholar]
- (18).Meinhold L, Clement D, Tehei M, Daniel R, Finney JL, Smith JC. Protein Dynamics and Stability: The Distribution of Atomic Fluctuations in Thermophilic and Mesophilic Dihydrofolate Reductase Derived Using Elastic Incoherent Neutron Scattering. Biophys. J. 2008;94:4812–4818. doi: 10.1529/biophysj.107.121418. [DOI] [PMC free article] [PubMed] [Google Scholar]
- (19).Elcock AH. The Stability of Salt Bridges at High Temperatures: Implications for Hyperthermophilic Proteins. J. Mol. Biol. 1998;284:489–502. doi: 10.1006/jmbi.1998.2159. [DOI] [PubMed] [Google Scholar]
- (20).Xiao L, Honig B. Electrostatic Contributions to the Stability of Hyperthermophilic Proteins. J. Mol. Biol. 1999;289:1435–44. doi: 10.1006/jmbi.1999.2810. [DOI] [PubMed] [Google Scholar]
- (21).Dominy BN, Minoux H, Brooks CL., 3rd An Electrostatic Basis for the Stability of Thermophilic Proteins. Proteins. 2004;57:128–41. doi: 10.1002/prot.20190. [DOI] [PubMed] [Google Scholar]
- (22).Huang X, Zhou H-X. Similarity and Difference in the Unfolding of Thermophilic and Mesophilic Cold Shock Proteins Studied by Molecular Dynamics Simulations. Biophys. J. 2006;91:2451–2463. doi: 10.1529/biophysj.106.082891. [DOI] [PMC free article] [PubMed] [Google Scholar]
- (23).Missimer JH, Steinmetz MO, Baron R, Winkler FK, Kammerer RA, Daura X, van Gunsteren WF. Configurational Entropy Elucidates the Role of Salt-bridge Networks in Protein Thermostability. Protein Sci. 2007;16:1349–59. doi: 10.1110/ps.062542907. [DOI] [PMC free article] [PubMed] [Google Scholar]
- (24).Sterpone F, Bertonati C, Briganti G, Melchionna S. Key Role of Proximal Water in Regulating Thermostable Proteins. J. Phys. Chem. B. 2009;113:131–7. doi: 10.1021/jp805199c. [DOI] [PubMed] [Google Scholar]
- (25).McCully M, Beck D, Daggett V. Promiscuous Contacts and Heightened Dynamics Increase Thermostability in an Engineered Variant of the Engrailed Homeodomain. Protein. Eng. Des. Sel. 2013;26:35–45. doi: 10.1093/protein/gzs063. [DOI] [PMC free article] [PubMed] [Google Scholar]
- (26).Yin H, Hummer G, Rasaiah JC. Metastable Water Clusters in the Nonpolar Cavities of the Thermostable Protein Tetrabrachion. J. Am. Chem. Soc. 2007;129:7369–77. doi: 10.1021/ja070456h. [DOI] [PubMed] [Google Scholar]
- (27).Rahaman O, Melchionna S, Laage D, Sterpone F. The Ėect of Protein Composition on Hydration Dynamics. Phys. Chem. Chem. Phys. 2013;15:3570–3576. doi: 10.1039/C3CP44582H. [DOI] [PMC free article] [PubMed] [Google Scholar]
- (28).Marcos E, Mestres P, Crehuet R. Crowding Induces Differences in the Diffusion of Thermophilic and Mesophilic Proteins: A New Look at Neutron Scattering Results. Biophys. J. 2011;101:2782–2789. doi: 10.1016/j.bpj.2011.09.033. [DOI] [PMC free article] [PubMed] [Google Scholar]
- (29).Marcos E, Jiménez A, Crehuet R. Dynamic Fingerprints of Protein Thermostability Revealed by Long Molecular Dynamics. J. Chem. Theory. Comput. 2012;8:1129–1142. doi: 10.1021/ct200877z. [DOI] [PubMed] [Google Scholar]
- (30).Basu S, Sen S. Do Homologous Thermophilic-Mesophilic Proteins Exhibit Similar Structures and Dynamics at Optimal Growth Temperatures? A Molecular Dynamics Simulation Study. J. Chem. Inf. Model. 2013;53:423–434. doi: 10.1021/ci300474h. [DOI] [PubMed] [Google Scholar]
- (31).Manjunath K, Sekar K. Molecular Dynamics Perspective on the Protein Thermal Stability: A Case Study Using SAICAR Synthetase. J. Chem. Inf. Model. 2013 doi: 10.1021/ci400306m. DOI:10.1021/ci400306m. [DOI] [PubMed] [Google Scholar]
- (32).Roca M, Liu H, Messer B, Warshel A. On the Relationship Between Thermal Stability and Catalytic Power of Enzymes. Biochemistry. 2007;46:15076–88. doi: 10.1021/bi701732a. [DOI] [PMC free article] [PubMed] [Google Scholar]
- (33).Jensen M, Cool R, Mortensen K, Clark B, Parmeggiani A. Structure-function Relationships of Elongation Factor Tu. Isolation and Activity of the Guanine-nucleotide-binding domain. Eur. J. Biochm. 1989;182:247–255. doi: 10.1111/j.1432-1033.1989.tb14824.x. [DOI] [PubMed] [Google Scholar]
- (34).Luigi V, Alessia R, Mariorosario M, Piergiuseppe C, Paolo A, Adriana Z. The Crystal Structure of Sulfolobus Solfataricus Elongation Factor 1alpha in Complex with Magnesium and GDP. Biochemistry. 2004;43:6630–6636. doi: 10.1021/bi0363331. [DOI] [PubMed] [Google Scholar]
- (35).Song H, Parsons MR, Rowsell S, Leonard G, Phillips SE. Crystal Structure of Intact Elongation Factor EF-Tu from Escherichia coli in GDP Conformation at 2.05 Å Resolution. J. Mol. Biol. 1999;285:1245–1256. doi: 10.1006/jmbi.1998.2387. [DOI] [PubMed] [Google Scholar]
- (36).MacKerell AD, Feig M, Brooks CL., III Extending the Treatment of Backbone Energetics in Protein Force Fields: Limitations of Gas-phase Quantum Mechanics in Reproducing Protein Conformational Distributions in Molecular Dynamics Simulations. J. Comput. Chem. 2004;25:1400–1415. doi: 10.1002/jcc.20065. [DOI] [PubMed] [Google Scholar]
- (37).Hornak V, Abel R, Okur A, Strockbine B, Roitberg A, Simmerling C. Comparison of Multiple Amber Force Fields and Development of Improved Protein Backbone Parameters. Proteins. 2006;65:712–725. doi: 10.1002/prot.21123. [DOI] [PMC free article] [PubMed] [Google Scholar]
- (38).James C,P, Wang RBW, Gumbart J, Tajkhorshid E, Villa E, Skeel CCRD, Kalé L, Schulten K. Scalable Molecular Dynamics with NAMD. J. Comput. Chem. 2005;26:1781–1802. doi: 10.1002/jcc.20289. [DOI] [PMC free article] [PubMed] [Google Scholar]
- (39).Fiorin G, Klein ML, Hénin J. Using Collective Variables to Drive Molecular Dynamics Simulations. Mol. Phys. 2013 in press. [Google Scholar]
- (40).Abel S, Dupradeau F-Y, Marchi M. Molecular Dynamics Simulations of a Characteristic DPC Micelle in Water. J. Chem. Theory. Comput. 2012;8:4610–4623. doi: 10.1021/ct3003207. [DOI] [PubMed] [Google Scholar]
- (41).Rycroft C. VORO++: a Three-dimensional Voronoi Cell Library in C++ Chaos. 2009;19:041111. doi: 10.1063/1.3215722. [DOI] [PubMed] [Google Scholar]
- (42).Hartigan J. Clustering Algorithms. Wiley; New York: 1975. [Google Scholar]
- (43).Lloyd SP. Least Squares Quantization in PCM. IEEE Trans. Inf. Theory. 1982;28:129–137. [Google Scholar]
- (44).van Dongen SM. Ph.D. thesis. University of Utrecht; The Netherlands: 2000. Graph Clustering by Flow Simulation. [Google Scholar]
- (45).Gfeller D, De Los Rios P, Caflisch A, Rao F. Complex Network Analysis of Free-Energy Landscapes. Proc. Natl. Acad. Sci. USA. 2007;104:1817–1822. doi: 10.1073/pnas.0608099104. [DOI] [PMC free article] [PubMed] [Google Scholar]
- (46).Schulten K, Kosztin I. Lectures in Theoretical Biophysics. Department of Physics and Beckman Institute, University of Illinois; 2000. [Google Scholar]
- (47).Hummer G. Position-dependent diffusion coefficients and Free Energies from Bayesian Analysis of Equilibrium and Replica Molecular Dynamics Simulations. New J. Phys. 2005;7:34. [Google Scholar]
- (48).Morris GM, Huey R, Lindstrom W, Sanner MF, Belew RK, Goodsell DS, Olson AJ. Autodock4 and AutoDockTools4: Automated Docking With Selective Receptor Flexiblity. J. Comput. Chem. 2009;16:2785–2791. doi: 10.1002/jcc.21256. [DOI] [PMC free article] [PubMed] [Google Scholar]
- (49).Huey R, Morris GM, Olson AJ, Goodsell DS. A Semiempirical Free Energy Force Field with Charge-Based Desolvation. J. Comput. Chem. 2007;28:1145–1152. doi: 10.1002/jcc.20634. [DOI] [PubMed] [Google Scholar]
- (50).Grant BJ, Rodrigues APC, Elsawy KM, Mccammon JA, Caves LSD. Bio3d: An R Package for the Comparative Analysis of Protein Structures. Bioinformatics. 2006;22:2695–2696. doi: 10.1093/bioinformatics/btl461. [DOI] [PubMed] [Google Scholar]
- (51).R Development Core Team . R: A Language and Environment for Statistical Computing. R Foundation for Statistical Computing; Vienna, Austria: 2008. ISBN 3-900051-07-0. [Google Scholar]
- (52).Nymeyer H, Onuchic J. Folding Funnels and Frustration in Off-lattice Minimalist Protein Landscapes. Proc. Natl. Acad. Sci. USA. 1998;95:5921–5928. doi: 10.1073/pnas.95.11.5921. [DOI] [PMC free article] [PubMed] [Google Scholar]
- (53).Best R, Hummer G. Coordinate-dependent Diffusion in Protein Folding. Proc. Natl. Acad. Sci. USA. 2010;107:1088–1093. doi: 10.1073/pnas.0910390107. [DOI] [PMC free article] [PubMed] [Google Scholar]
- (54).Abel K, Yoder MD, Hilgenfeld R, Jurnak F. An α to β Conformational Switch in EF-Tu. Structure. 1996;4:1153–1159. doi: 10.1016/s0969-2126(96)00123-2. [DOI] [PubMed] [Google Scholar]
- (55).Polekhina G, Thirup S, Kjeldgaard M, Nissen P, Lippmann C, Nyborg J. Helix Unwinding in the Effector Region of Elongation Factor EF-Tu-GDP. Structure. 1996;4:1141–1151. doi: 10.1016/s0969-2126(96)00122-0. [DOI] [PubMed] [Google Scholar]
- (56).Villa E, Sengupta J, Trabuco LG, LeBarron J, Baxter WT, Shaikh TR, Grassucci RA, Nissen P, Ehrenberg M, Schulten K, Frank J. Ribosome-induced Changes in Elongation Factor Tu Conformation Control GTP Hydrolysis. Proc. Natl. Acad. Sci. USA. 2009;106:1063–1068. doi: 10.1073/pnas.0811370106. [DOI] [PMC free article] [PubMed] [Google Scholar]
- (57).Maragliano L, Cottone G, Cordone L, Ciccotti G. Atomic Mean-Square Displacements in Proteins by Molecular Dynamics: A Case for Analysis of Variance. Biophys. J. 2004;86:2765–2772. doi: 10.1016/S0006-3495(04)74330-1. [DOI] [PMC free article] [PubMed] [Google Scholar]
- (58).Botan V, Backus EHG, Pfister R, Moretto A, Crisma M, Toniolo C, Nguyen PH, Stock G, Hamm P. Energy Transport in Peptide Helices. Proc. Natl. Acad. Sci. USA. 2007;104:12749–12754. doi: 10.1073/pnas.0701762104. [DOI] [PMC free article] [PubMed] [Google Scholar]
- (59).Ganim Z, Chung HS, Smith AW, DeFlores LP, Jones KC, Tokmakoff A. Amide I Two-Dimensional Infrared Spectroscopy of Proteins. Acc. Chem. Res. 2008;41:432–441. doi: 10.1021/ar700188n. [DOI] [PubMed] [Google Scholar]
- (60).Voronoi GF. Nouvelles Applications des Paramètres Continus à la théorie des Formes Quadratiques. J. Reine Angew. Math. 1908;134 [Google Scholar]
- (61).Šanderová H, Tišerová H, Barvík I, Sojka L, Jonák J, Krásný L. The N-terminal Region is Crucial for the Thermostability of the G-domain of Bacillus. Biochim. Biophys. Acta. 2010;1804:147–155. doi: 10.1016/j.bbapap.2009.09.024. [DOI] [PubMed] [Google Scholar]
- (62).Zhou H-X. Toward the Physical Basis of Thermophilic Proteins: Linking of Enriched Polar Interactions and Reduced Heat Capacity of Unfolding. Biophys. J. 2002;83:3126–33. doi: 10.1016/S0006-3495(02)75316-2. [DOI] [PMC free article] [PubMed] [Google Scholar]
- (63).Ninad VP, Sharp KA. Heat Capacity in Proteins. Annu. Rev. Phys. Chem. 2005;56:521–548. doi: 10.1146/annurev.physchem.56.092503.141202. [DOI] [PubMed] [Google Scholar]
- (64).Dadarlat VM, Post CB. Adhesive-cohesive Model for Protein Compressibility: An Alternative Perspective on Stability. Proc. Natl. Acad. Sci. USA. 2003;100:14778–83. doi: 10.1073/pnas.2434157100. [DOI] [PMC free article] [PubMed] [Google Scholar]
- (65).Lopez CF, Darst RK, Rossky PJ. Mechanistic Elements of Protein Cold Denaturation. J. Phys. Chem. B. 2008;112:5961–7. doi: 10.1021/jp075928t. [DOI] [PubMed] [Google Scholar]
- (66).Phelps DK, Post CB. A Novel Basis for Capsid Stabilization by Antiviral Compounds. J. Mol. Biol. 1995;254:544–551. doi: 10.1006/jmbi.1995.0637. [DOI] [PubMed] [Google Scholar]
- (67).Marchi M. Compressibility of Cavities and Biological Water from Voronoi Volumes in Hydrated Proteins. J. Phys. Chem. B. 2003;107:6598–6602. [Google Scholar]
- (68).Sterner RH, Liebl W. Thermophilic Adaptation of Proteins. Crit Rev Biochem Mol Biol. 2001;36:39–106. doi: 10.1080/20014091074174. [DOI] [PubMed] [Google Scholar]
- (69).Wasserman S. Social Network Analysis: Methods and Applications. Cambridge University Press; 1994. [Google Scholar]
- (70).Shannon CE. Prediction and Entropy of Printed English. Bell Systems Technical Journal. 1951:50–64. [Google Scholar]
- (71).Bastian M, Heymann S, Jacomy M. Gephi: An Open Source Software for Exploring and Manipulating Networks. 2009. [Google Scholar]
- (72).Nojima H, Ikai A, Oshima T, Noda H. Reversible Thermal Unfolding of Thermostable Phosphoglycerate Kinase. Thermostability Associated With Mean Zero Enthalpy Change. J. Mol. Biol. 1977;116:429–442. doi: 10.1016/0022-2836(77)90078-x. [DOI] [PubMed] [Google Scholar]
- (73).Robic S, Guzman-Casado M, Sanchez-Ruiz JM, Marqusee S. Role of Residual Structure in the Unfolded State of a Thermophilic Protein. Proc. Natl. Acad. Sci. USA. 2003;100:11345–9. doi: 10.1073/pnas.1635051100. [DOI] [PMC free article] [PubMed] [Google Scholar]
- (74).Stone MJ, Gupta S, Snyder N, Regan L. Comparison of Protein Backbone Entropy and β-Sheet Stability: NMR-Derived Dynamics of Protein G B1 Domain Mutants. J. Am. Chem. Soc. 2001;123:185–186. doi: 10.1021/ja003094l. [DOI] [PubMed] [Google Scholar]
- (75).Stone MJ. NMR Relaxation Studies of the Role of Conformational Entropy in Protein Stability and Ligand Binding. Acc. Chem. Res. 2001;34:379–388. doi: 10.1021/ar000079c. [DOI] [PubMed] [Google Scholar]
- (76).Merkley ED, Parson WW, Daggett V. Temperature Dependence of the Flexibility of Thermophilic and Mesophilic Flavoenzymes of the Nitroreductase Fold. Protein Eng. Des. Sel. 2010;23:327–36. doi: 10.1093/protein/gzp090. [DOI] [PMC free article] [PubMed] [Google Scholar]
- (77).Wintrode PL, Zhang D, Vaidehi N, Arnold FH, Goddard WA., III Protein Dynamics in a Family of Laboratory Evolved Thermophilic Enzymes. J. Mol. Biol. 2003;327:745–757. doi: 10.1016/s0022-2836(03)00147-5. [DOI] [PubMed] [Google Scholar]
- (78).Budkevich TV, Timchenko AA, Tiktopulo EI, Negrutskii BS, Shalak VF, Petrushenko ZM, Aksenov VL, Willumeit R, Kohlbrecher J, Serdyuk IN, El’skaya AV. Extended Conformation of Mammalian Translation Elongation Factor 1A in Solution. Biochemistry. 2002;41:15342–15349. doi: 10.1021/bi026495h. [DOI] [PubMed] [Google Scholar]
- (79).Sedlák E, Sprinzl M, Grillenbeck N, Antalík M. Microcalorimetric Study of Elongation Factor Tu from Thermus Thermophilus in Nucleotide-free, GDP and GTP Forms and in the Presence of Elongation Factor Ts. Biochim. Biophys. Acta. 2002;1596:357–365. doi: 10.1016/s0167-4838(02)00225-x. [DOI] [PubMed] [Google Scholar]
- (80).Granata V, Graziano G, Ruggiero A, Raimo G, Masullo M, Arcari P, Vitagliano L, Zagari A. Stability Against Temperature of Sulfolobus Solfataricus Elongation Factor 1a, a Multi-domain Protein. Biochim. Biophys. Acta. 2008;1784:573–581. doi: 10.1016/j.bbapap.2007.12.018. [DOI] [PubMed] [Google Scholar]
- (81).Keller B, Daura X, Gunsteren WV. Comparing Geometric and Kinetic Cluster Algorithms for Molecular Simulation Data. J. Chem. Phys. 2010;132:074110. doi: 10.1063/1.3301140. [DOI] [PubMed] [Google Scholar]
- (82).Socci ND, Onuchic JN, Wolynes PG. Diffusive Dynamics of the Reaction Coordinate for Protein Folding Funnels. J. Chem. Phys. 1996;104:5860. [Google Scholar]
- (83).Yu H, Gupta AN, Liu X, Neupane K, Brigley AM, Sosova I, Woodside MT. Energy Landscape Analysis of Native Folding of the Prion Protein Yields the Diffusion Constant, Transition Path Time and Rates. Proc. Natl. Acad. Sci. USA. 2012;109:14452. doi: 10.1073/pnas.1206190109. [DOI] [PMC free article] [PubMed] [Google Scholar]
- (84).Möglich A, Joder K, Kiefhaber T. End-to-end Distance Distributions and Intrachain Diffusion Constants in Unfolded Polypeptide Chains Indicate Intramolecular Hydrogen Bond Formation. Proc. Natl. Acad. Sci. USA. 2006;103:12394–12399. doi: 10.1073/pnas.0604748103. [DOI] [PMC free article] [PubMed] [Google Scholar]
- (85).Adamczyk AJ, Warshel A. Converting Structural Information into an Allosteric-energy-based Picture for Elongation Factor Tu Activation by the Ribosome. Proc. Natl. Acad. Sci. USA. 2011;108:9827–9832. doi: 10.1073/pnas.1105714108. [DOI] [PMC free article] [PubMed] [Google Scholar]
Associated Data
This section collects any data citations, data availability statements, or supplementary materials included in this article.