Abstract
The algorithms and neural circuits that process spatiotemporal changes in luminance to extract visual motion cues have been the focus of intense research. An influential model, the Hassenstein-Reichardt correlator1 (HRC), relies on differential temporal filtering of two spatially separated input channels, delaying one input signal with respect to the other. Motion in a particular direction causes these delayed and non-delayed luminance signals to arrive simultaneously at a subsequent processing step in the brain; these signals are then nonlinearly amplified to produce a direction-selective response (Figure 1A). Recent work in Drosophila has identified two parallel pathways that selectively respond to either moving light or dark edges2,3. Each of these pathways requires two critical processing steps to be applied to incoming signals: differential delay between the spatial input channels, and distinct processing of brightness increment and decrement signals. Using in vivo patch-clamp recordings, we demonstrate that four medulla neurons implement these two processing steps. The neurons Mi1 and Tm3 respond selectively to brightness increments, with the response of Mi1 delayed relative to Tm3. Conversely, Tm1 and Tm2 respond selectively to brightness decrements, with the response of Tm1 delayed compared to Tm2. Remarkably, constraining HRC models using these measurements produces outputs consistent with previously measured properties of motion detectors, including temporal frequency tuning and specificity for light vs. dark edges. We propose that Mi1 and Tm3 perform critical processing of the delayed and non-delayed input channels of the correlator responsible for the detection of light edges, while Tm1 and Tm2 play analogous roles in the detection of moving dark edges. Our data shows that specific medulla neurons possess response properties that allow them to implement the algorithmic steps that precede the correlative operation in the HRC, revealing elements of the long-sought neural substrates of motion detection in the fly.
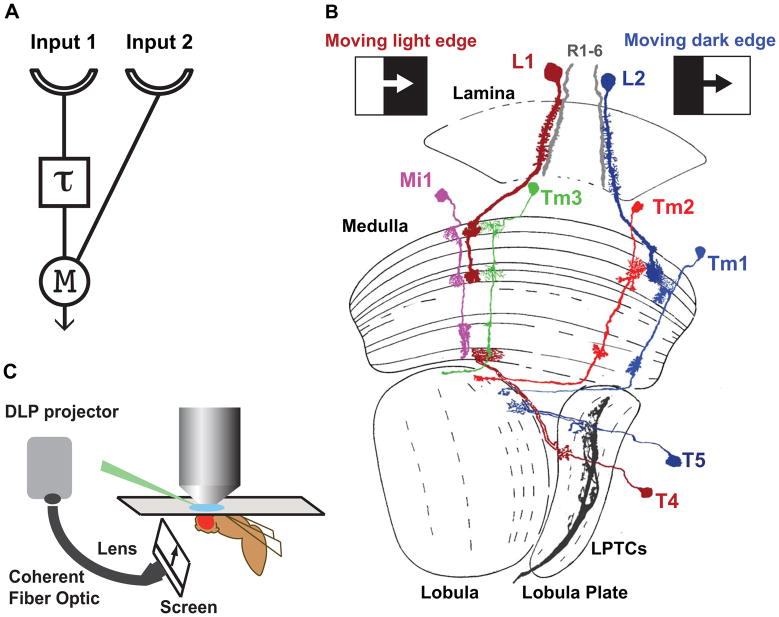
Behavioral and electrophysiological studies in flies have demonstrated that visual motion responses display the fundamental signatures predicted by the HRC1,4,5. In Drosophila, photoreceptors R1–R6 are required for motion detection, and synapse onto three lamina monopolar cells L1, L2 and L36, which provide inputs to distinct motion pathways2,3,7–11. L1 feeds into pathways involved in detecting moving light edges2,3 while L2, with contributions from L1 and L3, is involved in detecting moving dark edges2,3,10 (Figure 1B). Deeper in the optic lobe, two direction-selective neuronal types, T4 and T5, are also differentially tuned: T4 cells respond to moving light edges while T5 cells respond to moving dark edges12. Both T4 and T5 are required for downstream, direction-selective responses of the visual system output cells called lobula plate tangential cells (LPTCs)13,14. According to the HRC model, these light and dark edge direction-selective pathways each require two processing steps: differential temporal delay and nonlinear amplification (Figure 1A). Moreover, these two pathways must process changes in contrast differently in order to respond differentially to light and dark edges. One such asymmetrical mechanism is ‘half-wave rectification’, where inputs of one polarity are amplified and inputs of the opposite polarity are suppressed.
Figure 1. Motion detection and the fly optic lobe.
A. A half Hassenstein-Reichardt correlator (HRC) sensitive to rightward motion. An object moving from left to right first activates input 1 and then input 2. The signal from input 1 is delayed (τ) and arrives at the correlation stage (M for multiplication) close in time to the signal from unit 2, nonlinearly enhancing the signal. For leftward motion, the signals are separated in time by the delay and no motion signal is generated. In the full correlator model, two mirror symmetric correlators are subtracted, producing responses that have opposite signs for opposite directions (see Figure 4A).
B. Light edge (L1) and dark edge (L2) motion sensitive pathways in the Drosophila optic lobe. L1 and L2 lamina monopolar cells in the lamina provide inputs to two distinct motion sensitive pathways that selectively respond to moving light edges and dark edges, respectively. L1 and L3 also contribute to the pathway detecting moving dark edge (not shown). T4 and T5 in the lobula complex are the main inputs to LPTCs, and are themselves direction selective. T4 neurons respond selectively to moving light edges and T5 neurons respond to moving dark edges. Mi1 and Tm3 are the main postsynaptic targets of L1 while Tm1 and Tm2 are the main postsynaptic targets of L2. The axons of Mi1 and Tm3 contact T4 in the most proximal medulla layer, whereas Tm1 and Tm2 contact T5 dendrites in superficial lobula layers (modified from ref. 30).
C. In vivo electrophysiology set up: A window is cut in a dorsal region of the head cuticle of an immobilized live fly to expose the cell bodies of medulla neurons to a glass pipette used to perform the recordings. Grey-scale images are displayed on a screen positioned in front of the fly, using a digital light projector (DLP) coupled to a coherent fiber optic.
Since L1 and L2 relay information about both contrast increments and decrements3 (they hyperpolarize in response to light increments and depolarize in response to decrements) and act as inputs to motion pathways, we focused on medulla neurons that link L1 and L2 to T4 and T5 to identify potential sites of half-wave rectification and delay. Electron microscopic reconstruction of the medulla has identified columnar neurons types Tm3 and Mi1 as receiving the large majority of synapses from L115,16. Similarly, Tm1 and Tm2 are the main synaptic targets of L215,16. Furthermore, Mi1 and Tm3 together constitute over 80% of the presynaptic inputs to T416 and both Tm1 and Tm2 provide input to T517. Based on their innervation patterns, Mi1 and Tm3 have been proposed to be core components of the motion detector for light edges involving T416. Similarly, Tm1 and Tm2 are likely candidates for analogous roles in a motion detector for dark edges.
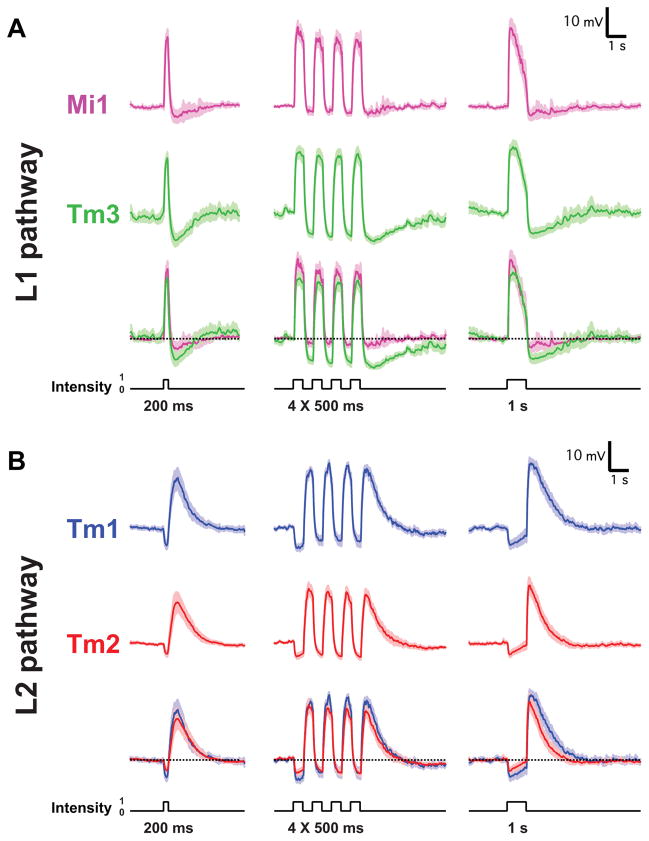
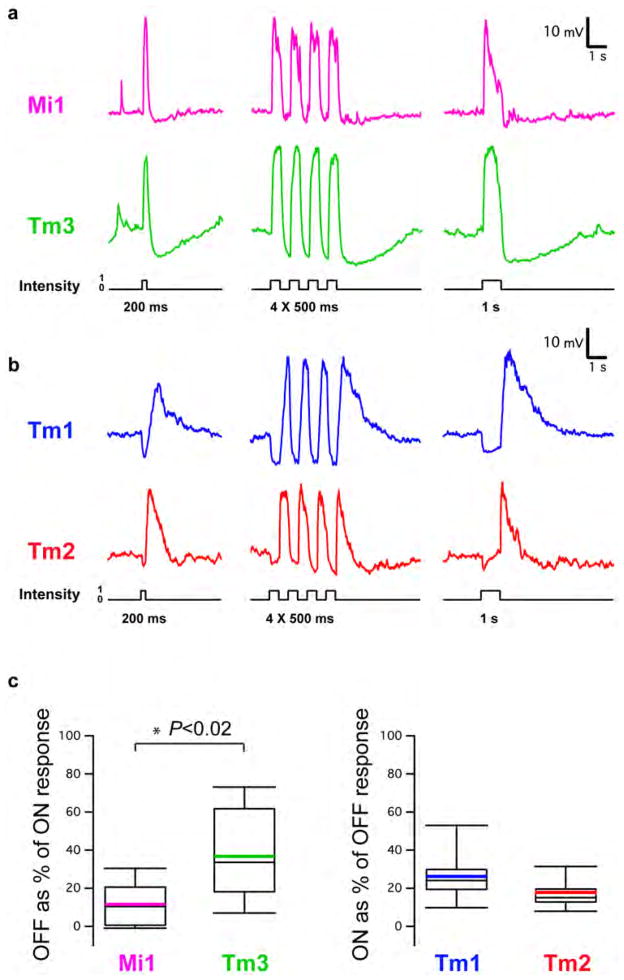
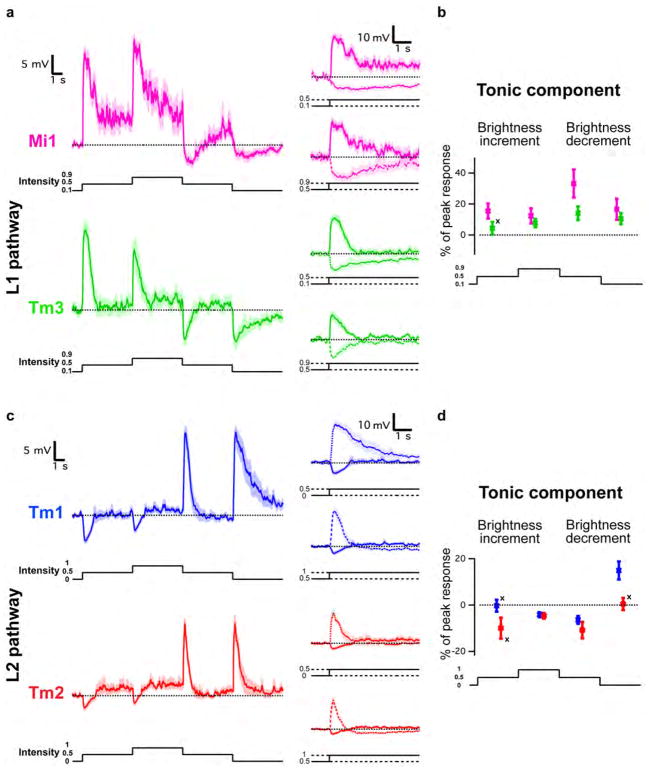
Since changes in luminance are central to motion detection, we first examined the responses of Mi1, Tm3, Tm1 and Tm2 to step changes in light intensity by performing whole-cell current-clamp recordings on awake immobilized fruit flies (Figure 1C). Both Mi1 and Tm3 responded with a strong, transient depolarization at the onset of a 1 s light step, and then transiently hyperpolarized to below pre-stimulus levels at light offset (Figure 2A right and Extended data Figure 1A). The responses to onset and offset of light differed in magnitude: in Mi1, the offset hyperpolarization amplitude was only 11% (SEM=3.5%) of the onset depolarization, while in Tm3, this fraction was 36.6% (SEM=7.1%) (Extended data Figure 1C). A brief flash of light (200 ms) elicited a sharper depolarization in both cells, with the offset hyperpolarization terminating the depolarization phase of the response (Figure 2A, left). The responses observed in Tm1 and Tm2 were similar to each other, yet were strikingly different from those in Mi1 and Tm3 (Figure 2B and Extended data Figure 1B). Tm1 and Tm2 hyperpolarized at light onset, and depolarized strongly at light offset. The hyperpolarization of Tm1 evoked by stimulus onset was 26.1% (SEM=3.8%) as large as the depolarization evoked at offset; for Tm2, this number was 17.7% (SEM=2.3%) (Extended data Figure 1C). Finally, rapid sequential presentations of light caused repolarization of these cells while their membrane potential was still peaking or decaying from a previous flash (Figure 2B middle). Thus, Mi1 and Tm3, the post-synaptic targets of L1, respond mostly to brightness increments. Conversely, Tm1 and Tm2, the post-synaptic targets of L2, respond most strongly to brightness decrements, consistent with calcium imaging studies of Tm218. All four cells showed asymmetries in their responses to brightness changes, consistent with a role in conferring edge selectivity to each pathway. In addition, we examined whether these medulla neurons could relay long-term information about contrast to downstream circuitry by characterizing responses evoked by 5 s brightness increments or decrements presented on an intermediate grey background (Extended data Figures 2A, B, C and D). All four neurons displayed a sustained response for both brightness increments and decrements, consistent with observations that motion responses can be evoked even when a sequential change in luminance at two points in space occurs with a delay period of up to 10 s in experiments using apparent motion stimuli3,19.
Figure 2. Mi1/Tm3 respond selectively to brightness increments while Tm1/Tm2 respond selectively to brightness decrements.
A. Average evoked responses of Mi1 (N=7) and Tm3 (N=10) in the L1 pathway, in response to 200 ms, four consecutive 500 ms, and 1s full field flashes of light from dark. Thick lines indicate the mean and shaded region indicates ± SEM.
B. Averaged evoked responses (+/− SEM) of Tm1 (N=10) and Tm2 (N=11), in the L2 pathway in response to the same stimuli.
In HRC models, the individual inputs to the cells that perform the nonlinear amplification step are not themselves direction selective. We therefore tested the responses of Mi1, Tm3, Tm1 and Tm2 to motion stimuli, using light and dark bars moving in different directions, under conditions that evoke strong responses from LPTCs20 (Extended data Figure 3). All four neurons responded to moving bars with a sharp depolarization (Extended data Figure 3A and B) but the amplitude of these responses was independent of the direction of motion (Extended data Figure 3C). Thus, Mi1, Tm3, Tm1 and Tm2 are not direction selective under these conditions, consistent with these cells acting upstream of the nonlinear correlation stage of motion detection, as recently reported for Tm218.
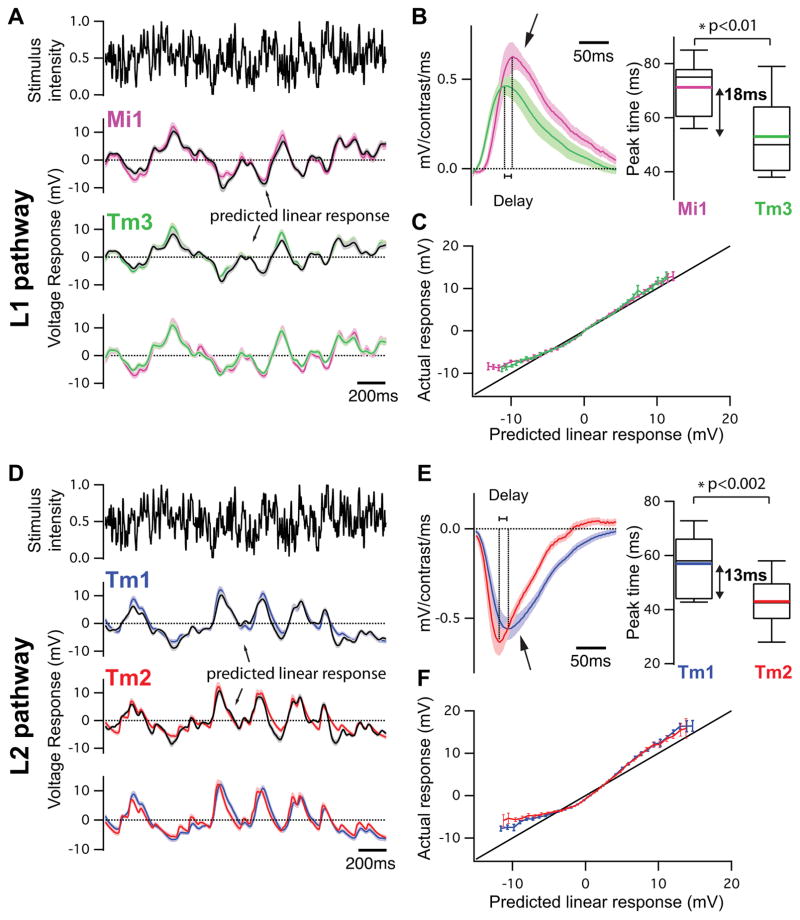
We next examined whether Mi1 and Tm3, or Tm1 and Tm2, have different response latencies that would allow them to differentially delay responses to contrast changes. To quantitatively capture the responses of these neurons to dynamic stimuli spanning a wide range of contrast values and time-scales, we used an approximately Gaussian-distributed random flicker stimulus with a 50% contrast (standard deviation) and an exponential correlation time of 10 ms (see Methods). We used standard procedures to extract the linear filter that best described the temporal properties of the response21,22 (see Methods). The responses of Mi1 and Tm3 to the noise stimuli were very similar (r=0.91 between mean response traces), with temporal filters that comprised a large positive lobe reflecting a sign-conserving relationship between the input contrast and the neural response (Figure 3A, B left, arrow, Extended data Figure 4A, 5A and B). Mean Tm1 and Tm2 responses to these noise stimuli were also similar to one another (r=0.90), with temporal filters that included a large negative lobe, reflecting a sign-inversion between the contrast input and the neural response (Figure 3D, E left, arrow; Extended data Figure 4B, 5E and G). For Mi1 the average peak response time was 71 ms after a contrast change (SEM=3.8 ms) while it was 53 ms (SEM=5.2 ms) for Tm3. Thus, a difference of 18 ms existed between the peak times of the filters for Mi1 and Tm3 (Figure 3B right; p<0.01). Similarly, the average peak time was 56 ms (SEM=3.8 ms) for Tm1 and 43 ms (SEM=2.7 ms) for Tm2. The difference in latency between the two cells was 13 ms (Figure 3E right, p<0.002). Thus, in both cases, there was a small but significant temporal offset, with Mi1 exhibiting a delayed response as compared to Tm3, and Tm1 being delayed relative to Tm2. Notably, these peak delay differences are not much smaller than delays inferred from some LPTC recordings and behavioral experiments3,23,24.
Figure 3. Mi1/Tm3 and Tm1/Tm2 respond with different delays and nonlinearities to a Gaussian noise stimulus.
A. Top: 2s excerpt of the intensity signal from a 10 s full-field Gaussian noise stimulus. Signal correlation time was 10 ms (see Methods). Middle: Average voltage response (+/− SEM) of Mi1 (N=7) and Tm3 (N=11) to the 2s noise stimulus on top. The black trace corresponds to the average predicted linear response (+/− SEM) obtained by convolving the stimulus with the filters in B. Bottom: Overlay of the Mi1 and Tm3 responses showing the high similarity in their response.
B. Left: Average linear filters extracted from the data in panel A that best predict the measured response of Mi1 and Tm3 as a function of preceding light intensity changes (+/− SEM). The filters are comprised of a large positive lobe (arrow) and shallow negative lobe (see Extended data Figure 5). Right: Box plots of the distribution of the timing of the peak responses of the Mi1 and Tm3 neurons. There is, on average, an 18ms delay between the peak of Mi1 filters and Tm3 filters. Black line is the median, colored line is the average.
C. Average actual responses of Mi1 and Tm3 plotted against their average linear predicted responses. Error bars represent +/− SEM. A line of slope 1 is shown in black.
D–F. Same as above for Tm1 (N=15) and Tm2 (N=14). The filters are comprised of a large negative lobe (arrow) and a shallow positive lobe (Extended data Figure 5). The average delay between the peak of Tm1 and Tm2 filters is 13ms.
We next asked whether neuronal responses to this stochastic stimulus were linear or whether different gains were applied to brightness increments and decrements. The noise stimulus was convolved with the corresponding filters for each neuron type to obtain the predicted linear response of each neuron. We then compared the linear predictions to the actual response to define the instantaneous nonlinearity for each neuron. Consistent with the light step results, the nonlinearities extracted for Mi1 and Tm3 revealed that these cells respond more strongly to brightness increments than to decrements (Figure 3C, Extended data Figure 5B and D). Similarly, both Tm1 and Tm2 neurons were less hyperpolarized in response to brightness increments and more depolarized in response to brightness decrements than predicted by the linear model (Figure 3F, Extended data Figure 5F and H). The noise stimuli evoked smaller response asymmetries than those observed with brightness steps, possibly because these stimuli use smaller changes in intensity than our step stimuli. Such differences in gain for brightness increments and decrements reflect partial half-wave rectification, a central feature of models that selectively respond to one contrast polarity2,3,19,25.
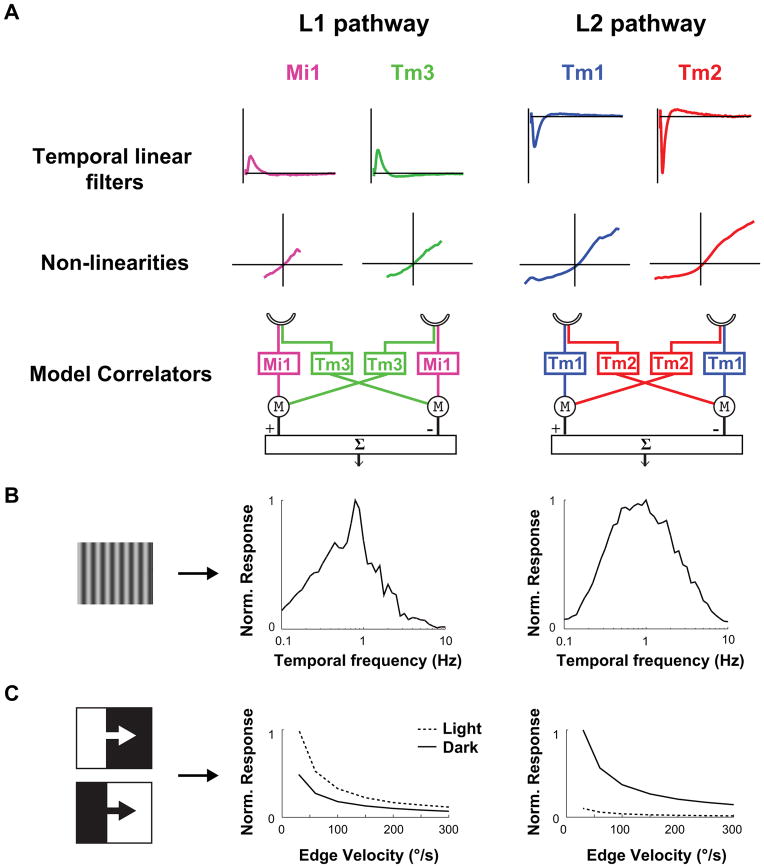
Can the dynamics of the linear filters and the extent of the nonlinearities we measured account for well-characterized properties of motion detecting pathways? One hallmark of the HRC is that it displays a peak response to a defined temporal frequency, creating a temporal frequency optimum (TFO). Because of its structure, the output of an HRC is not proportional to the speed of motion, but rather increases to a maximum value, before decaying at faster speeds. The shape of this tuning curve depends on the temporal properties of its two input channels26. We constructed two separate model correlators, one that used Mi1 and Tm3 filters and nonlinearities as the two channels preceding multiplication and subtraction, and a second one that used Tm1 and Tm2 filters and nonlinearities (Figure 4A, data from Extended data Figure 6). We examined whether these model motion detectors produced temporal frequency tuning curves similar to those previously measured in flies. When we presented these models with moving sine waves of 20% contrast at various contrast frequencies, we observed a peak response at approximately 1 Hz for both the Mi1/Tm3 and the Tm1/Tm2 models (Figure 4B). This computed TFO compares favorably to the optima measured in blowflies and Drosophila14.
Figure 4. Modeling Mi1/Tm3 and Tm1/Tm2 as the delayed and non-delayed channels of light edges and dark edges correlators.
A. Left: The average filters and nonlinearities from the receptive field stochastic data set (200 s noise presentation, 50 ms correlation time, Extended data Figure 6) were used to model Mi1 and Tm3 as the delayed and non-delayed channels of a correlator model in bottom left. Right: same as left with Tm1 and Tm2 as the delayed and non-delayed channels of correlator model.
B. Computed normalized temporal frequency tuning curves obtained numerically for the Mi1/Tm3 model correlator (left) and the Tm1/Tm2 model correlator (right) using sine waves of different temporal frequencies.
C. Computed normalized response of the Mi1/Tm3 model correlator (left) and Tm1/Tm2 model correlator (right) to light or dark edges of 100% contrast, moving at a range of speeds.
Another measured feature of these two motion pathways is their selectivity for edges of particular contrast polarity. We presented our model correlators with light and dark edges of 100% contrast, moving across a grey background. The Tm1/Tm2 model was highly selective for dark edges over a range of speeds. The Mi1/Tm3 model was only mildly selective for light edges, due to the more linear responses measured in Mi1 and Tm3 as compared to Tm1 and Tm2 (Figure 4C). These modeling results are consistent with experimentally measured high selectivity of the dark edge motion pathway2,3, and a more modest selectivity of the light edge motion pathway3.
Taken together, our data are consistent with a model in which Mi1 and Tm3 represent central components of the input channels of a correlator detecting moving light edges, while Tm1 and Tm2 represent analogous components for a correlator that is tuned to detect moving dark edges. The asymmetric responses of these four neurons to brightness increments and decrements corroborates previous studies that argued for separate processing of ON and OFF inputs by distinct channels15,25 to explain the segregation between light and dark edge processing. This situation is similar to separate processing of ON and OFF signals by bipolar cells in the vertebrate retina27.
The relative delays we measured between the peak responses in these cells is roughly 10 times smaller than previously calculated for idealized motion detector models that fit a host of experimental data. In classical HRC models, input to one channel is not filtered, while input to the second channel is low pass filtered with a time constant of τ. In these models, the maximum response occurs at a temporal frequency of 1/2πτ, so that the delay for a 1 Hz optimum is τ ~ 150 ms26. However, since both filters we measured both act as band pass filters, they suppress high frequency inputs, while still producing delay differences between the channels. Thus, when input channels contain both these measured filters, a timing difference of ~15 ms can result in a TFO of 1 Hz (see Methods and Extended data Figure 7). Furthermore, two considerations might lengthen the actual relative delays between pathways. First, we performed somatic recordings that may only approximate the true axonal response of the neurons. Second, the synapses between Mi1/Tm3 and T4, and those between Tm1/Tm2 and T5 could impose additional delays to either input channel prior to a correlation operation.
Anatomical reconstruction of the Drosophila medulla connected the predicted spatial receptive fields of Mi1 and Tm3 cells to the dendritic arbors of individual T4 cells with known directional preferences16. According to predictions derived from that analysis, if Mi1 signals are delayed relative to those of Tm3, as our recordings indicate, the observed direction selectivity in T4 could be accomplished by combining Mi1 and Tm3 inputs with opposite signs onto T4 (one inhibitory and the other excitatory). Such an arrangement could be similar to the motion detection model proposed to explain direction selective responses in the vertebrate retina16,28.
Given the cellular and synaptic complexity of medulla circuitry, as well as the wealth of distinct behaviors that are guided by visual motion, additional cell types are likely to play computational roles in Drosophila elementary motion detectors. Nonetheless, our data shows that Mi1, Tm3, Tm1 and Tm2 possess response properties that are consistent with implementing the algorithmic steps that precede the correlation operations in the motion detecting pathways in Drosophila.
METHODS
Flies
Flies were reared on standard molasses-based medium at 25C. Flies used for electrophysiology were of the following genotype w+; UAS-cytosolicGFP/UAS-cytosolicGFP; 686-Gal4/+ or TM2 (Figure S1A, also labels Tm2 in the medulla) or w+; UAS-cytosolicGFP/UAS-cytosolicGFP; Bsh-Gal4/+ or TM2 for Mi131 (also labels L4 and L5 in the lamina), w+; UAS-cytosolicGFP/UAS-cytosolicGFP; R13E12-Gal4/+ or TM2 from the Janelia Farms Gal4 collection32 for Tm3 (Figure S1B, also labels unidentified medulla tangential cells), w+; UAS-cytosolicGFP/UAS-cytosolicGFP; 27b-Gal4/+ or TM2 for Tm133 (also labels Pm1 and Pm2 in the medulla), w+; UAS-cytosolicGFP/UAS-cytosolicGFP; otd-Gal4/+ or TM2 for Tm233 (also labels photoreceptors). All experimental animals were briefly anesthetized using carbon dioxide within 1 to 2 days of eclosion, and tested at least 3 hours later at room temperature.
Electrophysiology
Flies were prepared for in vivo whole-cell patch-clamp recording using the following procedure, based on ref 34. The flies were immobilized in a perforated piece of foil. A window was cut in the caudal backside of the head at the edge of the retina to expose the cell bodies of medulla cortex neurons. The eyes and the ventral side of the fly were facing down under the foil, which separates the upper part of the preparation covered with saline, from the lower dry part. The saline composition was as follows (in mM): 103 NaCl, 3 KCl, 5 N-tris(hydroxymethyl) methyl-2-aminoethane-sulfonic acid, 8 trehalose, 10 glucose, 26 NaHCO3, 1 NaH2PO4, 1.5 CaCl2, and 4 MgCl2, adjusted to 270 mOsm. The pH of the saline equilibrated near 7.3 when bubbled with 95% O2/5% CO2 and perfused continuously over the preparation at 2 ml/min. Patch-clamp electrodes (resistance 6–12 MΩ) were pressure polished and filled with a solution composed of the following (in mM): 125 potassium aspartate, 10 HEPES, 1 KCl, 4 MgATP, 0.5 Na3GTP, and 1 EGTA, 13 biocytin hydrazide, pH 7.3, adjusted to 265 mOsm. In most cells, it was necessary to inject a small constant hyperpolarizing current immediately after break-in (0–5 pA), in order to bring the membrane potential close to −60 mV, which had no effects on the character of light responses while the potential was in the range of −50mV to −60mV, spanning the likely range of physiological resting potentials.
The membrane potential was measured in current-clamp mode using a Multiclamp 700B amplifier (Axon). Electrophysiology data were collected using Igor Pro (Wavemetrics) running mafPC (courtesy of M. A. Xu-Friedman). The analysis was performed using Igor Pro and Matlab.
Recordings were obtained under visual control using an Olympus (Melville, NY) BX51 with 60X water-immersion objective. The preparation was visualized using transmitted infrared illumination and a long pass filter (850nm). The contrast was adjusted on the camera in order to visualize the shape of the neurons. Neurons of interest were marked using a cytosolic variant of GFP, and the fluorescence excitation was briefly turned on before patching for identification. One neuron was recorded per fly. Recordings were discarded if large changes in input resistance or resting potential were detected.
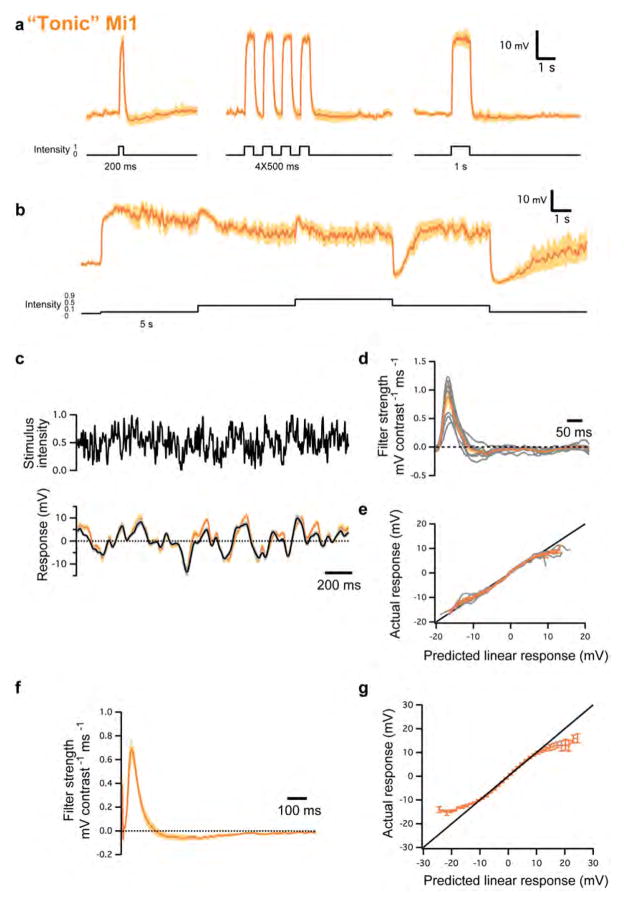
Two distinct classes of Mi1 responses were found (Figure 2A and S2). In one class, detailed in the results, responses to steps were transient (Figure 2). The second class (65% of recorded Mi1 neurons) comprised cells that depolarized in response to brightness increments, but responded tonically (i.e., persistently) during light presentation and returned to pre-step levels only when the light was turned off (Figure S2A and B). These Mi1 neurons depolarized fully in response to very small increases in light and, given their elevated membrane potential, could not respond strongly to further brightness increments (Figure S2B). In some instances, cells switched from the transient class to this tonic class over a few minutes, and remained tonic thereafter. The converse switch from tonic to transient was never observed. A similar phenomenon was also observed in a small fraction of Tm3 neurons (18%). For these reasons we believe that the tonic neuronal measurements are non-physiological, and have excluded those neurons’ responses from all subsequent analyses.
Visual stimulation
Visual stimulation was performed as described previously3,35. Grey scale images were projected onto a screen using a digital light projector (DLP, Infocus DepthQ, Bellevue, WA) coupled with a coherent fiber optic (100 fibers/mm, 0.63NA) (Schott, Elmsford, NY) and a lens. The screen was 55 mm X 55 mm square, placed 40mm away from the fly. Visual stimuli were created using custom-written code in Matlab, using PsychToolBox36. The mean radiance was 1.1 W/Sr/m2, which corresponds to ~250 cd/m2, and the stimulus was updated at 240 Hz, by using color channels as independent intensity channels with the color wheel removed3.
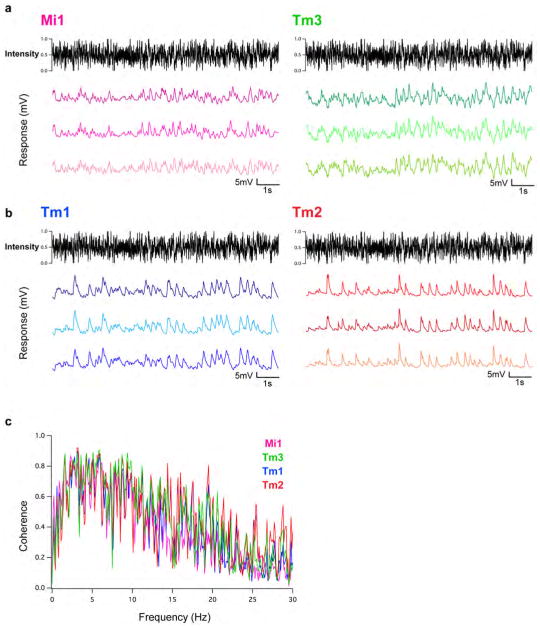
The random flicker stimuli were presented on a background luminance, so that the intensity q(t) = m(1 + s(t)), where m is the mean background luminance and is s(t) constructed to be Gaussian distributed with zero mean and standard deviation σ. The timelag autocovariance of s(t) was constructed to be Css(t) = σ2e−|t|/τ, where τ is the reported correlation time for the input and σ is the reported contrast. The intensity q(t) was bounded below by 0 and above by 2m, so that the distribution was approximately Gaussian and rarely clipped when contrast was 50% or below. Slower correlation times put more power into low frequencies, which were less attenuated by low pass filter properties of the system. Our filter extraction method (see below) accounts for these stimulus correlations when computing the empirical linear filters. Qualitatively, the response of each of the four cell types to this stimulus was robust and highly reproducible, with no systematic differences observed across identical presentations of the same stimulus (Extended data Figure 4A and B).
Filters and nonlinearities
Linear filters were extracted using methods described in Baccus & Meister (2002)22. Before extracting filters, membrane voltage measurements were filtered with a 60 Hz notch filter to exclude noise in that frequency, and with a high-pass filter with cut-off frequency of 0.008 Hz. Briefly, the filter estimate, K̂(ω), for a stimulus, s(t), and response, r(t), was computed in Fourier space to be
where the numerator is the covariance between stimulus and response and the denominator is the autocovariance of the stimulus. These two functions were estimated by computing
where r̃(ω) and s̃(ω) are the Fourier transforms of r(t) and s(t). The averages in each case are performed over 5-second long snippets of stimulus and response traces, taken every 0.1 seconds over the entire trace. The snippets were zero-padded prior to the fast Fourier transform. To prevent the amplification of high frequencies in the filter, the quotient was regularized by adding to Ĉss(ω) a small term ε, equal to 1% of the average value Ĉss(ω) of over all frequencies. Lengthening the snippet duration, eliminating the zero-padding, and using a non-Fourier-transformed estimate of the filter19 all yielded filters with shapes and peak locations almost indistinguishable from this method. The filters shown in the figures are the inverse Fourier transforms of the filters computed for each neuron.
Instantaneous (“static”) nonlinearities were obtained by plotting actual responses against linear predictions. The linear responses were binned and the mean actual response was computed for each bin. This operation was performed across cells, and then averaged by bin to obtain the mean and SEM values of the nonlinearity.
In addition to the filter relating output to input, we also computed the coherence between input and output for all 4 neurons, shown in Extended data Figure 4C. The coherence, γ2, was computed as
where Ĉss(ω) and Ĉrs(ω) were computed as before, and Ĉrr(ω) = 〈r̃(ω)r̃*(ω)〉. Regularization was unnecessary, since coherence is bounded above by 1. Deviations of the coherence from 1 show the influence of nonlinearities in the input-output relationship or the influence of noise in the response.
The temporal filters and nonlinearities obtained with this stimulus were similar to the ones computed with the full field noise stimulus, but the longer stimulus allowed a higher quality estimate at longer times (Figure 5 and Extended data Figure 6).
Statistics
Sample sizes were commensurate with other studies in the field. All statistical tests performed were 2-tailed Student t-tests. Some results were presented using Pearson correlation coefficients (r values). We did not test for normality of distributions.
Modeling
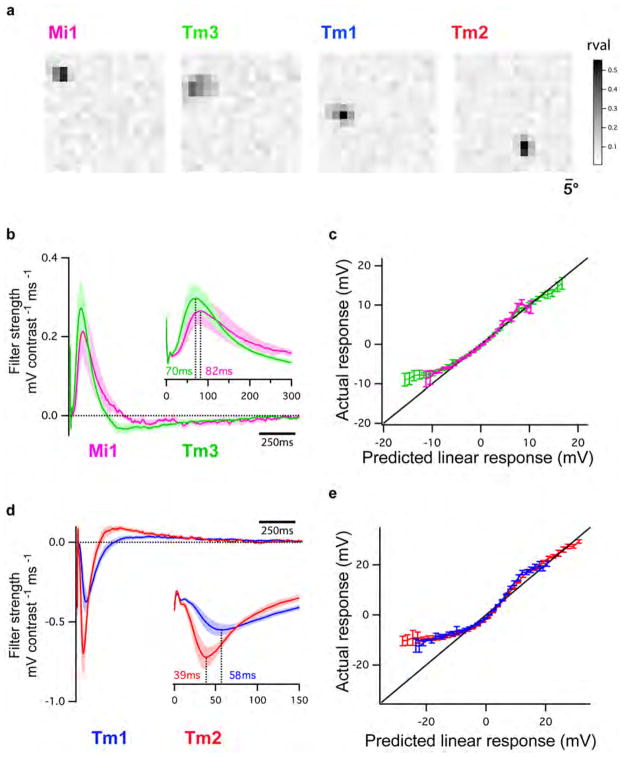
To model the responses of the four interneurons, we gathered a distinct set of data to sample a range of lower frequencies. Indeed, the full field presentations of the noise stimulus in Figure 3 were 10 s long, which did not provide many instances of low-frequency stimuli that could be used to fit a filter. To generate the new stimuli and responses, we displayed a grid of 256 squares to flies (each square was approximately 5° across, depending on position on the screen), with each square displaying a Gaussian noise stimulus with a correlation time of 50 ms. The entire stimulus in this case lasted 200 s, so that low frequency stimuli were sampled better than in the 10s presentations. Examples of receptive fields obtained with this method are presented in Extended data Figure 6A. In these experiments, we chose the strongest pixels, whose filter amplitudes were 3.7 or more standard deviations from the mean (p<0.05, Bonferroni-corrected for the number of squares), and summed them to obtain a filter for each cell. Instantaneous nonlinearities in these experiments were computed by comparing the actual response to the sum of the predicted responses due to these pixels.
Using this data set, we created two models to test hypotheses about the filters and nonlinearities we measured in these four neurons. The first was a detailed model, in which we incorporated as many measurements and known quantities as possible. We used this model to compare predictions from our data to two prominent measurements in the literature. The second model was a toy model, which was entirely linear in its filtering and could include far simpler filters than the empirical ones. We used the toy model to gain insight into how filters combinations with small timing differences could generate peak stimulus responses at relatively low temporal frequencies. All modeling was performed with custom-written code in Matlab (Mathworks, Natick, MA).
Detailed model
Our detailed model used the linear filters and instantaneous nonlinearities shown in Figure 4, extracted from the long stimulus presentation (Extended data Figure 6). Two photoreceptors, a and b, with Gaussian angular acceptance functions and spacing, Δϕ, equal to 5.1°, served as inputs to our motion detector. The spatial filter was
where Z is chosen to normalize the function, θ is azimuthal angle, and q was chosen to match the measured full-width-half-maximum value of 5.7°37. The photoreceptor spatial receptive fields were centered on θa and θb, so that Δϕ = θb − θa. Thus, from a space-time contrast input S(θ, t) (similar to our s(t) above, but also a function of azimuthal angle θ), two signals emerged from the model photoreceptors:
These two signals were each filtered by two empirical temporal filters, f1(t) and f2(t), where the pairing was Tm2-and-Tm1 or Tm3-and-Mi1. After filtering, the signals were transformed by the empirical nonlinearities, N1(.) and N2(.). Thus, the two signals originating at photoreceptor a, after filtering and including the nonlinearity, were
where Fia(t) is the output of the LN model corresponding to filter i on the signal from photoreceptor a. Thus, with two photoreceptors and two filters, there were 4 total signals after filtering and including the static nonlinearities. To obtain the model output, we combined the signals in the antisymmetric fashion of the HRC1:
| (1) |
where the subscripts 1 and 2 refer to filters and subscripts a and b refer to the photoreceptor position. This model was used to compute the mean responses in Figure 4B. The responses in Figure 4C are the integrated responses of this model to high contrast light and dark edges moving over a gray background.
Toy model
In addition to the detailed models in Figure 4 for Mi1/Tm3 and Tm1/Tm2, we constructed a second “toy model”. The aim of the toy model was to gain intuition for how a small difference in filter timescales could produce a relatively low temporal frequency optimum. This model is like the realistic one, except that the two spatial filters were represented by spatially separated delta functions, and no nonlinearities were applied before the multiplication step. In this case, it is possible to compute analytical results26. The classic equation for the steady-state HRC response to a moving sine wave grating of wavelength λ, contrast ΔI, and temporal frequency ω, is:
| (2) |
where f̃1(ω) and f̃2(ω) are the Fourier transforms of the filters for the two input arms to the correlator, Φ1(ω) and Φ2(ω) are the phase shift of each filter, and Δϕ is the angular separation between the two photoreceptor inputs.
This equation gives the predicted response of an HRC to a sine wave of a given temporal frequency, and simplifies easily under certain circumstances. The first two terms give the amplitudes of the input sinewaves after passing through the filters, while the phase term sin(Φ1(ω) − Φ2(ω)) relies on the different phases generated by the two filters, and is a result of the anti-symmetric subtraction in the model. The last term is a geometrical term that relates the overall response amplitude to the wavelength of the sinewave input and the distance between photoreceptor receptive fields.
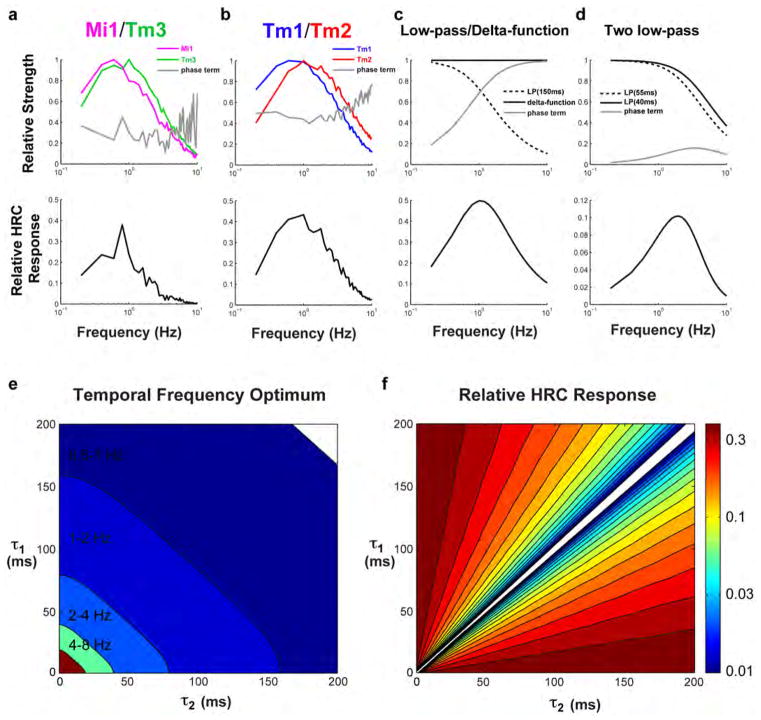
In Extended data Figure 7A, we plot the first three terms in equation (2) (normalizing the two filters by the maximum filter strengths, max (|f̃1(ω)|) and max (|f̃2(ω)|)), and the relative total response. The relative total response is the product of the first 3 terms in equation (2) (with filters normalized as above), effectively setting (ΔI)2 sin(2πΔϕ/λ) = 1. For the two model HRCs we compute both Tm3 + Mi1 and Tm2 + Tm1. The phase terms are 0.1–0.4 for these filter pairings in the region around 1 Hz. Much of the decrease in response at higher frequencies comes from the low-pass nature of the filters, rather than from the phase term. These analytical HRC responses agree closely with our numerical computations in Figure 4 when the input amplitude is small, so that the nonlinearities are not much affecting numerical results.
If f1(t) = δ(t) and , then
which has a maximum value at ω = 1/τ, or a frequency of 1/2πτ cycles per second, which equals 1 Hz when τ~150 ms. This is the origin of the 150 ms time constant often referred to in the literature23. Extended data Figure 7C shows the components of the HRC response for this model, with τ=150 ms. The decrease in response at high frequency comes from the low-pass filter, while the decrease at low frequency comes from the phase term.
If the filters in the toy model are both first-order low-pass, so that and , then the steady-state response can also be worked out:
This simplifies to the previous result as one takes τ1 → 0. The location of maximum response can be found numerically, or analytically with this solution:
In Extended data Figure 7D, we plot the components of the HRC response in the case of two low-pass filters, with time constants of 40 and 55 ms, which roughly match the peak times we found in Tm2 and Tm1. This combination of filters gives a frequency optimum around 2 Hz, even though the difference in time constants is a factor of 10 smaller than the 150 ms found with the first model above. Note that these filters are pure low-pass filters, and look quite different from the biphasic filters we found empirically. The goal of this exercise was to gain intuition about simple filters on the two arms of an HRC.
In Extended data Figure 7E, we plot the contrast frequency optimum (in Hz) for various combinations of τ1 and τ2. There are many combinations of these two filter values that result in contrast frequency optima in 1–3 Hz range. (When τ1 and τ2 invert order, so that τ1 < τ2 becomes τ1 > τ2, the response inverts, so we locate the minimum of this inverted response.) When the two time-constants are very similar, the phase term in the response, along with the total response itself, becomes small (Extended data Figure 7F; again, when the order of τ1 and τ2 changes, we invert the response sign). In our normalized scaling, when the responses are small compared to 1, they may be susceptible to noise, since the signal is the difference between two signals of from the multiplication steps, which can be much larger than their difference. Filter pairings with phase terms (and responses) that are closer to 1 are less susceptible to noise during the subtraction step of the HRC computation. In the empirical cases (Extended data Figure 7A and 7B), the phase terms and relative responses are larger than those in our toy model (Extended data Figure 7D) and closer to the toy model with far more different low-pass filters (Extended data Figure 7C).
Generation of clones
The flies hsFLP, FRT40A,UAS-CD8::GFP,UAS-rCD2-miRNA/CyO,y+ were crossed with hsFLP; FRT40A,UAS-rCD2RFP,UAS-GFP-miRNA/CyO,y+ (gifts from T. Lee), the progeny larvae were heat-shocked at 37°C for 12min, and dissected as adults.
Immunostainings
These were done as described38 with some modifications. Adult brains were dissected in 1× PBS, and fixed in 4% formaldehyde for 45min on ice. Brains were incubated in primary antibody solution overnight at 4°C and in secondary antibody solution at room temperature for 3 hours. We used the following antibodies: sheep anti-GFP (1:500, AbD Serotec), rat anti-DN-cadherin (1:20, DSHB), mouse anti-chaoptin (1/20, DSHB) diluted in 0.3% PBST (Triton X-100 in PBS). Images are acquired using a Leica SP5 confocal. Figures were assembled using Photoshop.
Extended Data
Extended Data Figure 1. Representative raw traces of responses to flashes of light of different duration from dark.
a, Top: response of an Mi1 neuron to 200 ms, four consecutive 250 ms and 1 s full-field flashes of light from dark. Bottom: same as top for a Tm3 neuron. b, Same as a for a Tm1 neuron and a Tm2 neuron. c, Box plots illustrating the distribution of the OFF response as a percentage of the ON response for Mi1 (n =7) and Tm3 (n =10) and the ON response as a percentage of the OFF response for Tm1 (n =10) and Tm2 (n =11) averaged in Fig. 1. Black line, median; coloured line, average.
Extended Data Figure 2. Mi1, Tm3, Tm1 and Tm2 neurons encode stable information about luminance.
a, Top left: averaged evoked responses (± s.e.m.) of Mi1 (n =7) in response to 5 s steps of light from dark to grey (0.5 intensity) to light to grey to dark. Top right: excerpts from the left trace where the pre-contrast change voltages have been matched. Bottom left and right: same as above for Tm3 (n =10). b, Tonic component (average difference in membrane potential between post- and pre-contrast change between 4 and 5 s after contrast change) as a percentage of the maximum peak response for brightness increments of the corresponding contrast difference. Error bars, s.e.m. c, d, Same as a and b for Tm1 (n =9) and Tm2 (n =7). The tonic component was measured as a percentage of the peak response for brightness decrements of the corresponding contrast difference. In all cases, expect for those marked with a cross, the distributions are significantly different from zero (P <0.05).
Extended Data Figure 3. Mi1, Tm3, Tm1 and Tm2 are not direction selective.
a, Top: response of an Mi1 neuron to a white bar moving rightwards, upwards, leftwards and downwards at 100° s−1 on a dark background. Bottom: same as top for a Tm3 neuron. b, Top: response of a Tm1 neuron to a black bar moving rightwards, upwards, leftwards and downwards at 100° s−1 on a light background. Bottom: same as top for a Tm2 neuron. c, Average amplitude of the voltage response as a function of angle (0°, 90°, 180° and 270°) for Mi1 (n =2), Tm3 (n =2), Tm1 (n =2) and Tm2 (n =3) for a bar moving at 100° s−1 (solid lines) and 400° s−1 (dashed lines). The response amplitude was independent of the direction of motion in all cases.
Extended Data Figure 4. The response of Mi1, Tm3, Tm1 and Tm2 to a Gaussian noise stimulus is very reliable.
a, Left: response of an Mi1 neuron to three consecutive 10 s presentations of an approximate Gaussian noise stimulus with 50% standard deviation and correlation time of 10 ms. Right: same as left for Tm3. b, Same as a for Tm1 (left) and Tm2 (right). c, Coherence of the measured responses in the four cell types. Deviations from 1 mean that variance in the output is not entirely accounted for by a linear transformation of the input. This can be caused by noise in the response unrelated to the input, or by the nonlinearities in the system response that we measured. The linear filter amplitude for each frequency is distinct from coherence, and those amplitudes as a function of frequency are plotted in Extended data Fig. 7a, b.
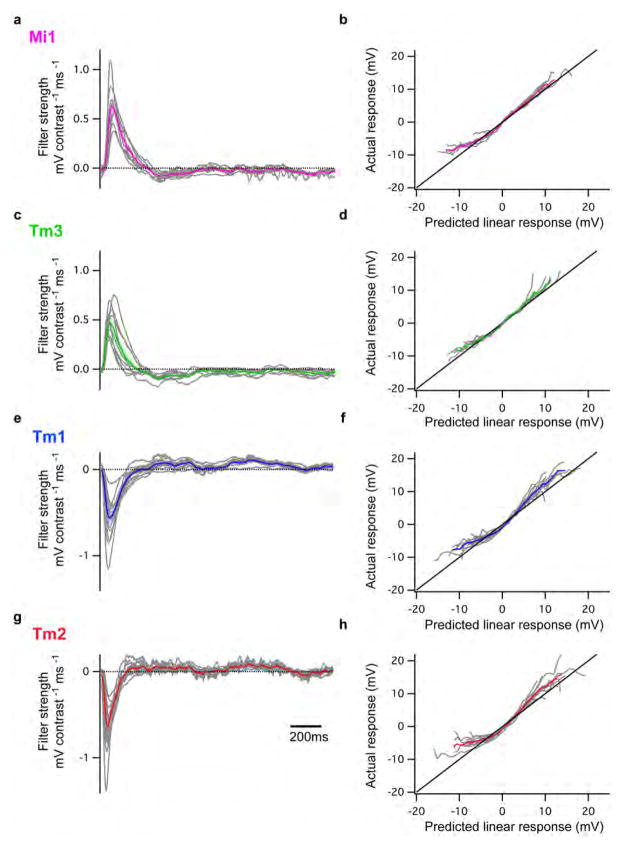
Extended Data Figure 5. Individual filters and nonlinearities from the Gaussian noise analysis of Mi1, Tm3, Tm1 and Tm2.
a, Individual filters (in grey) overlaid on the average filter (± s.e.m.) for Mi1 neurons. b, Individual nonlinearities (in grey) overlaid on the averaged nonlinearity (±s.e.m.) for Mi1 neurons. c, d, Same as a and b for Tm3. e, f, Same as a and b for Tm1. g, h, Same as a and b for Tm2.
Extended Data Figure 6. Spatio-temporal analysis of Mi, Tm3, Tm1 and Tm2.
a, Representative receptive fields of Mi1, Tm3, Tm1 and Tm2 neurons shown as a heat map of 256 pixels using the r value of linear prediction for each pixel intensity. b, Average temporal filters (± s.e.m.) extracted from the highest responding pixels for each neuron for Mi1 (n =4) and Tm3 (n =8) (see Methods). The peaks of the filters, with the average timing, are enlarged in the inset. c, Average nonlinearities over several neurons for both Mi1 and Tm3. To obtain each neuron’s nonlinearity, the neuron’s measured response was plotted against the linear prediction from the relevant pixels. Error bars, s.e.m. A line of slope 1 is shown in black. d, e, Equivalent to b and c for Tm1 (n =8) and Tm2 (n =7).
Extended Data Figure 7. Numerical and analytical HRC responses.
a, b, We plot three terms in equation (2) of the Methods, and the total HRC response, using the empirical measurements for Tm1/Tm2 and Mi1/Tm3 as the twoinput arms for the correlator (f2(t) and f1(t), respectively). The analytical results computed here match the numerical ones shown in Fig. 4. Here and in all subsequent plots, we normalize the filter values so that they have a maximum of 1, and compute the relative HRC response from those normalized filters and the phase term. c, The same three components of equation (2) are plotted in the special case where f1(t) =δ(t) and . We plot the result with τ =150 ms, so that the peak response occurs at ~1 Hz. d, The same components of equation (2) are plotted in the case where both f1(t) and f2(t) are first-order low-pass filters, with time constants of 40 ms and 55 ms, respectively. e, False-colour plot of the temporal frequency optimum for various combinations of τ1 and τ2. Many combinations result in frequency optima near 1 Hz. f, The value of the relative HRC response at the optimal frequency in e is plotted for those same combinations of τ1 and τ2. To compute this, temporal filters have a maximum gain of 1, as in a–d. The responses become small primarily when the phase term becomes small. When the phase term is very small, the subtraction performed by the HRC is susceptible to noise, since it can be subtracting two larger numbers to yield the small difference. Therefore, filter combinations with very small differences seem less biologically plausible than those with larger phase terms. The phase terms for the two model HRCs in a and b are between 0.2 and 0.4 in the 1-Hz region, larger than for the toy model shown in d.
Extended Data Figure 8. 686-Gal4 labels Mi1 neurons and R13E12-Gal4 is specific to Tm3 neurons.
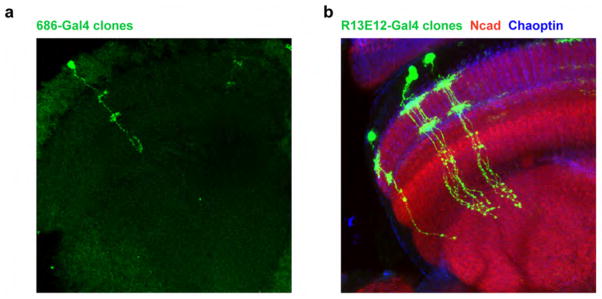
a, Confocal image of a single Mi1 neuron obtained through a flip-out clone procedure with 686-Gal4. Mi1 neurons present processes at the level of M1 and M5 and terminate in the most proximal layers of the medulla. This line also sparsely labels Tm2 neurons, which were distinguishable both visually and functionally. b, Confocal image of twin-spot MARCM clones obtained using R13E12-Gal4. Tm3 neurons present processes at the medulla layers M1 and M5 and project to proximal layers of the medulla and superficial layers of the lobula.
Extended Data Figure 9. Evoked response of ‘tonic’ Mi1 neurons.
a, Average evoked responses (± s.e.m.) of ‘tonic’ Mi1 (n =9) in response to 200 ms, four consecutive 250 ms and 1 s full-field flashes of light from dark. b, Average evoked responses (± s.e.m.) of ‘tonic’ Mi1 (n =7) in response to 5 s steps of light. c, Top: 2 s excerpt of the intensity signal from the 10 s full-field Gaussian noise stimulus. Correlation time is 10 ms. Bottom: average voltage response (± s.e.m.) of ‘tonic’ Mi1 (n =8) in response to the 2 s noise stimulus on top. The black trace corresponds to the average predicted linear response obtained by convolving the stimulus with the filters in d (± s.e.m.). d, Average temporal filters (± s.e.m.) extracted from the data in c that best predict the measured response of ‘tonic’ Mi1 as a function of contrast history. Individual filters are shown in grey. e, Nonlinearities for ‘tonic’ Mi1 cells. Actual responses are plotted against their linear predicted responses. Individual cell nonlinearities in grey; mean and s.e.m. are represented by the coloured line and patch. A line of slope 1 is shown in black. f, Average temporal filters (± s.e.m.) extracted from the highest-responding pixels for each ‘tonic’ Mi1 neuron in the spatio-temporal experiments. g, Averaged actual responses of ‘tonic’ Mi1 plotted against their averaged linear predicted responses in the spatio-temporal experiments. Error bars, s.e.m. A line of slope 1 is shown in black.
Acknowledgments
We thank G. Turner for his initial help on whole-cell recordings; X. Li for providing the confocal image of the 686-Gal4 flip-out clone and N. Vogt, J. Rister and members of the Clandinin lab, as well as H.S. Seung and S.A. Baccus for critical reading of the manuscript. We also wish to thank D.B. Chklovskii for suggesting to record from Tm3 and T. Erclick for identifying the Tm3 Gal4 line. This work was supported by a grant from NIH to C.D. R01 EY017916; R.B. was supported by fellowships from EMBO and HFSP. This work was also supported by grants from the NIH to T.R.C., R01EY022638, and DP1 OD003530. D.A.C. was partially supported by an NIH T32 Vision Training Grant and a Jane Coffin Childs postdoctoral fellowship. A.G.C. was supported by a grant from The McKnight Foundation.
Footnotes
AUTHOR CONTRIBUTIONS
R.B. designed experiments, performed electrophysiological recordings and analyzed the data. D.A.C. designed visual stimuli and experiments, analyzed the data and performed modeling. A.G.C provided electrophysiological training and advice to R.B. T.R.C. and C.D. contributed to the design of experiments. R.B., D.A.C., T.R.C., and C.D. wrote the manuscript.
References
- 1.Hassenstein V, Reichardt W. System theoretical analysis of time, sequence and sign analysis of the motion perception of the snout-beetle Chlorophanus. Z Naturforsch B. 1956;11:513–524. [Google Scholar]
- 2.Joesch M, Schnell B, Raghu SV, Reiff DF, Borst A. ON and OFF pathways in Drosophila motion vision. Nature. 2010;468:300–304. doi: 10.1038/nature09545. [DOI] [PubMed] [Google Scholar]
- 3.Clark DA, Bursztyn L, Horowitz MA, Schnitzer MJ, Clandinin TR. Defining the computational structure of the motion detector in Drosophila. Neuron. 2011;70:1165–1177. doi: 10.1016/j.neuron.2011.05.023. [DOI] [PMC free article] [PubMed] [Google Scholar]
- 4.Borst A, Egelhaaf M. Principles of visual motion detection. Trends in neurosciences. 1989;12:297–306. doi: 10.1016/0166-2236(89)90010-6. [DOI] [PubMed] [Google Scholar]
- 5.Buchner E. Elementary movement detectors in an insect visual system. Biological Cybernetics. 1976;24:85–101. [Google Scholar]
- 6.Meinertzhagen I, O’Neil S. Synaptic organization of columnar elements in the lamina of the wild type in Drosophila melanogaster. Journal of comparative neurology. 1991;305:232–263. doi: 10.1002/cne.903050206. [DOI] [PubMed] [Google Scholar]
- 7.Rister J, et al. Dissection of the peripheral motion channel in the visual system of Drosophila melanogaster. Neuron. 2007;56:155–170. doi: 10.1016/j.neuron.2007.09.014. [DOI] [PubMed] [Google Scholar]
- 8.Katsov AY, Clandinin TR. Motion processing streams in Drosophila are behaviorally specialized. Neuron. 2008;59:322–335. doi: 10.1016/j.neuron.2008.05.022. [DOI] [PMC free article] [PubMed] [Google Scholar]
- 9.Tuthill JC, Nern A, Holtz SL, Rubin GM, Reiser MB. Contributions of the 12 neuron classes in the fly lamina to motion vision. Neuron. 2013;79:128–140. doi: 10.1016/j.neuron.2013.05.024. [DOI] [PMC free article] [PubMed] [Google Scholar]
- 10.Silies M, et al. Modular use of peripheral input channels tunes motion-detecting circuitry. Neuron. 2013;79:111–127. doi: 10.1016/j.neuron.2013.04.029. [DOI] [PMC free article] [PubMed] [Google Scholar]
- 11.Bausenwein B, Dittrich A, Fischbach KF. The optic lobe of Drosophila melanogaster. Cell and tissue research. 1992;267:17–28. doi: 10.1007/BF00318687. [DOI] [PubMed] [Google Scholar]
- 12.Maisak MS, et al. A directional tuning map of Drosophila elementary motion detectors. Nature. 2013;500:212–216. doi: 10.1038/nature12320. [DOI] [PubMed] [Google Scholar]
- 13.Schnell B, Raghu SV, Nern A, Borst A. Columnar cells necessary for motion responses of wide-field visual interneurons in Drosophila. Journal of Comparative Physiology A. 2012;198:389–395. doi: 10.1007/s00359-012-0716-3. [DOI] [PMC free article] [PubMed] [Google Scholar]
- 14.Borst A, Haag J, Reiff DF. Fly motion vision. Annual review of neuroscience. 2010;33:49–70. doi: 10.1146/annurev-neuro-060909-153155. [DOI] [PubMed] [Google Scholar]
- 15.Bausenwein B, Fischbach KF. Activity labeling patterns in the medulla of Drosophila melanogaster caused by motion stimuli. Cell and tissue research. 1992;270:25–35. doi: 10.1007/BF00381876. [DOI] [PubMed] [Google Scholar]
- 16.Takemura S-y, et al. A visual motion detection circuit suggested by Drosophila connectomics. Nature. 2013;500:175–181. doi: 10.1038/nature12450. [DOI] [PMC free article] [PubMed] [Google Scholar]
- 17.Shinomiya K, Karuppudurai T, Lin TY, Lu Z, Lee CH, Meinertzhagen IA. Candidate neural substrates for off-edge motion detection in Drosophila. Curr Biol. 2014;24:1–9. doi: 10.1016/j.cub.2014.03.051. [DOI] [PMC free article] [PubMed] [Google Scholar]
- 18.Meier M, et al. Neural circuit components of the Drosophila OFF motion vision pathway. Current biology : CB. 2014 doi: 10.1016/j.cub.2014.01.006. [DOI] [PubMed] [Google Scholar]
- 19.Eichner H, Joesch M, Schnell B, Reiff DF, Borst A. Internal structure of the fly elementary motion detector. Neuron. 2011;70:1155–1164. doi: 10.1016/j.neuron.2011.03.028. [DOI] [PubMed] [Google Scholar]
- 20.Joesch M, Plett J, Borst A, Reiff DF. Response properties of motion-sensitive visual interneurons in the lobula plate of Drosophila melanogaster. Current Biology. 2008;18:368–374. doi: 10.1016/j.cub.2008.02.022. [DOI] [PubMed] [Google Scholar]
- 21.Chichilnisky EJ. A simple white noise analysis of neuronal light responses. Network (Bristol, England) 2001;12:199–213. [PubMed] [Google Scholar]
- 22.Baccus SA, Meister M. Fast and slow contrast adaptation in retinal circuitry. Neuron. 2002;36:909–919. doi: 10.1016/s0896-6273(02)01050-4. [DOI] [PubMed] [Google Scholar]
- 23.Harris RA, O’Carroll DC, Laughlin SB. Contrast gain reduction in fly motion adaptation. Neuron. 2000;28:595–606. doi: 10.1016/s0896-6273(00)00136-7. [DOI] [PubMed] [Google Scholar]
- 24.Marmarelis PZ, McCann GD. Development and application of white-noise modeling techniques for studies of insect visual nervous system. Kybernetik. 1973;12:74–89. doi: 10.1007/BF00272463. [DOI] [PubMed] [Google Scholar]
- 25.Franceschini N, Riehle A, Le Nestour A. Facets of vision. Springer; 1989. Directionally selective motion detection by insect neurons; pp. 360–390. [Google Scholar]
- 26.Borst A, Bahde S. What kind of movement detector is triggering the landing response of the housefly? Biological cybernetics. 1986;55:59–69. [Google Scholar]
- 27.Wässle H. Parallel processing in the mammalian retina. Nature Reviews Neuroscience. 2004;5:747–757. doi: 10.1038/nrn1497. [DOI] [PubMed] [Google Scholar]
- 28.Barlow H, Levick WR. The mechanism of directionally selective units in rabbit’s retina. The Journal of physiology. 1965;178:477. doi: 10.1113/jphysiol.1965.sp007638. [DOI] [PMC free article] [PubMed] [Google Scholar]
- 29.Wilson RI, Turner GC, Laurent G. Transformation of olfactory representations in the Drosophila antennal lobe. Science (New York, NY) 2004;303:366–370. doi: 10.1126/science.1090782. [DOI] [PubMed] [Google Scholar]
- 30.Fischbach KF, Dittrich A. The optic lobe of Drosophila melanogaster. I. A Golgi analysis of wild-type structure. Cell and tissue research. 1989;258:441–475. [Google Scholar]
- 31.Hasegawa E, et al. Concentric zones, cell migration and neuronal circuits in the Drosophila visual center. Development. 2011;138:983–993. doi: 10.1242/dev.058370. [DOI] [PubMed] [Google Scholar]
- 32.Jenett A, et al. A GAL4-Driver Line Resource for Drosophila Neurobiology. Cell reports. 2012;2:991–1001. doi: 10.1016/j.celrep.2012.09.011. [DOI] [PMC free article] [PubMed] [Google Scholar]
- 33.Morante J, Desplan C. The color-vision circuit in the medulla of Drosophila. Current Biology. 2008;18:553–565. doi: 10.1016/j.cub.2008.02.075. [DOI] [PMC free article] [PubMed] [Google Scholar]
- 34.Wilson RI, Laurent G. Role of GABAergic inhibition in shaping odor-evoked spatiotemporal patterns in the Drosophila antennal lobe. The Journal of neuroscience : the official journal of the Society for Neuroscience. 2005;25:9069–9079. doi: 10.1523/jneurosci.2070-05.2005. [DOI] [PMC free article] [PubMed] [Google Scholar]
- 35.Freifeld L, Clark DA, Schnitzer MJ, Horowitz MA, Clandinin TR. GABAergic lateral interactions tune the early stages of visual processing in Drosophila. Neuron. 2013;78:1075–1089. doi: 10.1016/j.neuron.2013.04.024. [DOI] [PMC free article] [PubMed] [Google Scholar]
- 36.Brainard DH. The psychophysics toolbox. Spatial vision. 1997;10:433–436. [PubMed] [Google Scholar]
- 37.Stavenga D. Angular and spectral sensitivity of fly photoreceptors. II. Dependence on facet lens F-number and rhabdomere type in Drosophila. Journal of Comparative Physiology A. 2003;189:189–202. doi: 10.1007/s00359-003-0390-6. [DOI] [PubMed] [Google Scholar]
- 38.Morante J, Desplan C. Dissection and staining of Drosophila optic lobes at different stages of development. Cold Spring Harbor Protocols. 2011 doi: 10.1101/pdb.prot5629. pdb. prot5629. [DOI] [PMC free article] [PubMed] [Google Scholar]


