

Long-term exposure to PPARγ agonists such as rosiglitazone induces browning of rodent and human adipocytes. Loft et al. discovered that browning triggers reprogramming of PPARγ binding, leading to the formation of PPARγ “superenhancers” that are selective for brown-in-white (brite) adipocytes. They identified KLF11 as a novel browning transcription factor in human adipocytes that is directly induced by PPARγ and appears to cooperate with PPARγ in a feed-forward manner to activate and maintain the brite-selective gene program.
Keywords: browning of human adipocytes, KLF11, PPARγ, superenhancer, genomic reprogramming, rosiglitazone
Abstract
Long-term exposure to peroxisome proliferator-activated receptor γ (PPARγ) agonists such as rosiglitazone induces browning of rodent and human adipocytes; however, the transcriptional mechanisms governing this phenotypic switch in adipocytes are largely unknown. Here we show that rosiglitazone-induced browning of human adipocytes activates a comprehensive gene program that leads to increased mitochondrial oxidative capacity. Once induced, this gene program and oxidative capacity are maintained independently of rosiglitazone, suggesting that additional browning factors are activated. Browning triggers reprogramming of PPARγ binding, leading to the formation of PPARγ “superenhancers” that are selective for brown-in-white (brite) adipocytes. These are highly associated with key brite-selective genes. Based on such an association, we identified an evolutionarily conserved metabolic regulator, Kruppel-like factor 11 (KLF11), as a novel browning transcription factor in human adipocytes that is required for rosiglitazone-induced browning, including the increase in mitochondrial oxidative capacity. KLF11 is directly induced by PPARγ and appears to cooperate with PPARγ in a feed-forward manner to activate and maintain the brite-selective gene program.
Obesity has reached pandemic proportions and poses a tremendous threat to human health. Current strategies for therapy aim at restoring the obesity-causing energy imbalance in humans by either decreasing energy uptake or increasing energy expenditure. In this regard, promising targets for treatment of human obesity are brown and “beige/brite (brown in white)” adipose tissues (Harms and Seale 2013), which have been shown to be metabolically significant tissues in both rodents and adult humans (Kopecky et al. 1995; Guerra et al. 1998; Feldmann et al. 2009; Seale et al. 2011; Ouellet et al. 2012; Yoneshiro et al. 2013). The expression of uncoupling protein 1 (UCP1) in residing adipocytes allows uncoupling of mitochondria and thereby conversion of fatty acids and glucose into heat. Traditionally, UCP1-positive adipocytes in rodents have been distinguished into classical brown adipocytes from brown adipose tissue (BAT) and brite (Petrovic et al. 2010)/beige (Ishibashi and Seale 2010) (hereafter termed brite) adipocytes from white adipose tissue (WAT) (Harms and Seale 2013). Recently, several studies demonstrated that human adults have separate depots of brown(-like) adipocytes interspersed among white adipocytes in the supraclavicular, para-aortic, and suprarenal fat depots (Cypess et al. 2009; van Marken Lichtenbelt et al. 2009; Virtanen et al. 2009). It is currently unclear whether these human brown(-like) adipocytes more resemble the inducible brite adipocytes found in the WAT of mice rather than the classical brown adipocytes from BAT (Sharp et al. 2012; Wu et al. 2012; Cypess et al. 2013; Lidell et al. 2013). Nevertheless, there is a growing clinical interest in understanding how brite adipocytes develop, especially since the emergence of brite adipocytes in WAT is associated with protection against obesity and metabolic dysfunctions in several rodent models (Seale et al. 2011; Cohen et al. 2014).
The appearance of brite adipocytes can be induced by several different thermogenic stimuli, including cold and β-adrenergic stimulation (Cousin et al. 1992; Himms-Hagen et al. 1994). In addition, long-term exposure to synthetic ligands of peroxisome proliferator-activated receptor γ (PPARγ), a key activator of both white and brown adipocyte differentiation (Lefterova et al. 2014), has been shown to promote the formation of functional brite adipocytes in cultures of rodent white adipocytes and in WAT (Fukui et al. 2000; Wilson-Fritch et al. 2004; Petrovic et al. 2010). Interestingly, studies using human preadipocytes, including human multipotent adipose-derived stem (hMADS) cells, indicate that the ability of PPARγ agonists to induce functional brite cells is conserved in humans (Digby et al. 1998; Elabd et al. 2009). Mechanistically, it has been suggested that PPARγ ligands induce brown/brite-selective genes by directly activating PPARγ at nearby regulatory regions (Sears et al. 1996). However, browning is not immediately induced (Petrovic et al. 2010; Haakonsson et al. 2013), indicating that activation and stabilization of the brite adipocyte gene program by rosiglitazone requires activation of additional indirect effectors that may help reprogram the chromatin template. Candidates for such rosiglitazone-induced effectors have been identified in rodents and include the cofactors PGC-1α (Hondares et al. 2006) and PRDM16 (Ohno et al. 2012). At present, however, these rosiglitazone-induced effectors remain elusive. Furthermore, little is known about the molecular mechanisms underlying browning of human adipocytes, and genome-wide insight into the transcriptional reprogramming of the genome and the transcriptional networks involved is completely lacking.
In this study, we characterized for the first time the transcriptional processes underlying browning of human adipocytes using a genome-wide approach. We show that this is associated with reprogramming of PPARγ binding to form brite-selective PPARγ superenhancers that appear to play a key role in activation of brite-selective genes. We identify the Kruppel-like factor 11 (KLF11) gene based on its association with a brite-selective PPARγ superenhancer and show that KLF11 is a novel browning factor directly induced by rosiglitazone and required for the activation of brite-selective genes by rosiglitazone.
Results
Browning of human adipocytes stimulates a comprehensive stable gene program linked to mitochondrial oxidative capacity
To explore the transcriptional mechanisms underlying the browning process of human adipocytes, we exposed mature white hMADS adipocytes to the PPARγ ligand, rosiglitazone, for 3 d (i.e., days 13–16 of differentiation) (Fig. 1A). As previously shown, rosiglitazone induces the expression of well-established brown/brite adipocyte markers (Elabd et al. 2009; Pisani et al. 2011) such as UCP1, CIDEA, ELOVL3, and DIO2, whereas expression of the common adipocyte markers PLIN1/2, SCD, and FASN as well as the degree of fat synthesis and lipid accumulation are comparable in white and brite adipocytes (Fig. 1B–D; Supplemental Fig. S1A–C). Interestingly, once induced, the expression of brite-selective marker genes is maintained from day 16 to day 19 and further until day 23 independently of continued rosiglitazone administration (Fig. 1C,D), indicating that a stable brite adipocyte gene program has been switched on. Establishment of a full brite phenotype requires long-term exposure to rosiglitazone, since a short 2-h pulse of rosiglitazone in mature hMADS adipocytes at day 13 is insufficient for full activation of UCP1 transcription (Supplemental Fig. S1D), suggesting that the induction of additional factors are needed to effectively activate a brite gene program in hMADS adipocytes.
Figure 1.

Browning of hMADS adipocytes induces a stable gene program linked to enhanced mitochondrial oxidative capacity. (A) Schematic overview of hMADS differentiation. hMADS cells were induced to differentiate using an adipogenic cocktail. Mature white adipocytes were treated with DMSO to remain white adipocytes or with rosiglitazone (+rosi) to become brite adipocytes. Rosiglitazone was omitted from the differentiation medium from day 16. (B) White and brite hMADS adipocyte cultures were fixed with formaldehyde and stained with oil-red-O. Representatives of phase-contrast micrographs are displayed. (C,D) Expression of UCP1 (C) and brown/brite adipocyte markers (D) in white (W, light blue) and brite (B, orange) hMADS adipocytes at the indicated days. Error bars represent SD (n = 3). (***) P < 0.001; (**) P < 0.005; (*) P < 0.05; (NS) not significant (P > 0.05), as indicated. (E) Heat map showing log2 fold change for white-selective (1138 genes) and brite-selective (1691 genes) (FDR < 0.05) genes as well as a group of constitutively expressed genes (977 genes with FDR > 0.9 and log2 fold change < 2.5%) from three independent biological replicates in white and brite hMADS adipocytes at day 19. (F) Mean expression values (as normalized exon reads per kilobase) from three RNA-seq data replicates for a subset of previously reported brite- and white-selective genes as well as general adipocyte markers. (G) Oxygen consumption rate (OCR) measured in white (W, light blue) and brite (B, orange) hMADS adipocytes at days 16 and 19. (Left) The arrows indicate time of addition for oligomycin, FCCP, and rotenone/antimycin A. (Right) Uncoupled, maximal, and basal respiration in white and brite hMADS adipocytes. Error bars represent SEM (n = 3). (*) P < 0.05 as indicated.
To examine the global transcriptional changes associated with browning of white adipocytes, we performed RNA sequencing (RNA-seq) in hMADS preadipocytes as well as in mature white and brite hMADS adipocytes deprived of rosiglitazone. Principal component analysis based on gene expression profiles showed that preadipocytes and white and brite hMADS adipocytes separate into three clusters corresponding to distinct cell types (Supplemental Fig. S2A). Comparison of white and brite adipocytes identified a total of 2829 differentially expressed genes (false discovery rate [FDR] < 0.05), of which 1691 are brite-selective and 1138 are white-selective (Fig. 1E; Supplemental Fig. S2B). Notably, several known white and brown/brite marker genes are differentially expressed between white and brite hMADS adipocytes (Fig. 1F). The gene programs that are selective for brite adipocytes are associated with increased mitochondrial function and energy consumption (Supplemental Table S1; Supplemental Fig. S2C). Importantly, this leads to a significant increase in basal, maximal, and uncoupled respiration in brite compared with white adipocytes, which is maintained in rosiglitazone-deprived brite adipocytes at day 19 (Fig. 1G). In contrast, genes selectively expressed in white hMADS adipocytes belong to pathways associated with amino acid metabolism (Supplemental Table S1). Taken together, these results demonstrate that distinct “stable” gene programs are active in white and brite hMADS adipocytes and that the brite-selective gene program is associated with functional properties of the brite adipocytes.
Cell type-selective PPARγ binding correlates with active chromatin signatures and cell type-selective gene expression
To determine the degree of reprogramming of the chromatin template and identify putative active chromatin regions (Crawford et al. 2006), we generated genome-wide DNase I-hypersensitive (DHS) site profiles in white and brite hMADS adipocytes. Notably, despite considerable changes in gene expression during browning, the DHS profiles overall were very similar in white and brite adipocytes (Supplemental Fig. S3A,B), indicating that the transcriptional changes during browning occur without major changes in the chromatin landscape.
We and others have recently shown the existence of robust fat depot-selective binding of PPARγ linked to depot-specific gene expression in mice (Siersbæk et al. 2012; Rajakumari et al. 2013), indicating that PPARγ, in addition to its role as a general activator of adipogenesis in mice (Lefterova et al. 2008; Nielsen et al. 2008) and humans (Mikkelsen et al. 2010; Schmidt et al. 2011; Soccio et al. 2011), plays a prominent role in the induction of genes characteristic of different adipocyte lineages. The fact that browning is induced by the PPARγ ligand rosiglitazone indicates that PPARγ is also a major driver of the genomic reprogramming during browning. To investigate this, we generated PPARγ chromatin immunoprecipitation (ChIP) sequencing (ChIP-seq) profiles in white and brite hMADS adipocytes. From a total of 52,030 PPARγ-binding sites, we identified 4439 reprogrammed PPARγ-binding sites with differential PPARγ-binding intensity (FDR < 0.1) in white and brite adipocytes (2228 white-selective and 2211 brite-selective) (Fig. 2A). Furthermore, we defined a group of 2385 constant sites that show comparable PPARγ-binding signal in these two cell populations. Notably, levels of PPARγ protein are comparable in brite and white adipocytes (Supplemental Fig. S4A). The fact that <10% of the total number of PPARγ-binding sites is reprogrammed indicates that most of the transcriptional functions of PPARγ are maintained in the brite adipocytes. Nevertheless, reprogrammed PPARγ-binding sites are high-intensity sites compared with the group of constant sites and thus are likely to represent key regulatory elements (Supplemental Fig. S4B). De novo motif analysis did not show major differences in motif enrichment between the different groups of sites. The PPAR response element is the top-scoring motif in all three groups, whereas the NF1 half-site is enriched in white-selective and constant PPARγ-binding sites, and the C/EBP motif is enriched in brite-selective and constant PPARγ-binding sites (Supplemental Fig. S4C). To investigate the activity of these reprogrammed PPARγ-binding sites, we evaluated the DHS sequencing (DHS-seq) profiles as well as ChIP-seq profiles of the subunit 1 of the Mediator complex (MED1), the coactivator CREB-binding protein (CBP), and the histone mark H3K27ac, all of which are known to be marks of active regulatory regions (Crawford et al. 2006; Heintzman et al. 2009; Creyghton et al. 2010; Kagey et al. 2010; Rada-Iglesias et al. 2011). Interestingly, brite-selective PPARγ-binding sites are found in regions that appear to be most active in brite adipocytes (Fig. 2B; Supplemental Fig. S4D). Similarly, white-selective PPARγ-binding sites are found in regions with elevated activity in white adipocytes, whereas constant PPARγ-binding sites display no major differences in activating chromatin marks between white and brite adipocytes. These results demonstrate that although no major overall changes occur in the chromatin template during browning, the reprogrammed PPARγ-binding sites are associated with local remodeling of the chromatin and signatures of increased transcriptional activity. The role of PPARγ as a major determinant of enhancer activity is supported by the fact that PPARγ binding positively correlates with activating enhancer signatures at all identified PPARγ-binding sites (Supplemental Fig. S5A). Interestingly, the cell type-selective PPARγ-binding events are highly enriched near cell type-selective genes (Fig. 2C), including brite-selective genes such as UCP1 and ACSL5 (Fig. 2D,E; Supplemental Fig. S5B). Thus, these genome-wide analyses extend previous results based on single genes and indicate that PPARγ is a critical direct activator of the brite-selective gene program.
Figure 2.

PPARγ binding is reprogrammed during browning of hMADS adipocytes. (A) Scatter plot showing PPARγ signal (as edgeR-normalized tag count in a 400-base-pair [bp] window) in PPARγ-binding sites in white and brite hMADS adipocytes at day 19. Reprogrammed (FDR < 0.1) white-selective (blue, 2228 peaks) and brite-selective (red, 2211 peaks) PPARγ-binding sites are shown. A group of constant PPARγ-binding sites (green, 2385 peaks) was defined as those having a FDR > 0.95 and a fold change < 2.5%. The remaining PPARγ-binding sites are black. (B) Heat map showing the log2 fold change in PPARγ, DHS, CBP, MED1, and H3K27ac signal at reprogrammed PPARγ-binding sites in brite compared with white hMADS adipocytes. PPARγ, DHS, CBP, and MED1 signals were counted in a 400-bp window, and H3K27ac signal was counted in a 2-kb window around the PPARγ peak center. (C) Enrichment of the brite-selective (red), white-selective (blue), and constant (green) PPARγ-binding sites in the vicinity of top brite-selective (603 genes) or white-selective (292 genes) genes. Enrichment was determined as the number of binding sites per gene within different distances from the transcription start site (TSS; 10–100 kb) of top regulated genes relative to the number of binding sites per gene of constitutively expressed genes, as defined in Figure 1E. (D) ChIP-seq profiles of PPARγ, MED1, H3K27ac, and input control at the ACSL5 and UCP1 loci in white and brite hMADS adipocytes. The arrows indicate brite-selective PPARγ-binding sites. (E) Bar plot showing the mean tag count in brite-selective PPARγ-binding sites (indicated with arrows in D) for duplicate MED1 (400-bp window) and H3K27ac (2-kb window) ChIP-seq libraries in white (light blue) and brite (orange) hMADS adipocytes. The input signal in white (white) and brite (black) hMADS adipocytes in the given window is plotted as a control. Error bars represent SEM (n = 2).
Brite-selective PPARγ superenhancers are highly enriched near brite-selective genes
It has recently been shown that superenhancers (i.e., clusters of enhancers) constitute particularly powerful regulatory nodes controlling expression of genes defining cell identity (Loven et al. 2013; Whyte et al. 2013). To identify such key regulatory regions in hMADS adipocytes and determine whether they change during browning, we merged all identified PPARγ-binding sites in close proximity (within 12.5 kb from each other) and ranked them according to the intensity of their associated MED1 signal. Using this approach, we identified 1106 PPARγ superenhancers in brite adipocytes that have elevated levels of MED1 signal compared with regular PPARγ-binding regions in two independent biological replicates (Fig. 3A). Compared with regular PPARγ enhancers, the constituent PPARγ-binding regions within PPARγ superenhancers are enriched in MED1, H3K27ac, DHS, and CBP signal (Fig. 3B; Supplemental Fig. S6A), indicating that the constituent PPARγ enhancers in superenhancers are significantly more active than regular PPARγ enhancers. Furthermore, the PPARγ signal intensity is higher in the PPARγ superenhancer constituents compared with regular PPARγ-binding regions, indicating that PPARγ plays an active role in the formation of superenhancers.
Figure 3.

Brite-selective PPARγ superenhancers are highly enriched near brite-selective genes. (A) All identified PPARγ-binding sites (52,030) within 12.5 kb of each other were merged, resulting in 31,466 regions. These PPARγ regions in brite hMADS adipocytes were ranked according to input-subtracted signal of MED1. Regions with >200 reads (minus input signal) per 10 million total reads in both MED1 replicates were defined as superenhancers (green). All other regions were denoted as regular PPARγ-binding regions (gray). (B) MED1 and PPARγ (400-bp window) as well as H3K27ac (2-kb window) signal (as tag count per peak) in PPARγ constituents in regular PPARγ-binding regions (gray, 46,392 peaks) and PPARγ superenhancers (green, 5638 peaks) in brite hMADS adipocytes. (*) P < 2.2 10−16 as indicated, Wilcoxon rank-sum test. (C) MA plot showing mean MED1 signal (as edgeR-normalized tag count) versus the log2 fold change in MED1 signal for a given PPARγ superenhancer (SE) in brite compared with white hMADS adipocytes. PPARγ superenhancers with significantly (FDR < 0.01) elevated MED1 tag counts in white (blue, 304 regions) and brite (red, 324 regions) hMADS adipocytes are shown. A group of constant PPARγ superenhancers (green, 148 regions) was defined as regions having an FDR > 0.6, and the rest of the common PPARγ superenhancers are shown in black. (D) Fraction of white-selective (gray) and brite-selective (black) PPARγ-binding sites in white-selective (blue), brite-selective (red), and constant (green) PPARγ superenhancers (SE). Significance was determined by Fisher’s exact test as indicated. (E) Enrichment of brite-selective (red), white-selective (blue), and constant (green) PPARγ superenhancers (solid line) or regular binding regions (dotted line) near the top brite-selective and white-selective genes. Enrichment was determined as the number of binding sites per gene within different distances from the TSS (10–100 kb) of the top regulated genes relative to the number of binding sites per gene of constitutively expressed genes, as defined in Figure 1E. (F) Log2 fold change in the expression of brite compared with white hMADS adipocytes (left) and normalized exon reads per kilobase in brite hMADS adipocytes (right) for brite-selective genes associated (red) or not (gray) with brite-selective superenhancers. (G,H) ChIP-seq profiles of MED1, H3K27ac, PPARγ, and input control at the ACSL5 and PDK4 (G) and PLIN1 (H) loci in white (light blue) and brite (orange) hMADS adipocytes. The red and green lines indicate the positions of brite-selective and common PPARγ superenhancers, respectively.
To identify key cell type-selective regulatory regions, we examined PPARγ superenhancers with differential MED1 signal in white and brite adipocytes. From a total of 1212 superenhancers identified in white and/or brite adipocytes, we identified 304 white-selective and 324 brite-selective (FDR < 0.01) as well as 148 constant PPARγ superenhancers (Fig. 3C). Interestingly, brite- and white-selective PPARγ-binding sites are highly enriched in brite- and white-selective superenhancers, respectively (Fig. 3D). Furthermore, PPARγ-binding intensity is significantly higher at brite-selective sites than nonreprogrammed PPARγ sites within brite-selective superenhancers (Supplemental Fig. S6B). This indicates that superenhancers with cell type-selective activity arise as a consequence of PPARγ reprogramming during the browning process. This is further supported by the fact that within these superenhancers, the increase in MED1 and H3K27ac signal in brite compared with white adipocytes is more pronounced at enhancer constituents where there is brite-selective binding of PPARγ compared with enhancer constituents where PPARγ binding is independent of cell type (Supplemental Fig. S6C).
Annotation of PPARγ superenhancers to the nearest genes showed that cell type-selective PPARγ superenhancers are highly enriched in the vicinity of cell type-selective genes and that the enrichment is much higher than for regular cell type-selective PPARγ enhancers (Fig. 3E). Notably, brite-selective genes associated with brite-selective superenhancers are induced significantly more during browning and are expressed at much higher levels compared with brite-selective genes that do not have a super-enhancer associated with them (Fig. 3F). Furthermore, brite-selective genes associated with brite-selective superenhancers belong to brite-selective metabolic pathways, such as fatty acid degradation and β-oxidation (Supplemental Fig. S7A). Several of these metabolic genes are also marked by brite-selective PPARγ superenhancers defined by H3K27ac signal (Supplemental Fig. S7B). Examples of prominent brite-selective genes associated with brite-selective superenhancers are PDK4, ACSL5, CIDEA, and DIO2, whereas common PPARγ superenhancers are found near general adipocyte genes such as PLIN1/2 and SCD1 (Fig. 3G,H; Supplemental Fig. S7C–G). Taken together, these data indicate that brite-selective PPARγ superenhancers are crucial regulatory regions for controlling key brite-selective genes.
Rosiglitazone treatment induces the superenhancer-associated gene KLF11 in human adipocytes and subcutaneous fat of human type 2 diabetic (T2D) patients
Superenhancers have been reported to be associated with genes that define cellular function (Whyte et al. 2013). In line with this, we identified common white and brite PPARγ superenhancers associated with key adipocyte regulatory factors, including C/EBPβ, PPARγ, and STAT5A. To search for novel transcriptional mediators of the rosiglitazone-induced browning of human adipocytes, we examined the genes associated with a brite-selective PPARγ superenhancer (see Supplemental Fig. S7B for examples). Interestingly, we observed a prominent brite-selective PPARγ superenhancer (as determined by both MED1 and H3K27ac ranking) near the gene encoding KLF11 (Fig. 4A; Supplemental Fig. S7B,E). KLF11 (also called MODY7) is a well-known regulator of pancreatic β-cell function, and human genetic variants have been associated with dysfunctional β cells and diabetes (Neve et al. 2005; Bonnefond et al. 2011). In nonadipocyte cell lineages, KLF11 regulates several metabolic gene networks and acts as both an activator and a repressor of transcription (Fernandez-Zapico et al. 2009; Seo et al. 2012; Lomberk et al. 2013). Moreover, it was recently shown that KLF11 can activate UCP1 expression in mouse bone marrow-derived stem cells (Yamamoto et al. 2010), suggesting that KLF11 could be a browning factor. However, whether and how it functions as such in mice are unclear. Furthermore, its role in human adipocytes remains totally unknown.
Figure 4.

Rosiglitazone treatment induces the superenhancer-associated gene KLF11 in vitro and in vivo. (A) ChIP-seq profiles of MED1, H3K27ac, PPARγ, and input control at the KLF11 locus in white (light blue) and brite (orange) hMADS adipocytes. The red line indicates the position of the brite-selective PPARγ superenhancer. (B) Expression of KLF11 mRNA (left) and KLF11 and UCP1 protein (right) in white (light blue) and brite (orange) hMADS adipocytes at day 19. (C) KLF11 mRNA (left) and protein (right) expression at day 16 of hMADS adipocyte differentiation with or without knockdown of PPARγ. hMADS adipocytes were transduced with lentiviral vectors expressing either scramble (black) or PPARγ (white) shRNA at day 10 and subsequently treated with rosiglitazone from day 13 to day 16 to induce browning. (D) KLF11 pre-mRNA levels in hMADS adipocytes at day 13 treated for 2 h with DMSO (white) or rosiglitazone (light orange) or differentiated to day 19 white (light blue) and brite (orange) adipocytes. In B–D, error bars represent SD (n = 3). (**) P < 0.005; (*) P < 0.05. (E) Relative expression (left) and log2 fold change (right) of KLF11 in human subcutaneous abdominal WAT from a total of 18 subjects treated for 3 mo with placebo and then 3 mo with rosiglitazone or vice versa. mRNA expression was normalized to control genes PPIA and PGK1. Details on the human cohort were previously described (Tan et al. 2005). Significance was determined using Wilcoxon matched pairs signed-ranks test.
Consistent with the association of KLF11 with a brite-selective PPARγ superenhancer, we found that KLF11 is expressed at higher levels in brite compared with white adipocytes and that this level is maintained at least until day 23 (Fig. 4B; Supplemental Fig. S8A,B). Furthermore, we found compelling evidence that KLF11 is directly activated by PPARγ during browning of human adipocytes. First, we showed that the expression of KLF11 in brite adipocytes is dependent on PPARγ (Fig. 4C; Supplemental Fig. S8C). Second, treatment of mature brite adipocytes with the selective PPARγ antagonist GW9662 leads to an acute reduction of KLF11 pre-mRNA levels (Supplemental Fig. S8D). Third, KLF11 pre-mRNA levels are significantly induced only 2 h after rosiglitazone treatment of mature hMADS adipocytes, and this increased transcription is maintained in mature brite adipocytes (Fig. 4D). Collectively, these results indicate that KLF11 is a brite-selective factor directly induced by PPARγ in hMADS adipocytes, most likely as a result of PPARγ binding to clusters of binding sites in the vicinity of the gene.
It has recently been demonstrated that cooling of white and brite murine adipocytes activates a β-adrenergic-independent thermogenic gene program (Ye et al. 2013). Interestingly, brite (Supplemental Fig. S8E) but not white hMADS adipocytes (data not shown) respond to 4 h of cooling at 31°C by an increase in the expression of UCP1 and a subset of other brite-selective genes, including KLF11. Furthermore, β-adrenergic stimulation of brite (Supplemental Fig. S8F) but not white hMADS adipocytes (data not shown) leads to a modest increase in UCP1 and KLF11. This demonstrates that although these thermogenic stimuli are insufficient for induction of browning per se, they lead to further activation of KLF11 along with the brite-selective gene program in brite hMADS adipocytes.
Next, we examined whether rosiglitazone treatment of human adults has any effect on KLF11 expression in subcutaneous fat. For this purpose, we used a human cohort consisting of 18 T2D patients treated with rosiglitazone for 90 d (Tan et al. 2005). Interestingly, rosiglitazone treatment leads to a statistically significant induction of KLF11 expression in abdominal subcutaneous fat of T2D subjects compared with placebo treatment (Fig. 4E). UCP1 expression was below the detection limit in 16 out of 18 placebo-treated individuals in this cohort; however, upon 90 d of rosiglitazone treatment, UCP1 expression became detectable in eight out of 18 T2D patients (Supplemental Fig. S8G), suggesting that some degree of browning occurs in the subcutaneous fat in response to rosiglitazone. Taken together, this demonstrates that KLF11 is a direct PPARγ target gene that is induced by rosiglitazone during in vitro as well as in vivo browning of human adipocytes.
KLF11 specifically activates the brite adipocyte gene program
We next addressed whether KLF11 plays an active role in the regulation of the human brite adipocyte gene program. Using two different lentiviral shRNA constructs, we found that knockdown of KLF11 in mature hMADS adipocytes significantly inhibits the induction of UCP1 upon rosiglitazone stimulation (Fig. 5A,B). In contrast, knockdown of a white-selective factor, ZNF323, resulted in a robust induction of UCP1 mRNA expression compared with the scramble control (Supplemental Fig. S9A). Consistent with the effect on UCP1 expression, we found that a subset of functionally important brite-selective genes is significantly repressed by KLF11 knockdown, whereas a control group consisting of white and general adipocyte marker genes is not (Fig. 5B). Importantly, PPARγ expression is comparable in control cells and cells with knockdown of KLF11, demonstrating that the effect on brite-selective gene expression is not mediated by feedback regulation of PPARγ (Fig. 5A,B). Interestingly, the gene encoding FHL1 is also associated with a brite-selective superenhancer (Supplemental Fig. S9B,C), and we show that FHL1, similar to KLF11, is required for browning (Supplemental Fig. S9D). This demonstrates that brite-selective superenhancers can be used as a discovery tool to identify key regulatory factors for the browning process.
Figure 5.

KLF11 specifically activates the brite adipocyte gene program. (A) KLF11 mRNA (top) and KLF11, UCP1, and PPARγ protein (bottom) expression in day 16 hMADS adipocytes transduced with lentivirus expressing either scramble shRNA (black) or one of two different KLF11 shRNAs (red) at day 10. hMADS adipocytes were subsequently treated with rosiglitazone from day 13 to day 16. Error bars represent SD (n = 3). (***) P < 0.001 compared with scramble control. (B) Expression levels of brite (top) and white and general (bottom) adipocyte markers in hMADS adipocytes transduced with lentivirus and stimulated with rosiglitazone as described in A. Error bars represent SD (n = 3). (#) P-value < 0.02 for both lentiviral constructs compared with scramble control. (C) Fraction of the top brite- and white-selective genes that are significantly (FDR < 0.1) induced (red) or repressed (blue) by KLF11 knockdown. Significance was determined by Fisher’s exact test as indicated. (D) Genes either repressed or induced by KLF11 knockdown were subjected to functional enrichment analyses. Enrichment was tested for a subset of brite and white adipocyte-selective metabolic pathways as determined in Supplemental Table S1. P-values are illustrated in the heat map. (E) OCR in hMADS adipocytes transduced with lentivirus expressing either scramble shRNA (black) or two different KLF11 shRNA (red) at day 10 and subsequently treated with DMSO or rosiglitazone from day 13 to day 16. (Left) The arrows indicate time of addition for oligomycin, FCCP, and rotenone/antimycin A. (Right) Uncoupled, maximal, and basal respiration in scramble and KLF11 knockdown cells. Error bars represent SEM (n = 3). (*) P < 0.05 as indicated. (F) Rosiglitazone-treated hMADS adipocytes (day 15) were subjected to KLF11 adenovirus (AdKLF11) or empty adenoviral control (AdEV), and expression was evaluated 24 h after transduction. (Top) Overexpression of KLF11 was evaluated by Western blot. (Bottom) Log2 fold change in gene expression in AdKLF11-treated cells compared with AdEV-treated cells for a subset of brite-selective genes as well as a control group of genes (as defined in A,B). The red lines represent the medians of the data sets. Significance was determined by Student’s t-test.
Investigation of the global effect of KLF11 on the brite-selective gene program by RNA-seq (Supplemental Fig. S10A) showed that a large fraction of brite-selective genes (17.4%) is significantly repressed by KLF11 knockdown, whereas a significantly lower fraction (4.3%) is induced. Furthermore, only minor fractions of white-selective and constitutively expressed genes are affected by KLF11 knockdown (Fig. 5C). These results indicate that KLF11 acts predominantly as an activator of the brite-selective gene program. Notably, functional enrichment analysis revealed that the majority of genes repressed by KLF11 knockdown belong to brite-selective metabolic pathways (Supplemental Table S1), such as fatty acid metabolism and oxidative phosphorylation (Fig. 5D). Importantly, the ability of rosiglitazone to induce a higher oxygen consumption rate (OCR; i.e., basal, maximal, and uncoupled respiration) and fatty acid oxidation capacity is completely abolished by KLF11 knockdown (Fig. 5E; Supplemental Fig. S10B). Thus, KLF11 is required for the ability of rosiglitazone to induce a brite phenotype in hMADS adipocytes.
To investigate whether KLF11 is capable of further activating brite-selective genes, we modestly overexpressed KLF11 in brite hMADS adipocytes using an adenoviral vector (Fig. 5F) and evaluated the effects on the subset of genes examined in Figure 5, A and B. Interestingly, overexpression of KLF11 causes a significant increase in mRNA levels of the majority of these brite-selective genes (Fig. 5F; Supplemental Fig. S10C), whereas there is little effect on general and white adipocyte marker genes. Collectively, these results show that KLF11 plays an important and rate-limiting role in the induction of the brite-selective gene program and an oxidative phenotype in hMADS adipocytes.
KLF11 induces brite-selective genes by activating nearby regulatory regions
To address the question of whether KLF11 directly activates brite-selective genes, we investigated whether KLF11 occupies sites in the vicinity of brite-selective genes regulated by KLF11. Antibody specificity was validated by KLF11 knockdown followed by ChIP-qPCR at selected sites (Supplemental Fig. S11A). Interestingly, we detected significant KLF11 binding in close proximity to several brite-selective genes, including UCP1, PDK4, FABP3, and DIO2, in brite hMADS adipocytes (Fig. 6A). Genome-wide binding profiling of KLF11 in white and brite hMADS adipocytes identified a total of 38,391 binding sites. As reported for KLF1 (Pilon et al. 2011), KLF11 binding is most prominent at gene promoter regions, although robust binding to distal regions can also be detected (Fig. 6B). Importantly, however, there is a highly significant enrichment of a motif resembling the SP1/KLF motif in all of these groups, suggesting that KLF11 binds directly to both promoter and more distal sites (Supplemental Fig. S11B). Interestingly, KLF11 binding at PPARγ enhancer constituents within superenhancers in brite adipocytes is elevated compared with that at regular PPARγ enhancers (Fig. 6C), indicating that KLF11 is particularly associated with PPARγ in superenhancers. Coimmunoprecipitation of KLF11 and PPARγ in brite hMADS adipocytes showed that they are able to interact, indicating potential direct cooperativety between these two transcription factors (Supplemental Fig. S11C). In line with this, KLF11 knockdown reduces MED1 occupancy at a subset of shared PPARγ/KLF11-binding sites within brite-selective PPARγ superenhancers (Supplemental Fig. S11D), indicating that KLF11 affects the activity of at least a subset of PPARγ constituents within brite-selective PPARγ superenhancers.
Figure 6.

KLF11 is a direct activator of brite-selective genes. (A) KLF11 binding to target sites in the vicinity of a subset of brite-selective genes in brite hMADS adipocytes as determined by ChIP-qPCR. Binding of KLF11 (black) and IgG (white) to selected sites (UCP1 −7 kb, FABP3 −8.5 kb, ACSL5 +7.3 kb, PDK4 promoter, APOL6 promoter, DIO2 promoter, ELOVL3 −17.9 kb, HADHB promoter, and IDH3A promoter) expressed as the percentage of recovery compared with the input sample. A negative control region (without any binding of KLF11) is included. Error bars represent SEM (n = 3). (*) P-value < 0.05 compared with negative control. (B) KLF11 signal (as tag count per peak in a 400-bp window) in KLF11-binding sites in promoter (white, 16,390 sites within 2 kb of the TSS), near distal (light gray, 4529 sites from 2 kb to 10 kb away from the TSS), and far distal (dark gray, 9680 sites from 10 kb to 50 kb away from the TSS) regions in brite hMADS adipocytes. Input signal in all KLF11-binding sites is shown as a control (black). Significance was determined by Wilcoxon rank-sum test. (C) KLF11 signal (as tag count per peak in a 400-bp window) in PPARγ constituents (left) and the fraction of PPARγ constituents with KLF11 binding (right) in regular PPARγ-binding regions (gray, 46,392 peaks) and PPARγ superenhancers (green, 5638 peaks) in brite hMADS adipocytes. (*) P < 2.2 × 10⁻¹⁶ as indicated, Wilcoxon rank-sum test (left panel) and Pearson’s χ2 test (right panel). (D) Percentage of the top brite- and white-selective genes as well as constitutively expressed genes (as defined in Fig. 1E), that have a KLF11-activated (red, 1179 sites) or KLF11-repressed (blue, 489 sites) binding site (BS) within 50 kb of the TSS. (E) Enrichment of KLF11-activated (red), KLF11-repressed (blue), or KLF11-unaffected (green, 1076 sites) binding sites (BS) near the top brite-selective genes (left) and the top brite-selective genes significantly repressed by KLF11 knockdown (right). Enrichment was determined as the number of binding sites per gene within different distances from the TSS (0–100 kb) of regulated genes relative to the number of binding sites per gene of constitutively expressed genes as defined in Figure 1E. (F) ChIP-seq binding profiles of KLF11 in white (light blue) and brite (orange) hMADS adipocytes as well as H3K27ac profiles in hMADS adipocytes transduced with shScramble (dark gray) or shKLF11 (light gray) from the DIO2 locus. The arrow indicates a putative KLF11-activated binding site. (G) Correlation between the log2 fold change in KLF11 signal and H3K27ac signal in brite versus white hMADS adipocytes at 945 KLF11-activated binding sites within 100 kb of annotated RefSeq genes. r indicates Pearson’s correlation coefficient, and the red line shows the linear regression between plotted values. (H) Plot illustrating the mean percentage change in KLF11 signal in brite compared with white hMADS adipocytes at KLF11-activated binding sites within 100 kb of the top brite-selective (black) and white-selective (gray) genes. Error bars represent the 95% confidence interval around the mean. (**) P-value < 0.005, two-tailed Student’s test.
To identify the functionally most important KLF11-binding sites, we performed H3K27ac ChIP-seq in hMADS adipocytes with or without KLF11 knockdown and evaluated the changes in H3K27ac signal upon KLF11 knockdown at all identified KLF11-binding sites. This allowed us to define subsets of KLF11-binding sites that either lose (1179 sites), gain (489 sites), or have unchanged (1076 sites) H3K27ac levels in response to KLF11 knockdown (Supplemental Fig. S12A); i.e., sites representing putative KLF11-activated, KLF11-repressed, and unaffected sites, respectively. Interestingly, the percentage of distal KLF11-binding sites affected by KLF11 knockdown is significantly higher than the percentage of promoter-proximal sites affected, suggesting that KLF11 has a prominent effect on distal regions despite these being weaker binding sites (Supplemental Fig. S12B).
We next examined how these responsive KLF11-binding sites are related to brite- and white-selective gene programs. Interestingly, we found that the fraction of brite-selective genes associated with putative KLF11-activated binding sites is significantly higher than the fraction of white-selective and constitutively expressed genes (Fig. 6D). Furthermore, putative KLF11-activated binding sites are enriched in the vicinity of brite-selective genes compared with KLF11-repressed and unaffected binding sites and are even more enriched near brite-selective genes that are repressed by KLF11 knockdown (Fig. 6E). In contrast, such sites are not enriched near genes that are induced by KLF11 knockdown or near white-selective genes (Supplemental Fig. S12C). These results demonstrate that KLF11-activated sites are mainly linked to brite-selective genes (see Fig. 6F; Supplemental Fig. S12D for examples). Importantly, there is a positive correlation between changes in KLF11 signal and H3K27ac signal during browning at KLF11-activated sites (Fig. 6G), with a specific gain of KLF11 and H3K27ac near brite-selective compared with white-selective genes (Fig. 6H; Supplemental Fig. S12E). Cumulatively, these results indicate that KLF11 functions as a specific and direct transcriptional activator of a large subset of brite-selective genes.
In summary, we present a model (Fig. 7) for rosiglitazone-mediated browning of human adipocytes and show the requirement for KLF11 in this process. In this model, rosiglitazone stimulation of mature human adipocytes triggers reprogramming of PPARγ binding, leading to the formation of brite-selective PPARγ superenhancers, which play an important role in activating the brite-selective gene program. This includes genes encoding browning transcription factors such as KLF11, which act in a cooperative manner with PPARγ to ensure full induction and maintenance of the brite adipocyte gene program independently of rosiglitazone.
Figure 7.
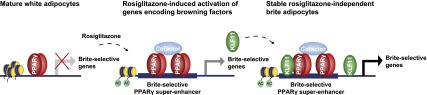
Model for rosiglitazone-induced browning and the role of KLF11 in this process. Rosiglitazone stimulation of mature human adipocytes leads to reprogramming of PPARγ binding, resulting in the formation of brite-selective PPARγ superenhancers. These events stimulate the expression of brite-selective genes, including the transcriptional regulator KLF11. Once induced, KLF11 acts in a cooperative manner with PPARγ and other browning factors to ensure full induction and maintenance of the brite adipocyte gene program independently of rosiglitazone.
Discussion
In this study, we used for the first time a genome-wide approach to characterize the transcriptional reprogramming events associated with the formation of functional human brown-like adipocytes. Using rosiglitazone as a browning stimulus, we show that comprehensive transcriptional changes occur during the browning process to establish a stable brite adipocyte gene program that, once established, can be maintained independently of rosiglitazone. Thus, it appears that the prolonged rosiglitazone stimulus induces an alternatively committed differentiation state in hMADS cells, where the adipocytes remain brite even when the stimulus has been withdrawn. This indicates that additional “stabilizing” browning factors are induced by rosiglitazone and are required for maintenance of browning.
Interestingly, rosiglitazone is also used in the differentiation cocktail from day 3 to day 9 of hMADS differentiation, at which point browning is not induced. It is unclear why only mature white adipocytes are able to undergo browning in response to rosiglitazone, but it is likely that activation of the browning genes requires factors that are not expressed until late in the differentiation of white adipocytes.
Despite considerable changes in gene expression during browning, the genome-wide changes in DHS are modest. This is in sharp contrast to the dramatic changes in chromatin structure (Siersbæk et al. 2011; Waki et al. 2011) and epigenomic marks (Mikkelsen et al. 2010; Steger et al. 2010) during 3T3-L1 adipocyte differentiation and indicates that transcriptional changes during browning of hMADS cells occur without major global changes in the chromatin landscape. Instead, our results indicate that browning relies on changes of the activity of a small subset of enhancers, possibly combined with modest changes in the activity of additional enhancers.
The fact that browning is induced by rosiglitazone indicated that PPARγ could be a major driver of the genomic reprogramming during browning, and we therefore profiled PPARγ in white and brite hMADS adipocytes. We showed that only a small fraction of PPARγ-binding sites differs dramatically in PPARγ occupancy, indicating that PPARγ acts in a site-selective manner and that the majority of PPARγ functions are common between white and brite adipocytes. Similarly, PPARγ binding in in vitro differentiated primary adipocytes obtained from different mouse white and brown adipose depots differs only at a subset of sites (Siersbæk et al. 2012). Importantly, and consistent with a central role of PPARγ in genomic reprogramming, we show that reprogrammed brite-selective PPARγ-binding sites correspond to sites that gain enhancer activity during browning, and these sites are enriched in the vicinity of brite-selective genes.
Interestingly, reprogramming of PPARγ binding during browning leads to the formation of brite-selective superenhancers (i.e., clusters of individual enhancers) recently shown to be key drivers of gene programs that define cell identify (Loven et al. 2013; Whyte et al. 2013). It appears that reprogramming of PPARγ binding at single constituent enhancers plays a major role in redefining PPARγ superenhancers during browning. Importantly, we show that brite-selective PPARγ superenhancers are much more enriched near brite-selective genes than regular brite-selective PPARγ enhancers. Furthermore, brite-selective genes associated with brite-selective superenhancers are more dramatically induced during browning than genes that do not have brite-selective superenhancers nearby. This clearly indicates the importance of superenhancers in defining gene programs characteristic of different adipocyte subtypes. The brite-selective superenhancers are enriched near genes encoding important metabolic regulators involved in fatty acid degradation and β-oxidation.
Since superenhancers have been reported to be associated with genes encoding lineage-determining transcriptional regulators (Whyte et al. 2013), we examined the list of genes associated with brite-selective PPARγ superenhancers. Interestingly, both factors that were chosen for analysis, KLF11 and FHL1, were found to be required for browning, demonstrating that association with superenhancers can be used as a discovery tool to identify novel transcriptional regulators of browning of adipocytes. Here we selected KLF11, which is a member of the SP1/KLF family of transcription factors, for further analyses. KLFs constitute an interesting family of transcription factors involved in the regulation of diverse metabolic networks (Neve et al. 2005; Lomberk et al. 2013; Zhang et al. 2013). Several KLF family members, including KLF2, KLF3, KLF4, KLF5, KLF6, KLF7, KLF9, and KLF15, have been implicated in different stages of adipogenesis (Wu and Wang 2013), but a role of KLF11 in adipogenesis has not been described. KLF11 has been shown to activate UCP1 expression in mouse bone marrow-derived stem cells (Yamamoto et al. 2010); however, the impact of KLF11 on browning of adipocytes remains unknown.
Our results identify KLF11 as a novel PPARγ target gene in human adipocytes, presumably activated through the nearby PPARγ superenhancer. Importantly, we show by loss of function and gain of function that KLF11 is a selective global activator of the brite adipocyte gene program in human adipocytes. To our knowledge, this places KLF11 as the first PPARγ-induced sequence-specific transcription factor involved in browning. Thus, KLF11 acts as a direct molecular link between the acute rosiglitazone-induced gene program and stabilization of the brite adipocyte phenotype. Cofactors that may contribute to this link include PGC-1α, which is a PPARγ target gene in primary cultures of white and brown adipocytes (Hondares et al. 2006), and PRDM16, which has been shown to be activated by PPARγ through increased stability (Ohno et al. 2012). Interestingly, our data show that KLF11 can be further induced by cooling and β-adrenergic stimulation of brite hMADS adipocytes, suggesting that KLF11 might be involved in mediating alternative thermogenic stimuli in addition to rosiglitazone-induced browning. In support of this notion, examination of microarray data from mice subjected to cold for 10 d (Rosell et al. 2014) revealed that KLF11 expression is induced in subcutaneous WAT as part of the cold response involving thermogenic and oxidative genes. In line with what has previously been shown (Elabd et al. 2009; Jespersen et al. 2013), neither β-adrenergic stimulation nor cooling of white hMADS adipocytes is capable of inducing browning, suggesting that additional activation stimuli are needed for induction of a thermogenic response in human white adipocytes.
Browning of human adipose tissue in response to cold has been shown to contribute significantly to human metabolism (Ouellet et al. 2012; Yoneshiro et al. 2013), and it is likely that rosiglitazone-induced browning of human adipose tissue could have a similar effect (Bogacka et al. 2005). Interestingly, our results show that KLF11 expression is induced by rosiglitazone in abdominal subcutaneous adipose tissue of human T2D subjects and that this is paralleled by an induction of UCP1 to detectable levels in eight out of 18 subjects. Thus, in addition to the weight gain experienced in subjects treated with rosiglitazone in this cohort (Tan et al. 2005), our data indicate that at least a subset of these patients displayed modest browning of their subcutaneous adipose tissue in response to rosiglitazone.
Genome-wide profiling of KLF11 demonstrates that KLF11 is primarily associated with promoter-proximal regions, which is in line with results for another member of the SP1/KLF family, KLF1 (Pilon et al. 2011). Since KLF11 has been reported to have both Sin3-HDAC-dependent and HP1-HMT-dependent repressor functions as well as p300-induced activation properties (Zhang et al. 2001; Fernandez-Zapico et al. 2009; Lomberk et al. 2012; Seo et al. 2012), we grouped the KLF11-binding sites into putative KLF11-activated sites (loss of H3K27ac in response to KLF11 knockdown) and putative KLF11-repressed sites (gain of H3K27ac in response to KLF11 knockdown). Our results demonstrate that putative KLF11-activated binding sites are highly enriched in the vicinity of brite-selective genes, in particular putative KLF11-activated brite-selective genes. A similar enrichment of KLF11-repressed sites was not observed for genes activated by loss of KLF11. This indicates that, in terms of the browning process, KLF11 acts primarily as a direct activator of the brite gene program.
In conclusion, we show for the first time that rosiglitazone-induced browning of human adipocytes is associated with comprehensive changes in gene expression driven in part by brite-selective PPARγ superenhancers. Furthermore, we identify KLF11 as a novel browning factor and a direct PPARγ target gene that is required for rosiglitazone-induced browning of human adipocytes. Thus, KLF11 constitutes a novel molecular link between the rosiglitazone-induced gene expression and the activation and maintenance of the brite-selective gene program. We propose that activation of KLF11 and other browning factors cooperate with PPARγ to establish a “stable” brite phenotype independent of continued administration of rosiglitazone. Future studies should investigate the molecular cross-talk between PPARγ and such browning factors.
Materials and methods
hMADS cell culturing and differentiation
hMADS-3 cells (Rodriguez et al. 2005; Zaragosi et al. 2007) were cultured and differentiated into mature adipocytes as described in the Supplemental Material. From day 13 to day 16 of differentiation, hMADS adipocytes were treated with rosiglitazone to form brite adipocytes or with DMSO to maintain white adipocytes. From day 16 forward, the differentiation medium of both white and brite adipocytes was depleted for rosiglitazone. GW9662 (Sigma) at 0.5 μM and isoproterenol (Sigma) at 1 μM were applied to the cell cultures as indicated.
Oil-red-O staining and glycerol-3-phosphate dehydrogenase analysis
Oil-red-O staining was performed as previously described (Helledie et al. 2002). Spectrophotometric analysis was used for quantification by measuring optical density at 500 nm. Glycerol-3-phosphate dehydrogenase activity measurements were performed as previously described (Negrel et al. 1978).
RNA extraction, cDNA synthesis, and quantitative real-time PCR
RNA extraction, cDNA synthesis, and quantitative real-time PCR were performed as previously described (Nielsen et al. 2006). Data were normalized to TBP unless stated otherwise. Sequences of real-time PCR primers will be provided on request. Two-tailed Student’s t-test was used to determine significance.
Western blotting and ECL detection
Whole-cell extracts were prepared in SDS-containing buffer and subjected to Western blotting as previously described (Nielsen et al. 2006). The following antibodies were used: anti-PPARγ (E-8; sc-7273, Santa Cruz Biotechnology), anti-KLF11 (10D8; H00008462-M03, Novus Biologicals), anti-FHL1 (10991-1-AP, Proteintech), anti-UCP1 (ab10983, Abcam), anti-Omni-probe (D8; sc-7270, Santa-Cruz Biotechnology), anti-rabbit IgG (P0399, DAKO), and anti-mouse IgG (P0447, DAKO). Anti-SP1 (sc-17824, Santa-Cruz Biotechnology) or anti-TFIIB (sc-225, Santa Cruz Biotechnology) was included as a loading control. Densitometry was used to quantify protein expression, and a two-tailed Student’s t-test was used to determine significance.
Lentiviral production and transduction of hMADS cells
For knockdown of PPARγ (Nielsen et al. 2008), KLF11, FHL1, and ZNF323 shRNA oligos targeting these factors were cloned into pSicoR PGK puro vectors (Addgene), and lentiviral particles were produced in human embryonic kidney (HEK) 293T cells as described (Ventura et al. 2004). As a control, a shRNA nontargeting oligo (scramble) was used. Sequences of shRNA oligos will be provided on request. Mature hMADS adipocytes (day 10 after induction of differentiation) were incubated for 24 h with lentiviral medium containing 6 μg/mL polybrene (Sigma) before the medium was changed to normal differentiation medium. shKLF11 construct #1 was used for RNA-seq experiments.
Adenoviral overexpression
The generation of the (His6-Xpress) KLF11 and control adenoviral vectors (Ad5CMV) was described in Lomberk et al. (2012). Rosiglitazone-treated hMADS adipocytes at day 15 were transduced for 6 h with ∼8 × 10⁹ infectious units of adenoviral particles per milliliter and 1 μg/mL poly-L-lysine in DMEM (Sigma). After the initial incubation, the medium was changed to normal differentiation medium without rosiglitazone, and cells were harvested 18 h later.
β-Oxidation
Determination of β-oxidation capacity in day 16 hMADS adipocytes transduced with lentivirus as described above was performed essentially as previously described (Berge et al. 2003).
Mitochondrial respiration analyses
For mitochondrial respiration analysis, hMADS cells were seeded in 24 multiwell plates (Seahorse) and differentiated and/or transduced with lentivirus as previously described. OCR in hMADS adipocytes at day 16 or 19 was determined using an XF24 extracellular flux analyzer (Seahorse Bioscience). We added 1.2 μM oligomycin, 1 μM FCCP, 1 μM rotenone, and 1 μM antimycin A to the cells as indicated.
Coimmunoprecipitation
Nucleus extraction and coimmunoprecipitation were performed essentially as described (Siersbaek et al. 2014). In brief, nuclei were isolated from rosiglitazone-treated hMADS adipocytes transduced with AdEV or His-tagged AdKLF11 as described above. Cleared nuclear extract was subjected to coimmunoprecipitation overnight at 4°C using anti-Omni-probe (D8; Santa-Cruz Biotechnology, sc-7270) conjugated to agarose beads. After washing, the immunoprecipitates were eluted by boiling in SDS buffer and subsequently prepared for Western blotting.
RNA-seq
Five micrograms of total RNA from hMADS preadipocytes and mature day 19 white and brite adipocytes was treated with a Ribo-Zero rRNA removal kit (Epicentre) and subjected to fragmentation and cDNA synthesis using the TruSeq RNA sample preparation kit version 2 (Illumina).
ChIP
ChIP experiments were performed in white and brite hMADS adipocytes at day 19 essentially as previously described (Siersbæk et al. 2012). For cross-linking of chromatin, 0.2 mM disuccinimidyl glutarate (DSG) (Proteochem) was applied for 45 min followed by cross-linking using 1% formaldehyde for 10 min. The antibodies used were anti-PPARγ (H-100; sc-7196, Santa Cruz Biotechnology), anti-MED1 (M-255; sc-8998, Santa Cruz Biotechnology), anti-CBP (A-22; sc-369, Santa Cruz Biotechnology), anti-KLF11 (10D8; H00008462-M03, Novus Biologicals), and anti-H3K27ac (ab4729, Abcam).
DHS site assessment
DNase I digestion was performed in white and brite hMADS adipocytes at day 19 on ∼10 million nuclei essentially as previously described (Siersbæk et al. 2011).
Library construction
RNA-seq, DHS-seq, and ChIP-seq libraries were constructed according to the manufacturer’s instructions (Illumina) as described (Nielsen and Mandrup 2014). Sequencing was performed on our in-house Illumina platform.
Data analyses
RNA-seq data
RNA reads were aligned to the human reference genome (version hg19) using Bowtie2 (Langmead and Salzberg 2012). The number of exon reads for all RefSeq genes was counted using Subread (Liao et al. 2013), and differential expression was determined using DESeq2 (Love et al. 2014). Functional enrichment analysis was performed with HOMER (Heinz et al. 2010) using pathways related to metabolism from the Kyoto Encyclopedia of Genes and Genomes (KEGG) annotation (Kanehisa and Goto 2000; Kanehisa et al. 2014)
Alignment of ChIP-seq and DHS-seq data, peak calling, and identification of regions with differential signal intensity
Sequence tags were aligned to the human reference genome (hg19) using Bowtie (Langmead et al. 2009), and ChIP-seq peaks were called using HOMER (Heinz et al. 2010). The University of California at Santa Cruz Genome Browser (Kent et al. 2002) was used for visualization. The differential signal intensity in binding regions/superenhancers was determined using HOMER and EdgeR (Robinson et al. 2010).
Accession numbers
Sequencing data are available from the Gene Expression Omnibus (GEO) under accession number GSE59703.
Human subjects
Human subcutaneous abdominal fat biopsies from a double-blind, placebo-controlled, crossover study involving T2D subjects treated with placebo/rosiglitazone for 90 d were used to analyze KLF11 expression. A total of 18 subjects from whom a complete physiological data set is available was included. Details on subjects and procedures were as described previously (Tan et al. 2005). Significance was determined using a Wilcoxon matched pairs signed-ranks test.
Additional information is available in the Supplemental Material.
Supplementary Material
Acknowledgments
We thank Rasmus Siersbæk and Niels Mahler Kristiansen as well as other members of the Mandrup laboratory for experimental support and fruitful discussions. Furthermore, we are grateful to Christian Dani (Université de Nice Sophia-Antipolis) for providing hMADS cells, and Per Sauerberg (Novo Nordisk A/S) for the kind gift of rosiglitazone. Work in the Mandrup laboratory was supported by grants from the VILLUM Foundation to the VILLUM Center for Bioanalytical Sciences at University of Southern Denmark, the Lundbeck Foundation, the Novo Nordisk Foundation, and the Danish Independent Research Council/Natural Sciences. Work in the Amri laboratory was supported by grants from the EU FP7 project DIABAT (HEALTH-F2–2011-278373), and the Centre National de la Recherche Scientifique (CNRS). A.L. and I.F. were supported in part by a Novo Scholarship. A.L., M.S.S., and S.M. conceived and designed the study. A.L., I.F., M.S.S., S.F.S., A.-S.B.L., D.F.P., and R.N. performed the experiments. A.L., J.G.S.M., and M.M.A. performed computational analyses. A.M., M.J.N., R.U., F.K., and E.-Z.A. contributed samples and materials. A.L. and S.M. wrote the manuscript with input from the other authors.
Footnotes
Supplemental material is available for this article.
Article published online ahead of print. Article and publication date are online at http://www.genesdev.org/cgi/doi/10.1101/gad.250829.114.
References
- Berge K, Tronstad K, Bohov P, Madsen L, Berge R. 2003. Impact of mitochondrial β-oxidation in fatty acid-mediated inhibition of glioma cell proliferation. J Lipid Res 44: 118–127. [DOI] [PubMed] [Google Scholar]
- Bogacka I, Xie H, Bray G, Smith S. 2005. Pioglitazone induces mitochondrial biogenesis in human subcutaneous adipose tissue in vivo. Diabetes 54: 1392–1399. [DOI] [PubMed] [Google Scholar]
- Bonnefond A, Lomberk G, Buttar N, Busiah K, Vaillant E, Lobbens S, Yengo L, Dechaume A, Mignot B, Simon A, et al. 2011. Disruption of a novel Kruppel-like transcription factor p300-regulated pathway for insulin biosynthesis revealed by studies of the c.-331 INS mutation found in neonatal diabetes mellitus. J Biol Chem 286: 28414–28424. [DOI] [PMC free article] [PubMed] [Google Scholar]
- Cohen P, Levy JD, Zhang Y, Frontini A, Kolodin DP, Svensson KJ, Lo JC, Zeng X, Ye L, Khandekar MJ, et al. 2014. Ablation of PRDM16 and beige adipose causes metabolic dysfunction and a subcutaneous to visceral fat switch. Cell 156: 304–316. [DOI] [PMC free article] [PubMed] [Google Scholar]
- Cousin B, Cinti S, Morroni M, Raimbault S, Ricquier D, Penicaud L, Casteilla L. 1992. Occurrence of brown adipocytes in rat white adipose tissue: molecular and morphological characterization. J Cell Sci 103: 931–942. [DOI] [PubMed] [Google Scholar]
- Crawford G, Holt I, Whittle J, Webb B, Tai D, Davis S, Margulies E, Chen Y, Bernat J, Ginsburg D, et al. 2006. Genome-wide mapping of DNase hypersensitive sites using massively parallel signature sequencing (MPSS). Genome Res 16: 123–131. [DOI] [PMC free article] [PubMed] [Google Scholar]
- Creyghton M, Cheng A, Welstead G, Kooistra T, Carey B, Steine E, Hanna J, Lodato M, Frampton G, Sharp P, et al. 2010. Histone H3K27ac separates active from poised enhancers and predicts developmental state. Proc Natl Acad Sci 107: 21931–21936. [DOI] [PMC free article] [PubMed] [Google Scholar]
- Cypess A, Lehman S, Williams G, Tal I, Rodman D, Goldfine A, Kuo F, Palmer E, Tseng Y-H, Doria A, et al. 2009. Identification and importance of brown adipose tissue in adult humans. N Engl J Med 360: 1509–1517. [DOI] [PMC free article] [PubMed] [Google Scholar]
- Cypess AM, White AP, Vernochet C, Schulz TJ, Xue R, Sass CA, Huang TL, Roberts-Toler C, Weiner LS, Sze C, et al. 2013. Anatomical localization, gene expression profiling and functional characterization of adult human neck brown fat. Nat Med 19: 635–639. [DOI] [PMC free article] [PubMed] [Google Scholar]
- Digby J, Montague C, Sewter C, Sanders L, Wilkison W, O’Rahilly S, Prins J. 1998. Thiazolidinedione exposure increases the expression of uncoupling protein 1 in cultured human preadipocytes. Diabetes 47: 138–141. [DOI] [PubMed] [Google Scholar]
- Elabd C, Chiellini C, Carmona M, Galitzky J, Cochet O, Petersen R, Pénicaud L, Kristiansen K, Bouloumié A, Casteilla L, et al. 2009. Human multipotent adipose-derived stem cells differentiate into functional brown adipocytes. Stem Cells 27: 2753–2760. [DOI] [PubMed] [Google Scholar]
- Feldmann HM, Golozoubova V, Cannon B, Nedergaard J. 2009. UCP1 ablation induces obesity and abolishes diet-induced thermogenesis in mice exempt from thermal stress by living at thermoneutrality. Cell Metab 9: 203–209. [DOI] [PubMed] [Google Scholar]
- Fernandez-Zapico ME, van Velkinburgh JC, Gutierrez-Aguilar R, Neve B, Froguel P, Urrutia R, Stein R. 2009. MODY7 gene, KLF11, is a novel p300-dependent regulator of Pdx-1 (MODY4) transcription in pancreatic islet β cells. J Biol Chem 284: 36482–36490. [DOI] [PMC free article] [PubMed] [Google Scholar]
- Fukui Y, Masui S, Osada S, Umesono K, Motojima K. 2000. A new thiazolidinedione, NC-2100, which is a weak PPAR-γ activator, exhibits potent antidiabetic effects and induces uncoupling protein 1 in white adipose tissue of KKAy obese mice. Diabetes 49: 759–767. [DOI] [PubMed] [Google Scholar]
- Guerra C, Koza R, Yamashita H, Walsh K, Kozak L. 1998. Emergence of brown adipocytes in white fat in mice is under genetic control.Effects on body weight and adiposity. J Clin Invest 102: 412–420. [DOI] [PMC free article] [PubMed] [Google Scholar]
- Haakonsson AK, Stahl Madsen M, Nielsen R, Sandelin A, Mandrup S. 2013. Acute genome-wide effects of rosiglitazone on PPARγ transcriptional networks in adipocytes. Mol Endocrinol 27: 1536–1549. [DOI] [PMC free article] [PubMed] [Google Scholar]
- Harms M, Seale P. 2013. Brown and beige fat: development, function and therapeutic potential. Nat Med 19: 1252–1263. [DOI] [PubMed] [Google Scholar]
- Heintzman N, Hon G, Hawkins R, Kheradpour P, Stark A, Harp L, Ye Z, Lee L, Stuart R, Ching C, et al. 2009. Histone modifications at human enhancers reflect global cell-type-specific gene expression. Nature 459: 108–112. [DOI] [PMC free article] [PubMed] [Google Scholar]
- Heinz S, Benner C, Spann N, Bertolino E, Lin Y, Laslo P, Cheng J, Murre C, Singh H, Glass C. 2010. Simple combinations of lineage-determining transcription factors prime cis-regulatory elements required for macrophage and B cell identities. Mol Cell 38: 576–589. [DOI] [PMC free article] [PubMed] [Google Scholar]
- Helledie T, Grontved L, Jensen SS, Kiilerich P, Rietveld L, Albrektsen T, Boysen MS, Nohr J, Larsen LK, Fleckner J, et al. 2002. The gene encoding the acyl-CoA-binding protein is activated by peroxisome proliferator-activated receptor γ through an intronic response element functionally conserved between humans and rodents. J Biol Chem 277: 26821–26830. [DOI] [PubMed] [Google Scholar]
- Himms-Hagen J, Cui J, Danforth E Jr, Taatjes DJ, Lang SS, Waters BL, Claus TH. 1994. Effect of CL-316,243, a thermogenic β3-agonist, on energy balance and brown and white adipose tissues in rats. Am J Physiol 266: R1371–R1382. [DOI] [PubMed] [Google Scholar]
- Hondares E, Mora O, Yubero P, Rodriguez de la Concepcion M, Iglesias R, Giralt M, Villarroya F. 2006. Thiazolidinediones and rexinoids induce peroxisome proliferator-activated receptor-coactivator (PGC)-1α gene transcription: an autoregulatory loop controls PGC-1α expression in adipocytes via peroxisome proliferator-activated receptor-γ coactivation. Endocrinology 147: 2829–2838. [DOI] [PubMed] [Google Scholar]
- Ishibashi J, Seale P. 2010. Medicine. Beige can be slimming. Science 328: 1113–1114. [DOI] [PMC free article] [PubMed] [Google Scholar]
- Jespersen NZ, Larsen TJ, Peijs L, Daugaard S, Homoe P, Loft A, de Jong J, Mathur N, Cannon B, Nedergaard J, et al. 2013. A classical brown adipose tissue mRNA signature partly overlaps with brite in the supraclavicular region of adult humans. Cell Metab 17: 798–805. [DOI] [PubMed] [Google Scholar]
- Kagey MH, Newman JJ, Bilodeau S, Zhan Y, Orlando DA, van Berkum NL, Ebmeier CC, Goossens J, Rahl PB, Levine SS, et al. 2010. Mediator and cohesin connect gene expression and chromatin architecture. Nature 467: 430–435. [DOI] [PMC free article] [PubMed] [Google Scholar]
- Kanehisa M, Goto S. 2000. KEGG: Kyoto encyclopedia of genes and genomes. Nucleic Acids Res 28: 27–30. [DOI] [PMC free article] [PubMed] [Google Scholar]
- Kanehisa M, Goto S, Sato Y, Kawashima M, Furumichi M, Tanabe M. 2014. Data, information, knowledge and principle: back to metabolism in KEGG. Nucleic Acids Res 42: D199–D205. [DOI] [PMC free article] [PubMed] [Google Scholar]
- Kent WJ, Sugnet CW, Furey TS, Roskin KM, Pringle TH, Zahler AM, Haussler D. 2002. The human genome browser at UCSC. Genome Res 12: 996–1006. [DOI] [PMC free article] [PubMed] [Google Scholar]
- Kopecky J, Clarke G, Enerback S, Spiegelman B, Kozak LP. 1995. Expression of the mitochondrial uncoupling protein gene from the aP2 gene promoter prevents genetic obesity. J Clin Invest 96: 2914–2923. [DOI] [PMC free article] [PubMed] [Google Scholar]
- Langmead B, Salzberg SL. 2012. Fast gapped-read alignment with Bowtie 2. Nat Methods 9: 357–359. [DOI] [PMC free article] [PubMed] [Google Scholar]
- Langmead B, Trapnell C, Pop M, Salzberg SL. 2009. Ultrafast and memory-efficient alignment of short DNA sequences to the human genome. Genome Biol 10: R25. [DOI] [PMC free article] [PubMed] [Google Scholar]
- Lefterova M, Zhang Y, Steger D, Schupp M, Schug J, Cristancho A, Feng D, Zhuo D, Stoeckert C, Liu X, et al. 2008. PPARγ and C/EBP factors orchestrate adipocyte biology via adjacent binding on a genome-wide scale. Genes Dev 22: 2941–2952. [DOI] [PMC free article] [PubMed] [Google Scholar]
- Lefterova MI, Haakonsson AK, Lazar MA, Mandrup S. 2014. PPARγ and the global map of adipogenesis and beyond. Trends Endocrinol Med 25: 293–302. [DOI] [PMC free article] [PubMed] [Google Scholar]
- Liao Y, Smyth GK, Shi W. 2013. The subread aligner: fast, accurate and scalable read mapping by seed-and-vote. Nucleic Acids Res 41: e108. [DOI] [PMC free article] [PubMed] [Google Scholar]
- Lidell ME, Betz MJ, Dahlqvist Leinhard O, Heglind M, Elander L, Slawik M, Mussack T, Nilsson D, Romu T, Nuutila P, et al. 2013. Evidence for two types of brown adipose tissue in humans. Nat Med 19: 631–634. [DOI] [PubMed] [Google Scholar]
- Lomberk G, Mathison AJ, Grzenda A, Seo S, DeMars CJ, Rizvi S, Bonilla-Velez J, Calvo E, Fernandez-Zapico ME, Iovanna J, et al. 2012. Sequence-specific recruitment of heterochromatin protein 1 via interaction with Kruppel-like factor 11, a human transcription factor involved in tumor suppression and metabolic diseases. J Biol Chem 287: 13026–13039. [DOI] [PMC free article] [PubMed] [Google Scholar]
- Lomberk G, Grzenda A, Mathison A, Escande C, Zhang JS, Calvo E, Miller LJ, Iovanna J, Chini EN, Fernandez-Zapico ME, et al. 2013. Kruppel-like factor 11 regulates the expression of metabolic genes via an evolutionarily conserved protein interaction domain functionally disrupted in maturity onset diabetes of the young. J Biol Chem 288: 17745–17758. [DOI] [PMC free article] [PubMed] [Google Scholar]
- Love MI, Huber W, Anders S. 2014. Moderated estimation of fold change and dispersion for RNA-seq data with DESeq2. bioRxiv. doi: 10.1101/002832. [DOI] [PMC free article] [PubMed]
- Loven J, Hoke HA, Lin CY, Lau A, Orlando DA, Vakoc CR, Bradner JE, Lee TI, Young RA. 2013. Selective inhibition of tumor oncogenes by disruption of super-enhancers. Cell 153: 320–334. [DOI] [PMC free article] [PubMed] [Google Scholar]
- Mikkelsen T, Xu Z, Zhang X, Wang L, Gimble J, Lander E, Rosen E. 2010. Comparative epigenomic analysis of murine and human adipogenesis. Cell 143: 156–169. [DOI] [PMC free article] [PubMed] [Google Scholar]
- Negrel R, Grimaldi P, Ailhaud G. 1978. Establishment of preadipocyte clonal line from epididymal fat pad of ob/ob mouse that responds to insulin and to lipolytic hormones. Proc Natl Acad Sci 75: 6054–6058. [DOI] [PMC free article] [PubMed] [Google Scholar]
- Neve B, Fernandez-Zapico ME, Ashkenazi-Katalan V, Dina C, Hamid YH, Joly E, Vaillant E, Benmezroua Y, Durand E, Bakaher N, et al. 2005. Role of transcription factor KLF11 and its diabetes-associated gene variants in pancreatic β cell function. Proc Natl Acad Sci 102: 4807–4812. [DOI] [PMC free article] [PubMed] [Google Scholar]
- Nielsen R, Mandrup S. 2014. Genome-wide profiling of transcription factor binding and epigenetic marks in adipocytes by ChIP-seq. Methods Enzymol 537: 261–279. [DOI] [PubMed] [Google Scholar]
- Nielsen R, Grøntved L, Stunnenberg H, Mandrup S. 2006. Peroxisome proliferator-activated receptor subtype- and cell-type-specific activation of genomic target genes upon adenoviral transgene delivery. Mol Cell Biol 26: 5698–5714. [DOI] [PMC free article] [PubMed] [Google Scholar]
- Nielsen R, Pedersen T, Hagenbeek D, Moulos P, Siersbaek R, Megens E, Denissov S, Børgesen M, Francoijs K-J, Mandrup S, et al. 2008. Genome-wide profiling of PPARγ:RXR and RNA polymerase II occupancy reveals temporal activation of distinct metabolic pathways and changes in RXR dimer composition during adipogenesis. Genes Dev 22: 2953–2967. [DOI] [PMC free article] [PubMed] [Google Scholar]
- Ohno H, Shinoda K, Spiegelman B, Kajimura S. 2012. PPARγ agonists induce a white-to-brown fat conversion through stabilization of PRDM16 protein. Cell Metab 15: 395–404. [DOI] [PMC free article] [PubMed] [Google Scholar]
- Ouellet V, Labbé S, Blondin D, Phoenix S, Guérin B, Haman F, Turcotte E, Richard D, Carpentier A. 2012. Brown adipose tissue oxidative metabolism contributes to energy expenditure during acute cold exposure in humans. J Clin Invest 122: 545–552. [DOI] [PMC free article] [PubMed] [Google Scholar]
- Petrovic N, Walden T, Shabalina I, Timmons J, Cannon B, Nedergaard J. 2010. Chronic peroxisome proliferator-activated receptor γ (PPARγ) activation of epididymally derived white adipocyte cultures reveals a population of thermogenically competent, UCP1-containing adipocytes molecularly distinct from classic brown adipocytes. J Biol Chem 285: 7153–7164. [DOI] [PMC free article] [PubMed] [Google Scholar]
- Pilon AM, Ajay SS, Kumar SA, Steiner LA, Cherukuri PF, Wincovitch S, Anderson SM, Center NCS, Mullikin JC, Gallagher PG, et al. 2011. Genome-wide ChIP-seq reveals a dramatic shift in the binding of the transcription factor erythroid Kruppel-like factor during erythrocyte differentiation. Blood 118: e139–e148. [DOI] [PMC free article] [PubMed] [Google Scholar]
- Pisani D, Djedaini M, Beranger G, Elabd C, Scheideler M, Ailhaud G, Amri E-Z. 2011. Differentiation of human adipose-derived stem cells into ‘brite’ (brown-in-white) adipocytes. Front Endocrinol 2: 87. [DOI] [PMC free article] [PubMed] [Google Scholar]
- Rada-Iglesias A, Bajpai R, Swigut T, Brugmann S, Flynn R, Wysocka J. 2011. A unique chromatin signature uncovers early developmental enhancers in humans. Nature 470: 279–283. [DOI] [PMC free article] [PubMed] [Google Scholar]
- Rajakumari S, Wu J, Ishibashi J, Lim HW, Giang AH, Won KJ, Reed RR, Seale P. 2013. EBF2 determines and maintains brown adipocyte identity. Cell Metab 17: 562–574. [DOI] [PMC free article] [PubMed] [Google Scholar]
- Robinson MD, McCarthy DJ, Smyth GK. 2010. edgeR: a Bioconductor package for differential expression analysis of digital gene expression data. Bioinformatics 26: 139–140. [DOI] [PMC free article] [PubMed] [Google Scholar]
- Rodriguez A-M, Pisani D, Dechesne C, Turc-Carel C, Kurzenne J-Y, Wdziekonski B, Villageois A, Bagnis C, Breittmayer J-P, Groux H, et al. 2005. Transplantation of a multipotent cell population from human adipose tissue induces dystrophin expression in the immunocompetent mdx mouse. J Exp Med 201: 1397–1405. [DOI] [PMC free article] [PubMed] [Google Scholar]
- Rosell M, Kaforou M, Frontini A, Okolo A, Chan YW, Nikolopoulou E, Millership S, Fenech ME, MacIntyre D, Turner JO, et al. 2014. Brown and white adipose tissues: intrinsic differences in gene expression and response to cold exposure in mice. Am J Physiol Endocrinol Metab 306: E945–E964. [DOI] [PMC free article] [PubMed] [Google Scholar]
- Schmidt S, Jørgensen M, Chen Y, Nielsen R, Sandelin A, Mandrup S. 2011. Cross species comparison of C/EBPα and PPARγ profiles in mouse and human adipocytes reveals interdependent retention of binding sites. BMC Genomics 12: 152. [DOI] [PMC free article] [PubMed] [Google Scholar]
- Seale P, Conroe H, Estall J, Kajimura S, Frontini A, Ishibashi J, Cohen P, Cinti S, Spiegelman B. 2011. Prdm16 determines the thermogenic program of subcutaneous white adipose tissue in mice. J Clin Invest 121: 96–105. [DOI] [PMC free article] [PubMed] [Google Scholar]
- Sears I, MacGinnitie M, Kovacs L, Graves R. 1996. Differentiation-dependent expression of the brown adipocyte uncoupling protein gene: regulation by peroxisome proliferator-activated receptor γ. Mol Cell Biol 16: 3410–3419. [DOI] [PMC free article] [PubMed] [Google Scholar]
- Seo S, Lomberk G, Mathison A, Buttar N, Podratz J, Calvo E, Iovanna J, Brimijoin S, Windebank A, Urrutia R. 2012. Krüppel-like factor 11 differentially couples to histone acetyltransferase and histone methyltransferase chromatin remodeling pathways to transcriptionally regulate dopamine D2 receptor in neuronal cells. J Biol Chem 287: 12723–12735. [DOI] [PMC free article] [PubMed] [Google Scholar]
- Sharp LZ, Shinoda K, Ohno H, Scheel DW, Tomoda E, Ruiz L, Hu H, Wang L, Pavlova Z, Gilsanz V, et al. 2012. Human BAT possesses molecular signatures that resemble beige/brite cells. PLoS ONE 7: e49452. [DOI] [PMC free article] [PubMed] [Google Scholar]
- Siersbæk R, Nielsen R, John S, Sung M-H, Baek S, Loft A, Hager G, Mandrup S. 2011. Extensive chromatin remodelling and establishment of transcription factor ‘hotspots’ during early adipogenesis. EMBO J 30: 1459–1472. [DOI] [PMC free article] [PubMed] [Google Scholar]
- Siersbæk M, Loft A, Aagaard M, Nielsen R, Schmidt S, Petrovic N, Nedergaard J, Mandrup S. 2012. Genome-wide profiling of peroxisome proliferator-activated receptor γ in primary epididymal, inguinal, and brown adipocytes reveals depot-selective binding correlated with gene expression. Mol Cell Biol 32: 3452–3463. [DOI] [PMC free article] [PubMed] [Google Scholar]
- Siersbaek R, Rabiee A, Nielsen R, Sidoli S, Traynor S, Loft A, Poulsen LL, Rogowska-Wrzesinska A, Jensen ON, Mandrup S. 2014. Transcription factor cooperativity in early adipogenic hotspots and super-enhancers. Cell Reports 7: 1443–1455. [DOI] [PubMed] [Google Scholar]
- Soccio R, Tuteja G, Everett L, Li Z, Lazar M, Kaestner K. 2011. Species-specific strategies underlying conserved functions of metabolic transcription factors. Mol Endocrinol 25: 694–706. [DOI] [PMC free article] [PubMed] [Google Scholar]
- Steger D, Grant G, Schupp M, Tomaru T, Lefterova M, Schug J, Manduchi E, Stoeckert C, Lazar M. 2010. Propagation of adipogenic signals through an epigenomic transition state. Genes Dev 24: 1035–1044. [DOI] [PMC free article] [PubMed] [Google Scholar]
- Tan GD, Fielding BA, Currie JM, Humphreys SM, Desage M, Frayn KN, Laville M, Vidal H, Karpe F. 2005. The effects of rosiglitazone on fatty acid and triglyceride metabolism in type 2 diabetes. Diabetologia 48: 83–95. [DOI] [PubMed] [Google Scholar]
- van Marken Lichtenbelt W, Vanhommerig J, Smulders N, Drossaerts J, Kemerink G, Bouvy N, Schrauwen P, Teule GJ. 2009. Cold-activated brown adipose tissue in healthy men. N Engl J Med 360: 1500–1508. [DOI] [PubMed] [Google Scholar]
- Ventura A, Meissner A, Dillon C, McManus M, Sharp P, Van Parijs L, Jaenisch R, Jacks T. 2004. Cre-lox-regulated conditional RNA interference from transgenes. Proc Natl Acad Sci 101: 10380–10385. [DOI] [PMC free article] [PubMed] [Google Scholar]
- Virtanen K, Lidell M, Orava J, Heglind M, Westergren R, Niemi T, Taittonen M, Laine J, Savisto N-J, Enerbäck S, et al. 2009. Functional brown adipose tissue in healthy adults. N Engl J Med 360: 1518–1525. [DOI] [PubMed] [Google Scholar]
- Waki H, Nakamura M, Yamauchi T, Wakabayashi K, Yu J, Hirose-Yotsuya L, Take K, Sun W, Iwabu M, Okada-Iwabu M, et al. 2011. Global mapping of cell type-specific open chromatin by FAIRE-seq reveals the regulatory role of the NFI family in adipocyte differentiation. PLoS Genet 7: e1002311. [DOI] [PMC free article] [PubMed] [Google Scholar]
- Whyte WA, Orlando DA, Hnisz D, Abraham BJ, Lin CY, Kagey MH, Rahl PB, Lee TI, Young RA. 2013. Master transcription factors and mediator establish super-enhancers at key cell identity genes. Cell 153: 307–319. [DOI] [PMC free article] [PubMed] [Google Scholar]
- Wilson-Fritch L, Nicoloro S, Chouinard M, Lazar M, Chui P, Leszyk J, Straubhaar J, Czech M, Corvera S. 2004. Mitochondrial remodeling in adipose tissue associated with obesity and treatment with rosiglitazone. J Clin Invest 114: 1281–1289. [DOI] [PMC free article] [PubMed] [Google Scholar]
- Wu Z, Wang S. 2013. Role of Kruppel-like transcription factors in adipogenesis. Dev Biol 373: 235–243. [DOI] [PubMed] [Google Scholar]
- Wu J, Bostrom P, Sparks LM, Ye L, Choi JH, Giang AH, Khandekar M, Virtanen KA, Nuutila P, Schaart G, et al. 2012. Beige adipocytes are a distinct type of thermogenic fat cell in mouse and human. Cell 150: 366–376. [DOI] [PMC free article] [PubMed] [Google Scholar]
- Yamamoto K-i, Sakaguchi M, Medina R, Niida A, Sakaguchi Y, Miyazaki M, Kataoka K, Huh N-h. 2010. Transcriptional regulation of a brown adipocyte-specific gene, UCP1, by KLF11 and KLF15. Biochem Biophys Res Commun 400: 175–180. [DOI] [PubMed] [Google Scholar]
- Ye L, Wu J, Cohen P, Kazak L, Khandekar MJ, Jedrychowski MP, Zeng X, Gygi SP, Spiegelman BM. 2013. Fat cells directly sense temperature to activate thermogenesis. Proc Natl Acad Sci 110: 12480–12485. [DOI] [PMC free article] [PubMed] [Google Scholar]
- Yoneshiro T, Aita S, Matsushita M, Kayahara T, Kameya T, Kawai Y, Iwanaga T, Saito M. 2013. Recruited brown adipose tissue as an antiobesity agent in humans. J Clin Invest 123: 3404–3408. [DOI] [PMC free article] [PubMed] [Google Scholar]
- Zaragosi LE, Billon N, Ailhaud G, Dani C. 2007. Nucleofection is a valuable transfection method for transient and stable transgene expression in adipose tissue-derived stem cells. Stem Cells 25: 790–797. [DOI] [PubMed] [Google Scholar]
- Zhang JS, Moncrieffe MC, Kaczynski J, Ellenrieder V, Prendergast FG, Urrutia R. 2001. A conserved α-helical motif mediates the interaction of Sp1-like transcriptional repressors with the corepressor mSin3A. Mol Cell Biol 21: 5041–5049. [DOI] [PMC free article] [PubMed] [Google Scholar]
- Zhang H, Chen Q, Yang M, Zhu B, Cui Y, Xue Y, Gong N, Cui A, Wang M, Shen L, et al. 2013. Mouse KLF11 regulates hepatic lipid metabolism. J Hepatol 58: 763–770. [DOI] [PubMed] [Google Scholar]
Associated Data
This section collects any data citations, data availability statements, or supplementary materials included in this article.