Abstract
Motivation: Co-regulated genes are not identified in traditional microarray analyses, but may theoretically be closely functionally linked [guilt-by-association (GBA), guilt-by-profiling]. Thus, bioinformatics procedures for guilt-by-profiling/association analysis have yet to be applied to large-scale cancer biology.
We analyzed 2158 full cancer transcriptomes from 163 diverse cancer entities in regard of their similarity of gene expression, using Pearson’s correlation coefficient (CC). Subsequently, 428 highly co-regulated genes (|CC| ≥ 0.8) were clustered unsupervised to obtain small co-regulated networks. A major subnetwork containing 61 closely co-regulated genes showed highly significant enrichment of cancer bio-functions. All genes except kinesin family member 18B (KIF18B) and cell division cycle associated 3 (CDCA3) were of confirmed relevance for tumor biology. Therefore, we independently analyzed their differential regulation in multiple tumors and found severe deregulation in liver, breast, lung, ovarian and kidney cancers, thus proving our GBA hypothesis. Overexpression of KIF18B and CDCA3 in hepatoma cells and subsequent microarray analysis revealed significant deregulation of central cell cycle regulatory genes. Consistently, RT-PCR and proliferation assay confirmed the role of both genes in cell cycle progression.
Finally, the prognostic significance of the identified KIF18B- and CDCA3-dependent predictors (P = 0.01, P = 0.04) was demonstrated in three independent HCC cohorts and several other tumors.
In summary, we proved the efficacy of large-scale guilt-by-profiling/association strategies in oncology. We identified two novel oncogenes and functionally characterized them. The strong prognostic importance of downstream predictors for HCC and many other tumors indicates the clinical relevance of our findings.
Contact: andreas.teufel@ukr.de
Supplementary information: Supplementary data are available at Bioinformatics online.
1 INTRODUCTION
Cancer is one of the leading causes of death (Jemal et al., 2009). Despite evident improvements in diagnostic procedures and the development of novel and effective therapies, the prognosis of disease remains dismal for many patients. A thorough understanding of the molecular basis of cancer development is critical to improve therapeutic options for a variety of cancers (Baehner et al., 2011). However, the identification of genes causally associated with complex diseases such as cancer remains challenging and therefore constitutes a major barrier in advancing our limited mechanistic understanding of the disease (Ioannidis, 2010). Simultaneously, increasing awareness of the fact that high-throughput gene expression analysis may reveal valuable insights into cancer biology led to the establishment of a variety of cancer microarray datasets and large microarray dataset repositories (Barrett et al., 2013; Davis et al., 2007; Parkinson et al., 2011; Sherlock et al., 2001). However, once published, these datasets are most often neglected as regards to further analysis. In fact, meta-analyses of this vast body of data are rarely attempted (Cahanm et al., 2007; Krupp et al., 2011). The reasons are manifold, ranging from the difficulty of integrating various technical platforms to the absence of bioinformatics knowledge on the part of primarily molecular oriented scientists, and the need for advanced statistics (Ioannidis, 2010). Finally, these datasets could be subject to alternative analysis strategies to obtain additional information not yielded by ‘standard’ analysis protocols. The concept of transferring gene function annotation from one gene to another based on the profile of their characteristics [‘guilt-by-profiling’, guilt-by-association (GBA)] has been frequently described. New biological relationships have been successfully identified in GBA studies, including correlated gene expression (Wu et al., 2002), correlated phylogenetic profiles (Date et al., 2003) and membership within gene expression clusters (Hughes et al., 2000; Stolovitzky 2003).
Some guilt-by-profiling studies have exploited gene–gene relationships by transforming them into gene functional characteristics. This occurs when integrating gene expression profiling or functional annotations of the respective genes (Wu et al., 2002). Despite such proven success, no attempts have been made to include samples from multiple tumor entities or samples of both types of inference. The benefits of such a large-scale GBA approach are obvious because genes closely regulated across >2000 samples and various tumor entities may be active in a highly robust carcinogenic network. We therefore hypothesized that integrating multiple sources of biological information, such as expression profiling and functional annotation over thousands of tumor samples and entities, may provide novel insights into key regulatory changes in cancer development and help to identify highly causative genes.
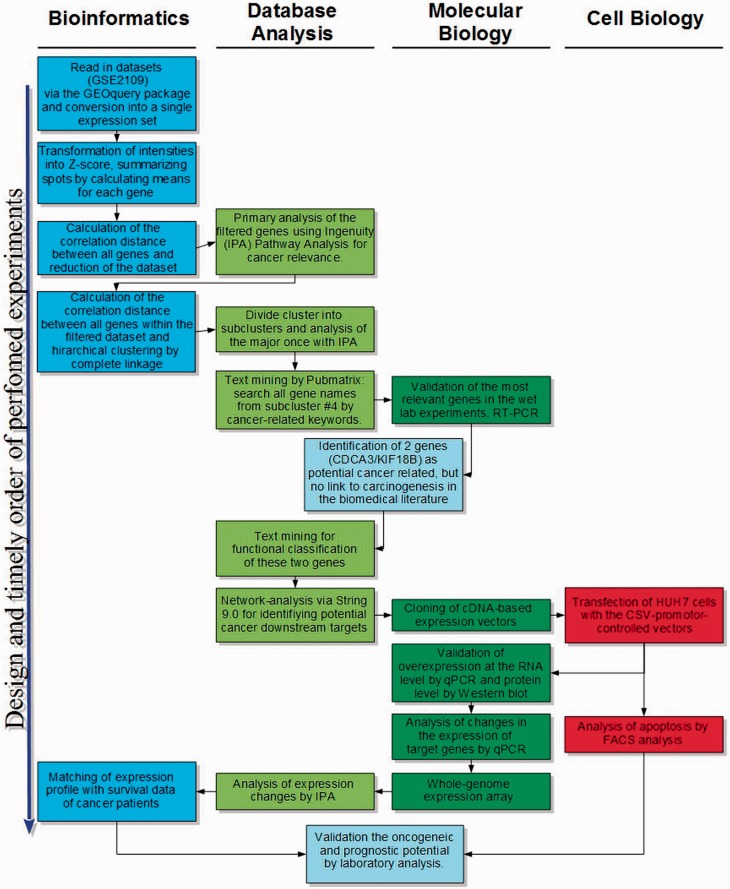
Using this approach and proving its feasibility, we validated the use of bioinformatics GBA strategies in large-scale molecular oncology, identified two novel oncogenes, demonstrated their deregulation in several tumors, functionally characterized the novel oncogenes, identified corresponding downstream targets and showed the prognostic relevance of downstream predictors for hepatocellular carcinoma (HCC) as well as many other tumors (Fig. 1).
Fig. 1.
Schematic summary of bioinformatics analysis, hypothesis generation and validation by molecular biology approaches, demonstrating the close and continuous interaction between bioinformatics and molecular biology analyses and resulting in a novel approach to profiling high-throughput oncogenetic data based on their correlation of gene expression. These findings could be successfully transferred to the detection of novel biomarkers
2 METHODS
2.1 Bioinformatics data analysis
The ‘GSE2109’ dataset was obtained from NCBI’s Gene Expression Omnibus 39 via the Bioconductor package ‘GEOquery’ 40. Further analysis was performed using R (http://r-project.org). According to the experimental description, signal values of the probe set were summarized using the Microarray Suite 5.0 (MAS5) and normalized. After downloading and combining the data into a single expression set, the expression data were transformed for each array via the Z-score (Cheadle et al., 2003). Gene-centered information was obtained by summarizing and averaging the expressions of all gene-specific spots per array as described by the annotation GPL570 and documented in the Gene Expression Omnibus. Highly correlated gene expressions were detected by Pearson’s correlation coefficient (CC). Genes with a CC of |CC| > 0.8 were used for further analysis. For hierarchical clustering, distances between genes within the reduced dataset were calculated with Pearson’s CC and transformed through CC = 1 − |CC|, to be used for hierarchical clustering. Complete clustering was applied to transformed distances. To estimate the ideal number of clusters, the KL index and the C index (Charrad et al., 2010) were applied to the clustering result.
2.2 Analysis of gene expression correlation
The CC is a measure of the linear interdependence of the characteristics. We used Pearson’s CC to calculate correlating gene expression, which ranged between −1 and 1. Analysis of CC was performed in C++ because of the enormous quantity of data, and for parallelization by Pthreads, which significantly accelerated the analysis. An optimal number of subclusters were identified using the C and KL indices (Charrad et al., 2010).
2.3 Analysis of robustness of co-regulated genetic subclusters
Main data were reduced to the specific tissues of interest (liver, colon and breast). Robustness was calculated by applying the methods described above to the selected tissue-specific subsets. Genes within cluster #4 in the main data analysis were subsequently mapped to the novel tissue-specific clusters and analyzed for overlapping genes, genes with changing associations and genes not being co-regulated >0.8 in specific tissue.
2.4 Cell lines and vectors
The target gene kinesin family member 18B (KIF18B) and cell division cycle associated 3 (CDCA3) sequences were obtained from the NCBIGene. The annotated sequences have been cloned in a PUC57 vector. For overexpression in the mammalian cell line, a PCI vector carrying a cytomegalie virus (CMV) promoter was used (Promega).
HUH7 cells were cultivated in advanced Dulbecco’s modified Eagle medium (DMEM). The cells were seeded into six-well plates at a density of 1 million cells per six-well plate, 15 h before transfection. Transfection was performed using Lipofectamine LTX plus (Invitrogen) in Opti-MEM medium. After 6 h of incubation, the medium was changed to advanced DMEM, and cells were cultivated for 24 h at 37°C and 5% CO2. Cell harvesting and RNA isolation were performed using TRI reagent (Sigma-Aldrich).
2.5 Microarray analysis
The entire genome array analysis was performed on an agilent human whole-genome array chip at the Institute of Molecular Biology (University of Mainz). All samples were analyzed in triplets. The R-version 2.13.1 and the extension array QualityMetrics 3.8.0 were used to process the results. Ingenuity and Prism (Graphpad) were the basis of further analyses for change of expression, networking and survival analysis.
2.6 qPCR Analysis
For qPCR on the targets found by bioinformatics, a two-step strategy was selected. Reverse transcription was performed with the RevertAid H Minus First Strand cDNA Synthesis Kit (Fermentas) using an oligo-dT-primer. Quantitative analysis itself was done with QuantiTect Primer Assays (Quiagen) in a LightCycler LC480 (Roche). Three biological samples were run in triplicate and quantified using a comparative cycle threshold. Further evaluation and t-testing were performed with MS Excel 2010.
2.7 Colony-forming assay
Proliferation of the cells was examined with the colony-forming assay. Transfected cells and controls were shown at densities of 5000 and 10 000 cells per well. Cells were grown for 1 week, changing media every second day. Colonies were then stained with crystal violet for analysis.
2.8 Impact of CDCA3 and KIF18B target gene expression for survival of patients with HCC; predictor development
To investigate the prognostic relevance of CDCA3- and KIF 18B-dependent target genes in human HCC, we analyzed a dataset containing 53 human genome-wide HCC microarrays (Andersen et al., 2009) using BRB array tools (http://linus.nci.nih.gov/BRB-ArrayTools.html; version 3.8.0). All data were subjected to log2 transformation. After normalization using the median over the entire array, all genes with a percentage of missing data >20% were excluded. The remaining genes were filtered for either the CDCA3 or the KIF18B target gene list. Unsupervised hierarchical clustering using Euclidean distance and average linkage were used to split the human dataset into two subgroups: A and B (cluster 3; Eisen et al., 1998). For comparing the difference in survival between the two subgroups, we performed Kaplan–Meier survival analysis and the log-rank test using the MedCalc software packages (http://www.medcalc.be). To develop a CDCA3- and KIF18B-dependent predictor, we calculated the average expression for each gene in both cluster groups of the training dataset. As the next step, independent test data from 242 patients with HCC (Roessler et al., 2010) were correlated to this predictor by means of Pearson’s correlation. Patients were assigned to one of the two groups (A or B), depending on the higher correlation value. Survival for patients in the test data subgroups was again analyzed by plotting Kaplan–Meier curves (Supplementary Fig. S1).
3 RESULTS
3.1 Bioinformatics co-expression analysis of a large oncogenetic microarray dataset, meta-analysis of microarray data and application of a co-regulation approach to large-scale oncogenetic data
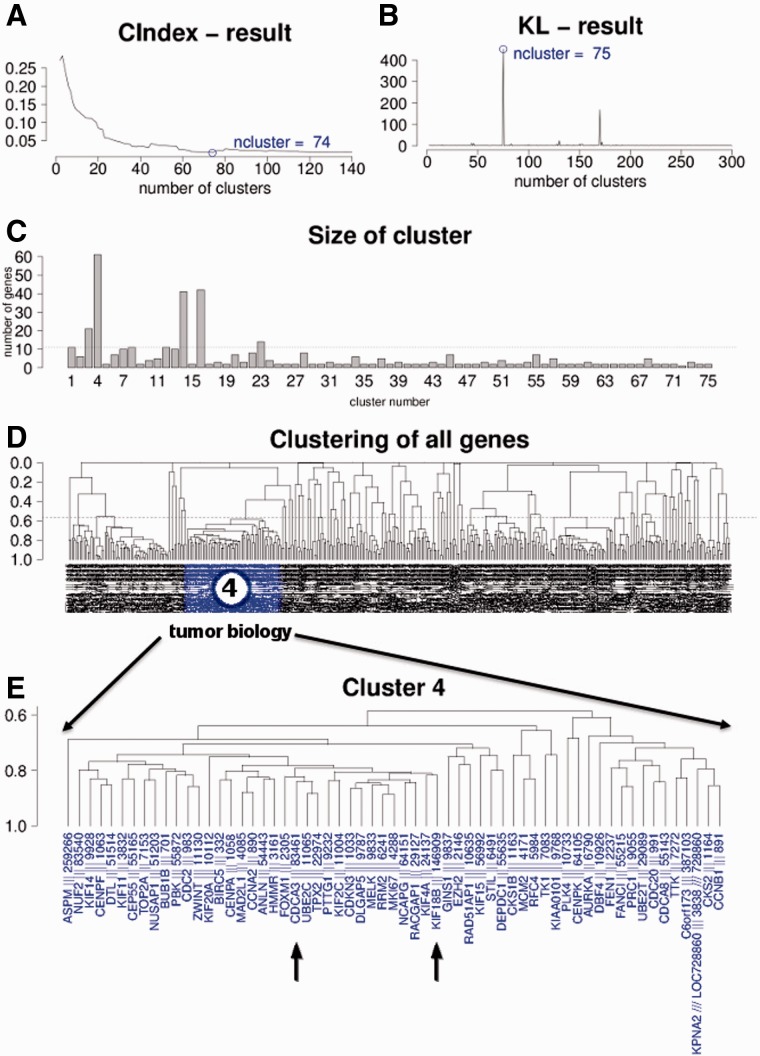
To identify co-regulated genes and networks, we analyzed expression profiles of 20 827 (genome wide) genes over 2158 microarray datasets incorporating 163 diverse tumor entities. Using Pearson’s CC of |CC| ≥ 0.8, we identified 428 genes (2.1%) as being highly co-expressed (Fig. 2D, Supplementary Fig. S4). Next, we aimed to identify biologically interacting networks within this still large number of 428 highly co-regulated genes. To estimate an optimal cutoff for separating subnetworks on the basis of the initial unsupervised clustering, we performed C index and KL index analysis and determined the optimal numbers of subclusters. As shown in Figure 2A and B, both algorithms pointed toward good separation of clusters when 74 or 75 subclusters were chosen. For further analysis, we separated the large unsupervised cluster of 428 genes into 75 subclusters, based on a Pearson’s coefficient of |CC| ≥ 0.56. On plotting the size (number of genes) of these subclusters, we identified several small, but also four larger, subclusters containing ≥20 genes (cluster #3, 4, 14 and 16). Cluster #4 was by far the largest subnetwork, containing 61 genes (Fig. 2D and E).
Fig. 2.
(A) C index analysis for good separation of clusters, indicating optimal separation for 74 clusters. (B) KL index analysis for good separation of clusters, indicating good separation for 75 clusters. (C) Plot of the number of genes in each of the 75 subclusters. (D) Unsupervised clustering of all 428 genes with correlation ≥ 0.8 over all 2158 datasets. (E) Enlargement of subcluster #4 containing 61 single genes
3.2 Identification of functionally related subnetworks by means of biological function enrichment analysis
Analyzing the complete cluster of 428 genes that were found to be highly co-regulated, Ingenuity Pathway Analysis revealed that the most prominent bio-function was ‘Cancer’ (P-value: 1.74E-26–8.7E-03, number of genes: 177), thus validating our approach. In addition, other tumor-related bio-functions such as ‘Cell Death’ (7.49E-10–9E-03, 101) and ‘Cellular Growth and Proliferation’ (5.57E-07–9E-03, 121) were identified. Next, subnetworks with high genetic similarity as demonstrated by unsupervised clustering were analyzed in respect of their signaling pathway and biological function enrichment. Among the largest co-regulated subnetworks was a 61-gene-containing network (#4, CC: 0.59–0.88) that had mainly genes related to cell cycle regulation and cancer development as determined by PubMatrix analysis (Becker et al., 2003). Other co-regulated subnetworks were found to contain enrichment of ribosomal genes (#14, 41 genes, CC: 0.66–0.98); these genes are involved in immunity (#16, 42 genes, CC: 0.56–0.96) and immunological events (Fig. 2D).
3.3 Robustness of co-regulated genetic subclusters
Given our hypothesis that the co-regulated networks functionally interact and also for the purpose of biological relevance, these networks should be visible on overall analysis and also stable within individual tissues. For this reason, we compared their stability and behavior in HCC (45 samples, 2.1% of the overall data), breast cancer (353 samples, 16.4%) and colon cancer samples (289 samples, 13.4%). An overlap of 255 of the 428 genes was continuously co-regulated in all three tissues. On average, 78.2% of the genes in the four largest subclusters (#4, #16, #3 and #14) were preserved (at least 57.1%). Thus, high coherence of the cluster function was conserved in several tissues (Supplementary Fig. S2).
3.4 Advanced functional analysis of a highly conserved oncogenetic subcluster
Among the different clusters, #4 incorporated genes with high enrichment of carcinogenic and cell cycle-regulating gene ontologies. Given the importance of cell cycle regulation for cancer development, we decided to focus our subsequent analysis on this cluster. To better understand the detailed molecular mechanism by which these genes interfere with cell cycle regulation, we evaluated the enrichment of canonical pathways among these 61 genes. Top-ranked genetic pathways included the mitotic roles of polo-like kinase (∼2.73E-09), cell cycle: G2/M DNA damage checkpoint regulation (∼4.96E-04) and the role of CHK protein in cell cycle checkpoint control (∼7e-03). The analysis indicated the major impact of this subnetwork on G2/M transition and checkpoint kinases (IPA analysis, http://www.ingenuity.com, Fig. 4).
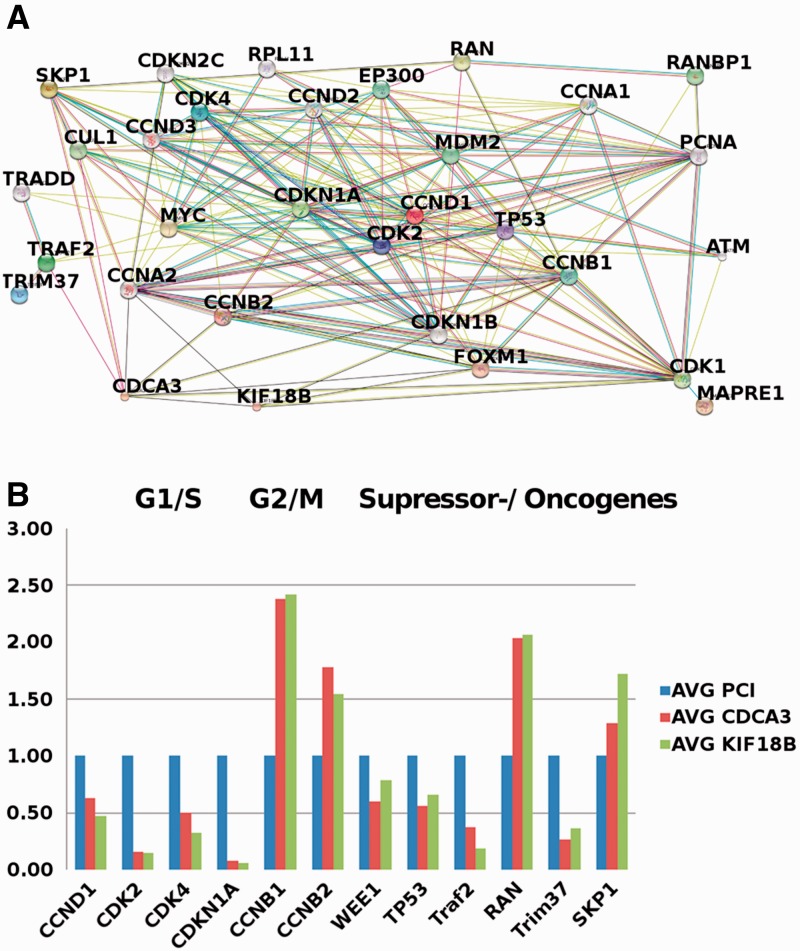
Fig. 4.
(A) Interaction network of cell cycle-interfering genes containing CDCA3 and KIF18B. (B) RT-PCR analysis of major components of this network after CDCA3 and KIF18B overexpression and empty expression vector transfection in HUH7 cells. Key factors of cell cycle regulation were significantly disturbed in terms of expression because of CDCA3 and KIF18B overexpression
To obtain a broad overview about the known biomedical information concerning these 61 genes, we next performed a text-mining analysis using PubMatrix (Becker et al., 2003). A search based on the terms ‘cancer’, ‘tumor’, ‘liver’, ‘carcinoma’, ‘HCC’ and ‘hepatocellular carcinoma’ revealed that the majority of genes (94%) had already been described with respect to (liver) ‘cancer’. This served as the ‘proof of principle’ for our approach. Two genes had not been previously described with respect to carcinogenesis: CDCA3 and KIF18B. However, as CDCA3 and KIF18B were part of this tightly co-regulated oncogenetic and cell cycle-regulating network, we proposed as a guilt-of-association hypothesis that these two genes may be novel oncogenes essentially linked to carcinogenesis.
3.5 Activation of CDCA3 and KIF18B in multiple tumor entities
To evaluate the importance of CDCA3 and KIF18B in carcinogenesis, we next investigated differential gene expression in four different tumor entities, i.e. breast, lung, ovarian and renal cancer (n = 5, each). Liver cancer expression was further evaluated in a publicly available dataset of 60 patients (Shimokawa et al., 2010). In all five tumor entities, a highly significant upregulation of both CDCA3 and KIF18 B expression was registered in comparison with normal tissue.
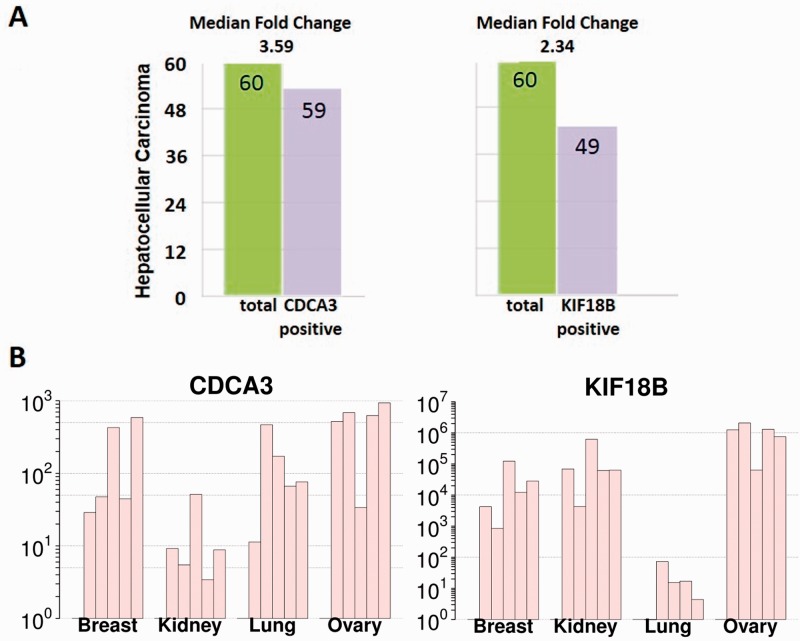
Specifically, CDCA3 showed on average 227-, 159-, 560- and 16-fold overexpression in breast, lung, ovarian and renal cancer, respectively, compared with normal tissue. For KIF18B, the gene showed on average >100-, 22-, >100- and >100-fold overexpression in breast, lung, ovarian and renal cancer, respectively, compared with normal tissue. This was particularly because of low expression in normal tissue (Fig. 3).
Fig. 3.
(A) Results of CDCA3 and KIF18B gene expression analysis from the iCOD liver cancer database, summarizing the number of patients showing overexpression of CDCA3 or KIF18B (59 or 49, blue bars) among all investigated patients (60, yellow bar). (B) RT-PCR results of CDCA3 and KIF18B gene expression in breast, kidney, lung and ovarian tumors compared with normal tissue. Both genes were highly overexpressed in all of the diverse cancer tissues
Besides, CDCA3 was overexpressed in 59 and KIF18B was overexpressed in 49 of 60 patients in a Japanese liver cancer patient cohort with a median 3.59- and 2.34-fold change, respectively (Fig. 3).
3.6 CDCA3- and KIF18B-dependent downstream signatures identified by microarray analysis further confirm a role in carcinogenesis
To further confirm the role of CDCA3 and KIF18B as driver genes in carcinogenesis, we performed microarray analyses after 24-h overexpression of both genes in HUH7 cells. Compared with empty expression vector controls (PCI), we identified 143 genes being differentially regulated by CDCA3 overexpression and 440 genes by KIF18B overexpression. Functional annotation of CDCA3- and KIF18B-regulated genes showed significant enrichment of cancer-related genes. Most downstream target genes showed consistent enrichment of major oncogenic pathways for both genes (P = 9.20E-06 − 1.01E-02 among CDCA3 target genes, P = 5.64E-05 − 1.09E-02 among KIF18B target genes). In addition, many of the highest ranked associated network functions (CDCA3: antigen presentation, cell-to-cell signaling and interaction, hematological system development and function, cell death, cellular movement and cell cycle; KIF18B: cell death, cellular development, hematological system development, cell-to-cell signaling and interaction, cellular movement and immune cell trafficking) or molecular and cellular functions (CDCA3: cellular growth and proliferation P = 6.75E-06 − 1.01E-02; KIF18B: cell death 2.06E-06 − 1.10E-02, cellular development 1.77E-05 − 1.10E-02 33, cell cycle 4.41E-05 − 1.10E-02 14) further support key tumorigenic roles of these genes and their associated molecular signaling pathways (http://www.ingenuity.com).
Together, the enrichment of established cancer-related signaling pathways and biological functions indicates that overexpression of CDCA3 and KIF18B is deeply linked to functional changes in carcinogenesis.
3.7 Cell cycle regulation by CDCA3 or KIF18B overexpression, RT-PCR validation
As cell cycle regulation is a major hallmark of genes involved in carcinogenesis, we investigated the impact of CDCA3 or KIF18B on cell cycle regulation in greater detail (Fig. 4).
3.8 Cell cycle regulation
The importance of cyclin D1, CDK4 CDK2 and p21/CDKN1A for G1/S-phase transition is widely accepted (Sherr, 1996). Disruption of these genes was analyzed. All four genes showed significant downregulation after CDCA3 overexpression (cyclin D1: −0.37, P = 0.01; CDK4: −0.5, P = 0.020; CDK-2: −0.84, P < 0.01; p21/CDKNA1: −0.93-fold, P < 0.01). The residual activity of 7% for p21/CDKNA1, clearly shown to act as a tumor suppressor, may be equated with nearly complete inactivation of the gene locus. Even greater suppression was observed after KIF18B overexpression (cyclin D1: −0.53, P = 0.01; CDK4: −0.68, P < 0.01; CDK2: −0.86, P < 0.01; p21/CDKNA1: −0.94, P <0.01). Altogether, the overexpression of CDCA3 or KIF18B caused considerable disturbance in the gene expression of G1/S cell cycle stage-regulating genes (Fig. 4). We then looked for key regulators of G2/M transition (Bucher et al., 2008). Consistently, on overexpression of CDCA3 the cells responded with a strong increase in activity of both examined cyclins, cyclins B1 (2.38-fold, P < 0.01) and B2 (1.78-fold, P = 0.03), compared with PCI. Conversely, the activity of the corresponding cyclin opponent WEE-1 was reduced −0.40-fold (P < 0.01). Overexpression of KIF18B exerted an even stronger effect on the upregulation of cyclins B1 (1.42-fold, P < 0.01) and B2 (1.54-fold, P < 0.01). Consistently, WEE-1 expression was decreased −0.21-fold (P = 0.11). However, despite the clear trend, the latter data failed to achieve statistical significance (Fig. 5).
Fig. 5.
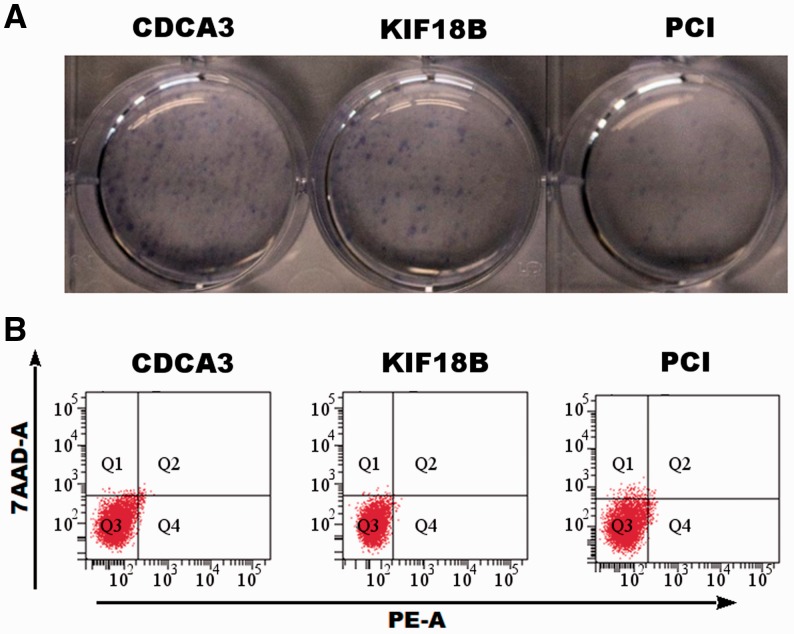
Overexpression of CDCA3 and KIF18B increased proliferation, whereas the apoptosis rate remained unchanged. (A) The colony-forming assay showed significantly more colonies after overexpression of CDCA3 and KIF18B in HUH7 cells compared with the overexpression of the empty expression vector (PCI) without overexpression of any vector. (B) Analysis of apoptosis after overexpression of CDCA3 and KIF18B in HUH7 cells showed no significant difference between the overexpression of CDCA3 and KIF18B in HUH7 cells and controls
3.9 Tumor suppressor and oncogenes
Besides major cell cycle checkpoints, well-established tumor suppressor genes were significantly downregulated after CDCA3 and KIF18B expression. TP53 [Lee and Muller, 2010; −0.34-fold (KIF18B, P = 0.11) to −0.43-fold (CDCA3, P < 0.01)] and the apoptosis-inducing gene TRAF2 (Takeuchi et al., 1996) were significantly downregulated [−0.62-fold (CDCA3, P < 0.01) to −0.82-fold (KIF18B, P < 0.01)].
Further, the oncogenes RAN [(Rensen et al., 2008) (2.04- (CDCA3, P = 0.01) to 2.07-fold KIF18B, P = 0.01) and TRIM37 (−0.74-(CDCA3, P < 0.01) to −0.64-fold KIF18B, P < 0.01)] revealed a marked increase in expression on CDCA3 or KIF18B expression. Additionally, SKP-1, an essential component of the Skp, Cullin, F-box containing (SCF) complex complex involved in the degradation of WEE-1, was significantly overexpressed [1.29- (CDCA3, P < 0.01) to 1.72-fold (KIF18B, P < 0.1) (Jia et al., 2009)].
3.10 Overexpression of CDCA3 and KIF18B leads to impaired proliferative capacity due to the disturbance of cell cycle regulation, which is a major deregulation in cancer
To further characterize the functional consequences associated with overexpression of CDCA3 and KIF18B in vitro, we assessed proliferative behavior by colony-forming assay. A massive increase in proliferation compared with the PCI controls was observed. Strongest growth was observed in those cells with excessive CDCA3 activity (number of colonies). Notably, overexpression of KIF18B not only changed the incidence of colony formation but also resulted in a morphological change: larger colonies were found compared with those after CDCA3 overexpression (Fig. 5A).
Interestingly, the induction of CDCA3 and KIF18B did not impair the apoptosis response as assessed by fluorescence-activated cell sorting (FACS), underlining the predominant role of these genes in cell cycle regulation (Fig. 5B).
3.11 Prognostic relevance of CDCA3 and KIF18 B downstream target predictors
As the data detailed above pointed toward the major role of CDCA3 and KIF18B in carcinogenesis in general as well as in multiple tumor entities, we specifically investigated their prognostic potential in various cancers, especially HCC.
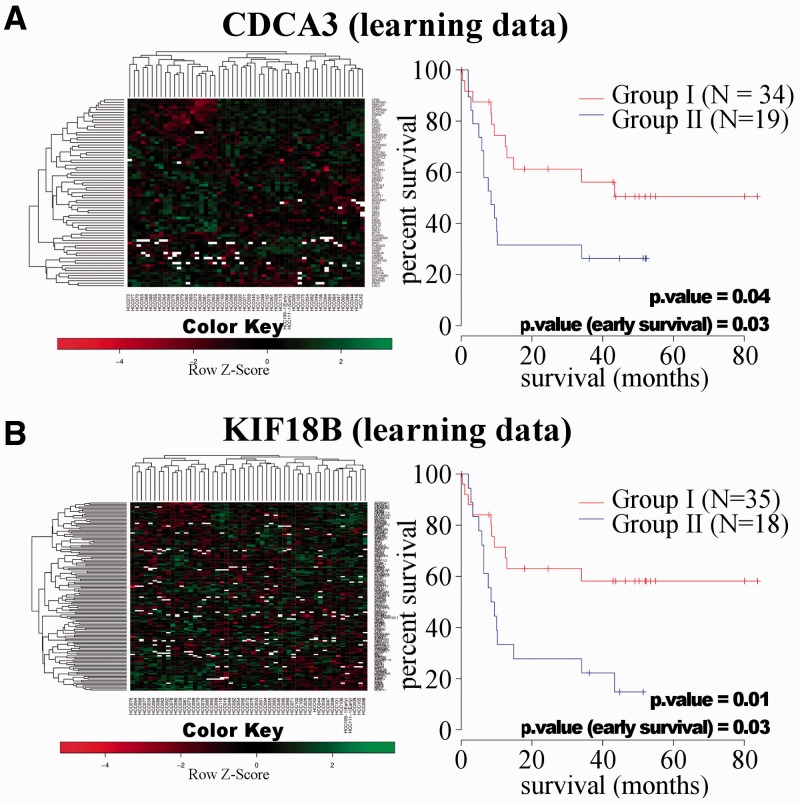
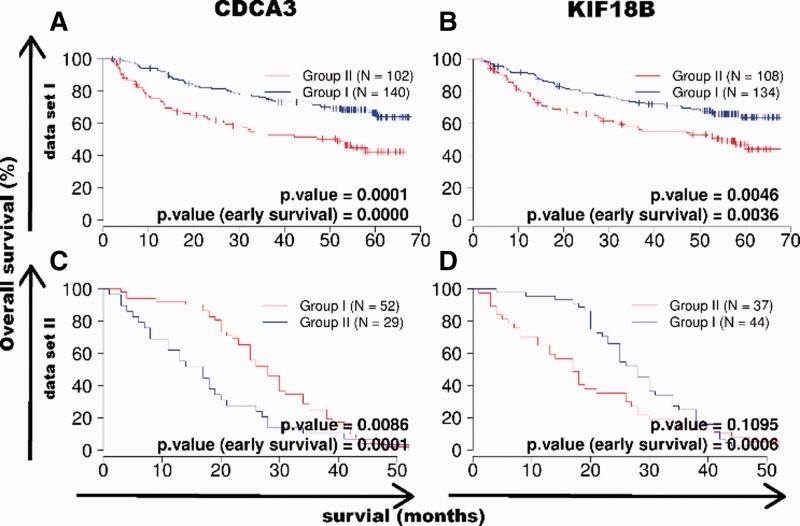
The 143 CDCA3- and 440 KIF18B-dependent genes were integrated into our 53 HCC patient database (training data, Andersen et al., 2009). Unsupervised clustering resulted in two distinct subgroups. On Kaplan–Meier analysis both the CDCA3-dependent and the KIF18B predictors demonstrated statistically significant prognostic relevance in these two patient groups (P = 0.04, P = 0.01, Fig. 6). To validate these results, we further correlated two independent datasets of 242 and 81 HCC patients to the mean of each gene from the training data by means of Pearson’s correlation (test data, Fig. 7). Kaplan–Meier analysis again showed two prognostic subgroups with significant differences in survival in both datasets for CDCA3 (P = 0.0001, P = 0.009). The 242 patient datasets also showed two prognostic subgroups with significant differences in survival for the 242 patient cohort (P = 0.005) and a trend to differences in survival for the 81 patient cohort (P = 0.11). Early survival showed highly significant differences for CDCA3 (P = 0.0000, P = 0.0001) and KIF18B (P = 0.004, P = 0.0006) in both cohorts (Fig. 7).
Fig. 6.
Kaplan–Meier analysis of the prognostic relevance of CDCA3 and KIF18B downstream predictors in a training dataset of 53 patients with HCC. In all, 143 genes were significantly differentially regulated with dependence on the overexpression of CDCA3, whereas 440 were dependent on KIF18B overexpression. Unsupervised clustering resulted in two different prognostic subgroups. Both (A) CDCA3- and (B) KIF18B-dependent predictors showed a significant difference (P = 0.04, 0.01)
Fig. 7.
Independent validation of the prognostic relevance of CDCA3 (A and C) and KIF18B (B and D) downstream predictors in HCC. Unsupervised clustering of two independent cohorts with 242 patients (A and B) and 81 patients (C and D) with HCC on the basis of these predictors resulted in two diverse prognostic subgroups
Finally, we tested our CDCA3 and KIF18B networks for association with prognosis in a meta-analysis of several other tumors using the Oncomine database (http://www.oncomine.org). Besides HCC, these genetic networks were found to be of prognostic relevance in diverse tumor entities, including breast and colon cancers (Supplementary Table S3).
4 DISCUSSION
4.1 Bioinformatics combination of guilt-by-profiling and GBA strategies
The availability of large microarray collections of tumor tissue without corresponding normal tissue serves as a rich source of information about carcinogenesis in general, which may not be achieved by conventional microarray analysis (http://expo.intgen.org/geo/home.do). To extract the key biological changes and functions of carcinogenesis, GBA strategies may provide valuable options for the analysis of data (Lee et al., 2004; Wolfe et al., 2005). GBA assumes that genes with related functions tend to share biological features, such as expression patterns (Oliver, 2000). Generally, on a lower scale, GBA is a concept used repeatedly in biology on a gene-by-gene basis.
Gene functions are frequently estimated and discovered using the analogy of other functionally well-characterized genes. On a genome-wide scale, several bioinformatics publications reported on efforts to improve the computational aspects of GBA approaches for predicting gene function (Hishigaki et al., 2001; Pena-Castillo et al., 2008; Tsuda et al., 2005; Wolfe et al., 2005). However, the number of biologically proven predictions based on high-throughput approaches is still small, and the promise of GBA as a general unbiased method for filling in unknown gene function has not come to fruition. With respect to cancer biology, only 34 publications are listed in PubMed (Sayers et al. 2012) when searching for ‘guilt by association’ and ‘cancer’. Furthermore, most of these publications addressed only methodical aspects of the procedure.
Applying a combined guilt-by-profiling and GBA bioinformatics strategy, we successfully analyzed the GSE2109 microarray repository providing data on 2158 microarray tumor samples (http://expo.intgen.org/geo/home.do) These data did not contain any corresponding normal tissue, which may be one of the major reasons why this dataset was not comprehensively investigated earlier in respect of differential gene expression or deregulated genetic clusters. However, as these data were all generated from the same consortium on the same technical platform, they seem ideal for a large-scale meta-analysis of gene expression in cancer.
By analyzing genes for co-regulation across a large collection of tumor samples instead of looking at the differences between tumor and corresponding normal tissue, we identified highly stable oncogenetic networks. We confirmed these findings by three different molecular and functional approaches: bioinformatics combination of guilt-by-profiling and GBA strategies, identification and molecular validation of novel oncogenes, identification of their downstream functional pathways and identification of novel signatures of prognostic relevance in HCC.
Overall, our work demonstrated the potential of integrating intelligent bioinformatics analyses and sophisticated molecular analyses as a highly valuable tool to obtain novel insights into tumor biology, diagnostics and eventually therapy (Fig. 1).
Besides, we were able to successfully validate the high coherence of a key regulatory network in carcinogenesis, not only in overall analysis but also in individual tissues such as liver, breast or colon cancer. This was of particular interest because averaging Pearson’s CC over a large number of arrays and diverse tissues may be limited by the drawback of the potentially high variability of gene expression correlation within these diverse tissues. We demonstrated two important aspects: given the stability of our cluster, this network may be regarded as a key regulator in carcinogenesis. Second, combining GBA studies with a subsequent analysis in a search of highly coherent subnetworks may yield much greater success in translating this sophisticated bioinformatics strategy into cancer biology and also enhance our understanding of many other diseases in the future.
4.2 CDCA3 and KIF18B, identified by bioinformatics GBA profiling, are key regulators of carcinogenesis by interfering with cell cycle regulation
It has become clear that not all genes differentially expressed in cancer are truly genes driving the neoplastic process (‘driver’ genes). It is therefore essential to distinguish these genes from sole bystander genes (‘passenger’ genes). One of the most effective strategies is to analyze their interference with well-established molecular changes in cancer biology. We therefore functionally characterized our genes identified through bioinformatics guilt-by-profiling. We provide several lines of evidence for the key carcinogenic role of these genes in many cancer entities, particularly with respect to cell cycle regulation.
Loss of cell-cycle checkpoints are a hallmark of human cancer because they result in permanent genomic alterations, such as deregulation of oncogenes and tumor suppressor genes (Laiho et al., 2003). Our data supported the interaction of both genes with cell cycle checkpoint-regulating genes and a severe disturbance of cell cycle regulation on overexpression of either one (CDCA3 or KIF18B), ultimately leading to tumor growth (Figs 5 and 6).
First, our large-scale bioinformatics pathway analysis demonstrated significant enrichment of cell cycle-coordinating genes due to overexpression of CDCA3 or KIF18B in the hepatoma cell line HUH7.
Second, qRT-PCR analysis confirmed the deregulation of multiple checkpoint kinases and central cell cycle regulation genes, thus validating the obtained microarray data. B-type cyclins, B1 and B2, essential components of the cell cycle regulatory machinery and both closely connected to G2/M progression, were found to be severely deregulated after overexpression of either CDCA3 or KIF18B. Deregulation of these genes and G2/M may have serious consequences on the cell, such as the development of cancer. This is particularly because, during this phase, cells may arrest transiently to allow for the repair of cellular damage. G1/S-phase-regulating genes were also significantly deregulated, further disrupting normal cell cycle control and enhancing tumor development. P21 deficiency was repeatedly shown to be closely linked to carcinogenesis (Garcia-Fernandez et al., 2011; Hawkes et al., 2011). CDK2 inhibition (by p21) has also been linked to liver cancer development (Kim et al., 2009). CDK4 complexes with cyclin D1 are involved in cell cycle control. Again, this complex may be inhibited by p21 and such deregulation is found in liver cancer (Rivadeneira et al., 2010). However, these changes may not only occur in liver cancer but also in many other tumors.
Third, these data were independently validated by performing an in vitro functional colony-forming assay, which also showed significantly greater development of colonies after overexpression of either CDCA3 or KIF18B.
Taken together, these data concerning interference with cell cycle regulation clearly provide a functional explanation for the driving role of carcinogenesis in several cancer types.
4.3 Prognostic relevance of KIF18B and CDCA3 target gene signatures
Gene expression signatures constitute a powerful achievement in the development of novel diagnostic tools, such as accurate and unbiased identification of prognostic subclasses and new cellular targets in liver cancer. The signatures must be robust to be useful in clinical therapeutic algorithms. However, the majority of the reported signatures were not confirmed in further independent datasets (Marquardt et al., 2012; Teufel et al., 2012). To demonstrate the predictive strength of our CDCA3 and KIF18B downstream predictors, we evaluated two additional independent datasets derived from 242 and 81 patients with HCC, and were able to prove their prognostic role in these independent test data (Figs 6 and 7).
Furthermore, as we had originally identified the two novel oncogenes and downstream signatures using a tumor-entity-independent/superordinate approach, we further validated our dependent signatures in several other cancer tissues, such as breast and colon cancer. Given the vigor of predictive significance in multiple tumors, we believe that this signature is robust in respect of essential regulation for HCC as well as cancer in general.
5 CONCLUSION
Bioinformatics integration of oncogenetic microarray meta-analysis, guilt-by-profiling and GBA strategies are a suitable approach for the identification of novel carcinogenic networks and oncogenes. Using this approach, we identified two novel oncogenes (CDCA3 and KIF18B), demonstrated their deregulation in multiple tumors, functionally characterized the novel oncogenes, identified corresponding downstream targets and showed the robust prognostic relevance of these downstream predictors for HCC as well as several other tumors.
Funding: TI, HB and AT were supported by the University Medical Center Mainz to establish a bioinformatics core facility. JUM is supported by a grant from the German Cancer Aid (110989). XWW was supported by a grant (Z01 BC 010313) from the Intramural Research Program of the Center for Cancer Research, National Cancer Institute (Bethesda, MD).
Conflict of interest: none declared.
Supplementary Material
REFERENCES
- Andersen JB, et al. Progenitor-derived hepatocellular carcinoma model in the rat. Hepatology. 2009;51:1401–1409. doi: 10.1002/hep.23488. [DOI] [PMC free article] [PubMed] [Google Scholar]
- Baehner FL, et al. Genomic signatures of cancer: basis for individualized risk assessment, selective staging and therapy. J. Surg. Oncol. 2011;103:563–573. doi: 10.1002/jso.21838. [DOI] [PubMed] [Google Scholar]
- Barrett T, et al. NCBI GEO: archive for functional genomics data sets—update. Nucleic Acids Res. 2013;41:D991–D995. doi: 10.1093/nar/gks1193. [DOI] [PMC free article] [PubMed] [Google Scholar]
- Becker KG, et al. PubMatrix: a tool for multiplex literature mining. BMC Bioinformatics. 2003;4:61. doi: 10.1186/1471-2105-4-61. [DOI] [PMC free article] [PubMed] [Google Scholar]
- Bucher N, Britten CD. G2 checkpoint abrogation and checkpoint kinase-1 targeting in the treatment of cancer. Br. J. Cancer. 2008;98:523–528. doi: 10.1038/sj.bjc.6604208. [DOI] [PMC free article] [PubMed] [Google Scholar]
- Cahanm P, et al. Meta-analysis of microarray results: challenges, opportunities, and recommendations for standardization. Gene. 2007;401:12–18. doi: 10.1016/j.gene.2007.06.016. [DOI] [PMC free article] [PubMed] [Google Scholar]
- Charrad M, et al. Proceedings of the Twenty-Third International Florida Artificial Intelligence Research Society Conference, 2010. 2010. On the Number of Clusters in Block Clustering Algorithms. [Google Scholar]
- Cheadle C, et al. Analysis of microarray data using Z score transformation. J. Mol. Diagn. 2003;5:73–81. doi: 10.1016/S1525-1578(10)60455-2. [DOI] [PMC free article] [PubMed] [Google Scholar]
- Date SV, et al. Discovery of uncharacterized cellular systems by genome-wide analysis of functional linkages. Nat. Biotechnol. 2003;21:1055–1062. doi: 10.1038/nbt861. [DOI] [PubMed] [Google Scholar]
- Davis S, et al. GEOquery: a bridge between the Gene Expression Omnibus (GEO) and BioConductor. Bioinformatics. 2007;23:1846–1847. doi: 10.1093/bioinformatics/btm254. [DOI] [PubMed] [Google Scholar]
- Eisen MB, et al. Cluster analysis and display of genome-wide expression patterns. Proc. Natl Acad. Sci. USA. 1998;95:14863–14868. doi: 10.1073/pnas.95.25.14863. [DOI] [PMC free article] [PubMed] [Google Scholar]
- Garcia-Fernandez RA, et al. Combined loss of p21(waf1/cip1) and p27(kip1) enhances tumorigenesis in mice. Lab. Invest. 2011;91:1634–1642. doi: 10.1038/labinvest.2011.133. [DOI] [PubMed] [Google Scholar]
- Hawkes WC, Alkan Z. Delayed cell cycle progression from SEPW1 depletion is p53- and p21-dependent in MCF-7 breast cancer cells. Biochem. Biophys. Res. Commun. 2011;413:36–40. doi: 10.1016/j.bbrc.2011.08.032. [DOI] [PubMed] [Google Scholar]
- Hughes TR, et al. Functional discovery via a compendium of expression profiles. Cell. 2000;102:109–126. doi: 10.1016/s0092-8674(00)00015-5. [DOI] [PubMed] [Google Scholar]
- Ioannidis JP. Expectations, validity, and reality in omics. J. Clin. Epidemiol. 2010;63:945–949. doi: 10.1016/j.jclinepi.2010.04.002. [DOI] [PubMed] [Google Scholar]
- Jemal A, et al. Cancer statistics. CA Cancer J. Clin. 2009;59:225–249. doi: 10.3322/caac.20006. [DOI] [PubMed] [Google Scholar]
- Jia L, et al. ROC1/RBX1 E3 ubiquitin ligase silencing suppresses tumor cell growth via sequential induction of G2-M arrest, apoptosis, and senescence. Cancer Res. 2009;69:4974–4982. doi: 10.1158/0008-5472.CAN-08-4671. [DOI] [PMC free article] [PubMed] [Google Scholar]
- Krupp M, et al. The functional cancer map: a systems-level synopsis of genetic deregulation in cancer. BMC Med. Genomics. 2011;4:53. doi: 10.1186/1755-8794-4-53. [DOI] [PMC free article] [PubMed] [Google Scholar]
- Laiho M, Latonen L. Cell cycle control, DNA damage checkpoints and cancer. Ann. Med. 2003;35:391–397. doi: 10.1080/07853890310014605. [DOI] [PubMed] [Google Scholar]
- Lee EY, Muller WJ. Oncogenes and Tumor Suppressor Genes. Cold Spring Harb Perspect Biol: 2010. 2: a003236, 2010. [DOI] [PMC free article] [PubMed] [Google Scholar]
- Lee HK, et al. Coexpression analysis of human genes across many microarray data sets. Genome Res. 2004;14:1085–1094. doi: 10.1101/gr.1910904. [DOI] [PMC free article] [PubMed] [Google Scholar]
- Hishigaki H, et al. Assessment of prediction accuracy of protein function from protein—protein interaction data. Yeast. 2001;18:523–531. doi: 10.1002/yea.706. [DOI] [PubMed] [Google Scholar]
- Kim JK, et al. Targeted disruption of S100P suppresses tumor cell growth by down-regulation of cyclin D1 and CDK2 in human hepatocellular carcinoma. Int. J. Oncol. 2009;35:1257–1264. [PubMed] [Google Scholar]
- Marquardt JU, et al. Molecular diagnosis and therapy of hepatocellular carcinoma (HCC): an emerging field for advanced technologies. J. Hepatol. 2012;56:267–275. doi: 10.1016/j.jhep.2011.07.007. [DOI] [PubMed] [Google Scholar]
- Oliver S. Guilt-by-association goes global. Nature. 2000;403:601–603. doi: 10.1038/35001165. [DOI] [PubMed] [Google Scholar]
- Parkinson H, et al. ArrayExpress update—an archive of microarray and high-throughput sequencing-based functional genomics experiments. Nucleic Acids Res. 2011;39:D1002–D1004. doi: 10.1093/nar/gkq1040. [DOI] [PMC free article] [PubMed] [Google Scholar]
- Pena-Castillo L, et al. A critical assessment of Mus musculus gene function prediction using integrated genomic evidence. Genome Biol. 2008;9(Suppl. 1):S2. doi: 10.1186/gb-2008-9-s1-s2. [DOI] [PMC free article] [PubMed] [Google Scholar]
- Rensen WM, et al. The GTPase Ran: regulation of cell life and potential roles in cell transformation. Front. Biosci. 2008;13:4097–4121. doi: 10.2741/2996. [DOI] [PubMed] [Google Scholar]
- Rivadeneira DB, et al. Proliferative suppression by CDK4/6 inhibition: complex function of the retinoblastoma pathway in liver tissue and hepatoma cells. Gastroenterology. 2010;138:1920–1930. doi: 10.1053/j.gastro.2010.01.007. [DOI] [PMC free article] [PubMed] [Google Scholar]
- Roessler S, et al. A unique metastasis gene signature enables prediction of tumor relapse in early-stage hepatocellular carcinoma patients. Cancer Res. 2010;70:10202–10212. doi: 10.1158/0008-5472.CAN-10-2607. [DOI] [PMC free article] [PubMed] [Google Scholar]
- Sherlock G, et al. The Stanford microarray database. Nucleic Acids Res. 2001;29:152–155. doi: 10.1093/nar/29.1.152. [DOI] [PMC free article] [PubMed] [Google Scholar]
- Sayers EW, et al. Database resources of the National Center for Biotechnology Information. Nucleic Acids Res. 2012;40:D13–D25. doi: 10.1093/nar/gkr1184. [DOI] [PMC free article] [PubMed] [Google Scholar]
- Sherr CJ. Cancer cell cycles. Science. 1996;274:1672–1677. doi: 10.1126/science.274.5293.1672. [DOI] [PubMed] [Google Scholar]
- Shimokawa K, et al. iCOD: an integrated clinical omics database based on the systems-pathology view of disease. BMC Genomics. 2010;11(Suppl. 4):S19. doi: 10.1186/1471-2164-11-S4-S19. [DOI] [PMC free article] [PubMed] [Google Scholar]
- Stolovitzky G. Gene selection in microarray data: the elephant, the blind men and our algorithms. Curr. Opin. Struct. Biol. 2003;13:370–376. doi: 10.1016/s0959-440x(03)00078-2. [DOI] [PubMed] [Google Scholar]
- Takeuchi M, et al. Anatomy of TRAF2. Distinct domains for nuclear factor-kappaB activation and association with tumor necrosis factor signaling proteins. J. Biol. Chem. 1996;271:19935–19942. doi: 10.1074/jbc.271.33.19935. [DOI] [PubMed] [Google Scholar]
- Teufel A, et al. Novel insights in the genetics of HCC recurrence and advances in transcriptomic data integration. J. Hepatol. 2012;56:279–281. doi: 10.1016/j.jhep.2011.05.035. [DOI] [PubMed] [Google Scholar]
- Tsuda K, et al. Fast protein classification with multiple networks. Bioinformatics. 2005;21(Suppl. 2):ii59–ii65. doi: 10.1093/bioinformatics/bti1110. [DOI] [PubMed] [Google Scholar]
- Wolfe CJ. Systematic survey reveals general applicability of “guilt-by-association” within gene coexpression networks. BMC Bioinformatics. 2005;6:227. doi: 10.1186/1471-2105-6-227. [DOI] [PMC free article] [PubMed] [Google Scholar]
- Wu LF, et al. Large-scale prediction of Saccharomyces cerevisiae gene function using overlapping transcriptional clusters. Nat. Genet. 2002;31:255–265. doi: 10.1038/ng906. [DOI] [PubMed] [Google Scholar]
Associated Data
This section collects any data citations, data availability statements, or supplementary materials included in this article.


