

Abstract
In this study, we numerically analyzed the nonlinear Ca2+-dependent gating dynamics of a single, nonconducting inositol 1,4,5-trisphosphate receptor (IP3R) channel, using an exact and fully stochastic simulation algorithm that includes channel gating, Ca2+ buffering, and Ca2+ diffusion. The IP3R is a ubiquitous intracellular Ca2+ release channel that plays an important role in the formation of complex spatiotemporal Ca2+ signals such as waves and oscillations. Dynamic subfemtoliter Ca2+ microdomains reveal low copy numbers of Ca2+ ions, buffer molecules, and IP3Rs, and stochastic fluctuations arising from molecular interactions and diffusion do not average out. In contrast to models treating calcium dynamics deterministically, the stochastic approach accounts for this molecular noise. We varied Ca2+ diffusion coefficients and buffer reaction rates to tune the autocorrelation properties of Ca2+ noise and found a distinct relation between the autocorrelation time τac, the mean channel open and close times, and the resulting IP3R open probability PO. We observed an increased PO for shorter noise autocorrelation times, caused by increasing channel open times and decreasing close times. In a pure diffusion model the effects become apparent at elevated calcium concentrations, e.g., at [Ca2+] = 25 μM, τac = 0.082 ms, the IP3R open probability increased by ≈20% and mean open times increased by ≈4 ms, compared to a zero noise model. We identified the inactivating Ca2+ binding site of IP3R subunits as the primarily noise-susceptible element of the De Young and Keizer model. Short Ca2+ noise autocorrelation times decrease the probability of Ca2+ association and consequently increase IP3R activity. These results suggest a functional role of local calcium noise properties on calcium-regulated target molecules such as the ubiquitous IP3R. This finding may stimulate novel experimental approaches analyzing the role of calcium noise properties on microdomain behavior.
Introduction
Ca2+ is a versatile second messenger, orchestrating a great variety of vital cellular functions such as cell motility (1), regulation of gene transcription (2), neurotransmitter release (3), and cytoskeleton dynamics (4). Its low intracellular resting concentration is maintained and tightly regulated by ion channels, ion pumps, and Ca2+ buffers (5). A central element of this regulation apparatus is the inositol 1,4,5-trisphosphate receptor (IP3R), a large homotetrameric Ca2+ release channel protein accounting for Ca2+ flux from intracellular stores (endo-/sarcoplasmic reticulum) into the cytosol. It is regulated by IP3, a second messenger produced by the membrane protein Phospholipase C, to transduce extracellular stimuli into intracellular Ca2+ signals. In addition to an IP3 binding site, each of the four channel subunits has two Ca2+ binding sites that are responsible for the characteristic bell-shaped calcium response curve of IP3R (6). While for low Ca2+ concentrations ([Ca2+]) the high-affinity activating Ca2+ binding site accounts for the positive feedback mechanism known as calcium-induced calcium release, the low-affinity inactivating Ca2+ binding site induces a negative feedback mechanism, inactivating the IP3 receptor at elevated [Ca2+] (7). IP3Rs are not uniformly distributed. They are organized in channel clusters, each including a few tens of IP3Rs and spaced 1–7 μm apart (8).
The synchronized openings of such clusters, carried by calcium-induced calcium release, are the foundation of experimentally observed elementary calcium release events called “calcium puffs” (9). Diffusion, the presence of Ca2+ pumps (e.g., SERCA), and Ca2+ buffers limit the spatiotemporal extent of these ECRE and control the coupling strength of adjacent IP3R clusters. This quantization of Ca2+ signals in dynamic microdomains is the basis of more complex spatiotemporal signaling patterns such as calcium oscillations and calcium waves (10). It also introduces stochasticity into the process of signal generation. Microdomains only contain a small copy number of Ca2+ ions and IP3Rs and therefore do not behave deterministically, which is reflected on a macroscopic level by spontaneous occurrences of Ca2+ puffs. It is now believed that global cellular Ca2+ signals are based on the stochastic occurrence of elementary calcium release events that, in turn, are carried by single channel noise (8,11–13).
These perceptions motivated the use of mathematical descriptions of Ca2+ signaling, which take into account the discrete and stochastic nature of molecular interactions (14,15). Consequently, a large number of simulation strategies for IP3R-containing calcium microdomains have been proposed over the last decade (16,17). The fully stochastic description of complex reaction-diffusion systems (RDS) is computationally demanding, and therefore most existing approaches implement hybrid algorithms. Hybrid algorithms are able to cover the hierarchical structure of calcium signals, spanning several orders of magnitude in space and time by treating functionally important nonlinear components such as the IP3R stochastically, whereas passive bulk reactions and diffusion are treated deterministically (11,18–20). Because noise-induced effects on nonlinear systems have received special attention over the last few years (21–26), we chose a fully stochastic framework to investigate the effects of Ca2+ noise, arising from buffer association/dissociation reactions and diffusion, on the nonlinear behavior of IP3Rs. Our model represents a Ca2+ microdomain with a single nonconducting IP3R, integrating channel gating and Ca2+ dynamics in a common stochastic simulation framework based on Gillespie’s algorithm. We started investigating the influence of pure diffusive Ca2+ noise on the nonlinear gating dynamics of the IP3R, and then extended the model by introducing artificial Ca2+ buffers. In summary, we found that IP3R gating is susceptible to Ca2+ noise in general, and to the Ca2+ noise autocorrelation time in particular.
Materials and Methods
Stochastic description of chemical reaction diffusion systems
An exact stochastic description of chemical systems is provided by the chemical master equation (CME) (27). The CME describes the evolution of a chemical reaction system, comprised of a set of N molecular species S = {S1,…,SN}, inside a system with volume Ω. The system state at time t is represented by the system state vector x(t) = (x1(t),…,xN(t)), where xk(t) denotes the molecular count of species Sk at time t. The system state is advanced by a set of M reaction events R = {R1,…,RM} that are defined as state change vectors vj = (dj1,…,djN), j = 1,…,M. Here dji represents the change in the molecular count of species Si due to Rj. The CME reads as
and states that the probability P(x,t) of the system being at state x at time t is calculated from the net probability flow from state x − vj to x, and vice versa. The propensity function aj(x,t) denotes the transition probability of Rj, given a system state x at time t. All these considerations are based on the basic assumption of a well-stirred chemical system, where nonreactive molecular collisions are far more likely than reactive events and exact positions, and velocities of single molecules are ignored (28).
It is possible to extend the CME to reaction diffusion systems by subdividing Ω into u smaller subvolumes (voxels) Ωk, k = 1,…,u. Subsequently, an additional spatial dimension is introduced into the CME, which leads to the reaction diffusion master equation (RDME) (29). This approach uses the classic CME in each voxel separately and connects the voxels by adding diffusion events to the set of state transitions R.
Gillespie’s algorithm
For complex chemical reaction diffusion systems, the RDME quickly becomes analytically intractable. Gillespie’s algorithm is a Monte Carlo procedure that simulates the time evolution of a system as a discrete multivariate Markov process (30). It is based on the joint probability density function
| (1) |
which determines the probability of state transition Rj to occur in the infinitesimal time interval [t + τ, t + τ + dτ), given system state x at time t. The propensity functions aj(x,t) can be obtained from the deterministic reaction rate constants. In this study, we use the following.
-
1.
First-order reactions. These are independent of the system volume Ω. Their propensity functions are directly proportional to the respective reaction rate constants aj(x,t) = kj × xj(t).
-
2.
Second-order reactions. They require molecular collisions of two educts, and therefore depend on Ω. We have aj(x,t) = kj/Ω × hj(x,t), where hj(x,t) denotes the number of unique reactant combinations at time t for Rj.
-
3.
Diffusion events. These are characterized by a diffusion coefficient D and depend on the spatial extent of the considered system. Assuming a cubic simulation voxel with volume Ω = l3 and diffusion area A = 6 × l2, the propensity function reads aj(x,t) = Dj/l2 × xj(t).
A rigorous derivation of these propensity functions has been presented by several authors before (31–33). One way of performing state transitions is the generation of exponentially distributed random waiting times τj for each Rj and executing the state transition with the minimum waiting time (first reaction method) (31). This requires the generation of M uniformly distributed random variables r1,…,rM and the computation of
| (2) |
Let Rk be the state transition with the smallest associated τk. The system time t is then advanced to t → t + τk and the system state is updated as x(t) → x(t) + vk. The resulting simulation trajectories are exact solutions of the underlying RDME.
Many improvements to the classic version of Gillespie’s algorithm have been proposed in the past (33). In this study, we use Gibson and Bruck’s next reaction method (34). Its main advantages are the reuse of random numbers and the introduction of an optimized data structure.
Calcium buffer reactions
Ca2+ ions interact with a great variety of cytosolic buffer proteins (35):
| (3) |
Buffer molecules are characterized by their rate constants for association (k+) and dissociation (k−) reactions. The implementation of Ca2+ buffers to Gillespie’s algorithm requires the definition of a second-order reaction for buffer association and a first-order reaction for the dissociation reaction. A summary of numerical values is given in Table 1.
Table 1.
Model data
| Reactant | K+ (μM−1 ms−1) | k− (ms−1) | Kd (μM) | D (μm2/s) | c (μM) |
|---|---|---|---|---|---|
| Ca2+ | — | — | — | 50–500 | 0.1–500 |
| IP3 | — | — | — | 0 | 10 |
| B1 | 0.01 | 0.1 | 10 | 0 | 300 |
| B2 | 0.05 | 0.5 | 10 | 0 | 300 |
| B3 | 0.1 | 1 | 10 | 0 | 300 |
| Channel kinetics | Association (μM−1 ms−1) | Dissociation (ms−1) |
|---|---|---|
| IP3 binding site | a1,a3 = 0.08 | b1 = 6.4 × 10⁻⁴ |
| b3 = 0.04 | ||
| Active Ca2+ binding site | a5 = 0.015 | b5 = 0.012 |
| a2 = 4 × 10⁻⁵ | b2 = 4.8 × 10⁻⁴ | |
| Inactive Ca2+ binding site | a4 = 4 × 10⁻⁴ | b4 = 7.68 × 10⁻⁵ |
| Subunit activation | a0 = 0.55 ms−1 | b0 = 0.08 |
Overview of system parameters used. We use IP3R subunit transition rates as suggested by Rüdiger et al. (19) that were obtained from fitting experimental data from Mak et al. (7). The value k+ is the buffer association reaction rate constant, k− is the buffer dissociation reaction rate constant, and Kd is the respective buffer dissociation constant. D is the diffusion coefficient, and c is the concentration of the respective substance. Subunit state transition rates ai,bj refer to the De Young-Keizer model detailed in Fig. 1.
Model geometry and diffusion
In this study, we consider a model consisting of a single simulation voxel surrounded by equilibrated boundary voxels, to account for diffusive transfer across the surface area as illustrated in Fig. 1 A. Inside the boundary voxels, we set all concentrations to their constant equilibrium concentrations and thus obtain a constant influx rate of diffusing molecular species (36). Introducing diffusion events considerably increases computation times. In this study, we only consider stationary Ca2+ buffers, limiting diffusion processes to Ca2+ ions. In all simulations, a cubic voxel geometry with box length l = 0.5 μm and thus Ω = 0.125 fL is used.
Figure 1.
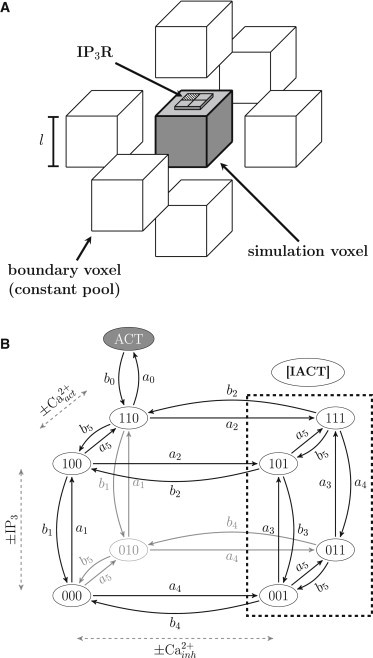
(A) Schematic illustration of the model geometry (shaded box in the center). Main simulation voxel, including a single IP3R on top. Surrounding blank boxes represent the constant pool boundary voxel used in spatially resolved models. (B) De Young and Keizer state transition model of an IP3R subunit (37) with an additional, ligand-independent [ACT] state (38). Four homotetrameric subunits form the channel protein that is in an open state whenever ≥3 subunits are active. A subunit exhibits three binding sites, represented by the numeration of the states. First digit, activating IP3R binding site; second digit, activating Ca2+ binding site; third digit, inactivating Ca2+ binding site. Subunit states with an occupied inactivating Ca2+ binding site are summarized as inactive states ([IACT]) (dashed box). State transition rates are shown in Table 1 (19).
Implementation of the IP3R
A widely used gating scheme for the IP3Rs is given by the eight-state subunit transition model proposed by De Young and Keizer in 1992 (37). It has been further refined by Shuai et al. (38), who introduced an additional active state that locks the subunits and prevents the dissociation of its ligands, reproducing experimentally observed ligand-independent channel flickering (39). Fig. 1 B illustrates the model with rate constants as proposed by Rüdiger et al. (19), shown in Table 1. Subunit state transition rates used in their study were obtained by fitting data from single channel recordings from Mak et al. (7) and are thus a solid foundation for the here presented simulations of an IP3R. The three binding sites exposed by each subunit are represented by the numeration of the states where the first digit represents the IP3 binding site, the second digit the activating Ca2+, and the third digit the inactivating binding site. A value of 0 indicates a free binding site, whereas 1 represents an occupied binding site. The channel is considered to be in an open state whenever at least three subunits are in the active state [ACT]. If more than one IP3R subunit has an occupied inactivating binding site ([IACT]), the channel is unable to open and thus considered to be completely inactivated.
In our implementation of Gillespie’s algorithm, we consider each subunit state as a distinct molecular species. State transitions are implemented as second-order ligand binding reactions and first-order ligand dissociation reactions. The open channel is included as a further molecular species whereby its count is increased by 1 whenever at least three out of four subunits are active. Within this framework, the implementation of clusters of IP3R channels as well as Ca2+-conducting channels is straightforward. In this study, we only consider a single, nonconducting IP3R, in analogy to experimental results from lipid bilayer studies (7).
As discussed earlier, simulation trajectories resulting from the here-used algorithm are exact. They are unevenly spaced time series of the system state, whereat each data point represents the system state after a single system state transition. It is therefore possible to track the exact points in time when the IP3R opens or closes and the determination of channel open/close times is straightforward. Because no event is missed, the resulting statistical analysis of channel open/close times does not require correction.
Characteristics of Ca2+ noise
All systems considered here obey combinatorial kinetics and, in the absence of channel flux, a constant detailed balanced equilibrium condition. The resulting Ca2+ noise distributions at equilibrium are therefore Poissonian (40) and for sufficiently large [Ca2+], they are well approximated by a normally distributed random variable (μ,σ2) with μ = σ2. In these cases, noise intensities at equilibrium depend solely on the mean [Ca2+], and are independent from kinetic system properties. The resulting Ca2+ signal is stationary and ergodic (41). In this study, we focus on the temporal characteristics of Ca2+ noise, in particular on the two-time autocorrelation function, which reveals information about properties of the underlying microscopic processes (42,43). By varying buffer reaction rates and diffusion coefficients, it is possible to tune the Ca2+ noise autocorrelation time (41). The autocorrelation function is well approximated by an exponentially decaying function (29,43,44) characterized by its decay rate τac, which we will refer to as the “autocorrelation time” (Fig. 2). For a detailed theoretical analysis of the origins of Ca2+ fluctuations, the reader is referred to this recent publication (41).
Figure 2.
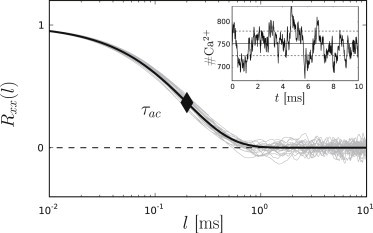
Estimated autocorrelation time of a plain diffusion system with DCa = 200 μm2 s−1 and [Ca2+] = 10 μM. Semilogarithmic representation of 20 exemplary autocorrelation functions Rxx(l) (shaded curves) with exponential fit (solid curve) and a resulting autocorrelation time of τac = 0.207 ms (solid diamond). On the right, a representative simulation trajectory of purely diffusive Ca2+ noise with mean (solid line) and standard deviation (dashed lines) is shown (T = 10 ms).
Computation times
Simulations presented in this study were carried out on an Intel Core 2 Quad CPU Q9550 @ 2.83 GHz (Santa Clara, CA) and a cache size of 6144 Kb. Fig. 3 is based on data from simulation runs of at least 1.5 × 10³ s for [Ca2+] = 0.1–50 μM and at least 5 × 10² s for [Ca2+] = 100–500 μM. Simulation times ranged from ∼72 s to 6.5 × 10⁵ s. RDS data presented in Figs. 4 and 5 result from simulation runs of at least 1 × 10³ s. Here, simulation times ranged from ∼ to 4.5 × 10⁴ s.
Figure 3.
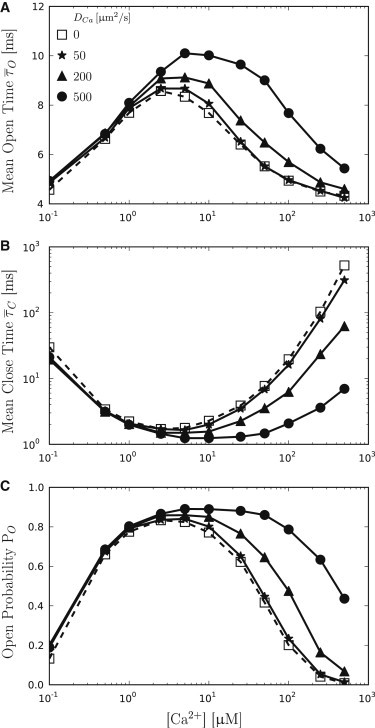
Summary of gating properties of the IP3R for varying diffusion coefficients DCa. Open squares (dashed curve) are the result of zero noise models and represent the results expected from algorithms that treat Ca2+ dynamics deterministically. (Solid curves) Results for three different diffusion coefficients DCa = 50 μm2 s−1 (stars), 200 μm2 s−1 (triangles) and 500 μm2 s−1 (circles). For low [Ca2+], Ca2+ noise has no obvious influence on the IP3R. Starting at [Ca2+] = 1 μM, (A) mean open times increase with increasing DCa, whereas (B) mean close times decrease. (C) Consequently, the channel open probability PO increases with increasing DCa.
Figure 4.

Summary of the relationship between IP3R gating and τac of Ca2+ noise at [Ca2+] = 10 μM. In addition to purely diffusive models (circles), results from a RDS with DCa = 200 μm2 s−1, including a single buffer with Kd = 10 μM and varying association reaction rates k+ (see Table 1), are shown (stars). The zero noise model is included at an arbitrary x-intercept and represents a model with infinite τac (open square). Mean open times (A), mean close times (B), and open probabilities PO (C) are shown as a function of τac.
Figure 5.
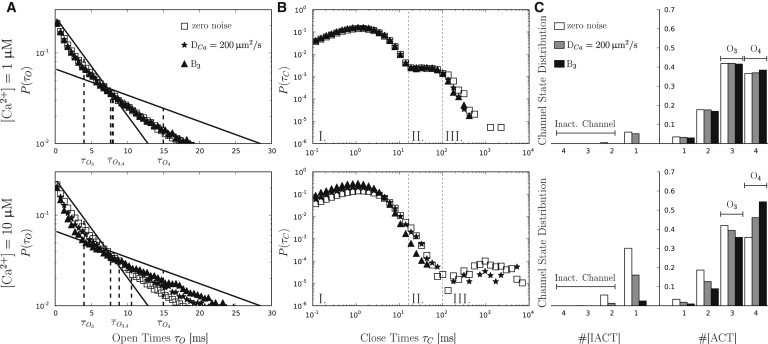
Open time distributions (left column), close time distributions (middle column) and subunit distributions (right column) at [Ca2+] = 1 μM (upper row) and at [Ca2+] = 10 μM (lower row). Results are shown for a zero noise model (open squares, open bar), pure diffusive noise with DCa = 200 μm2 s−1 (stars, shaded bar) and noise arising from a RDS including B3 (k+ = 0.1 μM−1 ms−1, k+ = 1 ms−1) and diffusion with DCa = 200 μm2 s−1 (triangles, solid bar). (A) Expected open time distributions for O3 and O4 openings (solid lines) and the resulting biexponential open time distribution. (Dashed lines) Mean open times. (B) Within the close time distributions, we identify three distribution regions: Region I, channel closings resulting from channel flickering; Region II, channel closings resulting from a superposition of close states where the channel is not inactivated; and Region III, long close intervals resulting from channel inactivation. (C) Channel state distributions in terms of activated ([ACT]) and inactivated ([IACT]) subunits.
Results
To study the noise susceptibility of a single, nonconducting IP3R, we chose a saturating IP3 concentration ([IP3]sat = 10 μM). In a first step, we used purely diffusive Ca2+ noise with varying diffusion coefficients to examine its influence on IP3R gating dynamics over a range of [Ca2+] = 0.1–500 μM. Consequently, we extended the system by introducing Ca2+ buffers and examined their additional influence on the IP3R. In contrast to pure diffusion models that reveal constant Ca2+ noise τac for different [Ca2+], the influence of a Ca2+ buffer on Ca2+ noise depends on its saturation level. With increasing buffer saturation, its influence decreases and noise characteristics are dominated by the remaining dynamic processes such as diffusion. Due to computational feasibility, the total buffer concentration [B]tot is limited in our models. To avoid buffer saturation phenomena, we therefore focused on a fixed [Ca2+] = 10 μM and a Ca2+ buffer with dissociation constant Kd = 10 μM and constant [B]tot = 300 μM. The choice of these model parameters reflects a compromise between a realistic Ca2+ buffer dissociation constant and an acceptable level of buffer saturation (50%). To vary temporal characteristics of Ca2+ noise, different on/off reaction rates have been used (see Table 1). All RDS models of the second part use a Ca2+ diffusion coefficient of DCa = 200 μm2 s−1.
The case of multibuffer systems can be effectively reduced to a single buffer system with a compound τac (45). Temporal Ca2+ noise characteristics are dominated by the fastest present dynamic process involving Ca2+. This means that a multibuffer system induces Ca2+ noise τac comparable to a single buffer system, which only contains the fastest buffer (as long as the buffer is far from saturated).
IP3R gating dynamics in a pure diffusion model
To investigate the noise susceptibility of the IP3R, we used three different Ca2+ diffusion coefficients (DCa = 50 μm2 s−1, 200 μm2 s−1, and 500 μm2 s−1) to introduce Ca2+ noise to the system. Channel dynamics are evaluated in terms of the mean open times , mean close times , and open probabilities PO, for varying [Ca2+] = 0.1–500 μM. We included results from a zero noise model in order to compare with earlier results from hybrid models. The mean open/close times and open probabilities of the zero noise model are in good accordance with results from hybrid algorithms used by Shuai et al. (38) and Rüdiger et al. (19).
Fig. 3 summarizes the results and clearly shows that IP3R gating dynamics are affected by Ca2+ noise. Ca2+ diffusion is modeled as a random walk between adjacent voxels (32) with a rate constant derived from the voxel geometry and the diffusion coefficient DCa. The corresponding τac is equal to the inverse of the diffusion rate; therefore, increasing DCa leads to decreasing τac (41). We found the estimated τac from our simulations to be in good accordance with the expected values, as given in parentheses: For DCa = 50 μm2 s−1, we found an autocorrelation time of = 0.820 ± 0.084 ms (0.833 ms); for DCa = 200 μm2 s−1, we found = 0.204 ± 0.021 ms (0.208 ms); and for DCa = 500 μm2 s−1, we found = 0.082 ± 0.0085 ms (0.083 ms).
Because the noise variance is constant for fixed [Ca2+], noise-induced effects can be attributed to as the autocorrelation time of Ca2+ noise. Fig. 3 A shows that increases for decreasing τac. Ca2+ diffusion with DCa = 500 μm2 s−1 shows a maximum of = 10.07 ms ([Ca2+] = 5 μM) compared to the zero noise model with a maximum of = 8.56 ms ([Ca2+] = 2.5 μM). Furthermore, short τac values are associated with a delay of the negative Ca2+ feedback, and remains on a high level, even for large [Ca2+]. This effect is also shown in Fig. 3 B, where long intervals, resulting from Ca2+-dependent subunit inactivation, only appear at much larger [Ca2+] values as expected from the zero noise model. Fig. 3 C shows how the open probability PO increases accordingly. While the zero noise model reveals a maximum PO = 84% ([Ca2+] = 2.5 μM), the fast diffusion model shows a maximum of PO = 89% ([Ca] = 10 μM). Open probabilities remained high even for large [Ca2+] when diffusive noise is considered.
IP3R gating dynamics in the vicinity of Ca2+ buffer
Introduction of Ca2+ buffer
To investigate the additional impact of Ca2+ buffers on Ca2+ noise and IP3R gating, we simulated a RDS with a standard value of DCa = 200 μm2 s−1 (46) and an immobile Ca2+ buffer with Kd = 10 μM. From Fig. 3, the clearest effects of Ca2+ noise on the IP3R are expected for high [Ca2+]. However, to avoid buffer saturation phenomena, we kept the [Ca2+] equilibrium concentration at [Ca2+]eq = Kd = 10 μM. We obtained different τac values by varying the buffer association rate k+, keeping Kd constant. We used three different Ca2+ buffers B1–B3 (see Table 1 for numerical values) and found the corresponding Ca2+ noise τac to be as follows: = 0.153 ± 0.035 ms, = 0.087 ± 0.027 ms, and = 0.058 ± 0.012 ms.
In Fig. 4, mean channel open times , mean channel close times , and channel open probability PO are shown as a function of Ca2+ noise τac. In addition to the RDS models, we included the results from Fig. 3 to show that the impact on IP3R gating is independent of the underlying noise generating mechanism. The zero noise model is included at an arbitrary x-intercept to represent a model with infinite τac.
We found a dependency of , , and PO on Ca2+ noise τac. The decreasing τac induced by Ca2+ buffers and diffusion leads to an increase in and PO, and to a decreasing . It is also observed that slow Ca2+ diffusion (DCa = 50 μm2 s−1) inducing relatively long Ca2+ noise τac values has only very small effect on the IP3R (see also Fig. 3).
Detailed channel gating analysis
Because the IP3R opens whenever at least three out of four subunits are in the [ACT] state (see Fig. 1), it has two distinct open states. They can be distinguished by the maximum number of active subunits during an open interval, and are termed O3 and O4 (38). Data from patch-clamp experiments (47) and deterministic analysis of the IP3R model (38) both reveal independent, exponential open time distributions for each open state. Our simulations reveal the same behavior, and we found dwell times for the O3 and O4 states that are in good accordance with previously published data (38), ≈ 4 ms and ≈ 15 ms. In contrast to only two open states, many more distinct close states exist (94–2). Mean close time distributions therefore show a more complex, multiexponential behavior. Nevertheless, it is possible to distinguish two major types of channel closings: 1) short close intervals, resulting from the ligand-independent inactivation of a single active subunit that underlies the typical channel flickering and 2) long close intervals that occur whenever Ca2+ binds to an inactivating binding site, accounting for the strong negative feedback at high [Ca2+].
While short closings only last for a few milliseconds, long close intervals can last up to seconds, and account for the burstlike opening pattern of IP3Rs.
Fig. 5 shows a detailed channel gating analysis of three different models: a zero noise model, a purely diffusive noise model (DCa = 200 μm2 s−1), and an RDS model including the buffer B3 (k+ = 0.1 μM−1 ms−1, k− = 1 ms−1), as well as Ca2+ diffusion (DCa = 200 μm2 s−1). The upper row shows results from models with [Ca2+] = 1 μM; the lower row shows results from models with [Ca2+] = 10 μM.
Open/close time distributions
Open time distributions are shown in the left column of Fig. 5. The biexponential decay results from the superposition of the open time distributions of O3 and O4 states (solid lines). Vertical dashed lines indicate the value of the respective distribution. While the open time distribution for [Ca2+] = 1 μM is unaffected by noise, we find a clear effect for [Ca2+] = 10 μM. A decreasing Ca2+ noise τac induces a shift of the open time distributions toward the expected distribution for isolated O4 openings. Mean open times increase accordingly from 7.68 to 10.59 ms.
The middle column depicts the corresponding close time distributions. Based on theoretical mean waiting times resulting from subunit transition rates, we subdivided the distributions roughly into three regions.
Region I. This distribution shows short channel closings, resulting from subunit transitions from [110] → [ACT] (channel flickering). This ligand-independent transition reveals a theoretical mean waiting time of = 0.090 ms.
Region II. This distribution is a superposition of close channel states with less than two inactivated subunits.
Region III. This distribution shows channel close states resulting from complete channel inactivation with more than one inactivated subunit. Assuming the IP3R to be saturated with IP3, the dissociation of Ca2+ from an inactivating Ca2+ binding site ([1x1] → [1x0]) reveals a theoretical mean waiting time = 2083.3 ms. The shape of the distribution changes from [Ca2+] = 1 μM to [Ca2+] = 10 μM, where especially the fraction of prolonged close times increase for higher [Ca2+]. This is mainly caused by increasing subunit inactivation, i.e., negative Ca2+ feedback. Again, noise only influences the close time distribution at [Ca2+] = 10 μM. The zero noise model shows a well-defined second peak in Region III, which slowly vanishes for decreasing τac. Remarkably, the IP3R does not completely inactivate at small τac (triangles) values, explaining the large mean channel open times in Fig. 3. Consequently, mean channel close times decrease with decreasing τac from 2.28 to 1.14 ms (Fig. 4 B).
Channel state distribution
The right column of Fig. 5 shows the channel state distribution as histograms. Because the IP3R consists of four subunits with nine different subunit states each, the resulting total number of possible channel states is 94 = 6561. Here, we simplify the situation by defining a state solely by its number of active ([ACT]) or inactive ([IACT]) subunits (see Fig. 1). The right side of Fig. 5 C shows the channel state distribution in terms of the number of [ACT] subunits, the left side in terms of the number of [IACT] subunits. For [Ca2+] = 1 μM, the average number of [ACT] states are insusceptible to noise and average numbers of [IACT] differ only slightly. Invariant open time distributions go along with a nearly constant ratio of O3/O4 openings (≈1.14).
It is also observed that complete channel inactivation ([IACT] > 1) occurs very rarely, leading to invariant close time distributions. In contrast, the histogram for Ca2+ = 10 μM shows a strong, τac-dependent deviation from this pattern. The O3/O4 ratio varies considerably ranging from 0.67 in RDS models to 1.17 in zero noise models, explaining the skewed open time distributions. With increasing [Ca2+], subunit inactivation becomes more likely and we find an increased fraction of inactivated channel states ([IACT] > 1). However, noise also influences channel inactivation. While the zero noise model reveals a fraction of 5% inactivated channels, this value decreases to 1.5% for the purely diffusive noise model, and vanishes for the RDS model. The channel state distribution explains the vanishing peak in Region III of the close time distribution for decreasing Ca2+ noise τac.
In summary, we can explain the initially observed, noise-induced alteration of mean channel open times , mean channel close times , and open probabilities PO with a shift in the channel state distribution away from inactivated states and toward the O4 open states.
Discussion
Our motivation to study the influence of Ca2+ noise on the IP3R arose from the contemporary interest in the stochastic nature of complex Ca2+ signals (11,20,26,41). Just recently, Thurley et al. (13) showed that stimulus intensities of input signals are reliably encoded in stochastic sequences of random spikes, and the body of literature, emphasizing the functional relevance of noise in biological systems, is constantly growing (24,48–52).
The exact stochastic description of chemical RDS is universal and therefore, models of arbitrary complexity can be implemented in a consistent framework. However, running the model can be computationally demanding and in practice, the spatio-temporal dimensions of realistic models are limited. An alternative modeling strategy is represented by hybrid algorithms that treat nonlinear system components stochastically and bulk reactions deterministically (11,19,38,53–55). In terms of Ca2+ signaling, hybrid approaches explicitly ignore Ca2+ noise.
As noise-induced effects on nonlinear systems have received much interest over the past years (21,56), we designed a reduced, computationally feasible, fully stochastic model of a Ca2+ microdomain, to investigate the influence of Ca2+ noise on IP3R gating dynamics.
We observed that the Ca2+ noise autocorrelation time τac has a significant effect on mean open times, mean close times, and the open probability of the IP3R (see Fig. 4). As shown in Fig. 3, the effect becomes apparent for [Ca2+] > 1 μM and mainly affects channel inactivation. This is confirmed in Fig. 5, where open and close time distributions are noise-invariant for [Ca2+] = 1 μM, whereas the distributions are clearly skewed for [Ca2+] = 10 μM. The corresponding channel state histograms emphasize that decreasing τac induces a shift in the channel state distribution from [IACT] toward [ACT], decreasing channel inactivation and stabilizing channel open states. Our data shows that Ca2+ noise reduces the probability for subunit inactivation, which in turn increases the number of [ACT] subunit states and consequently the number of O4 openings. At [Ca2+] = 10 μM, for example, the proportion of inactivating subunit state transitions was ≈0.35% for the zero noise model, ≈0.18% for the pure diffusive model, and ≈0.07% for the RDS model. Subunit inactivations are rare events compared to channel openings, but with a strong impact on the IP3R channel state distribution. A single inactivated subunit prevents O4 openings for a duration up to seconds, and two inactive subunits prevent the IP3R completely from opening. Therefore, minimal changes in the channel inactivation probability lead to significant changes of mean channel open/close times and open probabilities.
Both the functionally important association of Ca2+ to the activating binding site and the inactivating binding site are second-order reactions. The influence of fluctuations in the educt species of simple second-order reactions has been studied analytically by Morita (57) and Katsumoto and Morita (58) in closed systems. They showed in their work that fluctuations not only alter equilibrium concentrations but also influence the dynamics of the reaction. The here used gating scheme of IP3R subunits consists of eight interconnected, Ca2+-dependent second-order reactions and exponentially correlated Ca2+ noise (compared to uncorrelated noise in Morita and Katsumo’s work). The situation here is therefore much more complex, and a rigorous physical explanation for the observed effects would require an analytically solution of the proposed model. But an analytical solution is, to the best of our knowledge, not available at the moment. We can therefore only hypothesize about the origin of the noise-induced delay of subunit inactivation. Fig. 6 shows the distributions of the most frequent subunit states ([ACT], [IACT], [110]) as a function of [Ca2+], whereby the shaded curve represents the zero noise model and the solid curve a purely diffusive model (DCa = 200 μm2 s−1).
Figure 6.
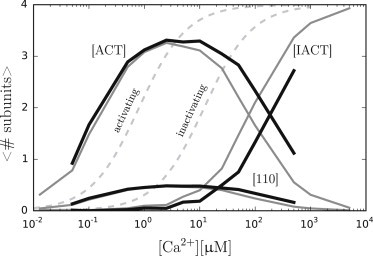
Subunit distribution of the three most frequent subunit states [ACT], [IACT], and [110] are shown as a function of [Ca2+]. The distributions of the zero noise model (shaded curve) and a pure diffusion model with DCa = 200 μm2 s−1 (solid curve) are shown. As a reference, isolated binding curves of the activating and inactivating binding site are shown (light-shaded dashed curves). Note that due to crucially shorter computation times, data of the zero noise model is available for a greater range of [Ca2+] than for the diffusive model.
It becomes clear that subunit activation and inactivation does not follow the binding curves expected from the rate constants of the respective binding sites. This shift can be attributed to the ligand-independent subunit activation transition that locks [110] subunits with a high rate. The binding curve of the activating binding site is therefore shifted to lower [Ca2+], while the binding curve for the inactivating binding site is shifted to higher [Ca2+]. This effect explains the late inactivation of channel subunits, even for the zero noise model. Ca2+ noise, here introduced by diffusion, clearly shifts the binding curve of the inactivating site further to higher [Ca2+], while leaving the binding curve of the activating binding site mainly unaffected. There are three main differences between the two Ca2+ binding sites that could serve as an explanation for this behavior: 1) the activating binding site has a much higher association rate than the inactivating binding site; 2) the dissociation constants of the two binding sites differ by a factor of 10; and 3) the lockable subunit [110] is a product of subunit activation, while it is an educt for subunit inactivation.
The consequent examination of the influence of these differences on the noise susceptibility of IP3Rs would go beyond the scope of this study. However, future investigations should be directed toward this problem to gain a deeper understanding of the effect of Ca2+ noise on the nonlinear dynamics of the De Young and Keizer subunit transition model for IP3Rs.
The biphasic Ca2+ feedback of the IP3R is the functional basis of Ca2+ waves and oscillations (59). Noise-induced delay of negative Ca2+ feedback therefore affects the fundamental mechanism of spatiotemporal Ca2+ signal formation. We showed that not only diffusion, but also the presence of Ca2+ buffers shape the temporal properties of Ca2+ fluctuations and consequently IP3R gating. The influence of Ca2+ buffers on Ca2+ signaling has previously been studied, both theoretically (54,60–62) and experimentally (63–66). These studies mainly focused on the influence of mobile and immobile buffers on global Ca2+ signals, whereas only a very few studies are concerned with the functional role of buffer-dependent Ca2+ fluctuations (26). The expression profiles for Ca2+ buffers with widely differing kinetic properties are highly variable among different cell types (35,46).
There is a large number of naturally occurring Ca2+ buffers and their dissociation constants range from only a few nM (e.g., α-Parvalbumin, Kd = 4–9 nM (35)) to up to tens of μM (e.g., α-Secretagogin, Kd = 25 μM (67)). Furthermore, there are slow (e.g., α-Parvalbumin, k+ = 1 × 10⁻³ μM−1 ms−1) and fast Ca2+ buffers (e.g., Calbindin-D9k, k+ = 1 μM−1 ms−1), as characterized by their Ca2+ association rates k+. Specific buffer expression profiles may therefore constitute a powerful tool that allows the cell to influence Ca2+ signaling on different levels, ranging from the modulation of stochastic Ca2+ fluctuations up to the spatiotemporal modulation of ECRE, waves, and oscillations. Another thought should be dedicated to the fact that most experimental settings include artificial Ca2+ buffers, either to control [Ca2+] or in the form of fluorescent Ca2+ dyes. The range of physico-chemical properties of artificial Ca2+ buffers adds to the complexity of the problem (68). As we have shown in this study, artificial Ca2+ buffers may significantly alter the properties of calcium noise and possibly, the behavior of the observed calcium microdomain.
So far, we have only investigated the noise susceptibility of the IP3R in silico. We used the nine-state De Young-Keizer subunit state transition model as proposed by Shuai et al. (38) with parameters from Rüdiger et al. (19). In accordance with structural and mutational studies (69), the model assumes that the IP3R consists of four identical subunits with an IP3-binding site, an activating Ca2+ binding site and an inactivating Ca2+ binding site (70). The originally proposed eight-state De Young-Keizer model (37) was extended by a ligand-independent [ACT] state in order to account for experimental observations including channel flickering (39) and calcium-independence of the activated open state (38,71). Following other studies showing the functional relevance of noise experimentally (20,72–74), our findings await experimental verification.
For instance, an IP3R channel incorporated into a lipid bilayer could be exposed to a defined calcium microenvironment. This setting should allow for the observation of IP3R gating in a controlled Ca2+-buffer system. Statistical properties of Ca2+ noise and the corresponding two-time correlation function in particular could be measured with fluorescence correlation spectroscopy (75). This approach would allow to investigate experimentally the influence of both natural Ca2+ buffers and widely used fluorescence dyes on Ca2+ fluctuations and IP3R gating. A further interesting focus for future investigations is the noise susceptibility of the ryanodine receptor, structurally closely related to the IP3R and representing the main Ca2+ release channel in cardiac and striated muscle cells (76). Due to a similar biphasic Ca2+ dependency, a similar influence of stochastic Ca2+ fluctuations on the gating behavior of the ryanodine receptor is expected (77).
To understand our findings in the global context of Ca2+ signaling, it is necessary to extend our models to clusters of IP3R channels, and beyond. Furthermore, it is necessary to consider Ca2+ flux through the channel pore, because it has been shown that the magnitude of Ca2+ fluctuations reveals a dependency on total buffer concentration and buffer kinetics in systems with constant Ca2+ influx (41). Because our model and software framework are capable of simulating both channel clusters and Ca2+ flux, the investigation of more complex models will be the subject of future investigations (14,15,17,36).
The spatial extent of our models is so far also limited by computational feasibility. A more efficient strategy would be the approximation of the CME by a Fokker-Planck equation or a chemical Langevin equation (78) but there are limitations to find a satisfactory approximation, namely the existence of a macroscopically infinitesimal time domain (79). An adequate approximation requires the existence of a time interval during which changes in the propensity functions are negligibly small, whereas each state transition is expected to occur sufficiently frequently (n ≫ 1). Given the model parameters used in this study, this condition is not met, mainly due to the large timescale of IP3R subunit state transitions and the low copy number of both Ca2+ ions and IP3Rs. The rarely occurring and functionally essential Ca2+-dependent channel inactivation constitutes the limiting factor.
Ca2+ microdomains are a fundamental entity of Ca2+-mediated cell functions (80). Morphologically predetermined structures, such as neuronal dendritic spines or the dyadic cleft of cardiac myocytes, are prominent examples for their vital roles in learning, memory (81), and heart-beat generation (82). Even though some recent work about stochastic fluctuations in the dyadic cleft exists (26), the question how such fluctuations influence the Ca2+ signaling apparatus as a whole, remains unanswered.
Beyond the scope of Ca2+ signaling, our work illustrates the important role of mesoscopic chemical noise for intracellular signaling networks. Nonlinearities such as allosteric regulation, positive and negative feedback mechanisms, and covalent modifications are ubiquitous and low-copy numbers of key molecules appear frequently. In these situations it is necessary to recognize noise as an active element within biological signaling networks.
References
- 1.Wei C., Wang X., Cheng H. Calcium gradients underlying cell migration. Curr. Opin. Cell Biol. 2012;24:254–261. doi: 10.1016/j.ceb.2011.12.002. [DOI] [PubMed] [Google Scholar]
- 2.Dolmetsch R.E., Xu K., Lewis R.S. Calcium oscillations increase the efficiency and specificity of gene expression. Nature. 1998;392:933–936. doi: 10.1038/31960. [DOI] [PubMed] [Google Scholar]
- 3.Südhof T.C. Calcium control of neurotransmitter release. Cold Spring Harb. Perspect. Biol. 2012;4:a011353. doi: 10.1101/cshperspect.a011353. [DOI] [PMC free article] [PubMed] [Google Scholar]
- 4.Greka A., Mundel P. Vol. 32. Elsevier; New York: 2012. Calcium regulates podocyte actin dynamics; pp. 319–326. (Seminars in Nephrology). [DOI] [PMC free article] [PubMed] [Google Scholar]
- 5.Berridge M.J., Bootman M.D., Roderick H.L. Calcium signaling: dynamics, homeostasis and remodeling. Nat. Rev. Mol. Cell Biol. 2003;4:517–529. doi: 10.1038/nrm1155. [DOI] [PubMed] [Google Scholar]
- 6.Bezprozvanny l., Watras J., Ehrlich B.E. Bell-shaped calcium-response curves of lnsl,4,5P3- and calcium-gated channels from endoplasmic reticulum of cerebellum. Nature. 1991;351:751–754. doi: 10.1038/351751a0. [DOI] [PubMed] [Google Scholar]
- 7.Mak D.O., McBride S., Foskett J.K. Inositol 1,4,5-trisphosphate [correction of tris-phosphate] activation of inositol trisphosphate [correction of tris-phosphate] receptor Ca2+ channel by ligand tuning of Ca2+ inhibition. Proc. Natl. Acad. Sci. USA. 1998;95:15821–15825. doi: 10.1073/pnas.95.26.15821. [DOI] [PMC free article] [PubMed] [Google Scholar]
- 8.Skupin A., Kettenmann H., Falcke M. How does intracellular Ca2+ oscillate: by chance or by the clock? Biophys. J. 2008;94:2404–2411. doi: 10.1529/biophysj.107.119495. [DOI] [PMC free article] [PubMed] [Google Scholar]
- 9.Parker I., Yao Y. Regenerative release of calcium from functionally discrete subcellular stores by inositol trisphosphate. Proc. Biol. Sci. 1991;246:269–274. doi: 10.1098/rspb.1991.0154. [DOI] [PubMed] [Google Scholar]
- 10.Marchant J.S., Parker I. Role of elementary Ca2+ puffs in generating repetitive Ca2+ oscillations. EMBO J. 2001;20:65–76. doi: 10.1093/emboj/20.1.65. [DOI] [PMC free article] [PubMed] [Google Scholar]
- 11.Skupin A., Kettenmann H., Falcke M. Calcium signals driven by single channel noise. PLOS Comput. Biol. 2010;6:e1000870t. doi: 10.1371/journal.pcbi.1000870. [DOI] [PMC free article] [PubMed] [Google Scholar]
- 12.Skupin A., Falcke M. From puffs to global Ca2+ signals: how molecular properties shape global signals. Chaos. 2009;19:037111. doi: 10.1063/1.3184537. [DOI] [PubMed] [Google Scholar]
- 13.Thurley K., Tovey S.C., Falcke M. Reliable encoding of stimulus intensities within random sequences of intracellular Ca2+ spikes. Sci. Signal. 2014;7:ra59. doi: 10.1126/scisignal.2005237. [DOI] [PMC free article] [PubMed] [Google Scholar]
- 14.Wieder N., Fink R.H.A., von Wegner F. Mesoscopic simulation of subcellular calcium microdomains and calcium-regulated calcium channels. In: Figgins M.R., editor. Calcium Channels: Properties, Functions and Regulation. Nova Science Publishers; Hauppauge, NY: 2012. pp. 121–136. [Google Scholar]
- 15.von Wegner F., Wieder N., Fink R.H. Simulation strategies for calcium microdomains and calcium-regulated calcium channels. In: Islam S., editor. Calcium Signaling. Springer; New York: 2012. pp. 553–567. [DOI] [PubMed] [Google Scholar]
- 16.Dupont G., Combettes L., Putney J.W. Calcium oscillations. Cold Spring Harb. Perspect. Biol. 2011;3:a004226w. doi: 10.1101/cshperspect.a004226. [DOI] [PMC free article] [PubMed] [Google Scholar]
- 17.Wieder N., Fink R.H.A., Wegner Fv. Exact and approximate stochastic simulation of intracellular calcium dynamics. J. Biomed. Biotechnol. 2011;2011:572492. doi: 10.1155/2011/572492. [DOI] [PMC free article] [PubMed] [Google Scholar]
- 18.Swillens S., Champeil P., Dupont G. Stochastic simulation of a single inositol 1,4,5-trisphosphate-sensitive Ca2+ channel reveals repetitive openings during ‘blip-like’ Ca2+ transients. Cell Calcium. 1998;23:291–302. doi: 10.1016/s0143-4160(98)90025-2. [DOI] [PubMed] [Google Scholar]
- 19.Rüdiger S., Shuai J.W., Falcke M. Hybrid stochastic and deterministic simulations of calcium blips. Biophys. J. 2007;93:1847–1857. doi: 10.1529/biophysj.106.099879. [DOI] [PMC free article] [PubMed] [Google Scholar]
- 20.Dupont G., Abou-Lovergne A., Combettes L. Stochastic aspects of oscillatory Ca2+ dynamics in hepatocytes. Biophys. J. 2008;95:2193–2202. doi: 10.1529/biophysj.108.133777. [DOI] [PMC free article] [PubMed] [Google Scholar]
- 21.Longtin A. Effects of noise on nonlinear dynamics. In: Beuter A., Glass L., Mackey M.C., Titcombe M.S., editors. Nonlinear Dynamics in Physiology and Medicine. Springer; New York: 2003. pp. 149–189. [Google Scholar]
- 22.Li Q.S., Wang P. Internal signal stochastic resonance induced by colored noise in an intracellular calcium oscillations model. Chem. Phys. Lett. 2004;387:383–387. [Google Scholar]
- 23.Blomberg C. Fluctuations for good and bad: the role of noise in living systems. Phys. Life Rev. 2006;3:133–161. [Google Scholar]
- 24.Faisal A.A., Selen L.P.J., Wolpert D.M. Noise in the nervous system. Nat. Rev. Neurosci. 2008;9:292–303. doi: 10.1038/nrn2258. [DOI] [PMC free article] [PubMed] [Google Scholar]
- 25.Simpson M., Cox C., Cooke J. Noise in biological circuits. WIREs Nanomed. Nanobiotechnol. 2009;1:214–225. doi: 10.1002/wnan.22. [DOI] [PubMed] [Google Scholar]
- 26.Weinberg S.H., Smith G.D. Discrete-state stochastic models of calcium-regulated calcium influx and subspace dynamics are not well-approximated by ODEs that neglect concentration fluctuations. Comput. Math. Methods Med. 2012;2012:897371. doi: 10.1155/2012/897371. [DOI] [PMC free article] [PubMed] [Google Scholar]
- 27.Gillespie D.T. A rigorous derivation of the chemical master equation. Phys. A (Amsterdam, Neth.) 1992;188:404–425. [Google Scholar]
- 28.Gillespie D.T. Stochastic simulation of chemical kinetics. Annu. Rev. Phys. Chem. 2007;58:35–55. doi: 10.1146/annurev.physchem.58.032806.104637. [DOI] [PubMed] [Google Scholar]
- 29.Malek-Mansour M., Nicolis G. A master equation description of local fluctuations. J. Stat. Phys. 1975;13:197–217. [Google Scholar]
- 30.Gillespie D.T. Exact stochastic simulation of coupled chemical reactions. J. Phys. Chem. A. 1977;81:2340–2361. [Google Scholar]
- 31.Gillespie D.T. A general method for numerically simulating the stochastic time evolution of coupled chemical reactions. J. Comput. Phys. 1976;22:403–434. [Google Scholar]
- 32.Elf J., Doncic A., Ehrenberg M. SPIE’s First International Symposium on Fluctuations and Noise. International Society for Optics and Photonics (SPIE); Bellingham, WA: 2003. Mesoscopic reaction-diffusion in intracellular signaling; pp. 114–124. [Google Scholar]
- 33.Gillespie D.T., Hellander A., Petzold L.R. Perspective: stochastic algorithms for chemical kinetics. J. Chem. Phys. 2013;138:170901. doi: 10.1063/1.4801941. [DOI] [PMC free article] [PubMed] [Google Scholar]
- 34.Gibson M.A., Bruck J. Efficient exact stochastic simulation of chemical systems with many species and many channels. J. Phys. Chem. A. 2000;104:1876–1889. [Google Scholar]
- 35.Schwaller B. Cytosolic Ca2+ buffers. Cold Spring Harb. Perspect. Biol. 2010;2:a004051. doi: 10.1101/cshperspect.a004051. [DOI] [PMC free article] [PubMed] [Google Scholar]
- 36.von Wegner F., Fink R.H.A. Stochastic simulation of calcium microdomains in the vicinity of an L-type calcium channel. Eur. Biophys. J. 2010;39:1079–1088. doi: 10.1007/s00249-009-0504-3. [DOI] [PubMed] [Google Scholar]
- 37.De Young G.W., Keizer J. A single-pool inositol 1,4,5-trisphosphate-receptor-based model for agonist-stimulated oscillations in Ca2+ concentration. Proc. Natl. Acad. Sci. USA. 1992;89:9895–9899. doi: 10.1073/pnas.89.20.9895. [DOI] [PMC free article] [PubMed] [Google Scholar]
- 38.Shuai J., Pearson J.E., Parker I. A kinetic model of single and clustered IP3 receptors in the absence of Ca2+ feedback. Biophys. J. 2007;93:1151–1162. doi: 10.1529/biophysj.107.108795. [DOI] [PMC free article] [PubMed] [Google Scholar]
- 39.Mak D.-O.D., McBride S.M., Foskett J.K. Spontaneous channel activity of the inositol 1,4,5-trisphosphate (InsP3) receptor (InsP3R). Application of allosteric modeling to calcium and InsP3 regulation of InsP3R single-channel gating. J. Gen. Physiol. 2003;122:583–603. doi: 10.1085/jgp.200308809. [DOI] [PMC free article] [PubMed] [Google Scholar]
- 40.Gardiner C., Chaturvedi S. The Poisson representation. I. A new technique for chemical master equations. J. Stat. Phys. 1977;17:429–468. [Google Scholar]
- 41.Weinberg S.H., Smith G.D. The influence of Ca²+ buffers on free [Ca²+] fluctuations and the effective volume of Ca²+ microdomains. Biophys. J. 2014;106:2693–2709. doi: 10.1016/j.bpj.2014.04.045. [DOI] [PMC free article] [PubMed] [Google Scholar]
- 42.Elson E.L., Magde D. Fluorescence correlation spectroscopy. I. Conceptual basis and theory. Biopolymers. 1974;13:1–27. doi: 10.1002/bip.1974.360130103. [DOI] [PubMed] [Google Scholar]
- 43.Gardiner C., McNeil K., Matheson I. Correlations in stochastic theories of chemical reactions. J. Stat. Phys. 1976;14:307–331. [Google Scholar]
- 44.Hänggi P., Jung P. Colored noise in dynamical systems. Adv. Chem. Phys. 1995;89:239–326. [Google Scholar]
- 45.von Wegner F., Wieder N., Fink R.H. Microdomain calcium fluctuations as a colored noise process. Front. Genet. 2014;5:376. doi: 10.3389/fgene.2014.00376. [DOI] [PMC free article] [PubMed] [Google Scholar]
- 46.Schwaller B. The continuing disappearance of “pure” Ca2+ buffers. Cell. Mol. Life Sci. 2009;66:275–300. doi: 10.1007/s00018-008-8564-6. [DOI] [PMC free article] [PubMed] [Google Scholar]
- 47.Mak D.-O.D., Foskett J.K. Single-channel kinetics, inactivation, and spatial distribution of inositol trisphosphate (IP3) receptors in Xenopus oocyte nucleus. J. Gen. Physiol. 1997;109:571–587. doi: 10.1085/jgp.109.5.571. [DOI] [PMC free article] [PubMed] [Google Scholar]
- 48.Hänggi P. Stochastic resonance in biology. How noise can enhance detection of weak signals and help improve biological information processing. ChemPhysChem. 2002;3:285–290. doi: 10.1002/1439-7641(20020315)3:3<285::AID-CPHC285>3.0.CO;2-A. [DOI] [PubMed] [Google Scholar]
- 49.Elowitz M.B., Levine A.J., Swain P.S. Stochastic gene expression in a single cell. Science. 2002;297:1183–1186. doi: 10.1126/science.1070919. [DOI] [PubMed] [Google Scholar]
- 50.Raj A., van Oudenaarden A. Nature, nurture, or chance: stochastic gene expression and its consequences. Cell. 2008;135:216–226. doi: 10.1016/j.cell.2008.09.050. [DOI] [PMC free article] [PubMed] [Google Scholar]
- 51.McDonnell M.D., Abbott D. What is stochastic resonance? Definitions, misconceptions, debates, and its relevance to biology. PLOS Comput. Biol. 2009;5:e1000348. doi: 10.1371/journal.pcbi.1000348. [DOI] [PMC free article] [PubMed] [Google Scholar]
- 52.Wilkinson D.J. Stochastic modeling for quantitative description of heterogeneous biological systems. Nat. Rev. Genet. 2009;10:122–133. doi: 10.1038/nrg2509. [DOI] [PubMed] [Google Scholar]
- 53.Falcke M. On the role of stochastic channel behavior in intracellular Ca2+ dynamics. Biophys. J. 2003;84:42–56. doi: 10.1016/S0006-3495(03)74831-0. [DOI] [PMC free article] [PubMed] [Google Scholar]
- 54.Shuai J., Pearson J.E., Parker I. Modeling Ca2+ feedback on a single inositol 1,4,5-trisphosphate receptor and its modulation by Ca2+ buffers. Biophys. J. 2008;95:3738–3752. doi: 10.1529/biophysj.108.137182. [DOI] [PMC free article] [PubMed] [Google Scholar]
- 55.Moenke G., Falcke M., Thurley K. Hierarchic stochastic modeling applied to intracellular Ca2+ signals. PLoS ONE. 2012;7:e51178. doi: 10.1371/journal.pone.0051178. [DOI] [PMC free article] [PubMed] [Google Scholar]
- 56.Mosconi F., Julou T., Bensimon D. Some nonlinear challenges in biology. Nonlinearity. 2008;21:T131. [Google Scholar]
- 57.Morita A. Externally driven fluctuation of concentration and dynamics of second order chemical reaction. J. Chem. Phys. 1988;88:7481–7484. [Google Scholar]
- 58.Katsumoto M., Morita A. Externally driven fluctuation of concentration in the second-order chemical reaction and the dynamic fluctuation increase. J. Chem. Soc., Faraday Trans. 1989;85:623–633. [Google Scholar]
- 59.Brandman O., Meyer T. Feedback loops shape cellular signals in space and time. Science. 2008;322:390–395. doi: 10.1126/science.1160617. [DOI] [PMC free article] [PubMed] [Google Scholar]
- 60.Fraiman D., Dawson S.P. Buffer regulation of calcium puff sequences. Phys. Biol. 2014;11:016007. doi: 10.1088/1478-3975/11/1/016007. [DOI] [PubMed] [Google Scholar]
- 61.Rüdiger S., Nagaiah Ch., Shuai J.W. Calcium domains around single and clustered IP3 receptors and their modulation by buffers. Biophys. J. 2010;99:3–12. doi: 10.1016/j.bpj.2010.02.059. [DOI] [PMC free article] [PubMed] [Google Scholar]
- 62.Sneyd J., Dale P.D., Duffy A. Traveling waves in buffered systems: applications to calcium waves. SIAM J. Appl. Math. 1998;58:1178–1192. [Google Scholar]
- 63.Jackson M.B., Redman S.J. Calcium dynamics, buffering, and buffer saturation in the boutons of dentate granule-cell axons in the hilus. J. Neurosci. 2003;23:1612–1621. doi: 10.1523/JNEUROSCI.23-05-01612.2003. [DOI] [PMC free article] [PubMed] [Google Scholar]
- 64.Ricci A.J., Wu Y.C., Fettiplace R. The endogenous calcium buffer and the time course of transducer adaptation in auditory hair cells. J. Neurosci. 1998;18:8261–8277. doi: 10.1523/JNEUROSCI.18-20-08261.1998. [DOI] [PMC free article] [PubMed] [Google Scholar]
- 65.Kreiner L., Lee A. Endogenous and exogenous Ca2+ buffers differentially modulate Ca2+-dependent inactivation of Cav2.1 Ca2+ channels. J. Biol. Chem. 2006;281:4691–4698. doi: 10.1074/jbc.M511971200. [DOI] [PubMed] [Google Scholar]
- 66.Matthews E.A., Schoch S., Dietrich D. Tuning local calcium availability: cell-type-specific immobile calcium buffer capacity in hippocampal neurons. J. Neurosci. 2013;33:14431–14445. doi: 10.1523/JNEUROSCI.4118-12.2013. [DOI] [PMC free article] [PubMed] [Google Scholar]
- 67.Alpár A., Attems J., Harkany T. The renaissance of Ca2+-binding proteins in the nervous system: secretagogin takes center stage. Cell. Signal. 2012;24:378–387. doi: 10.1016/j.cellsig.2011.09.028. [DOI] [PMC free article] [PubMed] [Google Scholar]
- 68.Johnson I.D. Life Technologies; Norwalk, CT: 2010. The Molecular Probes Handbook—A Guide to Fluorescent Probes and Labeling Technologies. [Google Scholar]
- 69.Foskett J.K., White C., Mak D.-O.D. Inositol trisphosphate receptor Ca2+ release channels. Physiol. Rev. 2007;87:593–658. doi: 10.1152/physrev.00035.2006. [DOI] [PMC free article] [PubMed] [Google Scholar]
- 70.Taylor C.W., Tovey S.C. IP3 receptors: toward understanding their activation. Cold Spring Harb. Perspect. Biol. 2010;2:a004010. doi: 10.1101/cshperspect.a004010. [DOI] [PMC free article] [PubMed] [Google Scholar]
- 71.Adkins C.E., Taylor C.W. Lateral inhibition of inositol 1,4,5-trisphosphate receptors by cytosolic Ca2+ Curr. Biol. 1999;9:1115–1118. doi: 10.1016/s0960-9822(99)80481-3. [DOI] [PubMed] [Google Scholar]
- 72.Dorval A.D., Jr., White J.A. Channel noise is essential for perithreshold oscillations in entorhinal stellate neurons. J. Neurosci. 2005;25:10025–10028. doi: 10.1523/JNEUROSCI.3557-05.2005. [DOI] [PMC free article] [PubMed] [Google Scholar]
- 73.Cox C.D., McCollum J.M., Simpson M.L. Frequency domain analysis of noise in simple gene circuits. Chaos. 2006;16:026102. doi: 10.1063/1.2204354. [DOI] [PubMed] [Google Scholar]
- 74.Bezrukov S.M., Vodyanoy I. Noise-induced enhancement of signal transduction across voltage-dependent ion channels. Nature. 1995;378:362–364. doi: 10.1038/378362a0. [DOI] [PubMed] [Google Scholar]
- 75.Ries J., Schwille P. Fluorescence correlation spectroscopy. BioEssays. 2012;34:361–368. doi: 10.1002/bies.201100111. [DOI] [PubMed] [Google Scholar]
- 76.Fill M., Copello J.A. Ryanodine receptor calcium release channels. Physiol. Rev. 2002;82:893–922. doi: 10.1152/physrev.00013.2002. [DOI] [PubMed] [Google Scholar]
- 77.Lanner J.T., Georgiou D.K., Hamilton S.L. Ryanodine receptors: structure, expression, molecular details, and function in calcium release. Cold Spring Harb. Perspect. Biol. 2010;2:a003996. doi: 10.1101/cshperspect.a003996. [DOI] [PMC free article] [PubMed] [Google Scholar]
- 78.Gardiner C. Springer; Berlin, Germany: 2009. Stochastic Methods: A Handbook for the Natural and Social Sciences. [Google Scholar]
- 79.Gillespie D.T. The chemical Langevin equation. J. Chem. Phys. 2000;113:297–306. [Google Scholar]
- 80.Berridge M.J. Calcium microdomains: organization and function. Cell Calcium. 2006;40:405–412. doi: 10.1016/j.ceca.2006.09.002. [DOI] [PubMed] [Google Scholar]
- 81.Xu T., Yu X., Zuo Y. Rapid formation and selective stabilization of synapses for enduring motor memories. Nature. 2009;462:915–919. doi: 10.1038/nature08389. [DOI] [PMC free article] [PubMed] [Google Scholar]
- 82.Bers D.M. Cardiac excitation-contraction coupling. Nature. 2002;415:198–205. doi: 10.1038/415198a. [DOI] [PubMed] [Google Scholar]