

Abstract
Fast amoeboid migration requires cells to apply mechanical forces on their surroundings via transient adhesions. However, the role these forces play in controlling cell migration speed remains largely unknown. We used three-dimensional force microscopy to measure the three-dimensional forces exerted by chemotaxing Dictyostelium cells, and examined wild-type cells as well as mutants with defects in contractility, internal F-actin crosslinking, and cortical integrity. We showed that cells pull on their substrate adhesions using two distinct, yet interconnected mechanisms: axial actomyosin contractility and cortical tension. We found that the migration speed increases when axial contractility overcomes cortical tension to produce the cell shape changes needed for locomotion. We demonstrated that the three-dimensional pulling forces generated by both mechanisms are internally balanced by an increase in cytoplasmic pressure that allows cells to push on their substrate without adhering to it, and which may be relevant for amoeboid migration in complex three-dimensional environments.
Introduction
Amoeboid cell movement is required in many physiological and pathological processes such as the function of the immune system or cancer metastasis (1). To move on surfaces, amoeboid cells implement a motility cycle (2–4), enabled by the coordination of adhesion turnover, F-actin polymerization and crosslinking, and motor protein contractility (5). Unlike slower moving cells that form stable integrin-mediated focal adhesions, amoeboid cells such as neutrophils and Dictyostelium cells rely on transient, diffuse adhesions (2). The motor protein myosin II (MyoII) binds actin filaments to form a network that can generate the traction forces and is required for efficient cell motility (6). F-actin crosslinkers such as filamin reinforce F-actin filaments at the leading edge, stabilizing newly formed pseudopodia by enabling a space-filling network that can communicate traction forces between the front and the back of the cell (7).
By definition, traction forces are the forces that a body applies to its tangential surface to propel itself. However, there is a puzzling lack of correlation between the migration speed of amoeboid cells and the strength of the traction forces, and this strength is much larger than needed to overcome friction from the overlying fluid (8). The molecular and structural origins of the traction forces are also unclear, as migrating cells lacking MyoII or F-actin crosslinkers are still able to exert significant traction forces (8–11). Our biomechanical understanding of cell movement is complicated further because migrating cells exert significant normal forces (perpendicular to the substrate) in addition to the tangential ones (12–15). The mechanism whereby the cells are able to generate these strong normal forces is not known, nor is the role of these normal forces in regulating the efficiency of motility.
The three-dimensional (3D) organization of cytoskeletal filaments (16,17) should account, in part, for the normal forces exerted by the cells, because filaments pulling on the substrate at an elevation angle create both a normal and a tangential projection. However, the cell’s cortex, which is composed of a shell of dense crosslinked actin filaments and myosin motors attached to the membrane and to the remainder of the cytoskeleton (18), may be a greater contributor to the generation of these normal forces and has been shown to regulate cell shape changes, cell polarization, and bleb formation during cell movement (19–22).
By means of a recently developed 3D force microscopy (3DFM) technique (23), this study uncovered distinct molecular origins for the tangential and normal forces in migrating amoeboid cells. We analyzed wild-type (WT) chemotaxing Dictyostelium cells, as well as mutant strains with actin crosslinking and cortical integrity defects, and demonstrated that once the cells initiate their migration and polarize, they generate axial traction forces by MyoII contractility, which requires an internal crosslinked F-actin network. Simultaneously, cortical crosslinking and contractility (cortical tension) provides an additional mechanism for force generation and cytoplasmic pressurization that does not require MyoII. Our findings are consistent with a model in which the two force-generating cellular domains are mechanically connected by myosin I crosslinking which enables the communication of forces between the domains.
We found that the balance between axial MyoII contractility and cortical tension is important to produce the cell shape changes needed for locomotion, because cell migration speed correlates with the ratio of the magnitudes of the tangential traction forces to the normal ones. To our knowledge, these results reveal a novel role for 3D cellular forces in establishing the efficiency of amoeboid cell movement and provide the first mechanistic explanation for the high values of cell-substrate forces measured in migrating amoeboid cells.
Materials and Methods
Cell culture and microscopy
Dictyostelium discoideum cells were grown under axenic conditions in HL5 growth medium in tissue culture plates. We used 10 different cell lines: 1) WT Ax3; 2) WT Ax2; 3) myosin II null cells, mhcA− (generated from Ax3); 4) filamin null cells, abp120− (generated from Ax2); 5) cortexillin I null cells, ctxA− (generated from Ax2); 6) cortexillin II null cells, ctxB− (generated from Ax2); 7) cortexillin I and cortexillin II double null cells, ctxA−/B− (generated from Ax2); 8) myosin IA null cells, myoA− (generated from Ax2); 9) myosin IB null cells, myoB− (generated from Ax3); and 10) myosin IA and myosin IB double null cells, myoA−/B− (generated from Ax3).
All the cell lines were obtained from the Dicty Stock Center (http://dictybase.org/StockCenter/StockCenter.html) except the myoA−, myoB−, and myoA−/B−, which were generously provided by Dr. Margaret Titus, and in which myosin I genes were disrupted by recombination using the procedures found in Peterson et al. (24) and Novak et al. (25). MhcA− cells lack the protein myosin II, which localizes at the back of the cell and acts both as an F-actin crosslinker and as a motor (26). Abp120− cells lack the protein filamin, which localizes at the front of the cells and is required for the stabilization of the newly formed pseudopods (7). CtxA−, ctxB−, and ctxA−/B− cells lack the protein cortexillin I, cortexillin II, and both proteins, respectively. Cortexillin I and cortexillin II are F-actin-binding proteins, members of the α-actinin/spectrin family that are located in the cortex of Dictyostelium cells (27). MyoA−, myoB−, and myoA−/B− cells lack the protein myosin IA, myosin IB, and both proteins, respectively. Myosin IA and myosin IB are single-headed actin molecular motors involved in the connection between the plasma membrane and the cortical and intracellular F-actin (25).
Aggregation-competent cells were prepared by pulsing 5 × 10⁶ cells/mL suspension in Na/K phosphate buffer (9.6 mM KH2PO4, 2.4 mM Na2HPO4, pH 6.3) with cAMP to a concentration of 30 nM every 6 min for 6 h. Cells were seeded onto the functionalized polyacrylamide substrate and allowed to adhere. A drawn glass capillary mounted on a micromanipulator served as the source of chemoattractant (150 mM cAMP in an Eppendorf femtotip; Eppendorf, Hamburg, Germany). We acquired images using a spinning disk confocal microscope (Carl Zeiss, Thornwood, NY) and a cooled charge-coupled device camera (HQ CoolSNAP; Roper Scientific, Martinsried, Germany). The microscope was equipped with a piezo-Z actuator (Applied Scientific Instrumentation, Eugene, OR). A PC running SLIDEBOOK software (Intelligent Imaging Innovations (3i), Denver, CO) controlled the entire setup.
Polyacrylamide gel preparation and characterization
We fabricated 12–mm diameter, ∼40 μm-thick polyacrylamide gels of 4% acrylamide and 0.056% bisacrylamide (∼900 Pa (28)) on 22-mm square No. 1 glass coverslips (29,30). To improve the signal/noise of the image z-stacks and the displacement field calculation, we fabricated the polyacrylamide gel as two adjacent layers with the bottom one containing no beads and the top one containing 0.03% carboxylate modified red latex beads with 0.1 μm diameter (Fluospheres; Invitrogen, Carlsbad, CA). The two layers were verified to adhere well to each other under experimental conditions by confirming continuous registration of the two layers using gels with beads of a second color in the bottom layer. We mounted the coverslips with the gels in Petri dishes with a circular opening in the bottom using silicon grease (Dow Corning, Midland, MI). We made the gels physiologically compatible by crosslinking collagen I to the surface of the polyacrylamide. We used 1 mM Sulfo-SANPAH (Thermo Scientific, Rockford, IL) after UV activation to crosslink 0.25 mg/mL collagen I. The gels were incubated overnight at room temperature. After washing, the gels were stored in Na/K phosphate buffer (9.6 mM KH2PO4, 2.4 mM Na2HPO4, pH 6.3, same composition as used in the experiments) and antibiotic (40 μM Ampicillin) for up to a week.
We measured substrate thickness by locating the top and bottom planes of the gel and subtracting their z positions. The Young’s modulus (∼900 Pa) was verified by measurements of the indentation of a tungsten carbide sphere (31) and independently through atomic force microscopy. To measure the thickness of the gel, we located the top plane by maximizing the number of in-focus pixels of cell outlines as described by del Álamo et al. (8) and the bottom plane by focusing on streaky patterns left on the surface of the glass coverslip during treatment for gel attachment.
3DFM
The 3D forces exerted by the cells on the substrate were measured using the 3DFM method described by del Álamo et al. (23). We measured the 3D deformation of the substrate by imaging a thin layer of the substrate surface where the fluorescent beads are located by using a confocal microscope. We imaged a z-stack consisting of 24 planes separated 0.4 μm from each other and acquired images every 5 s. We calculated the substrate deformation by cross-correlating each instantaneous image z-stack in which the substrate is deformed and a nondeformed z-stack used as reference. In each experiment, the reference z-stack was obtained after the cell moved out of the field of view, which was easy to achieve, because Dictyostelium cells are highly motile. The instantaneous and reference z-stacks were divided into 3D interrogation boxes of size 24 × 24 × 24 pixels in the x, y, and z directions, to balance resolution and signal/noise while minimizing phototoxic effects. These settings provided a Nyquist spatial resolution of 2.1 μm.
Using the measured deformations as boundary conditions, we computed the 3D stresses (force per unit area) generated by the cells on the substrate using the 3D Green’s function of the elastic equation of equilibrium for a linear, homogeneous, isotropic 3D body, which was given in closed analytical form in the Fourier domain by del Álamo et al. (23). Given that our Fourier method does not enforce zero stress values outside the cell boundaries, the finite spatio-temporal resolution of the deformation measurements may lead to small nonzero values outside of the cell for relatively small, fast-moving cells such as Dictyostelium (see Fig. 1).
Figure 1.
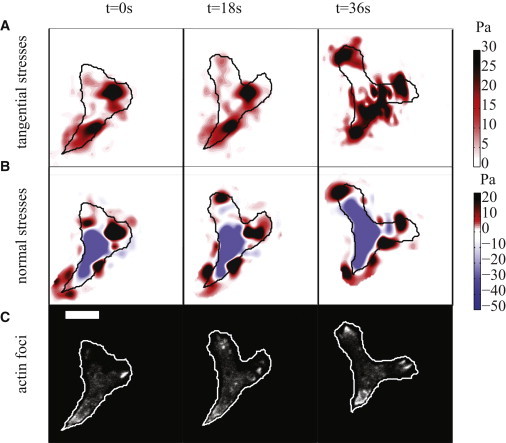
Tangential and normal stresses exerted by a WT cell on the substrate and actin foci localization at the cell’s ventral surface in contact with the substrate, plotted every 18 s. (A) Instantaneous tangential stresses. The color bar on the right represents the magnitude of the tangential stresses. (Black) Contour of the cell. The cell moves from bottom to top. (B) Instantaneous normal stresses. The color bar on the right indicates normal stress magnitude in the upward (pulling, red) or downward (compressive, blue) direction. (C) Localization of the actin structures at the ventral side of the cell at the same instants of time shown in panels A and B. The scale bar represents 10 μm. To see this figure in color, go online.
Actin foci localization
WT cells were transformed with a vector encoding Lifeact (Abp140 (1-17)-GFP), a 17-amino-acid peptide that binds F-actin fused to GFP (32). Lifeact-expressing WT cells were used for fluorescence imaging of the actin at the ventral surface of the cells. We acquired z-stacks of green and red fluorescence images to visualize the actin localization of the cells and the beads’ distribution, respectively. The Lifeact fluorescence plane corresponding to maximum bead fluorescence was used to detect actin puncta or foci. It is straightforward to see that, if the bead distribution is uniform in z, the Lifeact signal recorded in this plane comes from a very narrow slice at the surface of the gel, thus allowing us to visualize the actin foci on the ventral surface of the cells without interference from actin structures in the cell interior. These actin foci have been previously used as indicators of the areas where Dictyostelium cells adhere to the substrate (33).
H2B-GFP expressing cells
The sequence of H2Bv2 (34), a histone H2B domain-containing protein, was amplified from gDNA using the forward primer AAAAAGATCTAAAAAATGGTATTCGTTAAAGGTCAAAAG and the reverse primer TTTTTACTAGTGTTTTTGCTTTCAGTTGGATTG.
The H2Bv2 domain was fused to GFP, by cloning into the extrachromosomal vector pDM323 digested with BglII and SpeI. The H2Bv2 domain was sequenced to ensure mutation-free DNA. WT cells were transfected with this plasmid to generate H2B-GFP expressing cells for fluorescence imaging.
Cell-based reference system
Shape and orientation of the cells is continuously changing in the laboratory coordinate system where the images are obtained. Thus, to perform statistical analysis over long periods of time and for many different cells, we calculated the instantaneous stresses in a cell-based reference system that is dimensionless and can be used commonly for all the cells. This procedure, thoroughly described in the past (8,10), has allowed us to compile robust statistics from many cells at different instants of time. We identified the contour of the cell from the differential interference contrast images taken with the microscope in the laboratory reference frame and we computed the principal geometrical axes of the cell contour and their orientation in the laboratory coordinate system. The center of the cell-based coordinate system was located in the centroid of each cell at each instant of time. The coordinates of the center of the cell-based coordinate system in the laboratory coordinate system were (xc(t), yc(t)). In the cell-based coordinate system (ξ, η), the axes were parallel to the directions of the principal axes of each cell at each instant of time. The direction of the horizontal ξ-axis followed the direction of the major axis of each cell with the cell front pointing in the positive direction, and all spatial coordinates were rescaled with the half-length of the cell L(t)/2, making the cell-based reference system dimensionless. The (ξ, η) coordinates can be expressed mathematically as
where x and y were the coordinates in the laboratory coordinate system, and θ(t) was the angle between the major principal axis of the cell and the x axis of the laboratory coordinate system.
To obtain the average stresses, we converted the instantaneous stresses into the cell-based coordinate system (ξ, η). Because the distance was scaled with L(t)/2 in the cell-based coordinate system, the longitudinal axis of the cell spanned from ξ = −1 to ξ = 1. The dimensions of the stresses in this coordinate system needed to be consistent with the fact that their surface integral is a force. Therefore, the forces were scaled with [L(t)/2]2 and have dimensions of force. In Fig. 2, the ξ-coordinate is expressed as x/a and the η-coordinate is expressed as y/a.
Figure 2.
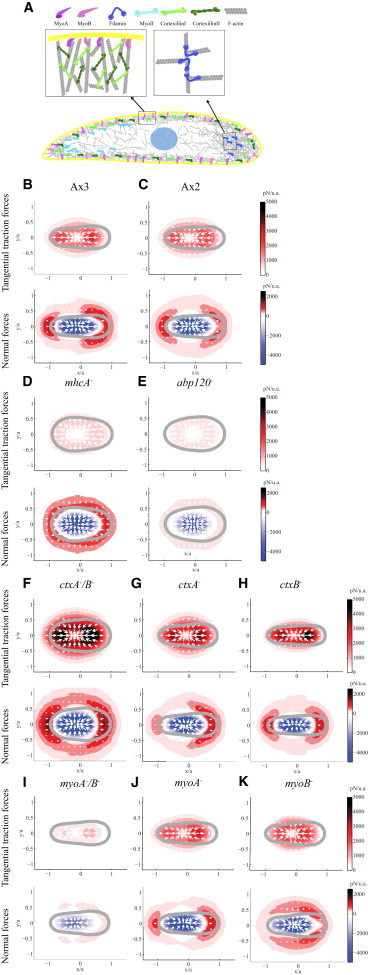
(A) Sketch of the locations of the proteins that we examined inside the cell, and the interaction with the F-actin filaments. (B–K) Average tangential and normal cell-generated force maps for WT and mutant strains. The upper row of each panel shows the distribution of the tangential traction forces per unit area in picoNewtons, color bar on the right. (White arrows) Direction of the tangential traction forces. (Gray) The average cell contour. The lower row of each panel shows the distribution of the normal forces per unit area in picoNewtons, with color bar on the right. (Red) Positive normal forces (the cells pull upward); (blue) negative normal forces (the cells push downward). The average maps of the following strains are displayed: (B) WT Ax3 cells, N = 13; (C) WT Ax2 cells, N = 13; (D) mhcA− cells, N = 13; (E) abp120− cells, N = 12; (F) ctxA−/B− cells, N = 11; (G) ctxA− cells, N = 12; (H) ctxB− cells, N = 13; (I) myoA−/B− cells, N = 13; (J) myoA− cells, N = 13; and (K) myoB− cells, N = 14. To see this figure in color, go online.
Calculation of the correlation coefficients
Once the cell contour was determined in the laboratory-based reference system, we determined the principal geometrical axes of the cell. The cell-substrate stresses were calculated in Cartesian coordinates (τxz, τyz, and τzz) and rotated such that the cell major axis was parallel to the vertical direction. Then, we calculated the axial tension, Tξ(ξ,t), in the cell-based coordinate system by integrating the ξ-component of the traction stresses in the cell-based reference system across the cell width (η-direction) at each instant of time, and the normal tension, Tz(ξ,t), by integrating the z-component of the stresses in a similar manner, i.e.,
The axial and normal tensions, Tξ(ξ,t) and Tz(ξ,t), defined this way have dimensions of force per unit length and typically are of approximately nN/μm. Using these data, we determined the position of the maximum axial tension in the front and back halves of the cells, the position of the maximum normal tension in the front and rear halves of the cell, and the position of the minimum normal tension in between the regions of positive normal tension. To calculate the correlation between the spatio-temporal evolution of the tangential and normal stresses, we calculated the Spearman correlation coefficient for these two signals. To calculate the correlation coefficient between the location of the negative normal stresses and the location of the cell nucleus, we calculated the Spearman correlation coefficient between the minimum normal tension and the location of the cell’s nucleus center. To calculate the correlation coefficient for the temporal evolution of the tangential and normal forces, we calculated the magnitudes of these two signals at each instant of time and determined their Spearman correlation coefficient.
Space-time kymographic representation
We obtained the cell-substrate stresses and rotated them into the cell-based reference system as described above. Then, we kept the major axis of the cell aligned to the vertical axis of the kymograph, which represents the position of the cell, and constructed the kymograph by stacking stresses coming from consecutive temporal measurements with the time variable in the horizontal axis and the position in the vertical axis. The cell contour was determined and plotted, together with the tangential stresses. The locations of the cell front and back were also calculated and plotted, as were the positions of the maximum tangential tension in the front and rear halves of the cells. The instantaneous normal stress kymograph was constructed in the same way, but using the measured normal stresses instead of the tangential ones.
Results
Adhesion foci are needed to pull upward and inward but not to push downward
We measured the 3D forces exerted by Dictyostelium cells when migrating up a chemoattractant gradient over flat elastic substrates using the 3DFM method presented in del Álamo et al. (23). Fig. 1 A shows the magnitude and spatial distribution of the tangential (in the plane of the substrate) traction stresses exerted by a migrating WT cell,
with τzx being the axial stresses in the direction of the major axis of the cell, and τzy being the lateral stresses in the direction of the minor axis of the cell. Fig. 1 B shows the magnitude and direction of the normal stresses, τzz, exerted in the direction perpendicular to the substrate simultaneously to the tangential stresses shown in Fig. 1 A. We find that cells exert stresses on the substrate in two diffuse regions located at their front and rear halves. In these regions, the cells apply inward contractile tangential stresses (Fig. 1 A) as well as normal stresses pulling the substrate upward (red regions in Fig. 1 B). Concurrently, the cells also exert downward normal stresses (compressing the substrate) on a central area located between the frontal and rear regions where the cells pull up (Fig. 1 B). These patterns are consistently observed in all 3D cell-substrate forces measured over time in WT cells (see Fig. S1 in the Supporting Material). These data indicate that the locations where the cell applies tangential traction stresses directly coincide with the locations where the cell exerts upward pulling normal stresses.
To clarify the interplay between adhesions, pulling forces, and pushing forces in migrating amoeboid cells, we measured 3D cell-substrate forces and the localization of actin foci in WT cells simultaneously by imaging the F-actin fluorescent reporter Lifeact at the substrate’s surface (Fig. 1 C). Actin foci are actin-rich structures that have been previously reported to localize on the ventral surface of the cell at the adhesion regions in migrating Dictyostelium cells (33,35). Our results indicate that the locations where the cell pulls upward and inward on the substrate, identified by the red spots in Fig. 1, A and B, coincide with the location of the actin foci (white spots in Fig. 1 C). No actin foci were found in regions where the cells are pushing down on the substrate (blue regions in Fig. 1 B). This suggests that cells need adhesion to pull over the substrate, but can compress it without.
Cortical tension is an important contributor to cell-substrate forces in cells with defects in the leading edge and posterior F-actin crosslinking
Cells lacking MyoII, which is important for axial contractility, or filamin (Abp120), an F-actin crosslinker that localizes to the leading edge and is important for pseudopod extension (Fig. 2 A), still exert appreciable traction forces on their substrate (9–11). To understand the genesis of these forces, we measured the 3D cell-substrate forces in MyoII null cells (mhcA−) and filamin null cells (abp120−), and those of their WT background strains (Ax3 and Ax2). To obtain the average tangential and normal forces exerted by each strain, we used a cell-based reference system with its origin at the centroid of the cell and its horizontal axis aligned along the front-back axis of the cell, and we normalized spatial coordinates with the cell length (8,10) (see Materials and Methods, and Fig. 2, B–K).
In the WT strains Ax3 and Ax2, the tangential forces were concentrated on two areas located at the front and rear ends of the cell (first row in Fig. 2, B and C, and see Fig. S1 A). The direction of these tangential forces (white arrows in Fig. 2) indicates that the cells contracted axially. In the normal direction, WT cells pulled upward at their front and rear, while they pushed downward on their central region (second row in Fig. 2, B and C, and see Fig. S1 B). The pulling normal and tangential forces were of similar strength (Fig. 2, B and C). The ratio between the magnitudes of the tangential and normal forces was quantified as
for each cell, where 〈⋅⋅⋅〉 and {⋅⋅⋅} denote, respectively, spatial and temporal averages (Fig. 3 C), and was close to 0.7 in both Ax3 and Ax2 cells.
Figure 3.
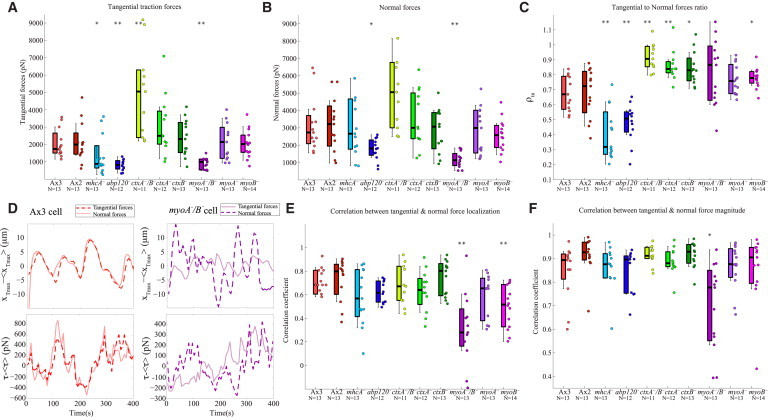
(A) Average magnitude of the tangential traction forces in picoNewtons. (B) Average magnitude of the normal forces in picoNewtons. (C) Ratio between the tangential and normal forces’ magnitude. (D) Top panels show the time fluctuations of the locations of the maximum tangential and normal tensions in the cell with respect to the cell center. Bottom panels show the time fluctuations of the magnitude of the tangential and normal forces exerted by the cell. (Left panels) Representative Ax3 cell. (Right panels) Representative myoA−/B− cell. (E) Spearman correlation coefficient for the spatio-temporal evolution of the location of the tangential and normal tension in the cell-based coordinate system. (F) Spearman correlation coefficient for the temporal evolution of the magnitudes of the tangential and normal forces. The cell lines and number of cells (N) are indicated beneath the box plot. (Asterisks) Statistically significant differences between each specific mutant strain and its corresponding WT distribution (Wilcoxon ranksum test, ∗p < 0.05, ∗∗p < 0.01). To see this figure in color, go online.
In contrast to WT cells, mhcA− and abp120− cells pulled on the substrate in the tangential and normal directions all along their peripheral cortex (Fig. 2, D and E, and see Fig. S2). The tangential forces were weaker in these mutant strains than in WT cells but the normal forces had similar strength (Fig. 3, A and B). Consistently, the average ratio of tangential to normal force magnitude was significantly reduced in these mutant strains, ρt,n = 0.40 for mhcA− cells and ρt,n = 0.48 for abp120− cells (Fig. 3 C). The 3D force patterns generated by cells lacking actomyosin contraction were similar to those observed for liquid drops when placed onto soft substrates, which exert upward forces due to surface tension around their edge, and downward forces due to fluid pressure under their center (36). These results are consistent with our previous two-dimensional observations that axial cell-substrate forces mediated by actomyosin contraction are lost in mhcA− and abp120− cells (8,10,11), and suggest that cortical and membrane tension generate the 3D cell-substrate forces observed in these cell strains.
Axial traction forces drive the movement of cells with cortical crosslinking defects
To examine the role of the cell cortex in the generation of cell-substrate forces, we analyzed three mutant strains with cortical crosslinking defects: Cortexillin I null cells (ctxA−), Cortexillin II null cells (ctxB−), and Cortexillin I and Cortexillin II double null cells (ctxA−/B−). Cortexillin I and Cortexillin II are F-actin-binding proteins that form complexes with the IQGAP proteins (IQGAP1 and IQGAP2) and bind the Rac family of small GTPases (37). These proteins are enriched in the cortex of migrating cells at the front, back, and lateral sides of the cell (38,39), but are not found in the ventral actin foci (39) (Fig. 2 A). Fig. 2, F–H, shows that the analyzed cortexillin null cells contracted axially, in a manner similar to WT cells, exerted tangential forces on the substrate that were concentrated at the front and back ends of the cell.
Interestingly, these axial forces were even greater than those exerted by WT cells (Fig. 3 A). However, compared to WT cells, the normal forces were weaker with respect to the tangential ones and were distributed less laterally (Figs. 2, F–H, and 3 C). Moreover, the average ratio of tangential to normal force magnitude was significantly increased in these mutant strains, ρt,n = 0.92, 0.86, and 0.84 for ctxA−/B−, ctxA−, and ctxB−, respectively. These results suggest that in cells with cortical crosslinking defects, the tangential traction forces mediated by MyoII contractility are increased and drive the cell motion, whereas the cortical tension is weaker and is not essential for their movement. Thus, the ctxA−, ctxB−, and ctxA−/B− cells exhibit an opposite phenotype regarding the generation of tangential and normal forces than the cells with defective leading-edge and posterior F-actin crosslinking, abp120− and mhcA−.
Myosin IA and Myosin IB are required for intracellular force transmission between the cortex and the internal F-actin network
The results above indicate that chemotaxing amoebae can exert 3D forces on their substrate through two distinct cellular domains, one being the leading-edge and posterior F-actin structure and the other being the cortical tension generated by the cellular membrane and cortex. To examine whether these mechanical domains are interconnected or independent, we studied the 3D cell-substrate forces exerted by Myosin IA null cells (myoA−), Myosin IB null cells (myoB−), and Myosin IA and Myosin IB double null cells (myoA−/B−). Myosin IA (MyoA) and Myosin IB (MyoB) are single-headed actin molecular motors with a high-affinity membrane-binding C-terminal tail domain, which are localized at the membrane/cortex of the cells (40) (Fig. 2 A). In these strains, the connections among the plasma membrane, the cortical actin, and the internal F-actin meshwork are impaired (25).
Our results indicate that myoA−, myoB−, and myoA−/B− cells exert axial tangential forces that are concentrated on two regions at their front and back as observed for the WT and cortexillin null cells in which the cell-substrate force generation is dominated by actomyosin contractility (first row in Fig. 2, I–K, and see Fig. S3 A). The ratios of tangential to normal forces for myoA−/B−, myoA−, and myoB− were intermediate between those of WT and cortexillin null cells, ρt,n = 0.82, 0.77, and 0.78, respectively (Fig. 3 C). However, the normal pulling forces exerted by myoB− and myoA−/B− cells were more evenly distributed along the cell periphery, similar to the mhcA− and abp120− cells in which cell-substrate force generation is dominated by cortical tension (second row in Fig. 2, I and K, and see Fig. S3 B). These results suggest that the actomyosin contractile compartment of myoB− and myoA−/B− cells is not fully coupled to their cortex. Loss of MyoA (Fig. 2 J) affected the cells in a different manner, causing a traction force phenotype more similar to that of ctxB− cells.
To further investigate the interconnection between the actomyosin-mediated axial contractility and cortical tension, we assessed the correlation in the magnitude and colocalization of the tangential and normal pulling forces for each strain (see Materials and Methods). In WT cells, the tangential and normal pulling forces colocalized in space and their magnitudes followed the same temporal evolution (Fig. 3 D), leading to high values of the correlation coefficients of colocalization (Fig. 3 E) and magnitude (Fig. 3 F). Similar high correlation values were obtained for the mhcA−, abp120−, ctxA−/B−, ctxA−, and ctxB− cells, suggesting that the cortical and the internal F-actin networks are two independent, yet interconnected generators of cellular force. However, in myoA−/B− cells the tangential and pulling normal forces did not colocalize, and their magnitudes evolved differently in time (Fig. 3 D and see Fig. S3, A and B). Consequently, both correlation coefficients were significantly lower in myoA−/B− than in WT (Fig. 3, D–F). Loss of MyoB caused a decreased correlation in colocalization but not in magnitude, whereas loss of MyoA did not cause significant changes in either measure of correlation between the tangential and normal forces. Taken together, these results suggest that both MyoA and MyoB play distinct roles in the communication of forces between the internal F-actin network and the cortex. Loss of MyoA alone is not enough to significantly alter this communication, which is completely disrupted in cells lacking both MyoA and MyoB. Additionally, MyoB is involved in the spatial colocalization of the forces generated by actomyosin contractility and cortical tension, while MyoA is not.
Cortical tension is balanced by increased cytoplasmic pressure causing compressive forces on the substrate
For all the strains we analyzed, strong normal compressive forces appeared at one location near the cell center (Figs. 1 and 2, and see Figs. S1, S2, and S3). It has been speculated that downward compressive forces are due to the nucleus (13,41) because this organelle is the largest and stiffest cellular compartment in many cell types and is tightly linked to the cytoskeleton (42). To investigate this hypothesis, we simultaneously measured 3D cell-substrate forces and determined the location of the nucleus in WT Dictyostelium cells expressing H2B-GFP, which marks the nucleus fluorescently (see Materials and Methods). Fig. 4, A and B, shows a kymographic representation of the instantaneous tangential and normal cell-substrate forces together with the contour of the cell and the location of its nucleus. In a space-time kymograph, the spatial data are aligned so that the cell axis is parallel to the y direction at each instant of time, and data from different instants of time are stacked together in the x direction (see Materials and Methods and Bastounis et al. (11) for details).
Figure 4.
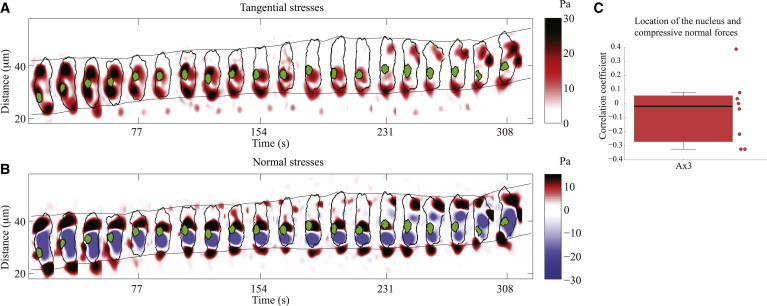
(A) Spatiotemporal kymograph of the instantaneous magnitude of the tangential traction stresses as a function of the position along the cell trajectory and time, for a representative WT cell. The instantaneous magnitude of tangential traction stresses (color bar on the right), localization of nucleus (green), and cell contours (black) are displayed every 14 s. (Gray envelope lines) Time-evolving position of the front and back edges of the cells. (B) Same as panel A for the instantaneous normal stresses (color map on the right; red indicates the cell is pulling upwards, blue indicates the cell is pushing downwards). (C) Box plot of the Spearman correlation coefficient between the location of the maximum negative normal tension and the location of the nucleus for Ax3 cells expressing H2B-GFP (N = 8). To see this figure in color, go online.
Using this representation, we observed that there are considerable periods of time where the nucleus is not located in the area where the cell is compressing the substrate. In fact, there are long periods of time where the nucleus colocalizes with areas in which the cell is pulling upwards (Fig. 4 B). Consistent with these observations, we found that the coefficient of correlation between nuclear position and the location of maximum compressive force is ∼0 (Fig. 4 C). These results indicate that in Dictyostelium cells, the nucleus does not take part in the generation of the normal compressive forces exerted during migration. We note, however, that Dictyostelium cells have smaller nuclei compared to other cell types. Our results do not rule out that the stiffness of the nucleus may play some role in the generation of normal compressive forces in mammalian cells or other cell types with a larger nucleus.
The cytosol is an incompressible medium with mechanical properties similar to those of water that can sustain hydrostatic pressure. Thus, we postulated that cell-substrate compressive forces are mediated by an increase in cytosolic pressure that balances the tension generated at the cell cortex. This model is analogous to the Young-Laplace’s theory that describes the increase of pressure created by surface tension across the interface between two fluids. To test this hypothesis, we estimated the relative intracellular pressure of the different strains from the measurements of the compressive normal stresses applied by cells on the substrate and used Young-Laplace’s law to estimate the cortical tension of the cells by applying an equilibrium of forces in the normal direction (see Fig. S4). We approximated the shape of the cell as an equivalent hemisphere of radius R equal to one-half the cell length, which is a reasonable assumption for Dictyostelium cells (2), leading to
| (1) |
where 〈τzz〉 represents the average of the maximum value of the compressive, normal cell-substrate stresses generated by a cell at each instant of time. In the context of our experiments, Eq. 1 should be taken as an estimation that allowed us to test if the pulling forces exerted by the cells on their substrate are balanced by a rise in intracellular pressure, rather than a model to estimate γ, for which more accurate techniques are available (43). However, even if our model neglects the nonspherical shape of the cell, the pressure sustained by the internal cytoskeleton and the regulation of cell-substrate adhesions, the values of the estimated cortical tension (Fig. 5) are in reasonable agreement with previous data obtained by micropipette aspiration (see details in the Supporting Material). The reductions of the cortical tension that we estimated for these mutant strains—25% in mhcA−, 46% in abp120− cells, 64% in myoA−/B− cells, and 12% in myoA− and myoB− cells—were similar to the cortical tension reductions measured by micropipette aspiration or cell poking (43–45). Thus, we concluded that cortical tension in migrating amoeboid cells is balanced by increased cytoplasmic pressure that causes the measured compressive forces on the substrate.
Figure 5.
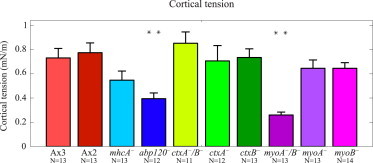
Bar plot of the cortical tension in mN/m for the cell lines and number of cells (N) indicated. (Asterisks) Statistically significant differences between each specific mutant strain and its corresponding WT distribution (Wilcoxon ranksum test, ∗∗p < 0.01). To see this figure in color, go online.
The speed of amoeboid movement correlates with the ratio between the magnitudes of the tangential and normal cell-substrate forces
The speed of amoeboid migration is related to the ability of cells to form and release their adhesions and is limited by the rate at which the cell can make the required shape changes to form a new pseudopod and retract their rear part (8,10,11). Efficient amoeboid cell movement requires a contraction driven by the axial forces and a softening of the anterior cortex that allows the cells to form the new protrusion. Thus, we hypothesized that the cells’ efficient movement depends on the relative strengths of the front-to-back axial contraction and the force generated through cortical tension. Consistent with this hypothesis, we found clear indications that the cell migration speed, v, increases considerably with the ratio of the tangential to normal cell-substrate forces, ρt,n (Fig. 6).
Figure 6.
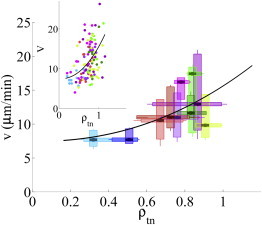
Speed of amoeboid cell migration as a function of the ratio between the magnitudes of the tangential and normal cell-substrate forces. (Vertical box plots) Distribution of migration speed for each of the strains examined. (Horizontal box plots) Distribution of tangential to normal force ratio, ρt,n. Box-plot color indicates the cell strain similar to Fig. 3. (Black line) Best polynomial least-square fit to the data, v = a + bρt,nc, with an exponent c ≈ 1.8. (Inset) Scatter plot of the cells’ migration speed versus ρt,n, where each point corresponds to a different cell. Circles are colored according to cell strain, similar to Fig. 3. To see this figure in color, go online.
Note that while the cell migration speed is v ≈ 6–8 μm/min when ρt,n < 0.5, it increases almost threefold up to v ≈ 18–20 μm/min when ρt,n ≈ 1. Fig. 6 shows the best least-square fit to the observed dependence of v on ρt,n, which was given by v = a + bρt,nc with an exponent c ≈ 1.8. On the other hand, we found no correlation between the velocity of migration and the magnitude of either the tangential or the normal cell-substrate forces alone (see Fig. S5). This argument is also supported by the fact that cells with lower velocities of migration showed reduced fluctuations in their aspect ratio (see Fig. S6), which may be related to a difficulty in overcoming the cortical tension through the front-to-back axial contractility.
Discussion
Fast amoeboid cell migration involves large cell-shape changes (2) and requires cells to apply mechanical forces on their surroundings via transient adhesions (6,46). However, the role of the cell-generated forces in this process is not understood, to the point that a relationship between the strength of these forces and the migration speed is yet to be found (8,9). This lack of understanding contrasts with the case of slower migrating mesenchymal cells such as fibroblasts, where the dependence between cell speed and the strength of cell-substrate adhesions has been demonstrated experimentally (47) and theoretically (48). Furthermore, amoeboid cells move in a highly 3D manner and exert 3D forces even while crawling on flat surfaces (13,23,49), but the vast majority of existing measurements of cell-generated forces are two-dimensional, neglecting the possible role that the forces perpendicular to the substrate may play in the migration process.
To investigate the role of the cellular forces in establishing the speed of amoeboid migration, we measured the 3D forces exerted by chemotaxing Dictyostelium cells on flat elastic substrates using 3DFM (23). We considered WT cells and eight different mutant strains with defective actin crosslinking and cortical integrity. Our measurements suggest that cells can modulate their 3D shape and move faster if they are able to generate periodic axial contractions that counterbalance the tension of their cortex. For a long time, the tangential traction forces exerted by crawling cells were known to be much greater than needed to overcome the external resistance of the environment (8,50), but the biological or mechanical reasons why the cells exert these forces were unknown. Our findings suggest a reasonable mechanistic explanation for the existence of such large traction forces.
The new 3DFM measurements presented in this study revealed that amoeboid cells exert forces on their substrate using two distinct mechanisms. In addition to the axial forces mediated by actomyosin contractility that had been previously described by two-dimensional force microscopy (8,10), we demonstrated that the thin actin cortex at the cell membrane can generate significant 3D forces. The spatial pattern of this cortical force was isolated in cells lacking internal F-actin crosslinking (mhcA− and abp120−), which exhibit reduced actomyosin contractility. It consists of an annular region of inward and upward pulling at the cell edge, surrounding a central region where the cell pushes down on the substrate. Similar patterns have been shown to be caused by liquid drops or liposomes when placed onto soft substrates (36,51), where interface tension is the only source for the measured forces.
Mathematical models for the generation of traction forces have suggested the importance of interface tension as well (52–54). Plasma membrane tension is reported to be ∼1000 times lower than cortical tension in Dictyostelium (44,55). Liposomes that have an actin cortex attached to the membrane can withstand tensions up to 0.3 mN/m when placed onto soft substrates before breaking (51), which is similar to the cortical tension reported for Dictyostelium. Therefore, the membrane should contribute little to the generation of 3D substrate forces in comparison to the actin cortex. Consequently, the cortical component of the cell-generated forces was found to be significantly lower than the axial contractility component in strains with cortical crosslinking defects (ctxA−/B−, ctxA−, and ctxB−), and in strains that are defective in linking the F-actin to the plasma membrane (myoA−/B−, myoA−, and myoB−).
Our finding that the tangential and normal forces are higher in the ctxA−/B− cells than in WT cells could be unexpected. However, we note that in these cells F-actin levels are increased (56) and F-actin is localized around much of the cortex of the cell (see Movies S1, S2, S3, and S4 in the Supporting Material and Cha and Jeon (39)) rather than predominantly in the front as in WT cells. We suggest that, while these higher cortical F-actin levels lead to increased forces, the resulting misorganization of the F-actin cytoskeleton impacts the cortical integrity compared to the cell’s axial contractility.
In Dictyostelium cells, axial contractile forces are generated and transmitted by a dense F-actin network that is regulated by F-actin crosslinking and actomyosin contractility (7,10,11). In the absence of axial contractility, the shape of the cell is rounder and less dynamic, as expected for a compartment confined by its surface tension, and the frequency of pseudopod protrusion is decreased (10,57). Cells lacking F-actin crosslinkers may rely on the in situ modulation of cortical tension to control their shape and migrate (21). Our measurements indicate that the interplay between the axial contractility and the cortical tension controls the forces exerted by migrating cells and their speed. Mechanical tension in the plasma membrane plays an important role in cell migration by spatially confining the signals for F-actin polymerization (58). In cells moving by extending thin, stable lamellipodia, membrane tension has been shown to determine lamellipodial shape and extension rate (19,59). However, the actual mechanisms used by migrating cells to actively regulate their membrane tension are not well understood. Our studies suggest that axial contraction and cortical crosslinking may contribute to this function jointly. The lack of correlation between cortical tension and axial contractility that we observed in myoA−/B− cells suggests that myosin I may be necessary for the proper communication of forces between the plasma membrane and the cortical and intracellular cytoskeletal networks.
The nature and molecular receptors controlling cell-substrate adhesion in Dictyostelium are not fully identified (3,60). However, actin-rich structures often referred to as actin foci are localized in the adhesion regions of migrating cells (33,35). Our study revealed that pulling forces require formation of firm adhesion to the substrate colocalized with actin foci regions and are directly transmitted by the actin cytoskeleton (46). In contrast, we did not observe actin foci in the regions where cells were generating compressive, normal forces on the substrate. Because the cell nucleus did not colocalize with these regions either, we concluded that the compressive forces are transmitted directly by cytosolic pressure. We corroborated this hypothesis by estimating the cortical tension using our measurements of normal compressive cell-substrate forces, and a simple Young-Laplace’s model that assumes that cortical tension is balanced by an increase in cytoplasmic pressure with respect to the extracellular medium. The cortical tensions estimated in this manner were found to be in good agreement with previously reported data measured by micropipette aspiration or cell poking for the cell lines considered in this study (43,44,61,62).
Thus, our experiments indicate that amoeboid cells can exert strong compressive forces on their substrate by increasing their cytoplasmic pressure. We previously showed that in Dictyostelium cells in which F-actin polymerization at the front is impaired by lack of F-actin crosslinking (abp120−), lateral squeezing generates the required pressure rise to propel their cytoplasmic material (11). These results agree with studies showing motion driven by internal hydrostatic pressure in other amoeboid cells (63) and support the hypothesis that hydrostatic pressure is one of the forces driving pseudopod extension during cell crawling (64). Amoeboid cells migrating in 3D matrices may use similar mechanisms to push off the surrounding obstacles without establishing specific cell-matrix adhesions (65,66). Cell malleability is recognized as an important factor in the migratory efficiency of amoeboid cells embedded in 3D matrices. Emerging studies suggest that leukocytes squeeze through small gaps in the ECM by actomyosin-regulated contractility without significant remodeling of the ECM; however, the mechanistic details of this process are still not well understood (67). Thus, the results of our study could contribute to a better understanding of cell migration, not only on flat surfaces, but also in more complex environments.
Conclusions
Our findings demonstrate that migrating amoeboid cells exert forces on their substrate through two complementary and overlapping mechanisms: the contractility of the F-actin cytoskeletal network and the internal pressure resulting from the tension of their cortex. We show that cell migration speed increases when the axial actomyosin contractility is able to balance the cortical tension to produce the cell shape changes needed for locomotion. To our knowledge, these findings provide the first mechanistic explanation for the high values of cell-substrate forces measured in migrating amoeboid cells.
Acknowledgments
We thank Dr. M. Titus for providing the myoA−, myoB−, and myoA−/B− cells.
This work was funded by U.S. Public Health Service grants No. R01 GM084227, No. R01 GM037830, and No. P01 GM078586.
Footnotes
Richard A. Firtel, Juan C. Lasheras, and Juan C. del Álamo contributed equally to this work.
Supporting Material
References
- 1.Lauffenburger D.A., Horwitz A.F. Cell migration: a physically integrated molecular process. Cell. 1996;84:359–369. doi: 10.1016/s0092-8674(00)81280-5. [DOI] [PubMed] [Google Scholar]
- 2.Friedl P., Borgmann S., Bröcker E.B. Amoeboid leukocyte crawling through extracellular matrix: lessons from the Dictyostelium paradigm of cell movement. J. Leukoc. Biol. 2001;70:491–509. [PubMed] [Google Scholar]
- 3.Uchida K.S., Yumura S. Dynamics of novel feet of Dictyostelium cells during migration. J. Cell Sci. 2004;117:1443–1455. doi: 10.1242/jcs.01015. [DOI] [PubMed] [Google Scholar]
- 4.Bastounis E., Meili R., Firtel R.A. The SCAR/WAVE complex is necessary for proper regulation of traction stresses during amoeboid motility. Mol. Biol. Cell. 2011;22:3995–4003. doi: 10.1091/mbc.E11-03-0278. [DOI] [PMC free article] [PubMed] [Google Scholar]
- 5.Ananthakrishnan R., Ehrlicher A. The forces behind cell movement. Int. J. Biol. Sci. 2007;3:303–317. doi: 10.7150/ijbs.3.303. [DOI] [PMC free article] [PubMed] [Google Scholar]
- 6.Jay P.Y., Pham P.A., Elson E.L. A mechanical function of myosin II in cell motility. J. Cell Sci. 1995;108:387–393. doi: 10.1242/jcs.108.1.387. [DOI] [PubMed] [Google Scholar]
- 7.Cox D., Ridsdale J.A., Hartwig J. Genetic deletion of ABP-120 alters the three-dimensional organization of actin filaments in Dictyostelium pseudopods. J. Cell Biol. 1995;128:819–835. doi: 10.1083/jcb.128.5.819. [DOI] [PMC free article] [PubMed] [Google Scholar]
- 8.del Álamo J.C., Meili R., Lasheras J.C. Spatio-temporal analysis of eukaryotic cell motility by improved force cytometry. Proc. Natl. Acad. Sci. USA. 2007;104:13343–13348. doi: 10.1073/pnas.0705815104. [DOI] [PMC free article] [PubMed] [Google Scholar]
- 9.Lombardi M.L., Knecht D.A., Lee J. Traction force microscopy in Dictyostelium reveals distinct roles for myosin II motor and actin-crosslinking activity in polarized cell movement. J. Cell Sci. 2007;120:1624–1634. doi: 10.1242/jcs.002527. [DOI] [PubMed] [Google Scholar]
- 10.Meili R., Alonso-Latorre B., Lasheras J.C. Myosin II is essential for the spatiotemporal organization of traction forces during cell motility. Mol. Biol. Cell. 2010;21:405–417. doi: 10.1091/mbc.E09-08-0703. [DOI] [PMC free article] [PubMed] [Google Scholar]
- 11.Bastounis E., Meili R., Lasheras J.C. Both contractile axial and lateral traction force dynamics drive amoeboid cell motility. J. Cell Biol. 2014;204:1045–1061. doi: 10.1083/jcb.201307106. [DOI] [PMC free article] [PubMed] [Google Scholar]
- 12.Hur S.S., Zhao Y., Chien S. Live cells exert 3-dimensional traction forces on their substrata. Cell. Mol. Bioeng. 2009;2:425–436. doi: 10.1007/s12195-009-0082-6. [DOI] [PMC free article] [PubMed] [Google Scholar]
- 13.Delanoë-Ayari H., Rieu J.P., Sano M. 4D traction force microscopy reveals asymmetric cortical forces in migrating Dictyostelium cells. Phys. Rev. Lett. 2010;105:248103. doi: 10.1103/PhysRevLett.105.248103. [DOI] [PubMed] [Google Scholar]
- 14.Maskarinec S.A., Franck C., Ravichandran G. Quantifying cellular traction forces in three dimensions. Proc. Natl. Acad. Sci. USA. 2009;106:22108–22113. doi: 10.1073/pnas.0904565106. [DOI] [PMC free article] [PubMed] [Google Scholar]
- 15.Alvarez-Gonzalez B., Bastounis E., Lasheras J.C. Cytoskeletal mechanics regulating amoeboid cell locomotion. Appl. Mech. Rev. 2014;66:050804. doi: 10.1115/1.4026249. [DOI] [PMC free article] [PubMed] [Google Scholar]
- 16.Fukui Y., Inoué S. Amoeboid movement anchored by eupodia, new actin-rich knobby feet in Dictyostelium. Cell Motil. Cytoskeleton. 1997;36:339–354. doi: 10.1002/(SICI)1097-0169(1997)36:4<339::AID-CM4>3.0.CO;2-0. [DOI] [PubMed] [Google Scholar]
- 17.Burnette D.T., Shao L., Lippincott-Schwartz J. A contractile and counterbalancing adhesion system controls the 3D shape of crawling cells. J. Cell Biol. 2014;205:83–96. doi: 10.1083/jcb.201311104. [DOI] [PMC free article] [PubMed] [Google Scholar]
- 18.Salbreux G., Charras G., Paluch E. Actin cortex mechanics and cellular morphogenesis. Trends Cell Biol. 2012;22:536–545. doi: 10.1016/j.tcb.2012.07.001. [DOI] [PubMed] [Google Scholar]
- 19.Keren K., Pincus Z., Theriot J.A. Mechanism of shape determination in motile cells. Nature. 2008;453:475–480. doi: 10.1038/nature06952. [DOI] [PMC free article] [PubMed] [Google Scholar]
- 20.Diz-Muñoz A., Fletcher D.A., Weiner O.D. Use the force: membrane tension as an organizer of cell shape and motility. Trends Cell Biol. 2013;23:47–53. doi: 10.1016/j.tcb.2012.09.006. [DOI] [PMC free article] [PubMed] [Google Scholar]
- 21.Carvalho K., Tsai F.C., Sykes C. Cell-sized liposomes reveal how actomyosin cortical tension drives shape change. Proc. Natl. Acad. Sci. USA. 2013;110:16456–16461. doi: 10.1073/pnas.1221524110. [DOI] [PMC free article] [PubMed] [Google Scholar]
- 22.Tinevez J.Y., Schulze U., Paluch E. Role of cortical tension in bleb growth. Proc. Natl. Acad. Sci. USA. 2009;106:18581–18586. doi: 10.1073/pnas.0903353106. [DOI] [PMC free article] [PubMed] [Google Scholar]
- 23.del Álamo J.C., Meili R., Lasheras J.C. Three-dimensional quantification of cellular traction forces and mechanosensing of thin substrata by Fourier traction force microscopy. PLoS ONE. 2013;8:e69850. doi: 10.1371/journal.pone.0069850. [DOI] [PMC free article] [PubMed] [Google Scholar]
- 24.Peterson M.D., Novak K.D., Titus M.A. Molecular genetic analysis of myoC, a Dictyostelium myosin I. J. Cell Sci. 1995;108:1093–1103. doi: 10.1242/jcs.108.3.1093. [DOI] [PubMed] [Google Scholar]
- 25.Novak K.D., Peterson M.D., Titus M.A. Dictyostelium myosin I double mutants exhibit conditional defects in pinocytosis. J. Cell Biol. 1995;131:1205–1221. doi: 10.1083/jcb.131.5.1205. [DOI] [PMC free article] [PubMed] [Google Scholar]
- 26.Fukui Y., Yumura S. Actomyosin dynamics in chemotactic amoeboid movement of Dictyostelium. Cell Motil. Cytoskeleton. 1986;6:662–673. [Google Scholar]
- 27.Weber I., Gerisch G., Faix J. Cytokinesis mediated through the recruitment of cortexillins into the cleavage furrow. EMBO J. 1999;18:586–594. doi: 10.1093/emboj/18.3.586. [DOI] [PMC free article] [PubMed] [Google Scholar]
- 28.Tse J.R., Engler A.J. Preparation of hydrogel substrates with tunable mechanical properties. Curr. Protoc. Cell Biol. 2010 doi: 10.1002/0471143030.cb1016s47. 2010 Jun:Chapter 10:Unit 10.16. [DOI] [PubMed] [Google Scholar]
- 29.Wang Y.L., Pelham R.J., Jr. Preparation of a flexible, porous polyacrylamide substrate for mechanical studies of cultured cells. Meth. Enzymol. 1998;298:489–496. doi: 10.1016/s0076-6879(98)98041-7. [DOI] [PubMed] [Google Scholar]
- 30.Engler A., Bacakova L., Discher D. Substrate compliance versus ligand density in cell on gel responses. Biophys. J. 2004;86:617–628. doi: 10.1016/S0006-3495(04)74140-5. [DOI] [PMC free article] [PubMed] [Google Scholar]
- 31.Keer L.M. Stress distribution at the edge of an equilibrium crack. J. Mech. Phys. Solids. 1964;12:149–163. [Google Scholar]
- 32.Riedl J., Crevenna A.H., Wedlich-Soldner R. Lifeact: a versatile marker to visualize F-actin. Nat. Methods. 2008;5:605–607. doi: 10.1038/nmeth.1220. [DOI] [PMC free article] [PubMed] [Google Scholar]
- 33.Yumura S., Kitanishi-Yumura T. Fluorescence-mediated visualization of actin and myosin filaments in the contractile membrane-cytoskeleton complex of Dictyostelium discoideum. Cell Struct. Funct. 1990;15:355–364. doi: 10.1247/csf.15.355. [DOI] [PubMed] [Google Scholar]
- 34.Stevense M., Chubb J.R., Muramoto T. Nuclear organization and transcriptional dynamics in Dictyostelium. Dev. Growth Differ. 2011;53:576–586. doi: 10.1111/j.1440-169X.2011.01271.x. [DOI] [PubMed] [Google Scholar]
- 35.Uchida K.S., Kitanishi-Yumura T., Yumura S. Myosin II contributes to the posterior contraction and the anterior extension during the retraction phase in migrating Dictyostelium cells. J. Cell Sci. 2003;116:51–60. doi: 10.1242/jcs.00195. [DOI] [PubMed] [Google Scholar]
- 36.Style R.W., Dufresne E.R. Static wetting on deformable substrates, from liquids to soft solids. Soft Matter. 2012;8:7177–7194. [Google Scholar]
- 37.Faix J., Weber I., Marriott G. Recruitment of cortexillin into the cleavage furrow is controlled by Rac1 and IQGAP-related proteins. EMBO J. 2001;20:3705–3715. doi: 10.1093/emboj/20.14.3705. [DOI] [PMC free article] [PubMed] [Google Scholar]
- 38.Faix J., Steinmetz M., Gerisch G. Cortexillins, major determinants of cell shape and size, are actin-bundling proteins with a parallel coiled-coil tail. Cell. 1996;86:631–642. doi: 10.1016/s0092-8674(00)80136-1. [DOI] [PubMed] [Google Scholar]
- 39.Cha I., Jeon T.J. Dynamic localization of the actin-bundling protein cortexillin I during cell migration. Mol. Cells. 2011;32:281–287. doi: 10.1007/s10059-011-0072-0. [DOI] [PMC free article] [PubMed] [Google Scholar]
- 40.Senda S., Lee S.F., Titus M.A. Recruitment of a specific amoeboid myosin I isoform to the plasma membrane in chemotactic Dictyostelium cells. J. Biol. Chem. 2001;276:2898–2904. doi: 10.1074/jbc.M008059200. [DOI] [PubMed] [Google Scholar]
- 41.Hersen P., Ladoux B. Biophysics: push it, pull it. Nature. 2011;470:340–341. doi: 10.1038/470340a. [DOI] [PubMed] [Google Scholar]
- 42.Khatau S.B., Hale C.M., Wirtz D. A perinuclear actin cap regulates nuclear shape. Proc. Natl. Acad. Sci. USA. 2009;106:19017–19022. doi: 10.1073/pnas.0908686106. [DOI] [PMC free article] [PubMed] [Google Scholar]
- 43.Dai J., Ting-Beall H.P., Titus M.A. Myosin I contributes to the generation of resting cortical tension. Biophys. J. 1999;77:1168–1176. doi: 10.1016/s0006-3495(99)76968-7. [DOI] [PMC free article] [PubMed] [Google Scholar]
- 44.Luo T., Mohan K., Iglesias P.A. Molecular mechanisms of cellular mechanosensing. Nat. Mater. 2013;12:1064–1071. doi: 10.1038/nmat3772. [DOI] [PMC free article] [PubMed] [Google Scholar]
- 45.Pasternak C., Spudich J.A., Elson E.L. Capping of surface receptors and concomitant cortical tension are generated by conventional myosin. Nature. 1989;341:549–551. doi: 10.1038/341549a0. [DOI] [PubMed] [Google Scholar]
- 46.Iwadate Y., Yumura S. Actin-based propulsive forces and myosin-II-based contractile forces in migrating Dictyostelium cells. J. Cell Sci. 2008;121:1314–1324. doi: 10.1242/jcs.021576. [DOI] [PubMed] [Google Scholar]
- 47.Palecek S.P., Loftus J.C., Horwitz A.F. Integrin-ligand binding properties govern cell migration speed through cell-substratum adhesiveness. Nature. 1997;385:537–540. doi: 10.1038/385537a0. [DOI] [PubMed] [Google Scholar]
- 48.Chan C.E., Odde D.J. Traction dynamics of filopodia on compliant substrates. Science. 2008;322:1687–1691. doi: 10.1126/science.1163595. [DOI] [PubMed] [Google Scholar]
- 49.Soll D.R., Wessels D., Lusche D.F. How a cell crawls and the role of cortical myosin II. Eukaryot. Cell. 2009;8:1381–1396. doi: 10.1128/EC.00121-09. [DOI] [PMC free article] [PubMed] [Google Scholar]
- 50.Lee J., Leonard M., Jacobson K. Traction forces generated by locomoting keratocytes. J. Cell Biol. 1994;127:1957–1964. doi: 10.1083/jcb.127.6.1957. [DOI] [PMC free article] [PubMed] [Google Scholar]
- 51.Murrell M.P., Voituriez R., Gardel M.L. Liposome adhesion generates traction stress. Nat. Phys. 2014;10:163–169. [Google Scholar]
- 52.Bischofs I.B., Schmidt S.S., Schwarz U.S. Effect of adhesion geometry and rigidity on cellular force distributions. Phys. Rev. Lett. 2009;103:048101. doi: 10.1103/PhysRevLett.103.048101. [DOI] [PubMed] [Google Scholar]
- 53.Deshpande V.S., McMeeking R.M., Evans A.G. A bio-chemo-mechanical model for cell contractility. Proc. Natl. Acad. Sci. USA. 2006;103:14015–14020. doi: 10.1073/pnas.0605837103. [DOI] [PMC free article] [PubMed] [Google Scholar]
- 54.Oakes P.W., Banerjee S., Gardel M.L. Geometry regulates traction stresses in adherent cells. Biophys. J. 2014;107:825–833. doi: 10.1016/j.bpj.2014.06.045. [DOI] [PMC free article] [PubMed] [Google Scholar]
- 55.Simson R., Wallraff E., Sackmann E. Membrane bending modulus and adhesion energy of WT and mutant cells of Dictyostelium lacking talin or cortexillins. Biophys. J. 1998;74:514–522. doi: 10.1016/S0006-3495(98)77808-7. [DOI] [PMC free article] [PubMed] [Google Scholar]
- 56.Lee S., Shen Z., Firtel R.A. Involvement of the cytoskeleton in controlling leading-edge function during chemotaxis. Mol. Biol. Cell. 2010;21:1810–1824. doi: 10.1091/mbc.E10-01-0009. [DOI] [PMC free article] [PubMed] [Google Scholar]
- 57.Wessels D., Soll D.R., Spudich J. Cell motility and chemotaxis in Dictyostelium amoebae lacking myosin heavy chain. Dev. Biol. 1988;128:164–177. doi: 10.1016/0012-1606(88)90279-5. [DOI] [PubMed] [Google Scholar]
- 58.Houk A.R., Jilkine A., Weiner O.D. Membrane tension maintains cell polarity by confining signals to the leading edge during neutrophil migration. Cell. 2012;148:175–188. doi: 10.1016/j.cell.2011.10.050. [DOI] [PMC free article] [PubMed] [Google Scholar]
- 59.Raucher D., Sheetz M.P. Cell spreading and lamellipodial extension rate is regulated by membrane tension. J. Cell Biol. 2000;148:127–136. doi: 10.1083/jcb.148.1.127. [DOI] [PMC free article] [PubMed] [Google Scholar]
- 60.Fey P., Stephens S., Chisholm R.L. SadA, a novel adhesion receptor in Dictyostelium. J. Cell Biol. 2002;159:1109–1119. doi: 10.1083/jcb.200206067. [DOI] [PMC free article] [PubMed] [Google Scholar]
- 61.Reichl E.M., Ren Y., Robinson D.N. Interactions between myosin and actin crosslinkers control cytokinesis contractility dynamics and mechanics. Curr. Biol. 2008;18:471–480. doi: 10.1016/j.cub.2008.02.056. [DOI] [PMC free article] [PubMed] [Google Scholar]
- 62.Gerald N., Dai J., De Lozanne A. A role for Dictyostelium racE in cortical tension and cleavage furrow progression. J. Cell Biol. 1998;141:483–492. doi: 10.1083/jcb.141.2.483. [DOI] [PMC free article] [PubMed] [Google Scholar]
- 63.Yanai M., Kenyon C.M., Kelly S.M. Intracellular pressure is a motive force for cell motion in Amoeba proteus. Cell Motil. Cytoskeleton. 1996;33:22–29. doi: 10.1002/(SICI)1097-0169(1996)33:1<22::AID-CM3>3.0.CO;2-K. [DOI] [PubMed] [Google Scholar]
- 64.Langridge P.D., Kay R.R. Blebbing of Dictyostelium cells in response to chemoattractant. Exp. Cell Res. 2006;312:2009–2017. doi: 10.1016/j.yexcr.2006.03.007. [DOI] [PubMed] [Google Scholar]
- 65.Lämmermann T., Bader B.L., Sixt M. Rapid leukocyte migration by integrin-independent flowing and squeezing. Nature. 2008;453:51–55. doi: 10.1038/nature06887. [DOI] [PubMed] [Google Scholar]
- 66.Aung A., Seo Y.N., Varghese S. 3D traction stresses activate protease-dependent invasion of cancer cells. Biophys. J. 2014;107:2528–2537. doi: 10.1016/j.bpj.2014.07.078. [DOI] [PMC free article] [PubMed] [Google Scholar]
- 67.Renkawitz J., Sixt M. Mechanisms of force generation and force transmission during interstitial leukocyte migration. EMBO Rep. 2010;11:744–750. doi: 10.1038/embor.2010.147. [DOI] [PMC free article] [PubMed] [Google Scholar]
Associated Data
This section collects any data citations, data availability statements, or supplementary materials included in this article.