

Summary
Homologous recombination (HR) mediates the exchange of genetic information between sister or homologous chromatids. During HR, members of the RecA/Rad51 family of recombinases must somehow search through vast quantities of DNA sequence to align and pair ssDNA with a homologous dsDNA template. Here we use single-molecule imaging to visualize Rad51 as it aligns and pairs homologous DNA sequences in real-time. We show that Rad51 uses a length-based recognition mechanism while interrogating dsDNA, enabling robust kinetic selection of 8-nucleotide (nt) tracts of microhomology, which kinetically confines the search to sites with a high probability of being a homologous target. Successful pairing with a 9th nucleotide coincides with an additional reduction in binding free energy and subsequent strand exchange occurs in precise 3-nt steps, reflecting the base triplet organization of the presynaptic complex. These findings provide crucial new insights into the physical and evolutionary underpinnings of DNA recombination.
Keywords: Rad51, DNA double-strand break, homologous recombination, homology search, single molecule, facilitated exchange, DNA curtain
Introduction
Homologous recombination (HR) is ubiquitous among all three kingdoms of life and serves as a driving force in evolution. HR is a major pathway for repairing DNA double-strand breaks (DSBs) and single-strand DNA (ssDNA) gaps, and plays essential roles in repairing stalled or collapsed replication forks (Heyer et al., 2010; San Filippo et al., 2008). HR provides an alternative pathway for telomere maintenance (Eckert-Boulet and Lisby, 2010), can lead to the duplication of long regions of chromosomes (Smith et al., 2007), and some organisms utilize HR as the sole means of initiating DNA replication (Hawkins et al., 2013). HR also generates genetic diversity and ensures proper chromosome segregation during meiosis (Neale and Keeney, 2006), and is a major source of phenotypic variation in many organisms (Fraser et al., 2007; Hastings et al., 2009). In humans, aberrant HR underlies chromosomal rearrangements often associated with cancers, cancer prone syndromes, and numerous genetic diseases (Heyer et al., 2010; San Filippo et al., 2008).
DSB repair in S. cerevisiae has long served as paradigm for studying HR (Heyer et al., 2010; San Filippo et al., 2008). The DNA ends present at DSBs are first processed by 5′→3′ strand resection, yielding 3′ ssDNA overhangs whose production coincides with the binding of replication protein A (RPA). RPA is then replaced by Rad51 or the meiosis-specific recombinase Dmc1, which is thought to have arisen by a gene duplication event early in the evolutionary history of eukaryotes (Lin et al., 2006). Rad51 and Dmc1 are both closely related to E. coli RecA. These proteins are DNA-dependent ATPases that form right-handed helical filaments on ssDNA, and the resulting presynaptic complexes (PCs) display a striking degree of conservation from bacteriophage to humans (Bianco et al., 1998). Structural studies have revealed that the presynaptic ssDNA is organized into base triplets that are maintained in near B-form conformation, but there is a 7.8 Å rise between adjacent triplets causing an overall extension of the ssDNA (Chen et al., 2008). Single-molecule force measurements suggest that this ssDNA extension may promote release of nonhomologous dsDNA and facilitate strand exchange with homologous dsDNA (Danilowicz et al., 2014). Many proteins participate in HR, including those encoded by the conserved RAD52 epistasis group of genes (Heyer et al., 2010; San Filippo et al., 2008). Despite these layers of complexity, Rad51, like other members of the Rad51/RecA family, can promote strand invasion in the absence of other proteins, implying that more specialized accessory factors augment the basal recombinase activities without conferring new catalytic properties.
Rad51/RecA recombinases must align ssDNA with a homologous duplex elsewhere in the genome. This process is referred to as the “homology search” and it is conceptually similar to target searches conducted by all other site-specific DNA-binding proteins (Barzel and Kupiec, 2008; Renkawitz et al., 2014; von Hippel and Berg, 1989). The principles that govern sequence alignment during HR remain poorly understood because the corresponding intermediates are transient and asynchronous (Barzel and Kupiec, 2008; Renkawitz et al., 2014). What features are the recombinases searching for within dsDNA? How do they distinguish between nonhomologous and homologous sequences? Over what length scales do they test for homology? What distinguishes search intermediates from the commitment to strand exchange? These questions all pertain to the overarching issue of how homology is efficiently located given the vast sequence space encoded by the genome (Neale and Keeney, 2006). We sought to address these questions by visualizing the homology search at the single-molecule level. Our results lead to a model in which 8-nt microhomology motifs serve as the fundamental units of molecular recognition by S. cerevisiae Rad51, and this initial event is distinct from subsequent strand invasion. We show that the physical principles underlying the ability of Rad51 to search for and align homologous DNA sequences are broadly conserved among the Rad51/RecA family members. This mechanism can drastically reduce the amount time necessary to align homologous dsDNA sequences.
Results
Assembly of Rad51 presynaptic complexes
We used ssDNA curtains and total internal refection fluorescence microscopy (TIRFM) to visualize Rad51 PCs (Gibb et al., 2014). The ssDNA was generated using M13mp18 (7,249-nt) as a template for rolling circle replication (Figure 1A & Figure S1), and then anchored to a lipid bilayer within a microfluidic chamber through a biotin-streptavidin linkage and aligned along chromium (Cr) barriers by application of hydrodynamic force. The ssDNA unravels when incubated with RPA-eGFP, and the downstream ends of the RPA-ssDNA are anchored to exposed Cr pedestals. Addition of wild-type S. cerevisiae Rad51 led to efficient, ATP-dependent PC assembly (Figure S1 & S2).
Figure 1. Visualizing dsDNA capture by Rad51.
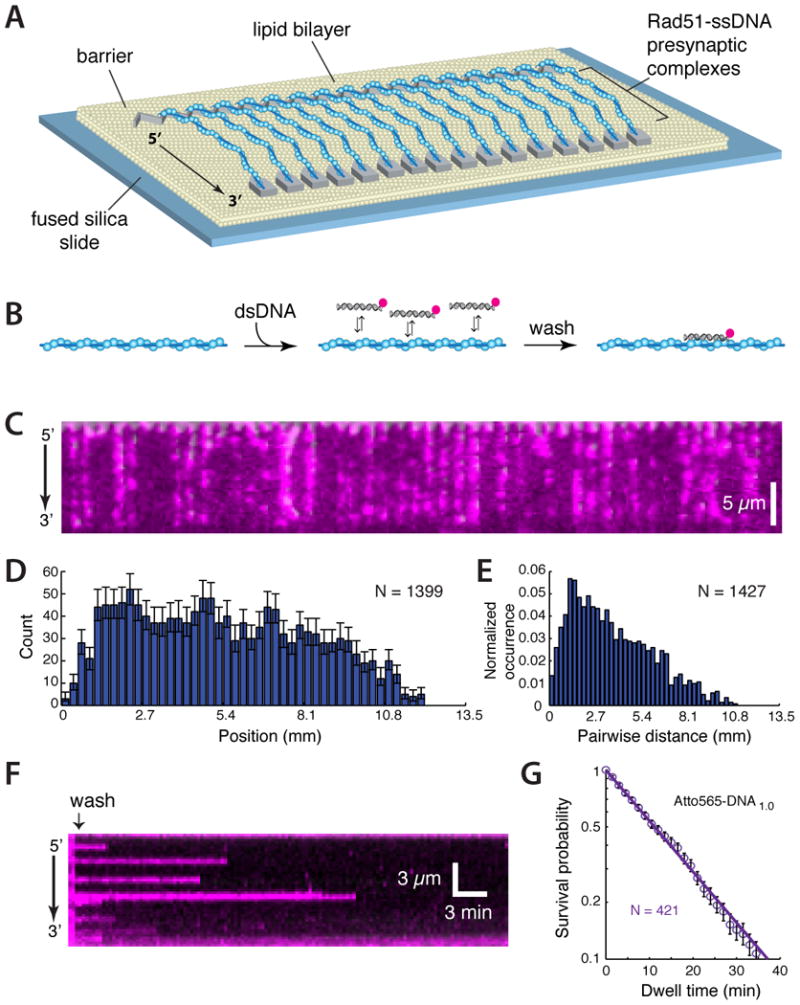
(A) Schematic of Rad51-ssDNA curtains (B) Strategy for detecting binding of Atto565 labeled dsDNA to the PCs. (C) Wide-field image of Rad51 PCs bound to Atto565-DNA1.0. (D) Binding site distribution and (E) pair-wise distance distribution of Atto565-DNA1.0. (F) Kymograph showing dissociation Atto565-DNA1.0 from a single Rad51 PC; 100-msec frames were collected at 20-sec intervals. (G) Dissociation kinetics of Atto565-DNA1.0. Unless otherwise stated, error bars for all binding site distributions and survival probability plots represent 70% confidence intervals obtained through bootstrap analysis.
Nonhomologous dsDNA capture by Rad51
Rad51/RecA recombinases must interrogate nonhomologous dsDNA while attempting to locate and align homologous sequences. We mimicked this process by testing the ability of the Rad51 PCs to interact with nonhomologous 70-base pair (bp) dsDNA oligonucleotides (Figure 1B). To visualize dsDNA binding, we injected Atto565 labeled dsDNA into the sample chamber; for brevity we designated this substrate Atto565-DNA1.0. Following a brief incubation, unbound dsDNA was flushed away and the remaining molecules were visualized by TIRFM. These experiments revealed Atto565-DNA1.0 bound to the PCs with no evident site preference within our resolution limits (Figure 1C-1E), and most of the bound dsDNA (78.4%) exhibited single-step photo-bleaching (not shown). Controls with RPA-ssDNA (minus Rad51) confirmed that dsDNA capture was Rad51-dependent (Figure S3A). In addition, the PCs rapidly disassembled when ATP was replaced with ADP (Figure S2), and the bound dsDNA was also quickly released when reactions were chased with ADP, indicating that dsDNA retention required the continued presence of Rad51 (Figure S3B-D). Kinetic measurements yielded a dissociation rate (koff) of 0.062±0.001 min-1 for Atto565-DNA1.0, corresponding to a lifetime of ∼16 minutes (Figure 1F & 1G). This was an extraordinarily stable interaction for a seemingly nonhomologous dsDNA, and such long-lived intermediates would appear incompatible with an efficient search mechanism. We next sought to understand the physical basis for these long lifetimes.
Substrate length does not impact dsDNA retention
If nonhomologous dsDNA capture primarily involved nonspecific electrostatic contacts with the phosphate backbone, then the lifetime of the bound intermediates should vary with dsDNA length. We tested this possibility with 35-bp and 18-bp dsDNA substrates. Surprisingly, the truncated substrates bound tightly to the PCs, although more substrate and longer incubation times were required for initial engagement (Figure S4). We conclude that substrate length had a modest impact on initial association with the PC, but did not affect retention of the captured dsDNA, suggesting that the observed intermediates were not maintained primarily through nonspecific contacts with dsDNA phosphate backbone.
Microhomology contributes to dsDNA capture
We next asked whether sequence microhomology might contribute to dsDNA capture. Analysis of DNA1.0 revealed many short tracts of microhomology complementary to sequences scattered throughout the M13mp18 ssDNA, including 12 regions with ≥8-nts of microhomology (Figure 2A & 2B). Previous reports suggested that E. coli RecA can pair DNA substrates perhaps as short as 8-nt in length (De Vlaminck et al., 2012; Hsieh et al., 1992; Xiao et al., 2006). Based on this knowledge, we designed a new substrate (Atto565-DNA2.0), which retained identical sequence composition as DNA1.0, but lacked microhomology ≥8-nt in length (Figure 2D-E). We readily detected capture of Atto565-DNA1.0 (Figure 2C), however, we were unable to detect stable capture of Atto565-DNA2.0 under identical conditions (Figure 2F), despite the fact that this substrate contains numerous tracts of microhomology ≤7-nt in length (Figure 2D).
Figure 2. Stable capture of nonhomologous dsDNA.
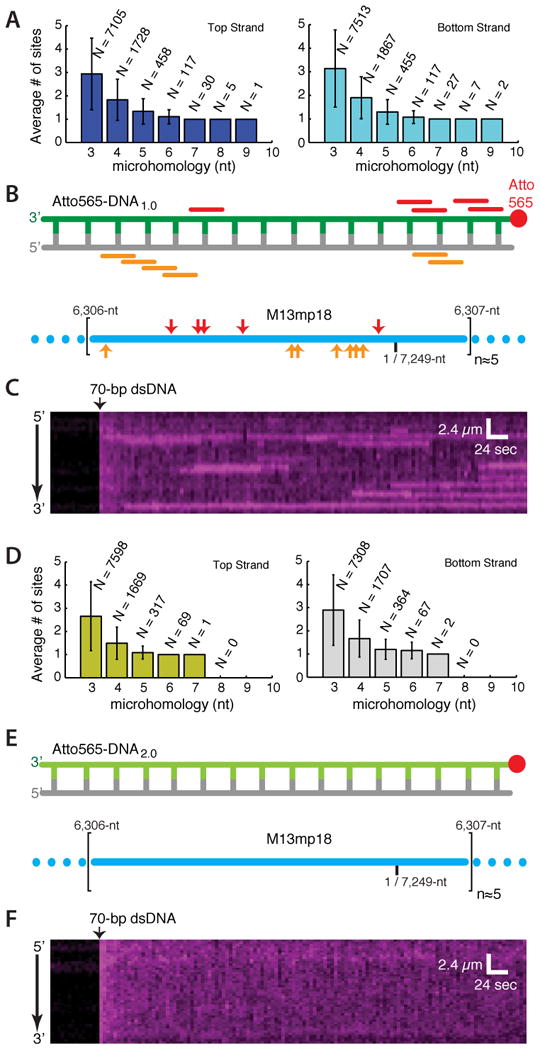
(A) Analysis showing the total number (N) and the average number (±S.D.) for the given length of microhomology within each occupied 70-nt window along M13mp18; additional details are presented as Supplemental Information. (B) Positions of microhomology (≥8-nt) within Atto565-DNA1.0 (color-coded bars indicate relative positions of microhomology within the dsDNA) and the schematic illustration showing the corresponding locations (indicated with color-coded arrowheads) of the tracts of microhomology along a single unit length M13mp18 ssDNA substrate (lower panel). Illustrations are not to scale. (C) Kymograph showing binding of Atto565-DNA1.0 to a single Rad51 PC; 100-msec frames were collected at 5-sec intervals. (D) Analysis and (E) schematic of a re-designed 70-bp dsDNA (Atto565-DNA2.0) lacking 8-nt tracts of microhomology; error bars are S.D. (F) Kymograph showing Atto565-DNA2.0 incubated with a single PC; data were collected as in (C).
Stable dsDNA capture requires 8-nt tracts of microhomology
Our results imply that dsDNA capture involves 8-nt or longer tracts of microhomology. This hypothesis predicts that a single 8-nt tract of microhomology added to an otherwise nonhomologous dsDNA should confer stable association with the PC. We tested this prediction with a series of substrates bearing precisely 8-nt of microhomology (Figure 3A). Remarkably addition of a single 8-nt tract of microhomology was sufficient to confer stable binding of a nonhomologous dsDNA to the PC, and similar results were obtained for 8-nt microhomology motifs at different locations (Figure 3A-E). The binding site distributions and the pairwise distance distributions of Atto565-dsDNA2.1 revealed a 2.6±0.2 μm periodicity, consistent with the expectation that the dsDNA was captured at a single position on M13mp18, and this conclusion was supported by analysis of a substrate targeted to an alternative location (cf. Figure 3F-G, Figure 1D-E & Figure S5).
Figure 3. 8-nt tracts of microhomology are sufficient for dsDNA capture.
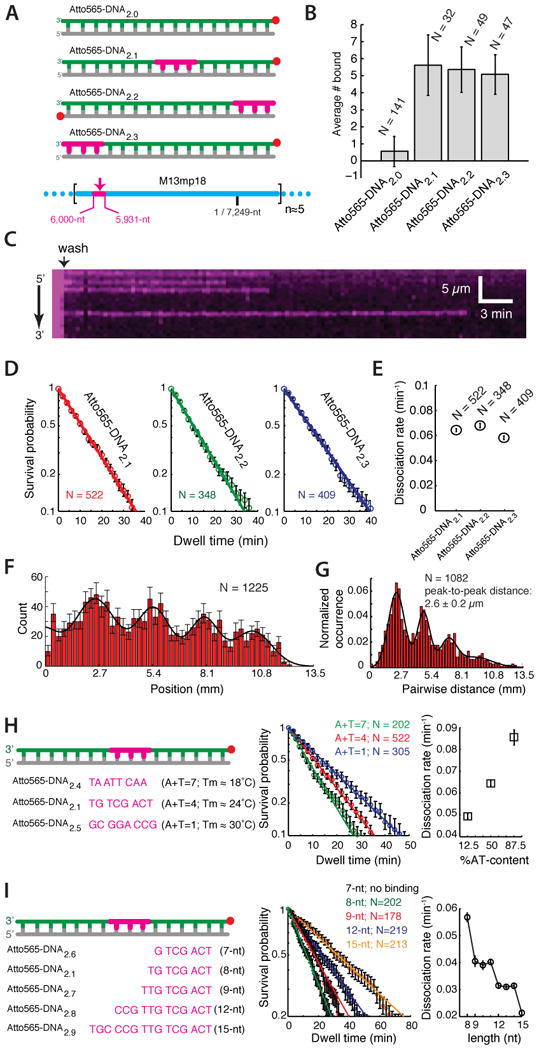
(A) Substrates bearing a single 8-nt tract of microhomology (highlighted in magenta) at different positions within the 70-bp dsDNA. (B) Average number of Atto565-dsDNA bound per PC; N corresponds to the number of PCs counted, and error bars represent S.D. (C) Kymograph showing an example of Atto565-DNA2.1 dissociating from a PC. (D) Survival probability plots and (E) dissociation rates for each substrate. (F) Binding distribution and (G) pairwise distance distribution for Atto565-DNA2.1. (H) Design, survival probability plots, and dissociation rates for DNA substrates bearing a single 8-nt tract of microhomology with varying AT-content. (I) Design, survival probability plots, and dissociation rates for substrates bearing 8 to 15-nts of microhomology; sequences and survival probability curves for the 10-, 11-, 13, and 14-nt substrates are omitted for clarity. There was no detectable binding activity for Atto565-DNA2.6 in these assays. In (D-I), N corresponds to the number of Atto565-DNA molecules measured, and error bars are S.D.
The requirement for microhomology suggested that captured intermediates were retained through Watson-Crick pairing. This hypothesis predicts that the binding lifetime should scale with melting temperature (Tm), which was confirmed using substrates bearing 8-nt tracts of microhomology of varying AT-content (Figure 3H). Moreover, the change in free energy (ΔΔG‡) scaled with hydrogen bonding potential, with each hydrogen bond contributing ∼0.14 kBT to the binding of the 8-nt motif. The modest contribution to overall stability for each hydrogen bond was consistent with the requirement that the homology search be driven by thermal fluctuations, and supports the notion that stretch-induced disruption of base stacking destabilizes the Watson-Crick base pairs relative to B-DNA (Chen et al., 2008).
We also tested how microhomology length influenced dsDNA capture (Figure 3I). We were unable to detect any stable binding intermediates when the 8-nt tract of microhomology was decreased to 7-nt (Atto565-DNA2.6), in agreement with the conclusion that 8-nts of microhomology was necessary for stable dsDNA capture (Figure 3I & see below). In contrast, increasing the 8-nt tract of microhomology to 9-nt reduced the dissociation rate, and additional length increases resulted in step-wise reductions in the dissociation rates in precise 3-nt increments (Figure 3I & see below). The microhomology requirement, the periodic binding patterns, and the influence of AT-content and microhomology length all suggested that the bound intermediates were maintained through Watson-Crick interactions.
Transient dsDNA sampling by Rad51
Rad51 did not stably capture dsDNA lacking 8-nt tracts of microhomology, but it must be transiently sampling these molecules. Even microhomology-bearing dsDNA must in most instances be transiently sampled, because the vast majority of bimolecular encounters will occur at nonhomologous sites. Therefore, the 70-bp substrates used in our assays offered the unique potential for exploring how Rad51 samples and rejects dsDNA while searching for homology. We detected these transient intermediates by visualizing reactions in real-time at 60-millisecond (msec) resolution (Figure 4A-D). Remarkably, the survival probabilities of substrates lacking ≥8-nt of microhomology (Atto565-DNA2.0) did not decay exponentially, but rather scaled as a power-law, with 50% of the molecules dissociating within 0.54 seconds (Figure 4E), even though this substrate harbors numerous ≤7-nt tracts of microhomology (Figure 2D). Power-law dependence was also observed over short time regimes for a substrate bearing a single 8-nt tract of microhomology (Atto565-DNA2.1), whereas the lifetimes were limited by photo-bleaching at longer time scales, as expected (Figure 4E).
Figure 4. Transient sampling dsDNA lacking microhomology.
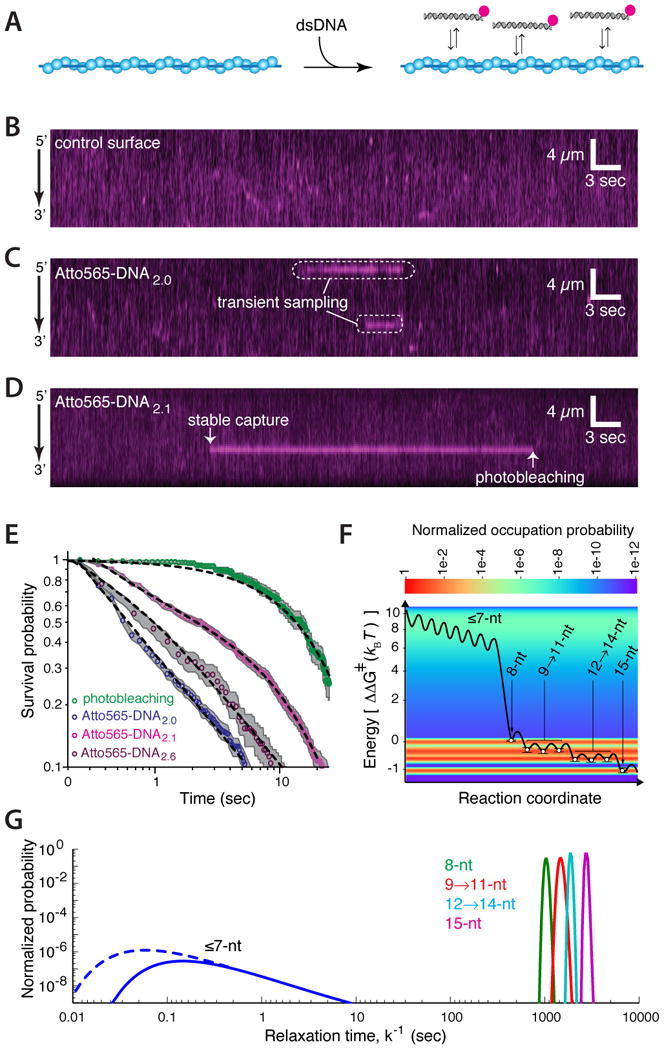
(A) Strategy for visualizing dsDNA sampling at 60-msec resolution. Kymographs showing (B) Atto565-DNA1.0 in the absence of the PC (control surface), and Rad51 PCs sampling (C) Atto565-DNA2.0 or (D) Atto565-DNA2.1. (E) Log-log plot revealing the power-law dependence of the transient search intermediates. Dashed lines represent a single exponential fit to the photo-bleaching data, power-law fits for Atto565-DNA2.0 and Atto565-DNA2.6, and combination of a power-law and single exponential fit for Atto565-DNA2.1. (F) Energy landscape describing dsDNA sampling and strand invasion by Rad51; the heat map and open circles (±S.D.) represent calculated values for normalized occupation probability and ΔΔG‡ values based on experimental data, respectively; the black line is a representation of the landscape and the heights of the energy barriers between states is for illustrative purposes only. Additional details are presented in the main text and Supplemental Information. (G) Distribution of kinetic rates for dsDNA sampling and capture by Rad51; solid lines represent experimental data and the dashed line reflects intermediates that are sampled too rapidly to be detected.
We next conducted real-time measurements with Atto565-DNA2.6, which differs from Atto565-DNA2.1 by just a single nucleotide (Figure 3I & Supplemental Information); as indicated above, this single nucleotide change reduces the 8-nt tract of microhomology to 7-nt, and abolishes stable capture of this substrate by Rad51. Instead, Atto565-DNA2.6 exhibits power-law distributed dissociation kinetics with 50% of the molecules dissociating within 0.82 seconds (Figure 4E). These findings indicate that all the dsDNA substrates were initially sampled through the same pathway, as revealed by its characteristic power-law dependence, but only substrates bearing 8-nts of microhomology transitioned into the long-lived state.
A crucial implication of this power-law behavior is that the transient sampling events cannot be ascribed to a single conformational state that can be assigned a unique dissociation rate constant, but rather reflects the existence of a highly diverse ensemble of states with a correspondingly broad distribution of dissociation rates (Austin et al., 1975; Frauenfelder et al., 1991). The physical basis for this power-law dependence is readily understood given the vast number of potential intermediates. If one assumes recognition involving 8-nt sequence motifs, then a 70-bp dsDNA can be misaligned with a total of 453,652 distinct sites on M13mp18, each of which can give rise to energetically distinct states based on differences in sequence composition. Power-law distributed dissociation kinetics are also consistent with recent molecular dynamics simulations, which suggest a large number of intermediates as RecA probes sequences for homology (M. Prentiss, personal communication). These considerations highlight the tremendous challenge faced during the homology search, even within our simplified experimental system.
Energy landscape for dsDNA sampling and strand invasion
Our data provide a free energy landscape describing dsDNA sampling and strand invasion by Rad51 (Figure 4F & Supplemental Information). The initial search process is characterized by transient intermediates that encompass a broad distribution of energetic states, which could reflect thousands of distinct complexes as Rad51 interrogates different sequences for homology (Figure 4F & 4G). Recognition of an 8-nt tract of microhomology results in a ∼8.2 kBT drop in free energy (ΔΔG‡) and gives rise to a ≥4 order-of-magnitude decrease in dissociation kinetics, providing a robust length-based mechanism for kinetically discriminating against sequences that are unlikely to be fully homologous (Figure 4F & 4G). This length-based microhomology recognition event is the single largest change in the energy landscape, and most likely reflects a conformational transition within the Rad51-ssDNA-dsDNA ternary complex – the exact nature of which remains to be explored. The finding that recognition of an 8-nt tract (as opposed to either 6- or 9-nts) coincided with the largest drop in free energy was not anticipated given that ssDNA within the PC is organized into base triplets (Chen et al., 2008). Following microhomology capture, Rad51 can probe the flanking the DNA for additional homology while attempting strand invasion. Pairing with a 9th nt results in an additional ∼0.4 kBT reduction in free energy, revealing that incorporation of the 9th nt enabled more stable engagement of the 3rd base triplet. All subsequent reductions in free energy occurred in precise 3-nt increments, suggesting that the ssDNA bound by Rad51 was organized into base triplets, as observed for E. coli RecA (Chen et al., 2008), and that the quantized reductions in binding energy were the functional consequence of this triplet organization. Together, these findings also indicate that capture of the first 8-nt tract of microhomology is mechanistically distinct from the subsequent reactions involved in strand invasion, suggesting that recognition of the 9th nt demarks the beginning of actual strand exchange, allowing subsequent reactions to take place in 3-nt steps.
Sliding or intersegmental transfer do not contribute to microhomology capture
Prior smFRET measurements suggested that 1-dimensional (1D) sliding might contribute to DNA alignment by RecA over short distances (Ragunathan et al., 2012). However, in agreement with prior biochemical studies (Adzuma, 1998), our data revealed no evidence of 1D sliding for Rad51, although we do not rule out the possibility that sliding might take place over short distances (≤270-nm). Other studies have shown that sequence alignment by RecA involves intersegmental transfer (Forget and Kowalczykowski, 2012). We found no evidence that the 70-bp dsDNA molecules moved by intersegmental transfer (Figure S6); however, these results do not argue against intersegmental transfer as a crucial component of the Rad51 homology search (see below), rather, our findings are as anticipated for a search entity engaging a single unit-length binding element.
Facilitated exchange promotes turnover of dsDNA bound to the presynaptic complex
Stand invasion in S. cerevisiae can be detected within approximately ∼10-60 minutes of DSB formation, so the search for homology must be completed within this time window. However, 8-nts is insufficient to define a sequence as statistically unique within the S. cerevisiae genome, and it is difficult to envision how recombination could be executed on a relevant time scale if the PC became kinetically trapped every time it encountered a ≥8-nt tract of microhomology. This implies the existence of unknown mechanisms for disrupting these intermediates.
One possibility is that specific enzymes might disrupt intermediates involving short microhomology motifs; there are numerous helicases/translocases with the potential to fulfill such a role (e.g. Mph1, Srs2, Sgs1, Rdh54 and/or Rad54) (Heyer et al., 2010; Renkawitz et al., 2014; San Filippo et al., 2008). We do not exclude the possibility that these or other proteins may contribute to the homology search, perhaps by promoting the turnover of Rad51 bound to incorrect 8-nt tracts of microhomology – future work will be necessary to test this hypothesis. However, Rad51, like many other Rad51/RecA family members, can catalyze strand exchange in vitro with no need for these accessory factors despite the potential for sequence misalignment at any of the hundreds of 8-nt microhomology motifs present in the plasmids typically used for these assays, underscoring that the ability to search for homology is an intrinsic property of Rad51/RecA proteins. Therefore we asked whether a more fundamental mechanism(s) might promote dissolution of microhomology-bound intermediates. It has recently been recognized that facilitated exchange can contribute to disruption of protein-nucleic acid interactions (Gibb et al., 2014; Graham et al., 2011; Sing et al., 2014), and may be a general but underappreciated phenomenon that influences macromolecular interactions under crowded physiological settings. Facilitated exchange reflects the existence of microscopically dissociated intermediates, which only undergo macroscopic dissociation when competing interactions arise from other molecules in the local environment. These concepts are readily extended to reactions involving the PC.
We considered the possibility that dissolution of intermediates arising from captured microhomology might be promoted by facilitated exchange with other dsDNA molecules. The hypothesis that DNA might disrupt search intermediates is intriguing given the high concentration of DNA within the nucleus and the potential ubiquity of such a mechanism. To test this hypothesis we asked whether dsDNA bound to the PCs was released more rapidly into free solution when challenged with free competitor dsDNA. For this, Atto565-DNA1.0 was pre-bound to the PCs, and the reactions were chased with unlabeled competitor (DNA1.0; Figure 5A). Remarkably, the competitor chase accelerated macroscopic dissociation of Atto565-DNA1.0 by up to ∼3-fold (Figure 5B-E). We conclude that free dsDNA can accelerate turnover of dsDNA bound to the PCs consistent with a mechanism involving facilitated exchange.
Figure 5. Facilitated exchange of captured intermediates.
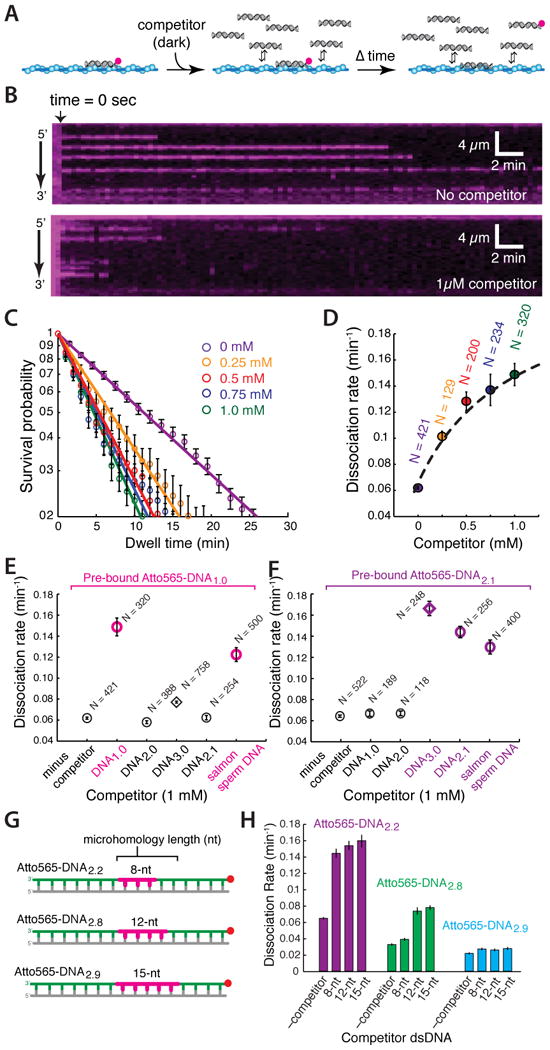
(A) Strategy for quantifying dsDNA dissociation after injection of unlabeled competing DNA. (B) Kymographs showing the dissociation of Atto565-DNA1.0 from the Rad51 PC in the absence (upper panel) and presence (lower panel) of unlabeled competitor DNA1.0. (C) Dwell time analysis of dissociation kinetics and (D) dissociation rates for Atto565-DNA1.0 when chased with varying concentrations of dark DNA1.0. The dissociation rates as a function of dark competitor are fit to a Hill-type curve with an intercept conveying the reaction in the absence of competitor. Dissociation rates for (E) Atto565-DNA1.0 and (F) Atto565-DNA2.1 when challenged with different competitor substrates (1 μM each), as indicated; like colors correspond to competitors bearing overlapping tracts of microhomology, competitors lacking overlapping microhomology are shown in black. (G) Schematic and (H) corresponding data for substrates used to test the influence of microhomology length and alignment on facilitated exchange. For (D-F), N corresponds to the number of Atto565-DNA molecules measured, and error bars are S.D.
Sequence and length requirements for facilitated exchange
PCs capture dsDNA through 8-nt tracts of microhomology, implying that facilitated exchange might involve overlapping tracts of microhomology. If correct, then facilitated exchange should only occur with competitor substrates bearing identical 8-nt tracts of microhomology. Indeed, reactions with two different Atto565-labeled substrates and series of competitors confirmed that facilitated exchange required overlapping tracts of microhomology (Figure 5E & 5F), and exchange was abolished if the competing microhomology was shifted by even a single nucleotide in either direction (not shown).
We next tested how facilitated exchange was influenced by microhomology length. The increased stability of substrates bearing longer tracts of microhomology (see Figure 3I) was reflected in the finding that shorter tracts of microhomology were more readily exchanged with longer tracts, whereas longer tracts of microhomology were more resistant to exchange with shorter tracts (Figure 5G & 5H). Moreover, a 15-nt tract of microhomology was sufficient to render a bound substrate completely resistant to facilitated exchange. Together, these results demonstrate that facilitated exchange requires overlapping microhomology, indicate that once the PC has engaged a particular dsDNA it ignores substrates lacking overlapping microhomology, and suggest that facilitated exchange can lead to preferential association with longer microhomology motifs. These results also imply the existence of a length-based threshold of ∼15-nts as perhaps demarking the commitment to strand exchange; reversibility at this stage of the reaction would likely require accessory proteins dedicated to dissolution of aberrant strand exchange intermediates (Heyer et al., 2010; San Filippo et al., 2008).
In addition to facilitated exchange, Atto565-labeled substrates bearing an 8-nt microhomology motif were also displaced from the PC when challenged with a fully homologous 70-bp substrate (DNA3.0), but only if the homologous substrate overlapped in sequence with the bound dsDNA (Figure 5E & 5F). This finding implies that the initiation of strand exchange with a homologous substrate anywhere along the PC would be sufficient to drive disruption of captured 8-nt tracts of microhomology located at adjacent positions along the PC, ensuring that stand invasion could progress unimpeded once homology was correctly identified.
Joint molecules made with fully homologous dsDNA resist disruption
The results presented above lead to four predictions for reactions involving homologous substrates: (i) initial sampling of the homologous substrate should exhibit power-law dependence over short time regimes; (ii) a homologous substrate should bind to all locations bearing ≥8-nt of microhomology; (iii) a captured homologous substrate should exhibit two categories of lifetimes corresponding to those molecules bound to microhomology motifs and those that are bound to the full region of homology; and (iv) the captured intermediates should be differentially affected when chased with competitor dsDNA. We tested these predictions using a homologous 70-bp substrate (Atto565-DNA3.0); analysis of this substrate revealed ≥8-nt tracts of microhomology at 19 distinct sites on M13mp18 ssDNA (Figure 6A). As anticipated, the initial sampling intermediates exhibited characteristic power-law behavior, reflecting the existence of a diverse ensemble of transient complexes (Figure 6B-C). Once captured, lifetime analysis of the bound dsDNA revealed the existence of two spatially distinct populations: shorter-lived intermediates, and longer-lived intermediates that displayed a periodic binding distribution as expected for the unique 70-nt region of homology (Figure 6C-D). As predicted, only the shorter-lived intermediates were disrupted when challenged with competing dsDNA, whereas the longer-lived complexes were resistant to facilitated exchange (Figure 6E-F). We conclude that Rad51 utilizes a length-based microhomology recognition mechanism even when presented with a fully homologous substrate and that products generated through strand invasion of the homologous substrate were highly stable.
Figure 6. Sampling and capture of a fully homologous substrate.
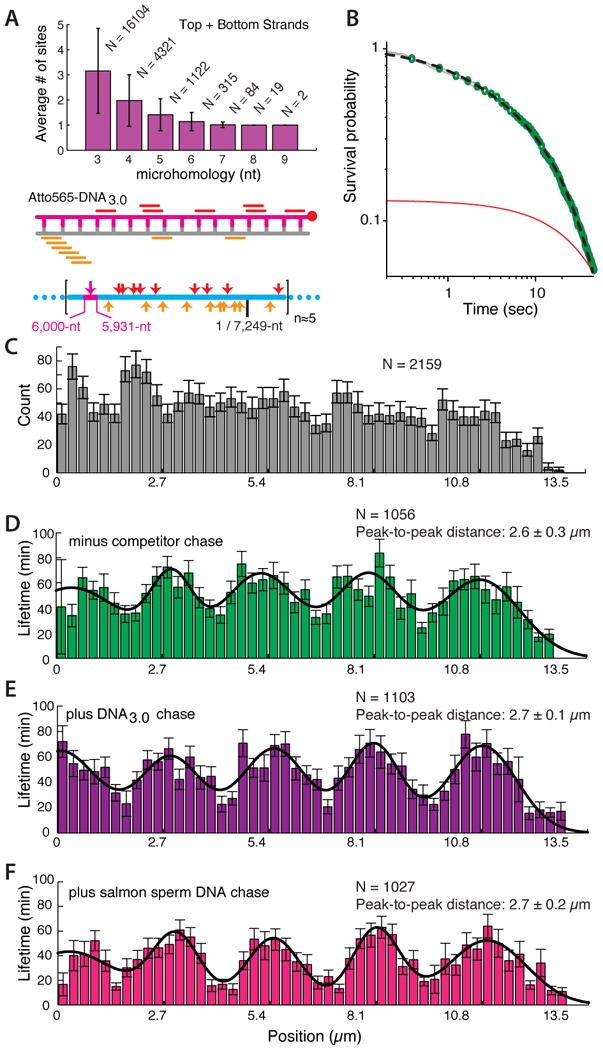
(A) Microhomology analysis and schematic of the 70-bp homologous dsDNA substrate (Atto565-DNA3.0) highlighting the ≥8-nt tracts of microhomology complementary to the M13mp18 ssDNA substrate. (B) Power-law dependence of search intermediates observed with DNA3.0; the dashed black line shows combination of a power-law and single exponential fit (to account for photo-bleaching) to the data, and the red line presents an exponential fit to the data for comparison. (C) Observed binding distribution of Atto565-DNA3.0 at time zero. (D) Lifetime distribution of Atto565-DNA3.0 in the absence of competitor dsDNA challenge. Lifetime distribution of Atto565-DNA3.0 when challenged with either (E) 1 μM DNA3.0 or (F) 1 μM salmon sperm DNA. N corresponds to the number of Atto565-DNA molecules measured, and error bars represent standard error of the mean (S.E.M.).
Model for DNA sequence alignment during HR
Our results are unified in a model for how Rad51 aligns DNA sequences during HR (Figure 7A). For clarity, Figure 7A depicts a single interacting unit; we anticipate multiple unit-length interactions will occur throughout the PC, as expected for intersegmental transfer (Forget and Kowalczykowski, 2012). We propose that Rad51 samples dsDNA in 8-nt increments and quickly rejects any sequences lacking 8-nt tracts of contiguous microhomology. This stage of the reaction is characterized by a complex energetic landscape as Rad51 quickly explores a vast amount of sequence space. The presence of an 8-nt tract of microhomology allows dsDNA to be captured through Watson-Crick pairing, enabling Rad51 to probe the flanking duplex for additional complementarity while attempting more extensive strand exchange. If pairing with a 9th nt is successful, then the resulting intermediates are rendered more stable by virtue of more extensive Watson-Crick pairing in precise 3-nt increments, eventually crossing a threshold (∼15-nts) beyond which they are much less susceptible to either spontaneous dissociation or facilitated exchange. In contrast, if further strand invasion fails, then any search intermediates bound to incorrect 8-nt tracts of microhomology can be disrupted by either spontaneous dissociation or facilitated exchange, or successful capture of full homology anywhere along the length of the PC will also disrupt any existing search intermediates allowing unimpeded strand exchange.
Figure 7. A conserved homology search mechanism.
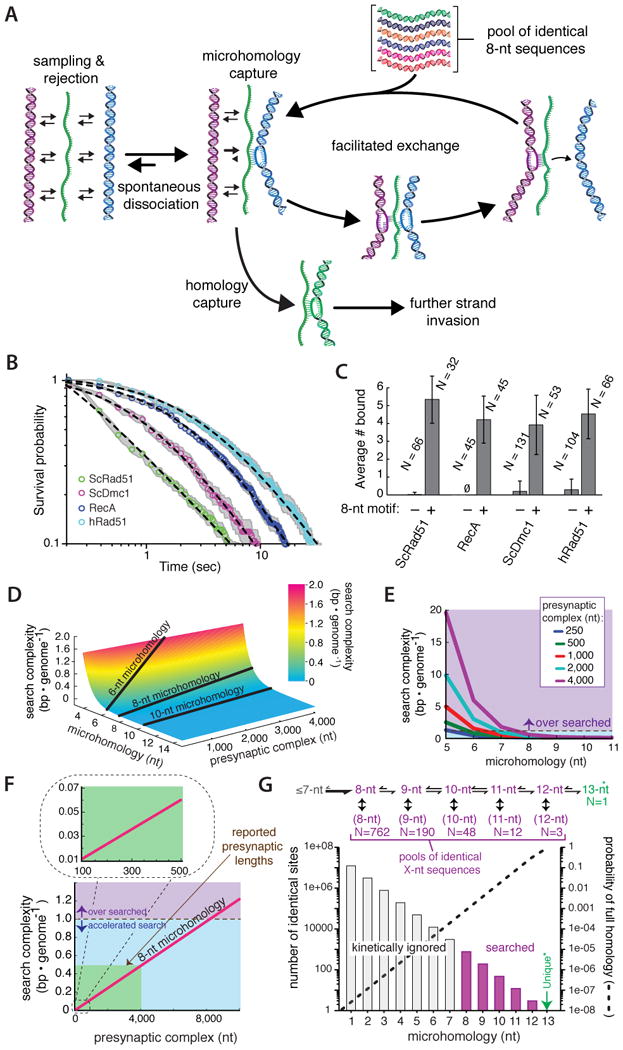
(A) Model depicting a homology search mechanism involving rapid sampling and rejection of DNA lacking microhomology, followed by eventual capture of an 8-nt tract of microhomology and facilitated exchange allowing for an iterative search through sequence space. Additional details are presented in the main text. Plots showing (B) power-law behavior during dsDNA sampling, and (C) microhomology-dependent binding for E. coli RecA, hRad51, and S. cerevisiae Dmc1; data presented for ScRad51 are reproduced from Figures 3B & 4E for comparison. The plus and minus 8-nt motif designations in (C) correspond to Atto565-DNA2.1 and Atto565-DNA2.0, respectively, and N corresponds to the number of PCs counted, and error bars represent S.D. (D) Surface plot showing how search complexity varies with PC length and the length of microhomology necessary for dsDNA interrogation. (E) Variation in search complexity for search models employing different lengths of microhomology, as indicated. (F) Relationship between search complexity and PC length for recognition involving 8-nt of microhomology. The green shaded region encompasses length estimates for S. cerevisiae PCs. (G) Fraction of the S. cerevisiae genome that can be kinetically ignored when employing a length-dependent search mechanism based on recognition of 8-nt motifs.
This model hints at a deeper understanding for how E. coli RecA might search for homology – RecA can capture as little as 8-nt of homology (Hsieh et al., 1992), and re-evaluation of the 1,762-nt ssDNA and 48,502-bp dsDNA sequences used to substantiate the RecA intersegmental transfer mechanism reveals a total of 2,089 tracts of 8-nt microhomology (Forget and Kowalczykowski, 2012). We suggest that RecA may establish numerous points of contact with dsDNA through these short tracts of microhomology.
A conserved search mechanism for the Rad51/RecA recombinases
The salient feature of our model for the homology search is that it minimizes nonproductive interactions with short (≤7-nt) dsDNA sequences that have little chance of being the homologous target. This assertion is based upon two key features of S. cerevisiae Rad51: (i) rapid sampling and rejection of dsDNA lacking microhomology motifs through a mechanism characterized by its distinctive power-law dependence; and (ii) length-specific kinetic selection of microhomology tracts (Figure 7A). We next asked whether human Rad51 (hRad51), S. cerevisiae Dmc1, and E. coli RecA behaved similarly. Remarkably, all three proteins displayed power-law behavior while transiently sampling dsDNA that lacked 8-nt microhomology motifs, with 50% of the sampling events occurring within 3.5, 1.1, and 2.5 seconds for hRad51, ScDmc1, and RecA, respectively (Figure 7B); and all three proteins preferentially captured substrates harboring 8-nts of microhomology (Figure 7C). These results revealed that recognition of an 8-nt microhomology motif coincided with ∼6.1, ∼6.5, and ∼6.2 kBT (ΔΔG‡) reductions in the free energy landscapes for hRad51, ScDmc1, and RecA, respectively, reflecting the drastic differences in affinity for dsDNA with and without an 8-nt tract of microhomology. These findings suggest that the ability to interrogate dsDNA through a mechanism involving length-specific microhomology recognition emerged early in the evolutionary history of the RAD51/recA gene family.
Discussion
The genetic transactions that take place during HR are governed by the physicochemical properties of the macromolecules that promote these reactions, and a full appreciation for the elegance of DNA recombination requires a detailed understanding of the underlying mechanistic principles. Our work suggests that length-specific kinetic selection of 8-nt microhomology motifs underlies the intrinsic ability of the Rad51/RecA recombinases to efficiently align homologous sequences, and mechanistically distinguishes this process from the 3-nt steps that take place during strand exchange. The use of microhomology motifs as recognition elements has crucial implications for understanding how DNA sequences are aligned during HR.
Microhomology recognition minimizes search complexity
The advantages of a length-based microhomology recognition can be illustrated by considering its influence on the amount of sequence space that must be interrogated during the homology search. The information that must be processed in order to align two homologous sequences can be quantitatively described as search complexity, which reflects the number of sites a searching entity must visit within the genome while attempting to locate a unique sequence (Figure 7A). A full treatment of search complexity is presented as Supplemental Information; here we highlight key concepts and their relevance to HR. In brief, search complexity can be defined as:
; where n is the length of microhomology used during the search, l is the length of the genome, and o is PC length. Any value for search complexity ≥1.0 bp·genome-1 indicates that the PC will on average sample more that a genome equivalent's worth of sites before locating homology; e.g., for an organism with a 1×10⁶ bp genome, a search complexity of 1 bp·genome-1 indicates that the PC would on average need to sample the equivalent of 100% of the genome (i.e. 1×10⁶ bp) before locating homology. Values <1.0 bp·genome-1 reflect a search that is accelerated relative to genome size; e.g., search complexity of 0.1 bp·genome-1 indicates that only 1/10th of the genome would need to be sampled to locate homology.
The benefits of microhomology recognition can now be explored by considering the impact on search complexity (Figure 7D-G). The most important revelation from this analysis is that search complexity decreases exponentially with the minimal length of microhomology necessary for dsDNA recognition. The source of this exponential dependence is evident given that for any genome short sequences will always have many exact matches, while longer sequences will always have fewer exact matches. For example, any defined 3-nt motif occurs on average once every 639-bp, and there would be ∼377,229 such sequences in the S. cerevisiae genome (Figure S7A). In contrast, 8-nt motifs will on average occur just once every 65,536-bp, and there would only be ∼762 identical 8-nt motifs in the yeast genome (corresponding to an in vivo concentration of ∼0.3 μM for any given 8-mer). As a consequence, a search utilizing an 8-nt motif would only need to interrogate just ∼0.01% of the genome to locate the homologous target, and the vast majority of the genome could be kinetically ignored. Indeed, a homology search involving length-specific recognition of 8-nt motifs, while kinetically minimizing interactions with shorter sequence motifs, would effectively eliminate ≥99.9% of the genome for species ranging from E. coli to humans.
Genetic and physical measures of the ssDNA overhangs generated during DSB repair suggest that S. cerevisiae PCs are ∼100–4,000 nts in length (Chung et al., 2010; Jinks-Robertson et al., 1993), and it is informative to consider how search complexity varies within this length regime. For a search utilizing 8-nt tracts of microhomology, a 100-nt PC would only need to process information content corresponding to 1/100th of the genome (Figure 7F, inset), a 4,000-nt PC would only need to sample ½ of the genome (Figure 7F), and search complexity would not enter the over searched regime until PC length exceeded ∼8,000-nt (Figure 7F). In contrast, if one assumes a model without microhomology recognition (i.e. n=1), then PCs ranging from 100-4,000-nt in length might have to process information equivalent to 2,500-100,000% of the genome. These considerations illustrate how simply subdividing the search into length-based microhomology recognition elements can drastically reduce the time necessary to align homologous sequences.
Physiological implications for HR and DSB repair
Our reductionist treatment of search complexity excludes potential effects of accessory factors, chromatin structural proteins, chromosome organization, etc. Interpretation of our results within the context of these physiological realities leads to several important insights and predictions. First, end resection, PC assembly, and the homology search are often presented as distinct stages of DSB repair. However, there is no reason to believe that these reactions are completely uncoupled, and the relative timing of these events dictates how much information must be processed during the homology search. Our results predict a substantial benefit to beginning the homology search as soon as possible after initiating DSB resection (Figure 7G).
Second, for mechanisms involving length-dependent microhomology recognition, the fractional reduction in search complexity is the same regardless of genome size. Although longer recognition motifs offer the potential for further reductions in search complexity, this would compromise reversibility because of the greater enthalpic penalty incurred for disruption of a larger binding surface, which could ultimately lead to misalignment of DNA sequences trapped in local minima. Moreover, assuming a randomized nucleotide distribution, the length required to statistically define a given sequence as unique does not vary drastically across species. For instance, average lengths of just ∼12, ∼13, and ∼17 nucleotides are sufficient to uniquely define most sequences within the E. coli, S. cerevisiae, and human genomes, respectively (Figure S7B). These considerations imply that there may be little or no evolutionary pressure to utilize longer tracts of microhomology to compensate for variations in genome size. Notably, real genomes contain repetitive sequences and other regions of low sequence complexity (e.g. rDNA and tRNA genes, transposons, centromeres, telomeres, etc.), and such regions would require longer sequences to define “uniqueness”, or else may suffer from a greater potential for misalignment during HR. Interestingly, recombination within these regions is often suppressed and/or otherwise tightly regulated (Eckert-Boulet and Lisby, 2009, 2010; Pan et al., 2011; Sasaki et al., 2010), perhaps reflecting in part the unique challenges faced by the recombination machinery in these regions of low sequence complexity.
Third, PC organization affects the amount of information that must be processed during the homology search. The preceding discussion assumes a contiguous PC consisting of all possible overlapping 8-nt units (Figure S7C). However, search complexity declines by an entire order of magnitude if the PC is segregated into non-overlapping 8-nt sections, and intermediate subdivisions are similarly beneficial (Figure S7C-E). It is not known whether PCs in vivo are comprised of uninterrupted Rad51/RecA filaments, or whether they contain protein-free gaps and/or other physical discontinuities (e.g. other HR proteins). Our results suggest some proteins could promote HR by segregating Rad51/RecA filaments into non-overlapping functional units.
Fourth, once the PC has engaged a particular 8-nt tract of microhomology it can undergo exchange with other regions of dsDNA bearing the same microhomology, but resists exchange with unrelated sequences. Moreover, shorter tracts of microhomology are more readily exchanged with longer tracts, reflecting the higher stability of intermediates held together by longer tracts of Watson-Crick pairing. Preferential exchange with longer tracts of microhomology may yield a hierarchy of increasingly stable intermediates, which might in turn funnel the PC through progressively smaller pools of sequences leading to the homologous target (Figure 7G).
Fifth, compartmentalization of the search through either spatial organization or steric occlusion will decrease search complexity linearly with respect to the amount of sequence accessible for interrogation. Benefits are readily envisaged if homologous chromosomes are physically juxtaposed, as anticipated for sister chromatids immediately following DNA replication, and accumulating evidence suggests that homologous sequences also have a greater probability of being juxtaposed at other points in the cell cycle (Barzel and Kupiec, 2008; Gladyshev and Kleckner, 2014; Weiner and Kleckner, 1994). Similarly, restricting search intermediates to the linker DNA between nucleosomes could reduce search complexity by ∼75% based on nucleosome occupancy of the S. cerevisiae genome.
Reduction of dimensionality versus reduction of search complexity
Target search studies have historically centered upon whether the path-to-target involves 3D diffusion (i.e. “jumping”), or pathways that accelerate the search through reduction of dimensionality (i.e. facilitated diffusion), such as 1D diffusion (i.e. sliding or “hopping”), or intersegmental transfer (von Hippel and Berg, 1989). Our results now highlight reduction of search complexity as an efficient means of accelerating target searches. Rad51 accomplishes this by first looking for a small portion of its target before testing the flanking DNA for homology. The difference in stability for substrates bearing ≤7-nt versus ≥8-nt of microhomology minimizes off-target interactions, ensuring that Rad51 spends most of the search interrogating sequences that already have a high probability of being a homologous target (Figure 7G). This mechanism is strikingly similar to the strategy employed by the Cas9 CRIPSR RNA-guided endonuclease (Sternberg et al., 2014). Cas9 search intermediates are restricted to a trinucleotide sequence called the protospacer adjacent motif (PAM). Cas9 kinetically ignores non-PAM sequences, but binds transiently to PAMs (5′-NGG-3′), allowing it to test the flanking dsDNA for complementarity to the guide RNA. This simple mechanism allows Cas9 to kinetically ignore ∼90% of the λ phage genome, ensuring that the search is focused on sequences that have a high probability of being the correct target (Sternberg et al., 2014). Rad51 and Cas9 are unrelated, yet they share extraordinarily similar search strategies – the only difference is that Cas9 looks for a fixed 3-nt motif, whereas Rad51 looks for variable 8-nt motifs. We suggest that similar mechanisms involving the initial recognition of short sequence motifs representing just a small portion of a complete binding site may be a broadly utilized strategy for DNA-binding proteins to minimize search complexity while searching within genomes for particular targets.
Conclusion
Our work supports a model in which short tracts of microhomology represent the fundamental functional units of dsDNA recognition during HR, yielding insights into how Rad51/RecA recombinases align homologous sequences. The emergent concepts may be broadly applicable.
Experimental Procedures
S. cerevisiae RPA-eGFP and S. cerevisiae Rad51 were expressed and purified as previously described (Gibb et al., 2014). Single-stranded DNA substrates were prepared by rolling circle replication using ϕ29 DNA polymerase and a 5′ biotinylated primer annealed to a circular M13mp18 ssDNA template (Gibb et al., 2012). Fused silica slides were patterned by e-beam lithography and lipid bilayers were prepared with 91.5% DOPC, 0.5% biotinylated-DPPE, and 8% mPEG 550-DOPE (Avanti Polar Lipids)(Greene et al., 2010). Experiments were performed using a prism-type TIRFM equipped with 488-nm and 561-nm lasers (Coherent, Inc.) and two iXon EMCCDs (Andor Technology). Videos were collected with NIS Elements AR (Nikon), data were quantitated using NIH Image J, and all survival probability curves were corrected for photo-bleaching.
All ScRad51 experiments were conducted at 30°C in HR buffer containing 30 mM Tris-acetate [pH 7.5], 20 mM Mg-acetate, 50 mM KCl, 1 mM DTT, 0.2 mg/ml BSA, plus 2.5 mM ATP (Sugiyama et al., 1997). Presynaptic complexes were assembled by incubating RPA-eGFP bound ssDNA curtains with 2 μM ScRad51 in HR buffer for 15-minutes at 30°C. Free ScRad51 was then flushed from the sample chamber using HR buffer plus 2.5 mM ATP. Presynaptic complex assembly was confirmed by visual inspection of the ssDNA before, during and after the ScRad51 injection.
DNA binding was measured by injecting Atto565-dsDNA (10 nM) into the sample chambers. Reactions were then incubated for 10 minutes in the absence of buffer flow, and free dsDNA was quickly flushed away. For reactions containing competitor dsDNA, the competitor was included at the indicated concentration in the buffer used to flush the sample chamber. Data were obtained by acquiring single 100-msec frames at either 20-, 30-, 40- or 60-second intervals, and the laser was shuttered between each acquired image to minimize photo-bleaching. Kymographs were generated from the resulting videos. The average number of bound dsDNA molecules, binding distributions and survival probabilities were all determined from analysis of the kymographs.
Transient dsDNA sampling at higher temporal resolution was measured by injecting Atto565-tagged dsDNA substrate (10 nM), buffer flow was then terminated and data were acquired using a 60-msecond exposure time and continuous laser illumination in the absence of shuttering. The resulting data was analyzed based on the corresponding kymographs, as previously described (Sternberg et al., 2014).
Reaction conditions for E. coli RecA, S. cerevisiae Dmc1, and human Rad51 are presented in the Extended Experimental Procedures. Search complexity calculations presented in Figure 7 are described in the Extended Experimental Procedures.
Supplementary Material
Figure S1, related to Figure 1. Single-stranded DNA curtains and presynaptic complex assembly. (A) Outline of procedure for preparation of 5′ biotinylated ssDNA substrate by rolling circle replication of a circular M13mp18 ssDNA template. (B) Schematic illustrating the procedure for making double-tethered ssDNA curtains bound by RPA-eGFP, followed by the assembly of presynaptic complexes comprised of wild-type Rad51. (C) Illustration showing that the RPA-ssDNA curtains are comprised of approximately seven repeating units of M13mp18 spanning the 12-μm distance between the chromatin patterns on the sample chamber surface. Rad51 binding results in extension of the ssDNA, such that when flow is applied only five of the seven M13mp18 repeats remain visible between the barrier elements.
Figure S2, related to Figure 1. Assembly and stability of the Rad51-ssDNA presynaptic complexes. (A) Wide-field TIRFM image showing RPA-eGFP (green) bound to an ssDNA curtain. (B-F) Kymographs showing presynaptic complex assembly reactions. RPA-eGFP-ssDNA curtains were first incubated with 1 μM wild-type (unlabeled) Rad51 and 2.5 mM ATP. The binding of Rad51 to the ssDNA is revealed as a rapid loss of RPA-eGFP fluorescence signal. The sample chambers were then quickly flushed (1st chase) with buffer containing 1.0 nM RPA-eGFP and either no nucleotide or 2.5 mM of the indicated nucleotide co-factor, followed by a 30-minute incubation. Disassembly of the Rad51-ssDNA presynaptic filaments is revealed by the binding of RPA-eGFP to the exposed ssDNA. The sample chambers were then flushed (2nd chase) with additional buffer containing 0.1 nM RPA-eGFP and no nucleotide co-factor, and incubated for an additional 30-minutes. (G) Quantitation of the Rad51 filament stability in the presence of various nucleotide cofactors. Error bars represent S.D.
Figure S3, related to Figure 1. The duplex DNA substrates require Rad51 for association with the ssDNA molecules. (A) Graph showing the average number of Atto565-DNA1.0 molecules bound per ssDNA molecule for wild-type Rad51 presynaptic complexes, and RPA-ssDNA filaments (i.e. no Rad51 present), as indicated. (B) Dissociation kinetics and corresponding lifetime (C) of Atto565-DNA1.0 bound to Rad51 presynaptic complexes when chased with buffer containing with either 2.5 mM ADP or 2.5 mM ATP (0 mM ADP; right panel). (D) Rad51 dissociation kinetics when chased with 2.5 mM ADP. Error bars in (A-D) represent S.D.; error bars in (B) are 70% confidence intervals obtained by Bootstrap analysis.
Figure S4, related to Figure 1. Influence of dsDNA fragment length on binding to the Rad51-ssDNA presynaptic complexes. (A) Schematic of different duplex DNA substrates; the 35-bp and 18-bp substrates are truncations of the 70-bp sequence Atto565-DNA1.0. (B) and (C) show dissociation kinetics for the 35-bp and 18-bp substrates, as indicated. (D) Dissociation rates and (E) average number of bound dsDNA molecules per 12-μm Rad51-ssDNA presynaptic complex for each of the different length dsDNA substrates. Error bars in (B-D) are 70% confidence intervals obtained from Bootstrap analysis and those in (E) represent S.D.
Figure S5, related to Figure 3. Sequence-dependent dsDNA binding distributions. (A) Schematic depiction of the ssDNA curtains and the predicted relative locations of two different dsDNA substrates (Atto565-DNA2.1 and Atto565-DNA2.1s) bearing a single 8-nt tract of microhomology targeted to different sites on M13mp18. (B) Binding site distribution for Atto565-DNA2.1. Error bars represent 70% confidence intervals generated from Bootstrap analysis of the data, and the dashed lines represent Gaussian fits to the binding distribution data. The (*) marks a missing peak in the distribution of Atto565-DNA2.2 that resides near the upstream chromium barrier; we anticipate that these binding events are under sampled within the data set because of their close proximity to the barriers. (C) Binding site distribution for Atto565-DNA2.1. (D) Comparison of the Gaussian fits to the binding distribution data for each of the different dsDNA substrates.
Figure S6, related to Figure 1, 2, and 4. No evidence for intersegmental transfer of stably associated short duplex DNA fragments. (A) Experimental schematic for testing intersegmental transfer of 70-bp Atto565-DNA1.0. (B) Kymograph showing Atto565-DNA1.0 bound to a single Rad51 presynaptic before, during, and after transient pauses in buffer flow. Scatter plots showing the correlation of the initial and final positions of the bound duplex DNA for experiments where the average flow off time was (C) ∼2-seconds or (D) 1-minute.
Figure S7, related to Figure 7. Microhomology frequency and influence of presynaptic complex organization on search complexity. (A) Calculated frequency for any sequence of microhomology of a defined length for the diploid S. cerevisiae genome; the inset shows the same microhomology frequency data on a semi-log plot. (B) Graph showing the average sequence length necessary to define a unique site with the genomes of various organisms; the x-axis is organized based on relative size of each genome. The dashed lines highlight the average length necessary to define a given sequence as unique within the genomes of E. coli, S. cerevisiae, and humans. Note that these calculations assume a randomized genome of uniform A/T/G/C-content. (C) Schematic illustrating overlapping, mixture and non-overlapping models describing the potential division of the presynaptic complex into functional units of a defined length. All calculations presented in Figure 7 are based upon an overlapping model, which assumes any stretch of ssDNA of a fixed length can be used to interrogate duplex DNA. The non-overlapping model assumes that the recognition elements are functionally and physically separated from one another in precise increments equal to the length of microhomology that is interrogated during the homology search. The mixture model is a combination of the overlapping and non-overlapping organizations. Plots showing the influence of model selection on search complexity for presynaptic complexes that are either (D) 100-nt or (E) 4,000-nt in length.
Acknowledgments
We thank Lorraine Symington, Max Gottesman, Jonathan Dworkin, Hannah Klein, Rodney Rothstein, and members of the Greene and Sung laboratories for comments on the manuscript. We are grateful to Mara Prentiss for sharing results prior to publication, and Mauro Modesti for providing GFP-tagged hRPA expression constructs. This research was funded by NIH grants GM074739 (E.C.G), RO1ES007061 (P.S.), and CA146940 (E.C.G and PS.), and by NSF grant MCB-1154511 (E.C.G). E.C.G. is an HHMI Early Career Scientist.
Footnotes
Supplemental Information: Supplemental Information includes 7 Figures and Extended Experimental Procedures.
Author Contributions: Z.Q. designed and conducted the single-molecule experiments and data analysis. S.R. conducted all theoretical calculations, and assisted in data analysis and experimental design. J.Y.L. assisted with single-molecule experiments, data analysis and experimental design. B.G. expressed and purified human and yeast RPA, and assisted with Rad51 characterization. Y.K., H.N., and W.G. purified yeast and human Rad51, and yeast Dmc1. E.C.G. supervised the project and wrote the manuscript with input from all co-authors.
Publisher's Disclaimer: This is a PDF file of an unedited manuscript that has been accepted for publication. As a service to our customers we are providing this early version of the manuscript. The manuscript will undergo copyediting, typesetting, and review of the resulting proof before it is published in its final citable form. Please note that during the production process errors may be discovered which could affect the content, and all legal disclaimers that apply to the journal pertain.
References
- Adzuma K. No sliding during homology search by RecA protein. J Biol Chem. 1998;273:31565–31573. doi: 10.1074/jbc.273.47.31565. [DOI] [PubMed] [Google Scholar]
- Austin RH, Beeson KW, Eisenstein L, Frauenfelder H, Gunsalus IC. Dynamics of ligand binding to myoglobin. Biochemistry. 1975;14:5355–5373. doi: 10.1021/bi00695a021. [DOI] [PubMed] [Google Scholar]
- Barzel A, Kupiec M. Finding a match: how do homologous sequences get together for recombination? Nat Rev Genet. 2008;9:27–37. doi: 10.1038/nrg2224. [DOI] [PubMed] [Google Scholar]
- Bianco PR, Tracy RB, Kowalczykowski SC. DNA strand exchange proteins: a biochemical and physical comparison. Front Biosci. 1998;3:D570–603. doi: 10.2741/a304. [DOI] [PubMed] [Google Scholar]
- Chen Z, Yang H, Pavletich NP. Mechanism of homologous recombination from the RecA-ssDNA/dsDNA structures. Nature. 2008;453:489–484. doi: 10.1038/nature06971. [DOI] [PubMed] [Google Scholar]
- Chung WH, Zhu Z, Papusha A, Malkova A, Ira G. Defective resection at DNA double-strand breaks leads to de novo telomere formation and enhances gene targeting. PLoS Genet. 2010;6:e1000948. doi: 10.1371/journal.pgen.1000948. [DOI] [PMC free article] [PubMed] [Google Scholar]
- Danilowicz C, Peacock-Villada A, Vlassakis J, Facon A, Feinstein E, Kleckner N, Prentiss M. The differential extension in dsDNA bound to Rad51 filaments may play important roles in homology recognition and strand exchange. Nucleic Acids Res. 2014;42:526–533. doi: 10.1093/nar/gkt867. [DOI] [PMC free article] [PubMed] [Google Scholar]
- De Vlaminck I, van Loenhout MT, Zweifel L, den Blanken J, Hooning K, Hage S, Kerssemakers J, Dekker C. Mechanism of homology recognition in DNA recombination from dual-molecule experiments. Mol Cell. 2012;46:616–624. doi: 10.1016/j.molcel.2012.03.029. [DOI] [PubMed] [Google Scholar]
- Eckert-Boulet N, Lisby M. Regulation of rDNA stability by sumoylation. DNA Repair (Amst) 2009;8:507–516. doi: 10.1016/j.dnarep.2009.01.015. [DOI] [PubMed] [Google Scholar]
- Eckert-Boulet N, Lisby M. Regulation of homologous recombination at telomeres in budding yeast. FEBS Lett. 2010;584:3696–3702. doi: 10.1016/j.febslet.2010.05.037. [DOI] [PubMed] [Google Scholar]
- Forget AL, Kowalczykowski SC. Single-molecule imaging of DNA pairing by RecA reveals a three-dimensional homology search. Nature. 2012;482:423–427. doi: 10.1038/nature10782. [DOI] [PMC free article] [PubMed] [Google Scholar]
- Fraser C, Hanage WP, Spratt BG. Recombination and the nature of bacterial speciation. Science. 2007;315:476–480. doi: 10.1126/science.1127573. [DOI] [PMC free article] [PubMed] [Google Scholar]
- Frauenfelder H, Sligar SG, Wolynes PG. The energy landscapes and motions of proteins. Science. 1991;254:1598–1603. doi: 10.1126/science.1749933. [DOI] [PubMed] [Google Scholar]
- Gibb B, Silverstein TD, Finkelstein IJ, Greene EC. Single-stranded DNA curtains for real-time single-molecule visualization of protein-nucleic acid interactions. Anal Chem. 2012;84:7607–7612. doi: 10.1021/ac302117z. [DOI] [PMC free article] [PubMed] [Google Scholar]
- Gibb B, Ye LF, Gergoudis SC, Kwon Y, Niu H, Sung P, Greene EC. Concentration-dependent exchange of replication protein A on single-stranded DNA revealed by single-molecule imaging. PLoS One. 2014;9:e87922. doi: 10.1371/journal.pone.0087922. [DOI] [PMC free article] [PubMed] [Google Scholar]
- Gladyshev E, Kleckner N. Direct recognition of homology between double helices of DNA in Neurospora crassa. Nat Commun. 2014;5:3509. doi: 10.1038/ncomms4509. [DOI] [PMC free article] [PubMed] [Google Scholar]
- Graham JS, Johnson RC, Marko JF. Concentration-dependent exchange accelerates turnover of proteins bound to double-stranded DNA. Nucleic Acids Res. 2011;39:2249–2259. doi: 10.1093/nar/gkq1140. [DOI] [PMC free article] [PubMed] [Google Scholar]
- Greene EC, Wind S, Fazio T, Gorman J, Visnapuu ML. DNA curtains for high-throughput single-molecule optical imaging. Methods Enzymol. 2010;472:293–315. doi: 10.1016/S0076-6879(10)72006-1. [DOI] [PMC free article] [PubMed] [Google Scholar]
- Hastings PJ, Lupski JR, Rosenberg SM, Ira G. Mechanisms of change in gene copy number. Nat Rev Genet. 2009;10:551–564. doi: 10.1038/nrg2593. [DOI] [PMC free article] [PubMed] [Google Scholar]
- Hawkins M, Malla S, Blythe MJ, Nieduszynski CA, Allers T. Accelerated growth in the absence of DNA replication origins. Nature. 2013;503:544–547. doi: 10.1038/nature12650. [DOI] [PMC free article] [PubMed] [Google Scholar]
- Heyer WD, Ehmsen KT, Liu J. Regulation of homologous recombination in eukaryotes. Annu Rev Genet. 2010;44:113–139. doi: 10.1146/annurev-genet-051710-150955. [DOI] [PMC free article] [PubMed] [Google Scholar]
- Hsieh P, Camerini-Otero CS, Camerini-Otero RD. The synapsis event in the homologous pairing of DNAs: RecA recognizes and pairs less than one helical repeat of DNA. Proc Natl Acad Sci U S A. 1992;89:6492–6496. doi: 10.1073/pnas.89.14.6492. [DOI] [PMC free article] [PubMed] [Google Scholar]
- Jinks-Robertson S, Michelitch M, Ramcharan S. Substrate length requirements for efficient mitotic recombination in Saccharomyces cerevisiae. Mol Cell Biol. 1993;13:3937–3950. doi: 10.1128/mcb.13.7.3937. [DOI] [PMC free article] [PubMed] [Google Scholar]
- Lin Z, Kong H, Nei M, Ma H. Origins and evolution of the recA/RAD51 gene family: evidence for ancient gene duplication and endosymbiotic gene transfer. Proc Natl Acad Sci U S A. 2006;103:10328–10333. doi: 10.1073/pnas.0604232103. [DOI] [PMC free article] [PubMed] [Google Scholar]
- Neale MJ, Keeney S. Clarifying the mechanics of DNA strand exchange in meiotic recombination. Nature. 2006;442:153–158. doi: 10.1038/nature04885. [DOI] [PMC free article] [PubMed] [Google Scholar]
- Pan J, Sasaki M, Kniewel R, Murakami H, Blitzblau HG, Tischfield SE, Zhu X, Neale MJ, Jasin M, Socci ND, et al. A hierarchical combination of factors shapes the genome-wide topography of yeast meiotic recombination initiation. Cell. 2011;144:719–731. doi: 10.1016/j.cell.2011.02.009. [DOI] [PMC free article] [PubMed] [Google Scholar]
- Ragunathan K, Liu C, Ha T. RecA filament sliding on DNA facilitates homology search. Elife. 2012;1:e00067. doi: 10.7554/eLife.00067. [DOI] [PMC free article] [PubMed] [Google Scholar]
- Renkawitz J, Lademann CA, Jentsch S. Mechanisms and principles of homology search during recombination. Nat Rev Mol Cell Biol. 2014;15:369–383. doi: 10.1038/nrm3805. [DOI] [PubMed] [Google Scholar]
- San Filippo J, Sung P, Klein H. Mechanism of eukaryotic homologous recombination. Annu Rev Biochem. 2008;77:229–257. doi: 10.1146/annurev.biochem.77.061306.125255. [DOI] [PubMed] [Google Scholar]
- Sasaki M, Lange J, Keeney S. Genome destabilization by homologous recombination in the germ line. Nat Rev Mol Cell Biol. 2010;11:182–195. doi: 10.1038/nrm2849. [DOI] [PMC free article] [PubMed] [Google Scholar]
- Sing CE, Olvera de la Cruz M, Marko JF. Multiple-binding-site mechanism explains concentration-dependent unbinding rates of DNA-binding proteins. Nucleic Acids Res. 2014;42:3783–3791. doi: 10.1093/nar/gkt1327. [DOI] [PMC free article] [PubMed] [Google Scholar]
- Smith CE, Llorente B, Symington LS. Template switching during break-induced replication. Nature. 2007;447:102–105. doi: 10.1038/nature05723. [DOI] [PubMed] [Google Scholar]
- Sternberg SH, Redding S, Jinek M, Greene EC, Doudna JA. DNA interrogation by the CRISPR RNA-guided endonuclease Cas9. Nature. 2014;507:62–67. doi: 10.1038/nature13011. [DOI] [PMC free article] [PubMed] [Google Scholar]
- Sugiyama T, Zaitseva EM, Kowalczykowski SC. A single-stranded DNA-binding protein is needed for efficient presynaptic complex formation by the Saccharomyces cerevisiae Rad51 protein. J Biol Chem. 1997;272:7940–7945. doi: 10.1074/jbc.272.12.7940. [DOI] [PubMed] [Google Scholar]
- von Hippel PH, Berg OG. Facilitated target location in biological systems. J Biol Chem. 1989;264:675–678. [PubMed] [Google Scholar]
- Weiner BM, Kleckner N. Chromosome pairing via multiple interstitial interactions before and during meiosis in yeast. Cell. 1994;77:977–991. doi: 10.1016/0092-8674(94)90438-3. [DOI] [PubMed] [Google Scholar]
- Xiao J, Lee AM, Singleton SF. Direct evaluation of a kinetic model for RecA-mediated DNA-strand exchange: the importance of nucleic acid dynamics and entropy during homologous genetic recombination. Chembiochem. 2006;7:1265–1278. doi: 10.1002/cbic.200600038. [DOI] [PubMed] [Google Scholar]
Associated Data
This section collects any data citations, data availability statements, or supplementary materials included in this article.
Supplementary Materials
Figure S1, related to Figure 1. Single-stranded DNA curtains and presynaptic complex assembly. (A) Outline of procedure for preparation of 5′ biotinylated ssDNA substrate by rolling circle replication of a circular M13mp18 ssDNA template. (B) Schematic illustrating the procedure for making double-tethered ssDNA curtains bound by RPA-eGFP, followed by the assembly of presynaptic complexes comprised of wild-type Rad51. (C) Illustration showing that the RPA-ssDNA curtains are comprised of approximately seven repeating units of M13mp18 spanning the 12-μm distance between the chromatin patterns on the sample chamber surface. Rad51 binding results in extension of the ssDNA, such that when flow is applied only five of the seven M13mp18 repeats remain visible between the barrier elements.
Figure S2, related to Figure 1. Assembly and stability of the Rad51-ssDNA presynaptic complexes. (A) Wide-field TIRFM image showing RPA-eGFP (green) bound to an ssDNA curtain. (B-F) Kymographs showing presynaptic complex assembly reactions. RPA-eGFP-ssDNA curtains were first incubated with 1 μM wild-type (unlabeled) Rad51 and 2.5 mM ATP. The binding of Rad51 to the ssDNA is revealed as a rapid loss of RPA-eGFP fluorescence signal. The sample chambers were then quickly flushed (1st chase) with buffer containing 1.0 nM RPA-eGFP and either no nucleotide or 2.5 mM of the indicated nucleotide co-factor, followed by a 30-minute incubation. Disassembly of the Rad51-ssDNA presynaptic filaments is revealed by the binding of RPA-eGFP to the exposed ssDNA. The sample chambers were then flushed (2nd chase) with additional buffer containing 0.1 nM RPA-eGFP and no nucleotide co-factor, and incubated for an additional 30-minutes. (G) Quantitation of the Rad51 filament stability in the presence of various nucleotide cofactors. Error bars represent S.D.
Figure S3, related to Figure 1. The duplex DNA substrates require Rad51 for association with the ssDNA molecules. (A) Graph showing the average number of Atto565-DNA1.0 molecules bound per ssDNA molecule for wild-type Rad51 presynaptic complexes, and RPA-ssDNA filaments (i.e. no Rad51 present), as indicated. (B) Dissociation kinetics and corresponding lifetime (C) of Atto565-DNA1.0 bound to Rad51 presynaptic complexes when chased with buffer containing with either 2.5 mM ADP or 2.5 mM ATP (0 mM ADP; right panel). (D) Rad51 dissociation kinetics when chased with 2.5 mM ADP. Error bars in (A-D) represent S.D.; error bars in (B) are 70% confidence intervals obtained by Bootstrap analysis.
Figure S4, related to Figure 1. Influence of dsDNA fragment length on binding to the Rad51-ssDNA presynaptic complexes. (A) Schematic of different duplex DNA substrates; the 35-bp and 18-bp substrates are truncations of the 70-bp sequence Atto565-DNA1.0. (B) and (C) show dissociation kinetics for the 35-bp and 18-bp substrates, as indicated. (D) Dissociation rates and (E) average number of bound dsDNA molecules per 12-μm Rad51-ssDNA presynaptic complex for each of the different length dsDNA substrates. Error bars in (B-D) are 70% confidence intervals obtained from Bootstrap analysis and those in (E) represent S.D.
Figure S5, related to Figure 3. Sequence-dependent dsDNA binding distributions. (A) Schematic depiction of the ssDNA curtains and the predicted relative locations of two different dsDNA substrates (Atto565-DNA2.1 and Atto565-DNA2.1s) bearing a single 8-nt tract of microhomology targeted to different sites on M13mp18. (B) Binding site distribution for Atto565-DNA2.1. Error bars represent 70% confidence intervals generated from Bootstrap analysis of the data, and the dashed lines represent Gaussian fits to the binding distribution data. The (*) marks a missing peak in the distribution of Atto565-DNA2.2 that resides near the upstream chromium barrier; we anticipate that these binding events are under sampled within the data set because of their close proximity to the barriers. (C) Binding site distribution for Atto565-DNA2.1. (D) Comparison of the Gaussian fits to the binding distribution data for each of the different dsDNA substrates.
Figure S6, related to Figure 1, 2, and 4. No evidence for intersegmental transfer of stably associated short duplex DNA fragments. (A) Experimental schematic for testing intersegmental transfer of 70-bp Atto565-DNA1.0. (B) Kymograph showing Atto565-DNA1.0 bound to a single Rad51 presynaptic before, during, and after transient pauses in buffer flow. Scatter plots showing the correlation of the initial and final positions of the bound duplex DNA for experiments where the average flow off time was (C) ∼2-seconds or (D) 1-minute.
Figure S7, related to Figure 7. Microhomology frequency and influence of presynaptic complex organization on search complexity. (A) Calculated frequency for any sequence of microhomology of a defined length for the diploid S. cerevisiae genome; the inset shows the same microhomology frequency data on a semi-log plot. (B) Graph showing the average sequence length necessary to define a unique site with the genomes of various organisms; the x-axis is organized based on relative size of each genome. The dashed lines highlight the average length necessary to define a given sequence as unique within the genomes of E. coli, S. cerevisiae, and humans. Note that these calculations assume a randomized genome of uniform A/T/G/C-content. (C) Schematic illustrating overlapping, mixture and non-overlapping models describing the potential division of the presynaptic complex into functional units of a defined length. All calculations presented in Figure 7 are based upon an overlapping model, which assumes any stretch of ssDNA of a fixed length can be used to interrogate duplex DNA. The non-overlapping model assumes that the recognition elements are functionally and physically separated from one another in precise increments equal to the length of microhomology that is interrogated during the homology search. The mixture model is a combination of the overlapping and non-overlapping organizations. Plots showing the influence of model selection on search complexity for presynaptic complexes that are either (D) 100-nt or (E) 4,000-nt in length.