

Abstract
Immunoaffinity enrichment of peptides coupled to targeted, multiple reaction monitoring-mass spectrometry (immuno-MRM) has recently been developed for quantitative analysis of peptide and protein expression. As part of this technology, antibodies are generated to short, linear, tryptic peptides that are well-suited for detection by mass spectrometry. Despite its favorable analytical performance, a major obstacle to widespread adoption of immuno-MRM is a lack of validated affinity reagents because commercial antibody suppliers are reluctant to commit resources to producing anti-peptide antibodies for immuno-MRM while the market is much larger for conventional technologies, especially Western blotting and ELISA. Part of this reluctance has been the concern that affinity reagents generated to short, linear, tryptic peptide sequences may not perform well in traditional assays that detect full-length proteins. In this study, we test the feasibility and success rates of generating immuno-MRM monoclonal antibodies (mAbs) (targeting tryptic peptide antigens) that are also compatible with conventional, protein-based immuno-affinity technologies. We generated 40 novel, peptide immuno-MRM assays and determined that the cross-over success rates for using immuno-MRM monoclonals for Western blotting is 58% and for ELISA is 43%, which compare favorably to cross-over success rates amongst conventional immunoassay technologies. These success rates could most likely be increased if conventional and immuno-MRM antigen design strategies were combined, and we suggest a workflow for such a comprehensive approach. Additionally, the 40 novel immuno-MRM assays underwent fit-for-purpose analytical validation, and all mAbs and assays have been made available as a resource to the community via the Clinical Proteomic Tumor Analysis Consortium's (CPTAC) Antibody (http://antibodies.cancer.gov) and Assay Portals (http://assays.cancer.gov), respectively. This study also represents the first determination of the success rate (92%) for generating mAbs for immuno-MRM using a recombinant B cell cloning approach, which is considerably faster than the traditional hybridoma approach.
The ability to measure specific proteins of interest is critical to the basic sciences and clinical research. To this end, immunoaffinity-based assays such as Western blotting, immunohistochemistry, and ELISAs have been in use for decades, but have several shortcomings including difficulty in multiplexing, a lack of standardization, and a semi-quantitative nature (e.g. Western blotting and immunohistochemistry) (1). Recently, there has been tremendous growth in using the sensitive, specific, multiplexable, and quantitative technology, multiple reaction monitoring-mass spectrometry, to measure tryptic peptides as stoichiometric surrogates for the detection of proteins from complex samples (2–7). The sensitivity of targeted multiple reaction monitoring (MRM)1 is enhanced 103–104-fold by coupling it upstream with immunoaffinity enrichment of tryptic peptides in a peptide immuno-MRM assay (8–14). Advantages of immuno-MRM include high specificity, multiplexability (15, 16), and standardization, enabling high inter-laboratory reproducibility (17).
The extent to which antibodies generated for immuno-MRM could support widely-used conventional immunoassay formats has not been investigated. This question is important because a lack of validated affinity reagents is a major obstacle to widespread implementation of immuno-MRM, which has considerable analytical advantages over traditional methods. Because the market for immuno-MRM is at present small relative to that for widely adopted conventional immunoassay formats (e.g. Western blotting and ELISA), commercial antibody suppliers are not incentivized to develop content specifically for immuno-MRM assays. Thus, we reasoned that if antibodies could be generated that are capable of supporting both conventional technologies as well as the emerging MRM platform, this might spark commercial interest by increasing the value of the antibodies, ultimately providing reagents to foster widespread implementation of immuno-MRM.
Antigens used for antibody generation in conventional assays typically consist of either purified proteins, protein segments of 100–150 amino acids, or synthetic peptide sequences (18, 19). Antigenic prediction algorithms are often used to identify regions of target proteins that are most likely to be exposed on the surface of the protein and, thus, accessible for antibody binding. In contrast, proteotypic peptide antigens are selected for development of antibodies for immuno-MRM based on their uniqueness in the genome and their robust detectability by mass spectrometry, without regard to protein structure (because the protein will be proteolyzed during the assay). Because some widely used conventional immunoassay formats (e.g. Western blotting and indirect ELISA) detect proteins in their denatured form, it was reasonable to ask whether antibodies raised against short, linear, tryptic peptides would also work in these alternative formats.
Here, we develop, characterize, and make publicly available 40 novel immuno-MRM assays and the associated monoclonals, and report the success rate of generating recombinant monoclonal antibodies (mAbs) that work in immuno-MRM assays. Furthermore, we determine the cross-over success rates of applying the mAbs in Western blotting and indirect ELISA assays.
EXPERIMENTAL PROCEDURES
Selection of Protein and Peptide Targets for Monoclonal Antibody Generation
Recombinant monoclonal antibody development was attempted for 39 targets (from 27 proteins, with 1–3 peptides per protein) that we previously used in an evaluation of overall efficiency of production of polyclonal anti-peptide antibodies (12) (supplemental Table S1). Only targets that had yielded polyclonal-based assays with lower detection levels of ≤0.5 fmol peptide per μl of human plasma (≤100 ng/ml protein in plasma) were selected for monoclonal production. The peptides were required to be fully tryptic, unique to a given gene product (proteotypic), between 8–22 amino acids in length, and have no known post-translational modifications or polymorphisms according to Swiss-Prot. For the protein targets mucin-1 (MUC1), thyroid-stimulating hormone subunit beta (TSHB), and choriogonadotropin subunit beta (CGB), mAbs were generated using a hybridoma approach, and no polyclonal antibodies had been generated prior to the current study (supplemental Table S1).
Synthetic Peptides for Immunization and LC-MRM-MS
Immunogens consisted of the target tryptic peptides (>80% purity, synthesized by Chinese Peptide Company, Hangzhou, China) that had been conjugated to keyhole lympet hemocyanin (KLH) and ovalbumin via an N-terminal cysteine and succinimidyl trans-4-(maleimidylmethyl)cyclohexane-1-carboxylate (SMCC) (conjugation performed by Epitomics-an Abcam Company, Burlingame, CA). Light and stable isotope-labeled heavy synthetic peptides for MRM analyses were purchased from Thermo Biopolymers (Germany) or New England Peptide (Gardner, MA) at >95% purity (measured by HPLC). Cysteine residues were carbamidomethylated in both the light and heavy peptide versions, and the heavy peptides' C-terminal lysine or arginine residues were uniformly 13C and 15N labeled; for the SYLVGFSV peptide, the C-terminal valine was 13C and 15N labeled. Amino acid analysis was performed at New England Peptide to determine peptide concentrations.
Recombinant Monoclonal Antibody Generation
Rabbit Immunization and Titer Testing
Rabbit immunization and antibody generation was performed by Epitomics–an Abcam Company. The 39 target peptides were divided into eight multiplexed immunogen groups, and two New Zealand White rabbits were immunized per group using a standard protocol of five injections and two bleeds for each rabbit. Three subcutaneous injections were performed using the multiplexed KLH-immunogens, followed by two subcutaneous injections using the multiplexed ovalbumin-immunogens. At the time of each injection, an immunogen aliquot was thawed and combined with Complete Freund's Adjuvant (initial immunization), or with incomplete Freund's Adjuvant (for the subsequent injections). Serum bleeds of 7.5 ml were obtained after the fourth and fifth immunizations (15 ml total). For each peptide target group, the rabbit with the higher titer, as measured by peptide ELISA OD, was chosen for monoclonal antibody generation as described below.
Lymphocyte Isolation and Antibody Screening by Peptide ELISA
Lymphocytes were separated from 25 ml of blood using Lympholyte isolation buffer (TBD Sciences, Tianjin, China), and the lymphocytes were counted and plated into 96-well plates. Supernatant samples were harvested after 6–9 days of incubation and tested for ELISA activity against the corresponding tryptic peptide antigens (not containing the N-terminal Cys) of an immunogen group (see above). Clones with ODs greater than 0.3 were considered putatively positive and were further confirmed and ranked by peptide ELISA using decreasing concentrations of antigens, as follows. The peptide ELISAs were performed as reported by Razavi et al. (20). Briefly, 50 or 2.5 ng of a tryptic peptide was added to wells of an ELISA plate, and the contents were air dried. The wells were washed once using 100 μl of TBST (TBS plus 0.1% Tween 20) and blocked using 60 μl of TBST-BSA for 1 h at room temperature (RT). Fifty microliters of a lymphocyte supernatant sample was added, and the plate was incubated at RT for 2 h. The plate was washed twice with 100 μl TBST, 50 μl of AffiniPure Goat anti-Rabbit IgG (111–035-003, Jackson Immuno Research, West Grove, PA) was added, and the plate was incubated for 30 min at RT. The plate was washed three times with 100 μl TBST, 50 μl of p-nitrophenyl phosphate, disodium salt (PNPP, 34045, Pierce) was added, and color was allowed to develop for 15 min at RT. Fifty microliters of 3 m NaOH was used to stop the reaction, after which the OD was measured at 405 nm. Clones specific for one peptide but negative against other peptides of an immunogen group were considered positive when 50 ng/well of peptide was coated on ELISA plates. The OD readings at the lowest antigen concentration (2.5 ng/well, which was determined by antigen titration assays using polyclonal antiserum against the peptides) in the ELISA assay were then used to rank the relative affinities of these clones. The 1–2 clones with the highest OD readings at the 2.5 ng/well concentration were chosen for IgG cloning for each peptide (additional clones-up to four total-were selected if initial cloning was not successful).
B-cell Recombinant Cloning, Expression, and Peptide ELISA Screening of Rabbit mAbs
Poly-A messenger RNA (mRNA) was extracted from each clone's lysate and was used for reverse transcription using TurboCapture mRNA Kits (Qiagen, Valencia, CA) following the manufacturer's protocols. The resulting cDNA was used for PCR amplification. Briefly, DNA fragments encoding variable heavy chain region and variable and constant light chain region IgGs were amplified by PCR using proprietary primers specific for the rabbit IgG sequences. Successful amplification was confirmed by gel electrophoresis. The cloning and expression of recombinant mAbs was done in modified pTT5 vectors (the pTT5 sequence is available at www.addgene.org). The heavy chain PCR products containing the variable and CH1 regions were digested with KpnI/HindIII and cloned into vector pTT5 VH containing the remaining CH gene (see supplemental Information S1). The full-length light chain PCR products were digested with NotI/HindIII and cloned into vector pTT5 Vk. The resulting recombinants were transformed into E. coli Top10 competent cells (Invitrogen, Carlsbad, CA). Four colonies were picked for each heavy and light chain, and plasmids were prepared using AxyPrepTM Plasmid Miniprep Kits (Axygen, Union City, CA) following the manufacturer's instructions. Plasmids were digested with the corresponding restriction enzymes for heavy and light chain, and the presence of correctly-sized inserts was verified by gel electrophoresis. All possible 16 pairwise combinations of the heavy and light chain regions were transfected into HEK293 cells and tested by peptide ELISA. Supernatant samples showing high activity by peptide ELISA (no significant decrease in OD after 1:40 diluted samples as compared with undiluted samples) were identified and further tested by immuno-MRM. Overall, 57 recombinant clones to 38 peptide targets (representing 26 protein targets, supplemental Table S1) were advanced to testing by immuno-MRM (see below). No peptide ELISA-positive clones were obtained for peptide target TAQGSLSLK to protein EIF3H. The sequences of the final selected clones are listed in supplemental Information S2.
Production and Purification of Best Recombinant mAb Clones
Once final clones were chosen based on immuno-MRM-MS (see below), the final clones were produced and purified as follows. HEK293 cells were transfected with 100 μg total plasmid DNA (50 μg heavy chain + 50 μg light chain) using 293fectin™ Transfection Reagent (12347–019, Invitrogen) in 100 ml culture and incubated for 24 h at 37 °C and 5% CO2. After the 24-hour incubation, 0.5% Tryptone N1 was added to the cells and the incubation was continued for 5 days. Cell culture supernatants were then harvested by centrifugation and subjected to protein A purification. Culture supernatants were incubated with protein A gel (10–2500-03, RepliGen, Waltham, MA) and binding buffer (21007, Pierce, Thermo Scientific, Rockford, IL) overnight at 4 °C. The protein A gel was then packed into a column and washed with PBS until the flow through had OD280 < 0.05. The antibodies were eluted with Antibody Elution Buffer (21009, Pierce) into 100 μl neutralizing buffer (1 m Tris hydrochloride solution, pH 8.0). Eluted fractions were then pooled and dialyzed against PBS overnight at 4 °C.
Hybridoma Monoclonal Antibody Generation for Targets TSHB, CGB, and MUC1
Rabbit Immunization and Titer Testing
Hybridoma antibody generation was performed by Epitomics–an Abcam Company. For each protein target, two rabbits were immunized with groups of five or eight peptide targets (five for the protein thyroid-stimulating hormone subunit beta (TSHB), eight for both proteins choriogonadotropin subunit beta (CGB) and Mucin-1 (MUC1), for a total of 21 immunogens, supplemental Table S1). The immunizations were performed as described above. The titers were tested by ELISA using all five or eight antigen peptides, and for each rabbit pair, the rabbit with the highest titer for a combination of four of the five or eight peptides was chosen for subsequent polyclonal antibody purification and splenectomy.
Rabbit Polyclonal Antibody Purification and Testing By Immuno-MRM
Polyclonal antibodies were affinity-purified using those four antigen peptides that had shown the highest results during peptide ELISA titer testing. The polyclonals were tested by immuno-MRM using each of the four antigen peptides, and hybridoma monoclonal antibody generation was subsequently performed for those two (of four) antigen peptides per protein that yielded the highest peptide detection by immuno-MRM.
Hybridoma Generation and Screening by Peptide ELISA and Immuno-MRM
Lymphocytes were isolated from the spleens and fused with immortalized rabbit plasmacytoma cells to generate hybridomas. Primary clone hybridoma supernatants were screened by peptide ELISA, and between five and 23 ELISA-positive primary clones per peptide target were subsequently tested by immuno-MRM (see below). The top two primary clone hybridomas (based on immuno-MRM) were subcloned, and the subclone supernatants were in turn screened by peptide ELISA. Between six and 10 subclones were obtained per primary clone, and each subclone supernatant's mAb concentration was determined by ELISA as follows. ELISA plates were coated overnight at 4 °C with 50 μl of 2 μg/ml of AffiniPure Goat anti-Rabbit IgG (111–005-003, Jackson Immuno Research, West Grove, PA), washed once with 100 μl of TBST (TBS plus 0.1% Tween 20) per well, and blocked for 1 h with 60 μl of 1% BSA in TBST at room temperature (RT). A ChromPure rabbit IgG standard (011–000-003, Jackson ImmunoResearch Laboratories) dilution series was prepared, covering a range of 3000 ng/ml to 4.12 ng/ml (using 3x serial dilution), and 50 μl of each standard sample was added to the plates in duplicate. Fifty microliters of either neat or 1:40 diluted hybridoma supernatant was then added in duplicate (four wells total per supernatant), and the plates were incubated for 2 h at RT. Each well was washed twice with 100 μl of TBST, and 50 μl of an alkaline phosphatase labeled secondary antibody (31341, Pierce) was added to each well, followed by a 30 min incubation at RT. The plates were washed three times using 100 μl of TBST, 50 μl of p-nitrophenyl phosphate, disodium salt (PNPP, 34045, Pierce) was added per well, and color development was allowed to proceed for 15 min. The reaction was stopped using 50 μl of 3 N NaOH, and the plate was read at 405 nm. The subclone supernatants were subsequently screened by immuno-MRM as was done for the primary clones (see below). The best subclone (by immuno-MRM) was chosen for production and protein A purification.
Human Plasma Tryptic Digestion
Human plasma was denatured, reduced, alkylated, and then digested using trypsin as described previously (21). Briefly, the plasma (P9523–5 ml, Sigma, St. Louis, MO) was reconstituted in 5 ml of distilled water, and urea, Tris, and dithiothreitol were added to arrive at final concentrations of 8 m, 50 mm (pH 8.0), and 10 mm, respectively. After 1 h of shaking at 60 °C, iodoacetamide was added (15 mm final concentration) and alkylation was allowed to proceed in the dark for 30 min at room temperature (RT). The urea concentration was subsequently decreased to 1 m by addition of 20 mm Tris, pH 8.0, and trypsin (T1426–250MG, Sigma) was added to yield an enzyme-to-protein ratio of 1:20 (w/w), followed by an overnight incubation at 37 °C with shaking. The digested sample was then desalted using a Supelco Discovery DSC-18 SPE column (52607-U, Sigma), dried using a SpeedVac, and reconstituted in 5 ml of 1×PBS. One milliliter aliquots were stored at −80 °C until use. Upon thawing an aliquot, lima bean trypsin inhibitor (LS002829, Worthington Biochemical Corporation, Lakewood, NJ) was added at a 1:2 trypsin inhibitor:trypsin ratio (w/w) to avoid potential digestion of the antibodies during the immunoaffinity enrichment.
Immuno-MRM
Antibody Coupling and Immobilization to Protein G Magnetic Beads
For the reverse response curve and intra- and inter-day repeatability studies, the antibodies were covalently coupled to 1 μm Protein G magnetic beads (custom-made, Dynabeads® MyOne Protein G, supplied as 30 mg/ml in PBS with 0.02% sodium azide, Life Technologies) as described previously (11). Each antibody was coupled and immobilized separately using an antibody-bead ratio of 1 μg antibody to 1.5 μl beads. In microcentrifuge tubes, 150 μl of beads were washed twice with 500 μl 1×PBS (pH 7.0), followed by 1×PBS and CHAPS (final concentration 0.03%) (CHAPS, 28300, Thermo Scientific). One hundred micrograms of mAb were added to arrive at a final volume of 1.0 ml, and the tubes were tumbled overnight at 4 °C. Automated immobilization was subsequently performed using a KingFisher magnetic bead handling platform (5400500, Thermo Scientific, Waltham, MA) equipped with a deep well magnet head and using 96 deep well plates (95040450, Thermo Scientific) and 96 tip combs for deep well magnets (97002534, Thermo Scientific). The KingFisher was moved into a fume hood for the immobilization procedure because of the toxicity of DMP (dimethyl pimelimidate dihydrochloride, D8388, Sigma), triethanolamine (T1377, Sigma), and monoethanolamine (411000, Sigma). Eight plates were used, with the following contents per plate and well, and using the following mixing times: plate 1, 1.0 ml of the antibody-coupled beads, transferred from the microcentrifuge tubes into the plate (5 min); plate 2, 1.0 ml of freshly-made 20 mm DMP in 200 mm triethanolamine, pH 8.5 (30 min); plate 3, 1.0 ml of 150 mm monoethanolamine (30 min); plates 4 and 5, 1.0 ml of 5% acetic acid/0.03% CHAPS (5 min); plate 6, 1.0 ml of 1×PBS/0.03% CHAPS (5 min); plate 7, 200 μl of 1×PBS/0.03% CHAPS/0.1% sodium azide (5 min); plate 8, tip comb. A medium mixing speed was used for each plate. The antibody-beads were left in the 200 μl of 1×PBS/0.03% CHAPS/0.1% sodium azide in plate 7 at the end of the method (at a final antibody concentration of 0.5 μg/μl). The individual antibody-bead suspensions were subsequently transferred to separate, new 1.5 ml screw-cap tubes (72.692, Sarstedt, Nümbrecht, Germany) and kept at 4 °C until use.
Peptide Immunoaffinity Enrichment
Peptide immunoaffinity enrichment for all experiments except the hybridoma mAb screening (see below) consisted of overnight incubations of the mAbs (1 μg of each antibody, except where noted) with spiked-in peptide standards, digested plasma as background matrix (10 μl plasma per capture), and Protein G magnetic beads, followed by automated washing and elution of the peptides from the antibodies using the KingFisher magnetic bead handling platform in a PCR magnetic head format, see below.
For the hybridoma screening experiments, an analogous protocol was followed as reported previously for screening mouse hybridoma supernatants (21). Briefly, the enrichment, washing, and elution steps were performed using the KingFisher platform with 100 μl of the mAb supernatants being initially incubated with sheep-anti-rabbit magnetic beads (11203D, Invitrogen) for 1 h (using 25 μl or 20 μl of beads for the primary and subclone screening, respectively), followed by incubation with 100 fmol of the heavy target peptides spiked into 10 μl of digested plasma + 1×PBS/0.03% CHAPS for 2 h. The samples were eluted using 100 fmol of the light target peptides spiked into 25 μl of 5% acetic acid. Ten microliters of each eluate was analyzed by LC-MRM-MS.
For screening the recombinant clones, the antibodies were tested using three levels of spiked-in heavy peptides (0.05, 0.5, and 5 fmol per microliter of plasma) to allow the assignment of assay grades (12) based on the detection of the heavy peptides in the LC-MRM-MS experiments. The captures at each level were performed in duplicate, and light peptides were spiked in at a constant concentration of 10 fmol/μl. This approach allowed for a determination of approximate detection levels without interference from the endogenous peptide. Each capture sample contained 10 μl of digested human plasma, 1 μg of each antibody, 3 μl of Protein G magnetic beads (100–04D, Invitrogen) per microgram of antibody, light and heavy peptides, 1×PBS (pH 7.0), and 0.03% CHAPS (final concentration). For two peptide targets (supplemental Table S1), only 0.1 μg of mAb and 1.5 μl of Protein G beads per mAb were used per capture because of limited antibody amounts. The mAbs were tested in plexes of between two and six antibodies per capture, depending on the antibody concentrations, while keeping the total capture volume to 200 μl. The captures were performed in 96-well plates (97002540, Fisher Scientific) with overnight tumbling at 4 °C. As described previously (11), the KingFisher platform was used to wash the beads, coupled antibodies, and captured peptides (twice with 250 μl of 1×PBS/0.03% CHAPS, pH 7.0, and once with 250 μl of 1/10×PBS/0.03% CHAPS, pH 7.0), and to elute the peptides with 25 μl of 5% acetic acid. A PCR plate (HSP9601, BioRad, Hercules, CA) was used for the peptide elution step. Ten microliters of an eluate was injected for an LC-MRM-MS analysis.
For the reverse response curve experiments, eight levels of heavy peptides (0.0125, 0.05, 0.2, 0.8, 4, 20, 100, and 500 fmol per microliter of plasma) were added to a plasma digest background by serial dilution, and light peptide was spiked at a constant concentration of 10 fmol/μl. Captures at these eight concentrations were performed in triplicate. A blank capture sample that contained light peptide and no heavy peptide was captured five times. Each capture used 10 μl of plasma and 1 μg of each mAb. Ten microliters of 1 m Tris (T2694, Sigma, pH 8.0) were added to ensure a pH between 7.5–8.0, and 1×PBS/0.03% CHAPS (pH 7.0) was added to arrive at a total capture volume of 250 μl. Initial experiments were performed using all 40 mAbs multiplexed into one group; the experiments were repeated for a group of 11 mAbs and separately for target SYLVGFSV (see “Results”). The captures and washes were performed in 96-well plates as for the recombinant clone screening above, and the elutions were performed using 25 μl of 3% acetonitrile/5% acetic acid. The samples were frozen at −80 °C until analysis. Ten microliters of an eluate was injected for an LC-MRM-MS experiment.
For the intra- and inter-day repeatability experiments, captures were performed on five different days and using three different heavy peptide spike levels (low, medium, and high) in a plasma digest per day, with the different levels being defined as 3x, 50x, and 500x of the lower limit of quantification (LLOQ) that was determined in the response curves for each assay (see below). The light peptides were spiked at a constant concentration of 10 fmol/μl, and 10 μl of plasma digest and 1 μg of each antibody were used per capture. All 40 mAbs were multiplexed into one group for each capture, with the overnight incubations and subsequent washes and elutions being performed as for the response curve experiments above. The captures at each heavy spike level were performed in triplicate (that is, nine separate captures per day).
Nano-Liquid Chromatography-Mass Spectrometry
For the hybridoma and recombinant clone screening experiments, the same LC-MRM-MS system was used as previously described (12). Briefly, liquid chromatography was performed using an Eksigent NanoLC 2D system with an Eksigent AS1 autosampler (Eksigent Technologies, Dublin, CA). Mobile phases A and B for LC channels 1 and 2 consisted of 0.1% formic acid (1.11670.1000, EMD Millipore) in water (W6–4, Fisher Scientific), and 0.1% formic acid in 90% acetonitrile (A955–4, Fisher Scientific) in water, respectively. Samples were loaded onto a 300 μm inner diameter (ID) × 5 mm LC Packings trap column (Acclaim PepMap 100 C18, 5 μm, 100 Å, 160454, Dionex, Sunnyvale, CA) for 1.5 min at 10.0 μl/min (3% B) using LC channel 1, and a 10 min gradient was then developed from 3–40% B at 300 nL/min (LC channel 2) over a 10 μm tip ID, 75 μm capillary ID, 360 μm outer diameter (OD) PicoFrit column (PF360–75-10-N-5, New Objective, Woburn, MA) packed to 10 cm with ReproSil-Pur C18-AQ, 3 μm (Dr. Maisch GmbH, Ammerbuch, Germany). Mobile phase B was subsequently increased to 90% over 2 min, held at 90% for 7 min, and then returned to 3% B to re-equilibrate the analytical column for 16 min. The flow-rate was increased to 400 nL/min for 10 of the 16 min to aid the re-equilibration, and the trap-column was back-flushed at 3% B using LC channel 1 at 10.0 μl/min during the last 2 min of a run. The Eksigent AS1 autosampler and NanoLC 2D were connected to a 4000 QTRAP hybrid triple quadrupole-ion trap mass spectrometer via a nano electrospray interface (AB Sciex, Foster City, CA), and the mass spectrometer was operated in positive ion mode. The 4000 QTRAP instrument settings consisted of an ion spray voltage of 2.3 kV, an interface heater temperature of 150 °C, curtain gas and ion source gas settings of 20 and 10, respectively, and a medium collision gas setting. The Q1 and Q3 resolutions were set to unit, settling time was 0 milliseconds, and the pause between mass ranges was 5.007 milliseconds. The MRM-MS acquisition methods included between six and 14 transitions per peptide pair (three to seven for each light or heavy peptide). Initial peptide characterization and optimization experiments were carried out by injecting 50 fmol of a synthetic peptide mix (in 3% acetonitrile/0.1% formic acid) onto the LC-MRM-MS system. Collision energy (CE) and declustering potential (DP) values were generally derived by using the linear regression values provided in Skyline (22, 23). For some peptides, the CE values were also individually optimized if the peptides' intensities were relatively low (<5 × 10⁴ cps) when using the regression values. Supplemental Table S2 lists the protein and peptide targets along with the precursor and fragment ions targeted and the CE and DP values used for each transition for the mAb screening experiments.
For the reverse response curve and the intra- and inter-day repeatability experiments, the same autosampler and NanoLC 2D systems as above were used, but they were connected to a 5500 QTRAP hybrid triple quadrupole-ion trap mass spectrometer (AB Sciex) via an Advance CaptiveSpray ion source (Bruker, Billerica, MA). The mobile phases and trap column were the same as above, whereas the analytical column consisted of a 75 μm ID, 360 μm OD IntegraFrit column (IF360–75-50-N-5, New Objective) packed to 10 cm with ReproSil-Pur C18-AQ, 3 μm. The column was connected to a 20 μm ID CaptiveSpray tapered tip (SS9/25000/20, Bruker) in the CaptiveSpray source. The samples were loaded onto the trap column at 6.0 μl/min (3% B) for 4 min, and then an 18 min gradient was developed from 5–50% B at 300 nL/min, followed by an increase to 90% B over 1 min. After 1 min at 90%, mobile phase B was returned to 5%, with the flow rate being held at 300 nL/min for 5 min, and then increased to 350 nL/min for another 9 min at the end of the run. The trap-column was back-flushed during the last 2 min of a run. The analytical column was heated to 45 °C to aid with retention time reproducibility. The 5500 QTRAP ion spray voltage, interface heater temperature, and collision gas settings were 1.3 kV, 110 °C, and medium, respectively. No curtain or ion source gases were used with the CaptiveSpray source. The Q1 and Q3 resolutions were set to Unit, the settling time was 0 milliseconds, and the pause between mass ranges was 5.007 milliseconds. The MRM-MS acquisition methods included between six and 14 transitions per peptide pair (three to seven for each light or heavy peptide). Collision energies (CEs) were calculated by Skyline depending on the molecular weight and charge state of the peptides by using slope and intercept parameters of 0.0528 and −2.1786 for charge state +2, and 0.0448 and −1.2844 for charge state +3; these values had been previously optimized for this particular 5500 QTRAP instrument. For peptide SYLVGFSV, the +1 charge state was used because it did not contain a C-terminal R or K. The CEs for its transitions were optimized using Skyline's CE optimization feature (22). A static declustering potential (DP) of 100 V was used for all transitions. Supplemental Table S3 lists the protein and peptide targets along with the precursor and fragment ions targeted and the CE values used for each transition for these experiments on the 5500 QTRAP. Because of the large number of transitions, scheduled acquisition methods were used, with an MRM detection window of 120 s and a target scan time of 1 s. The response curve samples were run in the following order: three blank captures, then the first capture repeat samples from low to high concentrations, with a blank run (injecting just 3% acetonitrile/5% acetic acid) in between each sample run to avoid signal carry-over >2%; then, washes and blank runs until the heavy peptide signals were at noise levels before running the fourth blank capture sample and then the second capture repeat samples from low to high, etc. The repeatability samples on each day were run in the order low-low-low, medium-medium-medium, and high-high-high, with a blank (3% acetonitrile/5% acetic acid) run in between each sample (carry-over from the high samples prevented the repeatability samples from being run in a more randomized order).
LC-MRM-MS Data Analysis
All LC-MRM-MS data were analyzed using Skyline (23). All data were manually inspected to ensure that the correct peptide peaks were integrated. The correct light and heavy peaks for a peptide were identified based on coinciding chromatographic retention times, consistent relative ratios of the light and heavy peptides' transitions, and agreement of the relative transition ratios with control experiments for which the synthetic peptides were analyzed in 3% acetonitrile/5% acetic acid. Transitions that had interferences (i.e. as evidenced by obvious peak shoulders or by incorrect transition ratios) were removed from further analyses. Peak areas were calculated as the sum of “area” and “background” as reported by Skyline.
For the hybridoma mAb screening, the primary clones and subclones were ranked based on their heavy-to-light peptide peak area ratios. For the subclone ranking, the ratios were also normalized by antibody concentration of each supernatant (see Hybridoma Generation and Screening by Peptide ELISA and Immuno-MRM). The light peptides for the hybridoma screening were spiked in after the captures, and hence the light peptide level was constant across the hybridoma samples.
Antibody assays during the recombinant clone screening were graded based on the detection of the heavy or light peptides as described previously (12). Assay grades A, A-B, B, and C corresponded to the detection of 0.05, slightly higher than 0.05, 0.5, and 5 fmol of heavy peptide per microliter of plasma, respectively. (Some of the assays were very close to being classified at the lowest, 0.05 fmol/μl peptide in plasma level, yet did not strictly meet the intensity thresholds at that level (see below); to get a sense of the number of these assays, we assessed them as having a detection level only slightly higher than 0.05 fmol/μl (grade A-B).) A grade of D was assigned to assays for which no heavy peptide was detected, but for which the light peptide, spiked at 10 fmol/μl, was detected. Assays for which neither light nor heavy peptides were detected were considered failed assays. More specifically, both the most intense and second-most intense transitions of a heavy peptide had to be observed (after Savitzky-Golay smoothing) at 1000 and 500 counts-per-second (cps) intensity in two replicate immuno-MRM experiments to be deemed “robustly detected” at a certain grade level (in the case of an A-B grade assay, the thresholds were 500 and 250 cps for the most and second-most intense transitions, respectively).
For the response curves, the limit of detection (LOD) for each assay was calculated based on the average of the heavy-to-light peak area ratios (i.e. noise for the heavy integrated areas) of the five blank samples plus three times the standard deviation of the ratios. The response curves were generated by plotting the median heavy-to-light peak area ratios (for the three capture replicates) against the theoretical concentration of the heavy peptide using 1/y weighting. The LODs in terms of fmol/μl concentrations were then back-calculated based on the regression values of the fits to the curves in linear space. The lowest concentration point above the LOD at which the percent coefficient of variation (%CV) of three replicate measurements was <20% was used as the lower limit of quantification (LLOQ) for each transition of a target. The linear dynamic range was defined as the range of points from the LLOQ to the upper limit of quantification (ULOQ), with the ULOQ being defined as the upper curve point before the curve starts to level off. For assays that did not level off, the highest concentration point (500 fmol/μl) is reported as the ULOQ, and is a minimum estimate of the true ULOQ. The transition having the highest intensity for a peptide was chosen as a best, or quantifying transition for an assay, given that there were no interfering peaks in the heavy signal of the blank capture samples for that transition. The LLOQ for the quantifying transition was subsequently used to determine the heavy peptide spike-in amounts for the intra- and inter-day repeatability experiments.
For the repeatability analysis, the intra-day, inter-day, and total variabilities for each assay were calculated based on the heavy-to-light peak areas and their CVs. Separate variabilities were calculated for each low, medium, and high heavy peptide concentration for a transition. For example, for the low concentration intra-day variability, the peak area ratio CV of each day's three low replicate captures was calculated, and then the CVs for the 5 days were averaged. To arrive at the low concentration inter-day variability, the CV of the first repeat captures across the 5 days was calculated, then the CV for the second captures over the 5 days, and finally the CV for the third captures, with the three CVs being averaged in the end. The total CV was subsequently calculated as the square root of the sum of the squares of the average intra- and inter-day CVs. See also the assay development guidelines on the CPTAC Assay Portal (24, 25) (https://assays.cancer.gov/guidance-document/).
Western Blot
For Western blotting, the antibodies were tested by analyzing three different sample types: (1) purified recombinant proteins; (2) lysates from cell lines overexpressing the target proteins; and (3) lysates from six breast cancer cell lines from the NCI60 cell line collection (http://dtp.nci.nih.gov/index.html). The recombinant proteins were obtained from the Argonne National Laboratory (ANL, Lemont, IL), and the overexpressed lysates were purchased from Origene (Rockville, MD). The six NCI60 breast cancer cell lines were BT-549, HS578T, MCF7, MDA-MB-231/ATCC, MDA-MB-468, and T-47D, and were selected based on their reactivity in reverse phase microarrays (26) and because the mAbs' protein targets (except for TSHB and CGB) were expected to be detected in breast cancer cell lines. All method details are available at http://antibodies.cancer.gov, SOP #M-103 (http://antibodies.cancer.gov/modules/site/pages/antibodies_detail_antigen_file.php?file_id=4&type=sop). Briefly, antigen or lysate was adjusted to ∼1 mg/ml and diluted 1:10 in PBS. A 1:5 dilution of the diluted antigen was made in Laemmli Sample Buffer (BioRad, Hercules, CA) and the antigens were heated at 90 °C for 5 min in a preheated water bath. Five microliters of a sample (having a 20 μg/ml protein concentration) was loaded onto the gels. Antigen and control rabbit IgG were run on a 4–15% Tris-HCl polyacrylamide gel (BioRad) using the Criterion™ system. Proteins were transferred to nitrocellulose transfer membranes using the Trans-Blot Turbo™ system (BioRad). Following transfer, membranes were blocked with PBS Tween containing 5% (w/v) nonfat dry milk. Antibody to be tested was diluted in PBS Tween to a concentration of 0.25 μg/ml. Ten milliliters of diluted antibody was added to mini trays containing the membrane with antigen and control rabbit IgG lanes. Incubation was at room temperature for 30 min with gentle rocking. The membranes were then rinsed three times with 10 ml of PBS Tween. HRP labeled goat anti-rabbit antibody (Jackson Laboratories) was diluted 1:7500 and 10 ml was added to each blot. Incubation was for 30 min at room temperature. Following three washes with PBS Tween, 3 ml of TMB substrate (1-Step TMB-Blotting, Pierce-Thermo Scientific) was added and incubated between 5 and 10 min until the control rabbit IgG line showed clear development. The reaction was stopped by rinsing with deionized water. All blots were imaged using a BioRad ChemiDoc™ XRS+ system. A Western blot assay was called positive if there was detection of a band at the expected molecular weight of a protein.
Indirect ELISA
Detailed methods can be found at http://antibodies.cancer.gov, SOP #M-102 (http://antibodies.cancer.gov/modules/site/pages/antibodies_detail_antigen_file.php?file_id=3&type=sop). Briefly, recombinant protein antigens or overexpressed lysates were diluted in carbonate coating buffer (Pierce-Thermo) to a concentration of 10 μg/ml. One hundred microliters was added to each well of a microtiter plate (Costar medium binding) for coating and incubated for 1 h at 37 °C with mild shaking. The coating solution was removed by decanting and 225 μl of PBS Tween containing 1 mg/ml of BSA (Sigma) was added and incubated for 30 min with mild shaking. The blocking solution was removed by decanting and each well was washed with PBS Tween three times. Tenfold dilutions of antibody to be tested were prepared starting at ∼1 μg/ml. The antibody was dispensed at 100 μl per well and incubated 30 min with mild shaking. After decanting, the plates were washed three times with PBS Tween. A 1:7500 dilution of goat anti-rabbit antibody (Jackson ImmunoResearch Laboratories) was prepared and 100 μl of diluted antibody was added to each well. Following incubation for 30 min at 37 °C with mild shaking, the plates were decanted and washed three times with PBS Tween. One hundred microliters of TMB substrate (1-Step TMB Turbo Substrate, Pierce-Thermo) was added to each well and color was allowed to develop until control wells showed sufficient blue color for easy detection. The reaction was stopped with 100 μl of 0.18 N sulfuric acid and the plates were read in a BioRad iMark microplate reader at 450 nm. The data were reduced using Prism™ software to calculate the 50% binding point (B50%). Specifically, a 4-parameter logistic fit (4PL) was applied to the data to calculate the upper and lower asymptotes along with a slope and a mid-point of the curve, the EC50 or B50%, which is the inflection point of the curve and represents the antibody concentration (or x-axis value) at half of the calculated maximum binding. Of note is that the B50% values should not be interpreted as absolute numbers that define mAb performance (i.e. not analogously to affinity constants); instead, the B50% values can be used as relative values to compare the performances of the mAbs within this group of mAbs. An ELISA assay was called positive if the B50% value was <1 μg/ml (the highest concentration tested in these assays).
RESULTS
Development of Recombinant and Hybridoma mAb
We aimed to generate recombinant mAb to 39 proteotypic peptide antigens representing 27 human proteins (supplemental Table S1), and we used a previously-developed grading scheme (12) to evaluate antibody performance for immuno-MRM. Thirty of the 39 recombinant mAb assays (77%) enabled a minimum detection level of 0.5 fmol/μl (grade B; ∼10–100 ng/ml protein in plasma) and 36 of 39 assays (92%) enabled a minimum detection level of 5 fmol/μl (grade C; ∼100 ng/ml protein in plasma) (supplemental Tables S1 and S4). Based on these results, 35 of the 39 recombinant mAbs were advanced to production and purification (i.e. all working assays except the mAb to peptide GTPWEGGLFK, from protein UBE2I, because a second peptide with better performance, DHPFGFVAVPTK, was available to the same protein). Chromatograms showing the peptide signals at their lowest and next highest detection levels for the recombinant mAb assays are given in supplemental Fig. S1.
For the hybridoma mAb development, we aimed to generate immuno-MRM assays to six peptide targets from three proteins (supplemental Table S1), and obtained purified mAbs to five of the six (83%). The sixth target's mAb, to peptide DHPLTCDDPR, to protein CGB, failed at the subclone stage. Overall, 40 mAb-based immuno-MRM assays were developed (35 using a recombinant approach, five using the traditional hybridoma approach).
Characterizing the mAbs Using Reverse Response Curves and Intra- and Inter-day Repeatability Experiments
We characterized the 40 assays according to recently-developed guidelines for MRM and immuno-MRM assays (24, 27), with the aim of making the assays publicly available on the CPTAC Assay Portal (24) (https://assays.cancer.gov) (established as part of the CPTAC Program of the National Cancer Institute (NCI)). The characterization included response curves to determine linearity, limits of detection, precision, and lower limits of quantification, as well as intra- and inter-day repeatability immuno-MRM experiments.
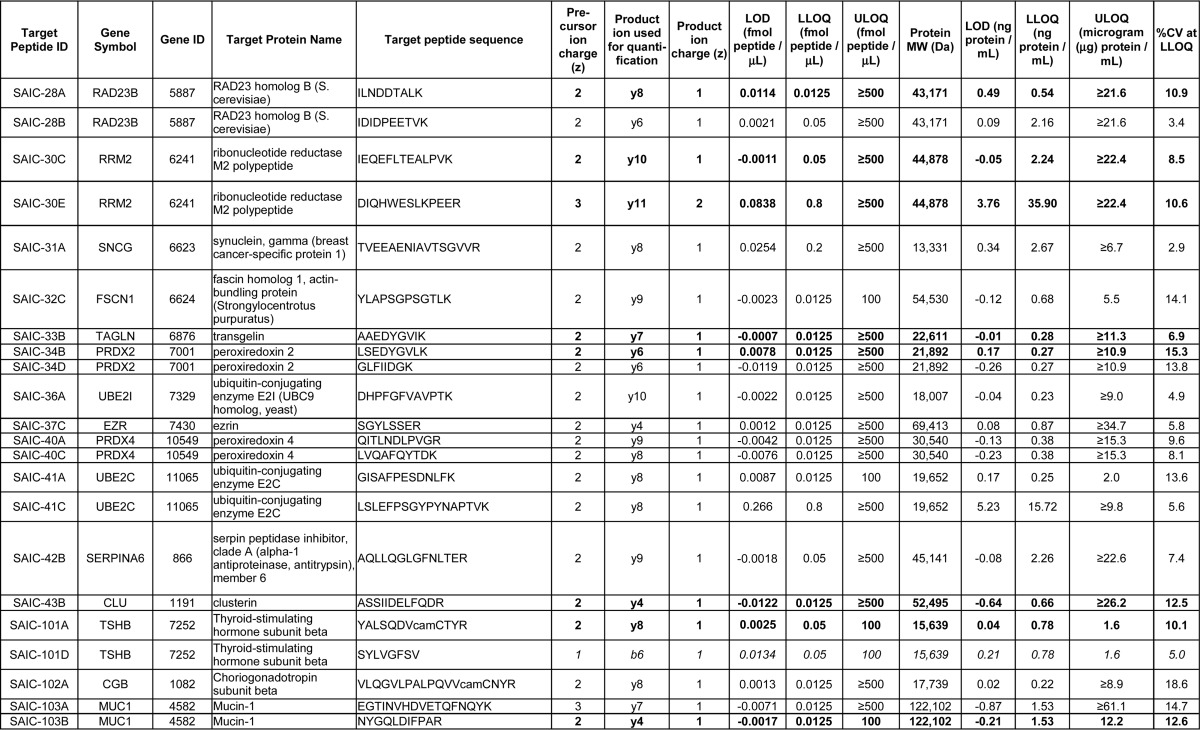
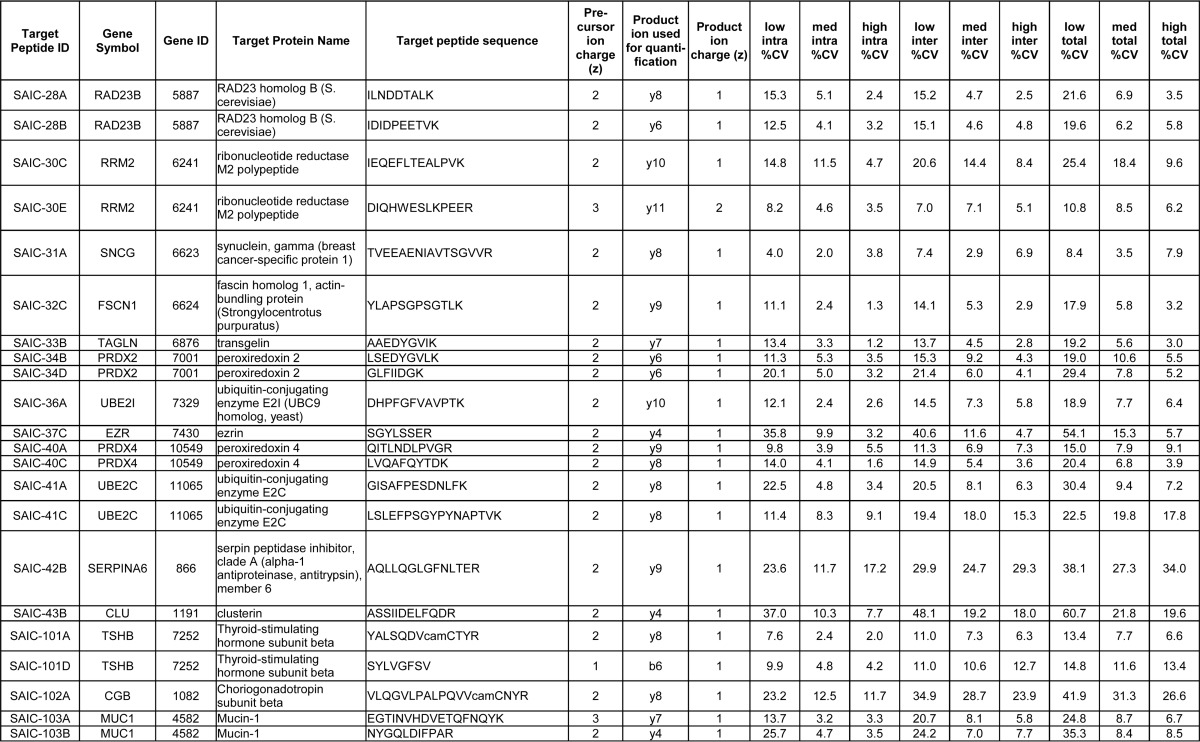
The response curves were run as reverse curves (with the light peptides being spiked at constant concentrations and the heavy peptides' concentrations being varied), because endogenous light peptides were detectable in the plasma samples for some of the targets, and this would have prevented the determinations of limits of detection (LOD) and lower limits of quantification (LLOQ) in the desired matrix. The response curves encompassed eight concentration points (run in triplicate), including a blank (run in five replicates), with replicates consisting of the capture step and LC-MRM-MS run. For 11 of the 40 assays, interferences were detected in either two or three transitions, and these transitions were removed and replaced with up to seven alternative transitions (supplemental Table S3) in a second round of response curve experiments for these 11 assays. For two targets (for proteins and peptides annexin A4 (ANXA4), DEGNYLDDALVR, and ribonucleotide reductase M2 polypeptide (RRM2), IEQEFLTEALPVK), interferences were still observed in all seven heavy peptide transitions in the blank capture samples, and hence these two assays were therefore not “validated” according to the CPTAC Assay Portal guidelines when using these particular liquid chromatography and mass spectrometry conditions, and for this particular plasma matrix (for example, using a longer gradient might chromatographically resolve the interference and analyte peaks). In addition, the data analysis of the initial response curve experiments for the SYLVGFSV peptide (for the thyroid-stimulating hormone subunit beta (TSHB) protein) showed that the peptide was not stable during the ∼4 days the samples were on the autosampler at 8 °C, and hence the experiments for it were also repeated, with the second and third capture repeat samples being kept at −80 °C until analysis. The heavy-to-light peak area ratios were plotted against the theoretical heavy peptide concentrations in both linear and log space (Fig. 1 and supplemental Fig. S2). The limits of detection (LODs) were calculated based on the heavy-to-light peak area ratios in the blank capture samples (average plus three times the standard deviation), and then back-calculated to fmol/μl concentrations based on the regression values of the fits to the curves in linear space. The lower limits of quantification were defined by the lowest concentration point above the LOD at which the %CV of three replicate measurements was <20%. Table I reports the LODs and LLOQs for the quantifying transition (the transition having the highest MS intensity with no interference). The median %CV at the LLOQs for the quantifying transitions of these 40 assays was 9.9% (range 2.5–18.6%), and the LLOQs ranged from 0.0125 to 0.8 fmol/μl (fmol of peptide per microliter of plasma, Table I) corresponding to protein concentrations of 0.18 to 35.9 ng/ml (assuming complete trypsin digestion, Table I). The linear dynamic ranges spanned at least three orders of magnitude for all but three assays (based on the lower and upper limits of quantification (LLOQ and ULOQ, Table I).
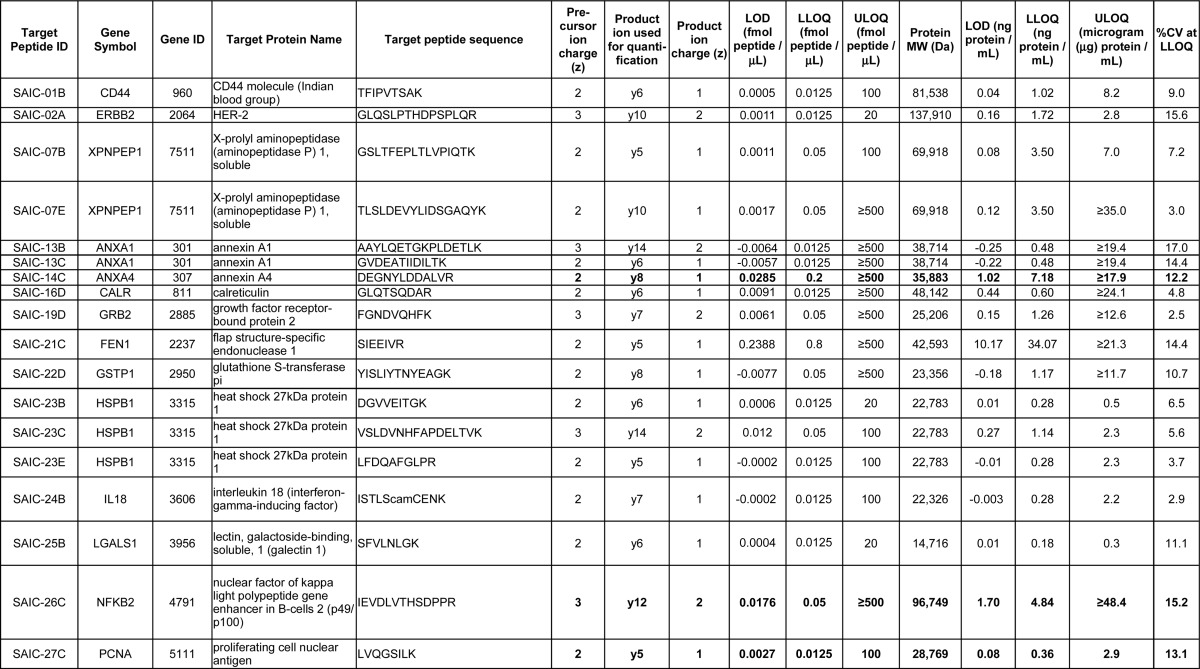
Fig. 1.
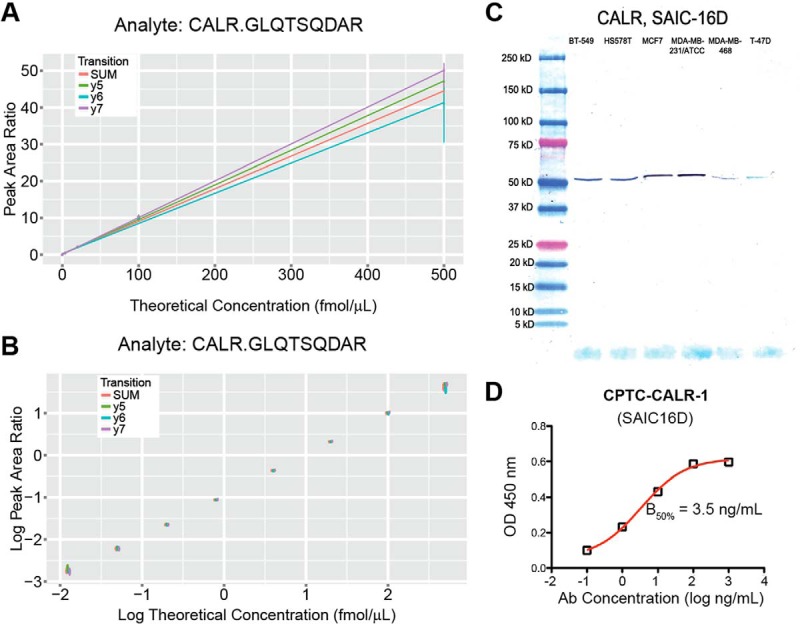
Characterization of assays and antibody reagents. Immuno-MRM-MS response curve data in linear A, and log space B, and Western blot C, and ELISA D, data for the monoclonal antibody to peptide target GLQTSQDAR from the protein calreticulin (CALR; target peptide ID SAIC-16D). For the response curves, the heavy-to-light peak area ratios for the peptide's transitions are plotted versus the heavy peptide's theoretical concentration; y5 refers to the product ion; SUM refers to the response curve for which the peak areas of all transitions were summed before taking the peak area ratios; the error bars indicate the minimum and maximum (i.e. range) of the peak area ratios of the three capture and LC-MRM-MS replicates. For the Western blot, the expected molecular weight of calreticulin is 48 kDa (UniProt). For the ELISA assay, the B50% value was used as a relative value to assess the different mAbs' performances in these experiments; it indicates the inflection point of the curve and represents the mAb concentration at half of the calculated maximum binding of the mAb.
Table I. Summary of the immuno-MRM reverse response curve data using 35 recombinant and 5 hybridoma mAbs. The table is ordered according to Target Peptide ID. The 35 recombinant mAbs are listed first (SAIC-01B to SAIC-43B), and the 5 hybridoma mAbs (SAIC-101A to SAIC-103B) are listed at the bottom of the table. The response curve data are given for the quantifying product ion (transition), which is defined as the most intense transition of a peptide that did not have any interfering peaks in the heavy signal of the blank capture samples of the response curves. The response curve data of the 11 peptide targets for which the response curve experiments were repeated (due to interferences) are indicated in bold. The response curve data of the SAIC-101D (SYLVGFSV) peptide target for which the response curve was repeated (due to instability of the peptide) are indicated in italics. Protein molecular weights (MW) were obtained from UniProt, with the MW of Isoform 1 given if more than one isoform was reported, and the ng/ml or μg/ml protein concentrations were calculated assuming complete trypsin digestion. camC, carbamidomethylated Cys; LOD, limit of detection; LLOQ, lower limit of quantification; ULOQ, upper limit of quantification. Of note, for assays whose curves did not level off, the ULOQ reported here is a minimum estimate of the true ULOQ and is given as ≥500 fmol/μl.
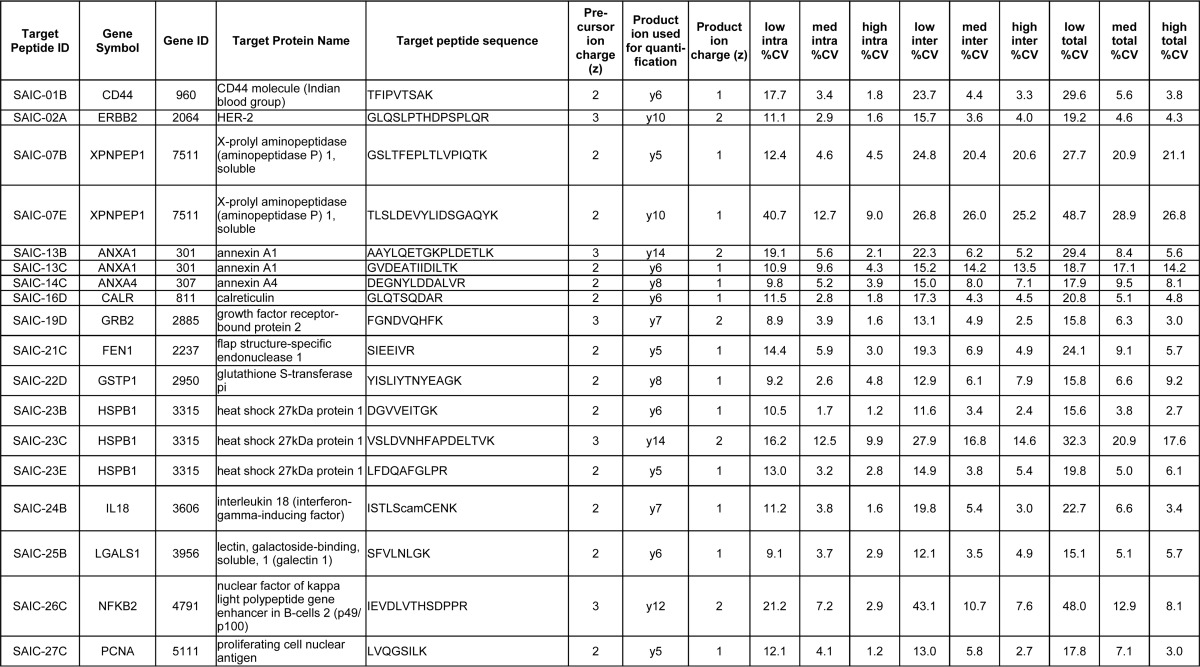
Intra- and inter-day repeatabilities were characterized at three concentrations on five different days. Each concentration was measured by performing the enrichment step in triplicate. The three concentrations (low, medium, and high) were prepared by adding the stable isotope-labeled peptides into a pooled plasma matrix at 3x, 50x, and 500x of the LLOQ. Table II lists the %CVs for each of the assays at the three concentrations. The median %CV of all assays at the low, medium, and high intra-day samples were 12.5, 4.6, and 3.2%, respectively, and the median inter-day variability was 15.5, 7.0, and 5.6%, for low, medium, and high, respectively. The median total variability for all assays was 20.6, 8.2, and 6.3% for the low, medium, and high concentrations, respectively. These CVs demonstrate good repeatability for the assays.
Table II. Summary of the immuno-MRM repeatability data using 35 recombinant and 5 hybridoma mAbs. The table is ordered according to Target Peptide ID. The 35 recombinant mAbs are listed first (SAIC-01B to SAIC-43B), and the 5 hybridoma mAbs (SAIC-101A to SAIC-103B) are listed at the bottom of the table. The intra- and inter-day repeatability data are given for the quantifying product ion (transition), which is defined as the most intense transition of a peptide that did not have any interfering peaks in the heavy signal of the blank capture samples of the response curves. camC, carbamidomethylated Cys.
Testing the Produced and Purified mAbs by Western blot and Indirect ELISA Using Full-length Proteins
As described in Selection of Protein and Peptide Targets for Monoclonal Antibody Generation, the selection of the antigens, as well as the choices of recombinant and hybridoma mAb clones for advancement into production and purification, were solely based on performance in immuno-MRM, where tryptic peptides are targeted. We sought to test if the mAbs could also be applied to traditional immunoaffinity assays that target full-length proteins, such as Western blotting and ELISA. Of note, no consideration was given to the tertiary structure of the proteins when selecting the proteotypic peptide immunogens (such as whether the peptides were located on the surface of the proteins) in this study. For Western blotting, the antibodies were tested by analyzing three different sample types: (1) purified recombinant proteins; (2) lysates from cell lines overexpressing the target proteins; and 3) lysates from six breast cancer cell lines from the NCI60 cell line collection. The criteria for judging a Western blot as positive was the presence of a protein band at the correct molecular weight. Overall, 23 of the 40 mAbs (58%) tested by Western blotting showed a positive response at the correct molecular weight for at least one of the three different samples tested (Table III and supplemental Fig. S3). Considering only the NCI60 cell lysate data, which represents a higher bar of testing because proteins are detected in their native form and at potentially low expression levels, 14 of 36 (39%) antibodies tested worked for Western blotting (Table III and supplemental Fig. S3; only 36 of 40 mAbs were tested in the NCI60 lysates, since the proteins TSHB and CGB were not expected to be detected in the six breast cancer cell lines, see Western Blot, and because one of the mAbs to protein MUC1 was negative when tested with recombinant protein, Table III). The Western blot data, along with the experimental SOPs, are also available at the National Cancer Institute's Antibody Portal (http://antibodies.cancer.gov).
Table III. Summary of the Western blot and ELISA results using 35 recombinant and 5 hybridoma mAbs. The table is ordered according to Target Peptide ID. The 35 recombinant mAbs are listed first (SAIC-01B to SAIC-43B), and the 5 hybridoma mAbs (SAIC-101A to SAIC-103B) are listed at the bottom of the table. Grey-shading indicates mAbs that were negative in the particular Western blot or ELISA assays. camC, carbamidomethylated Cys.
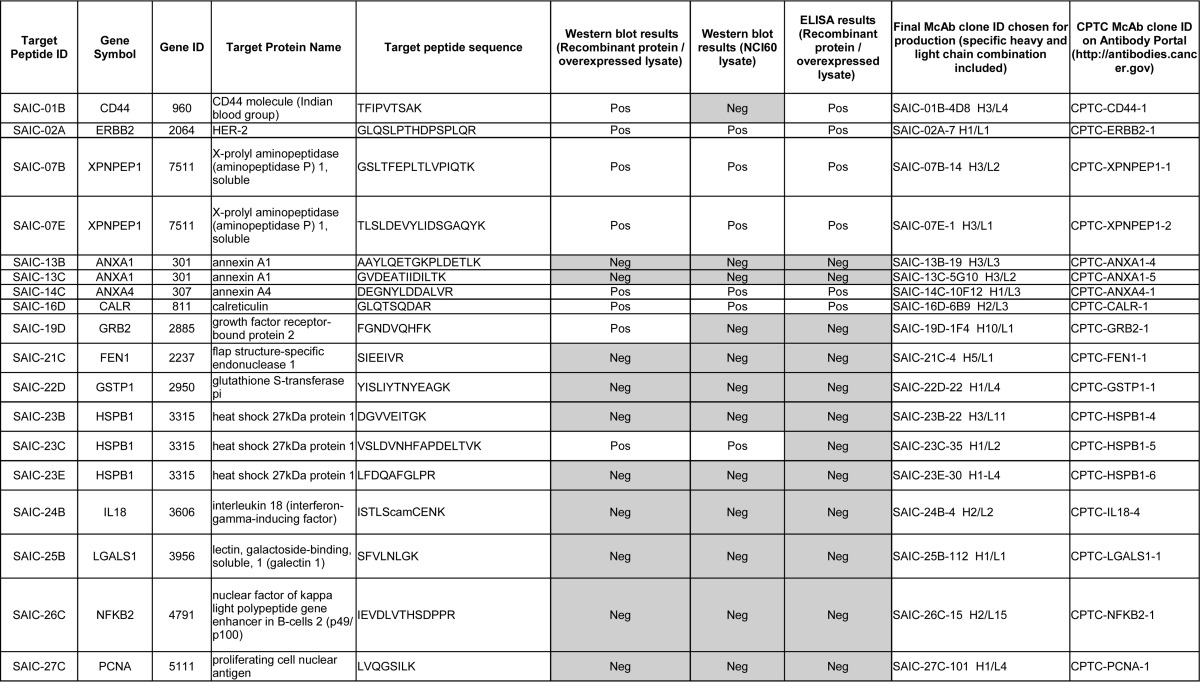
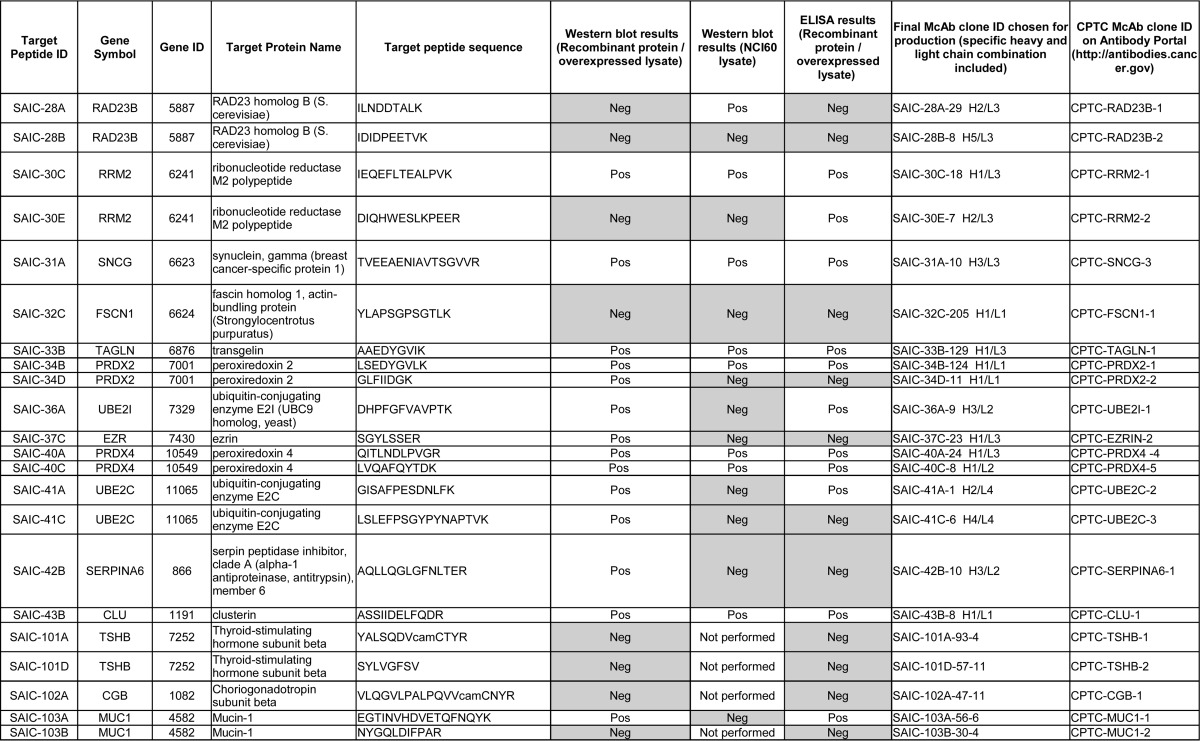
The ELISA experiments were performed using recombinant proteins or overexpressed lysates. The criterium for success for ELISAs was that the B50% value (the antibody concentration at half of the maximum binding calculated by a 4-parameter logistic fit) needed to be less than the highest concentration tested (1 μg/ml). The success rate for the indirect ELISA testing was 17 of 40 mAbs (43%) (Table III). The percentage of mAbs that worked for both Western blotting and ELISA was 40% (16 of 40). Fig. 1 illustrates the performance of one of the mAb in all three assay types (immuno-MRM, Western, and ELISA), and individual blots and ELISA data are given in Supplemental Figs. S3 and S4, and are available on the CPTAC Antibody Portal (http://antibodies.cancer.gov).
DISCUSSION
As discussed below, this study: 1) demonstrates high antibody cross-over success rates amongst immuno-MRM, Western blotting, and ELISA; 2) suggests an approach to antigen design that will create reagents for both emerging immuno-MRM and conventional assay formats; 3) makes a panel of 40 highly characterized mAbs and immuno-MRM assays available as a community resource; and 4) demonstrates the use of recombinant mAb in immuno-MRM.
Our results show high cross-over success rates for antibodies generated for immuno-MRM in traditional assay formats. The primary consideration for tryptic peptide target selection in this study was the detectability by the mass spectrometer, and no consideration was given to the location of the peptide within the protein. In contrast, for traditional immunoassay formats, accessibility of an epitope in the context of the protein's tertiary structure is often considered. In the cases of the Western blot assays performed here, the high success rate might not be surprising because the endogenous proteins were tested in a denatured state, and even if the tryptic peptide sequences are located in buried regions of the natively-folded proteins, the epitopes might become accessible in the denatured state. In the case of an indirect ELISA assay, the protein can be somewhat distorted during the binding to the plastic surface, but a peptide sequence is not necessarily exposed to the extent that it would be in the Western blot procedure. It is therefore logical that there would be more antibodies reacting positively in the Western blot than in the ELISA assays. Testing the antibodies by Western blotting using six breast cancer cell lines from the NCI60 cell line collection set a higher bar for the mAbs' abilities to detect endogenous proteins, due to the more complex matrix and the potentially lower protein concentrations than in the recombinant protein or overexpressed lysate samples. The success rates were still high even in these more complex samples.
Because the antigens in this study were selected without regard to protein structure predictions, we believe that these are conservative estimates of achievable cross-over success rates, and they could most likely increase if conventional antigen design strategies were combined with strategies for immuno-MRM antibodies. For example, when designing antigens for new antibody projects, one could select sequences that not only represent proteotypic peptides (favorable for mass spectrometry) but that also are predicted to be exposed on the native protein and, thus, also likely to be of use for conventional formats using nondenaturing conditions (e.g. immunohistochemistry and immunoprecipitation). To determine whether a specific peptide has been previously detected by MS, proteomics data repositories such as the Global Proteome Machine (GPM, www.thegpm.org/index.html), Peptide Atlas (www.peptideatlas.org), PRIDE (www.ebi.ac.uk/pride/archive), and Chorus (https://chorusproject.org/pages/index.html) can be mined. To take protein structure into account, a wide variety of bioinformatics algorithms have been developed that can be used to try to predict antigenic epitopes (28). Thus, a combined workflow for immunogen selection that would maximize cross-over success rates would enable suppliers to support current, widely employed conventional immunoassay formats while also positioning themselves to support the emerging MRM platform. Using synthetic proteotypic peptide immunogens is an effective means to induce an immune response (8–12, 15–17, 20, 21, 29–33), and offers considerable advantages over using recombinant proteins, including lower costs, higher success rates (i.e. many proteins cannot be purified in soluble form), and the ability to target specific posttranslational modifications of interest (which is difficult or impossible using recombinant proteins).
Of note, all 40 highly characterized mAbs and their validated immuno-MRM assay characterization data and protocols have been made available as a community resource. The immuno-MRM response curve and assay repeatability data, as well as standard operating protocols, have been deposited on the CPTAC Assay Portal (24) (http://assays.cancer.gov), which was developed to not only be informative for researchers with mass spectrometry experience, but for researchers from diverse biological disciplines who are searching for quantitative assays to answer their particular biological questions. (These are the first immuno-MRM assays to be deposited on the portal.) Also, these monoclonal antibodies have been made publicly available as a resource to the community via the CPTAC Antibody Portal (http://antibodies.cancer.gov), in collaboration with the Developmental Studies Hybridoma Bank at the University of Iowa (http://dshb.biology.uiowa.edu/).
A variety of affinity reagents have been reported for use in immuno-MRM assays, including polyclonal antibodies (29–31, 33), monoclonal antibodies (20, 21, 32), aptamers (34), and recombinant antibody fragments (35). Monoclonal antibodies offer the advantage of a renewable high-affinity reagent, but are costly and require a relatively long development time. These drawbacks have prompted efforts to find alternative approaches to the traditional hybridoma technology. Our data demonstrate the feasibility of using a recombinant, B cell cloning approach for generating mAbs for immuno-MRM. Although the cost of mAb generation via B cell recombinant cloning is comparable to the hybridoma fusion approach, B cell recombinant cloning requires a shorter timeline for reagent development (4–5 months versus 7–8 months, respectively, from immunization to receiving the final mAb). Another advantage to recombinant cloning is that the DNA clone provides a stable end product (36). A potential downside of the recombinant approach is that the variable heavy and variable light encoding region antibody pairings generated may not necessarily represent the natural antibody pairing. Also, a technical aspect with B cell recombinant cloning is that the amount of supernatant mAbs that can be provided for immuno-MRM screening is limited because of the workflow for generating recombinant clones using primary B cells, whereas more material can be provided for immuno-MRM screening with the hybridoma fusion approach.
Supplementary Material
Acknowledgments
We thank Richard Ivey for help with the preparation of the manuscript.
Footnotes
Author contributions: J.R.W., G.R.W., and A.G.P. designed research; R.M.S. and R.G.S. performed research; R.M.S., R.G.S., and P.Y. analyzed data; R.M.S., J.R.W., G.R.W., and A.G.P. wrote the paper.
* This work was supported in part by National Institutes of Health Grant U24CA160034 from the National Cancer Institute's Clinical Proteomics Tumor Analysis Consortium Initiative and by the Entertainment Industry Foundation (EIF) and the EIF Women's Cancer Research Fund to the Breast Cancer Biomarker Discovery Consortium. This research was also supported in part by funding from Susan G. Komen for the Cure®.
 This article contains supplemental Information S1 and S2, Figs. S1 to S4, and Tables S1 to S4.
1 The abbreviations used are:
- MRM
- multiple reaction monitoring
- ANL
- Argonne National Laboratory
- CGB
- choriogonadotropin subunit beta
- cps
- counts-per-second; Clinical Proteomic Tumor Analysis Consortium (CPTAC)
- CV
- coefficient of variation
- IHC
- immunohistochemistry
- immuno-MRM
- immunoaffinity enrichment of peptides coupled to multiple reaction monitoring-mass spectrometry
- KLH
- keyhole lympet hemocyanin
- LC
- liquid chromatography
- LLOQ
- lower limit of quantification
- LOD
- limit of detection
- mAb
- monoclonal antibody
- MUC1
- mucin-1
- m/z
- mass-to-charge ratio
- RT
- room temperature
- TSHB
- thyroid-stimulating hormone subunit beta
- ULOQ
- upper limit of quantification.
REFERENCES
- 1. Hoofnagle A. N., Wener M. H. (2009) The fundamental flaws of immunoassays and potential solutions using tandem mass spectrometry. J. Immunol. Methods 347, 3–11 [DOI] [PMC free article] [PubMed] [Google Scholar]
- 2. Gillette M. A., Carr S. A. (2013) Quantitative analysis of peptides and proteins in biomedicine by targeted mass spectrometry. Nat. Methods 10, 28–34 [DOI] [PMC free article] [PubMed] [Google Scholar]
- 3. Picotti P., Bodenmiller B., Aebersold R. (2013) Proteomics meets the scientific method. Nat. Methods 10, 24–27 [DOI] [PubMed] [Google Scholar]
- 4. Kennedy J. J., Abbatiello S. E., Kim K., Yan P., Whiteaker J. R., Lin C., Kim J. S., Zhang Y., Wang X., Ivey R. G., Zhao L., Min H., Lee Y., Yu M. H., Yang E. G., Lee C., Wang P., Rodriguez H., Kim Y., Carr S. A., Paulovich A. G. (2014) Demonstrating the feasibility of large-scale development of standardized assays to quantify human proteins. Nat. Methods 11, 149–155 [DOI] [PMC free article] [PubMed] [Google Scholar]
- 5. Addona T. A., Abbatiello S. E., Schilling B., Skates S. J., Mani D. R., Bunk D. M., Spiegelman C. H., Zimmerman L. J., Ham A. J., Keshishian H., Hall S. C., Allen S., Blackman R. K., Borchers C. H., Buck C., Cardasis H. L., Cusack M. P., Dodder N. G., Gibson B. W., Held J. M., Hiltke T., Jackson A., Johansen E. B., Kinsinger C. R., Li J., Mesri M., Neubert T. A., Niles R. K., Pulsipher T. C., Ransohoff D., Rodriguez H., Rudnick P. A., Smith D., Tabb D. L., Tegeler T. J., Variyath A. M., Vega-Montoto L. J., Wahlander A., Waldemarson S., Wang M., Whiteaker J. R., Zhao L., Anderson N. L., Fisher S. J., Liebler D. C., Paulovich A. G., Regnier F. E., Tempst P., Carr S. A. (2009) Multi-site assessment of the precision and reproducibility of multiple reaction monitoring-based measurements of proteins in plasma. Nat. Biotechnol. 27, 633–641 [DOI] [PMC free article] [PubMed] [Google Scholar]
- 6. Wang P., Whiteaker J. R., Paulovich A. G. (2009) The evolving role of mass spectrometry in cancer biomarker discovery. Cancer Biol. Ther. 8, 1083–1094 [DOI] [PMC free article] [PubMed] [Google Scholar]
- 7. Paulovich A. G., Whiteaker J. R., Hoofnagle A. N., Wang P. (2008) The interface between biomarker discovery and clinical validation: the tar pit of the protein biomarker pipeline. Proteomics Clin. Appl. 2, 1386–1402 [DOI] [PMC free article] [PubMed] [Google Scholar]
- 8. Anderson N. L., Anderson N. G., Haines L. R., Hardie D. B., Olafson R. W., Pearson T. W. (2004) Mass spectrometric quantitation of peptides and proteins using Stable Isotope Standards and Capture by Anti-Peptide Antibodies (SISCAPA). J. Proteome Res. 3, 235–244 [DOI] [PubMed] [Google Scholar]
- 9. Kuhn E., Addona T., Keshishian H., Burgess M., Mani D. R., Lee R. T., Sabatine M. S., Gerszten R. E., Carr S. A. (2009) Developing multiplexed assays for troponin I and interleukin-33 in plasma by peptide immunoaffinity enrichment and targeted mass spectrometry. Clin. Chem. 55, 1108–1117 [DOI] [PMC free article] [PubMed] [Google Scholar]
- 10. Whiteaker J. R., Lin C., Kennedy J., Hou L., Trute M., Sokal I., Yan P., Schoenherr R. M., Zhao L., Voytovich U. J., Kelly-Spratt K. S., Krasnoselsky A., Gafken P. R., Hogan J. M., Jones L. A., Wang P., Amon L., Chodosh L. A., Nelson P. S., McIntosh M. W., Kemp C. J., Paulovich A. G. (2011) A targeted proteomics-based pipeline for verification of biomarkers in plasma. Nat. Biotechnol. 29, 625–634 [DOI] [PMC free article] [PubMed] [Google Scholar]
- 11. Schoenherr R. M., Whiteaker J. R., Zhao L., Ivey R. G., Trute M., Kennedy J., Voytovich U. J., Yan P., Lin C., Paulovich A. G. (2012) Multiplexed quantification of estrogen receptor and HER2/Neu in tissue and cell lysates by peptide immunoaffinity enrichment mass spectrometry. Proteomics 12, 1253–1260 [DOI] [PMC free article] [PubMed] [Google Scholar]
- 12. Whiteaker J. R., Paulovich A. G. (2011) Peptide immunoaffinity enrichment coupled with mass spectrometry for peptide and protein quantification. Clin. Lab. Med. 31, 385–396 [DOI] [PMC free article] [PubMed] [Google Scholar]
- 13. Zhao L., Whiteaker J. R., Pope M. E., Kuhn E., Jackson A., Anderson N. L., Pearson T. W., Carr S. A., Paulovich A. G. (2011) Quantification of proteins using peptide immunoaffinity enrichment coupled with mass spectrometry. J. Vis. Exp. 53, 10.3791/2812 [DOI] [PMC free article] [PubMed] [Google Scholar]
- 14. Anderson N. L., Anderson N. G., Pearson T. W., Borchers C. H., Paulovich A. G., Patterson S. D., Gillette M., Aebersold R., Carr S. A. (2009) A human proteome detection and quantitation project. Mol. Cell. Proteomics 8, 883–886 [DOI] [PMC free article] [PubMed] [Google Scholar]
- 15. Whiteaker J. R., Zhao L., Lin C., Yan P., Wang P., Paulovich A. G. (2012) Sequential multiplexed analyte quantification using peptide immunoaffinity enrichment coupled to mass spectrometry. Mol. Cell. Proteomics 11, M111 015347 [DOI] [PMC free article] [PubMed] [Google Scholar]
- 16. Whiteaker J. R., Zhao L., Anderson L., Paulovich A. G. (2010) An automated and multiplexed method for high throughput peptide immunoaffinity enrichment and multiple reaction monitoring mass spectrometry-based quantification of protein biomarkers. Mol. Cell. Proteomics 9, 184–196 [DOI] [PMC free article] [PubMed] [Google Scholar]
- 17. Kuhn E., Whiteaker J. R., Mani D. R., Jackson A. M., Zhao L., Pope M. E., Smith D., Rivera K. D., Anderson N. L., Skates S. J., Pearson T. W., Paulovich A. G., Carr S. A. (2012) Interlaboratory evaluation of automated, multiplexed peptide immunoaffinity enrichment coupled to multiple reaction monitoring mass spectrometry for quantifying proteins in plasma. Mol. Cell. Proteomics 11, M111 013854 [DOI] [PMC free article] [PubMed] [Google Scholar]
- 18. Nilsson P., Paavilainen L., Larsson K., Odling J., Sundberg M., Andersson A. C., Kampf C., Persson A., Al-Khalili Szigyarto C., Ottosson J., Bjorling E., Hober S., Wernerus H., Wester K., Ponten F., Uhlen M. (2005) Towards a human proteome atlas: high-throughput generation of mono-specific antibodies for tissue profiling. Proteomics 5, 4327–4337 [DOI] [PubMed] [Google Scholar]
- 19. Trier N. H., Hansen P. R., Houen G. (2012) Production and characterization of peptide antibodies. Methods 56, 136–144 [DOI] [PubMed] [Google Scholar]
- 20. Razavi M., Pope M. E., Soste M. V., Eyford B. A., Jackson A. M., Anderson N. L., Pearson T. W. (2011) MALDI immunoscreening (MiSCREEN): a method for selection of anti-peptide monoclonal antibodies for use in immunoproteomics. J. Immunol. Methods 364, 50–64 [DOI] [PMC free article] [PubMed] [Google Scholar]
- 21. Schoenherr R. M., Zhao L., Whiteaker J. R., Feng L. C., Li L., Liu L., Liu X., Paulovich A. G. (2010) Automated screening of monoclonal antibodies for SISCAPA assays using a magnetic bead processor and liquid chromatography-selected reaction monitoring-mass spectrometry. J. Immunol. Methods 353, 49–61 [DOI] [PMC free article] [PubMed] [Google Scholar]
- 22. MacLean B., Tomazela D. M., Abbatiello S. E., Zhang S., Whiteaker J. R., Paulovich A. G., Carr S. A., MacCoss M. J. (2010) Effect of collision energy optimization on the measurement of peptides by selected reaction monitoring (SRM) mass spectrometry. Anal. Chem. 82, 10116–10124 [DOI] [PMC free article] [PubMed] [Google Scholar]
- 23. MacLean B., Tomazela D. M., Shulman N., Chambers M., Finney G. L., Frewen B., Kern R., Tabb D. L., Liebler D. C., MacCoss M. J. (2010) Skyline: an open source document editor for creating and analyzing targeted proteomics experiments. Bioinformatics 26, 966–968 [DOI] [PMC free article] [PubMed] [Google Scholar]
- 24. Whiteaker J. R., Halusa G. N., Hoofnagle A. N., Sharma V., MacLean B., Yan P., Wrobel J. A., Kennedy J., Mani D. R., Zimmerman L. J., Meyer M. R., Mesri M., Rodriguez H., Clinical Proteomic Tumor Analysis Consortium (CPTAC), and Paulovich A. G. (2014) CPTAC Assay Portal: a repository of targeted proteomic assays. Nat. Methods 11, 703–704 [DOI] [PMC free article] [PubMed] [Google Scholar]
- 25. Ellis M. J., Gillette M., Carr S. A., Paulovich A. G., Smith R. D., Rodland K. K., Townsend R. R., Kinsinger C., Mesri M., Rodriguez H., Liebler D. C., and Clinical Proteomic Tumor Analysis Consortium (CPTAC) (2013) Connecting genomic alterations to cancer biology with proteomics: the NCI Clinical Proteomic Tumor Analysis Consortium. Cancer Discov. 3, 1108–1112 [DOI] [PMC free article] [PubMed] [Google Scholar]
- 26. Chung J.-Y., Lee S.-J., Kris Y., Braunschweig T., Traicoff J. L., Hewitt S. M. (2008) A well-based reverse-phase protein array applicable to extracts from formalin-fixed paraffin-embedded tissue. Proteomics Clin. Appl. 2, 1539–1547 [DOI] [PMC free article] [PubMed] [Google Scholar]
- 27. Carr S. A., Abbatiello S. E., Ackermann B. L., Borchers C., Domon B., Deutsch E. W., Grant R. P., Hoofnagle A. N., Huttenhain R., Koomen J. M., Liebler D. C., Liu T., MacLean B., Mani D. R., Mansfield E., Neubert H., Paulovich A. G., Reiter L., Vitek O., Aebersold R., Anderson L., Bethem R., Blonder J., Boja E., Botelho J., Boyne M., Bradshaw R. A., Burlingame A. L., Chan D., Keshishian H., Kuhn E., Kinsinger C., Lee J. S., Lee S. W., Moritz R., Oses-Prieto J., Rifai N., Ritchie J., Rodriguez H., Srinivas P. R., Townsend R. R., Van Eyk J., Whiteley G., Wiita A., Weintraub S. (2014) Targeted peptide measurements in biology and medicine: best practices for mass spectrometry-based assay development using a fit-for-purpose approach. Mol. Cell. Proteomics 13, 907–917 [DOI] [PMC free article] [PubMed] [Google Scholar]
- 28. Yao B., Zheng D., Liang S., Zhang C. (2013) Conformational B-cell epitope prediction on antigen protein structures: a review of current algorithms and comparison with common binding site prediction methods. PLoS One 8, e62249. [DOI] [PMC free article] [PubMed] [Google Scholar]
- 29. Whiteaker J. R., Zhao L., Zhang H. Y., Feng L. C., Piening B. D., Anderson L., Paulovich A. G. (2007) Antibody-based enrichment of peptides on magnetic beads for mass-spectrometry-based quantification of serum biomarkers. Anal. Biochem. 362, 44–54 [DOI] [PMC free article] [PubMed] [Google Scholar]
- 30. Hoofnagle A. N., Becker J. O., Wener M. H., Heinecke J. W. (2008) Quantification of thyroglobulin, a low-abundance serum protein, by immunoaffinity peptide enrichment and tandem mass spectrometry. Clin. Chem. 54, 1796–1804 [DOI] [PMC free article] [PubMed] [Google Scholar]
- 31. Neubert H., Gale J., Muirhead D. (2010) Online high-flow peptide immunoaffinity enrichment and nanoflow LC-MS/MS: assay development for total salivary pepsin/pepsinogen. Clin. Chem. 56, 1413–1423 [DOI] [PubMed] [Google Scholar]
- 32. Razavi M., Frick L. E., LaMarr W. A., Pope M. E., Miller C. A., Anderson N. L., Pearson T. W. (2012) High-throughput SISCAPA quantitation of peptides from human plasma digests by ultrafast, liquid chromatography-free mass spectrometry. J. Proteome Res. 11, 5642–5649 [DOI] [PubMed] [Google Scholar]
- 33. Neubert H., Muirhead D., Kabir M., Grace C., Cleton A., Arends R. (2013) Sequential protein and peptide immunoaffinity capture for mass spectrometry-based quantification of total human beta-nerve growth factor. Anal. Chem. 85, 1719–1726 [DOI] [PubMed] [Google Scholar]
- 34. Zhao Y., Widen S. G., Jamaluddin M., Tian B., Wood T. G., Edeh C. B., Brasier A. R. (2011) Quantification of activated NF-kappaB/RelA complexes using ssDNA aptamer affinity-stable isotope dilution-selected reaction monitoring-mass spectrometry. Mol. Cell. Proteomics 10, M111 008771 [DOI] [PMC free article] [PubMed] [Google Scholar]
- 35. Whiteaker J. R., Zhao L., Frisch C., Ylera F., Harth S., Knappik A., Paulovich A. G. (2014) High-affinity recombinant antibody fragments (Fabs) can be applied in peptide enrichment immuno-MRM assays. J. Proteome Res. 13, 2187–2196 [DOI] [PMC free article] [PubMed] [Google Scholar]
- 36. Seeber S., Ros F., Thorey I., Tiefenthaler G., Kaluza K., Lifke V., Fischer J. A., Klostermann S., Endl J., Kopetzki E., Pashine A., Siewe B., Kaluza B., Platzer J., Offner S. (2014) A robust high throughput platform to generate functional recombinant monoclonal antibodies using rabbit B cells from peripheral blood. PLoS One 9, e86184. [DOI] [PMC free article] [PubMed] [Google Scholar]
Associated Data
This section collects any data citations, data availability statements, or supplementary materials included in this article.