

Abstract
Experienced meditators are able to voluntarily modulate their state of consciousness and attention. In the present study, we took advantage of this ability and studied brain activity related to the shift of mental state. Electrophysiological activity, i.e. EEG, was recorded from 11 subjects with varying degrees of meditation experience during Zen meditation (a form of open monitoring meditation) and during non-meditation rest. On a behavioral level, mindfulness scores were assessed using the Mindfulness Attention and Awareness Scale (MAAS). Analysis of EEG source power revealed the so far unreported finding that MAAS scores significantly correlated with gamma power (30–250 Hz), particularly high-frequency gamma (100–245 Hz), during meditation. High levels of mindfulness were related to increased high-frequency gamma, for example, in the cingulate cortex and somatosensory cortices. Further, we analyzed the relationship between connectivity during meditation and self-reported mindfulness (MAAS). We found a correlation between graph measures in the 160–170 Hz range and MAAS scores. Higher levels of mindfulness were related to lower small worldedness as well as global and local clustering in paracentral, insular, and thalamic regions during meditation. In sum, the present study shows significant relationships of mindfulness and brain activity during meditation indicated by measures of oscillatory power and graph theoretical measures. The most prominent effects occur in brain structures crucially involved in processes of awareness and attention, which also show structural changes in short- and long-term meditators, suggesting continuative alterations in the meditating brain. Overall, our study reveals strong changes in ongoing oscillatory activity as well as connectivity patterns that appear to be sensitive to the psychological state changes induced by Zen meditation.
Keywords: EEG, Oscillations, Meditation, Mindfulness, Graph theory, High-frequency gamma
Highlights
-
•
High-frequency gamma power correlates with mindfulness scores during meditation
-
•
Local clustering of high-frequency gamma correlates with mindfulness scores (MAAS)
-
•
Correlation of high gamma local clustering and MAAS mainly in paracentral regions
-
•
Decreased EEG theta and beta power in frontal regions during meditation
-
•
Increased disconnection and clustering from 30 to 245 Hz during meditation
Introduction
In recent years, the study of meditation has become increasingly popular in neuroscience. In its proficient form, meditation can be understood as a top-down modulation of attention. According to Lutz et al. (2008), two categories of meditation styles can be classified, depending on the focus of attention: open monitoring (OM) meditation and focused attention (FA) meditation. In OM meditation, a process of attention monitoring is maintained without focusing on a particular thought or object. During FA meditation, attention is directed towards a particular object, thought or process. These categories do not represent mutually exclusive processes but may be differentially engaged during long-term meditation or even during a single meditation session (Lutz et al., 2008; Travis and Shear, 2010). Within the ancient tradition of Zen meditation, “the main aim […] is to remain constantly aware of what is occurring in the present moment to keep the mind in the specific state in which the experiential insight (satori) can arise” (Chiesa and Malinowski, 2011). This is related to the concept of mindfulness, often described as a state of non-judgmental awareness towards the present moment (Kabat-Zinn, 2006) that is maintained by a process of attention monitoring practiced during OM meditation. However, during Zen meditation FA processes also occur (e.g. Travis and Shear, 2010). Independent of the differences between meditation styles, they all lead to a putatively altered awareness state. There is, therefore, growing interest in meditation, particularly within the fields of attention and consciousness research (for reviews, see Fell et al., 2010; Lutz et al., 2008; Tassi and Muzet, 2001).
As early as 1966, a study by Kasamatsu and Hirai looked into electroencephalographic changes during Zen meditation. The authors reported alpha waves during meditation (although subjects' eyes were open) that increased in amplitude and decreased in frequency with progression of the meditation session. During the latter part of the meditation session, theta rhythms appeared mainly in meditators with many years of experience. Other studies found similar alpha and theta effects during meditation (Novices in Zen meditation practice: Kubota et al., 2001; Takahashi et al., 2005). Reductions in beta band power have also been reported (FA meditation: Saggar et al., 2012; FA and OM meditation: Hinterberger et al., 2014) and suggested to be related to minimal self-awareness and selflessness (Dor-Ziderman et al., 2013). Influences of Zen meditation have also been demonstrated using functional magnetic resonance imaging (fMRI), showing increased blood oxygen level-dependent (BOLD) response in the areas of the default mode network in Zen practitioners, including the right insula, during conceptual processing (Pagnoni et al., 2008).
An impressive illustration of the neural impact of meditation can be seen in structural differences: for example, cortical thickness was increased for Zen meditators, including in pain related regions (Grant et al., 2010), while age-related loss of gray matter was reduced (Pagnoni and Cekic, 2007). In other forms of mindfulness meditation, larger hippocampal volumes (Luders et al., 2009, 2013b) were found in long-term meditators, and increased gray matter density (Hölzel et al., 2011; Leung et al., 2013; Luders et al., 2013a) and cortical thickness (Kang et al., 2013; Lazar et al., 2005) were found in a number of regions including the right insula, left inferior temporal gyrus, right thalamus, hippocampus and the cerebellum. Further, differences in white matter have also been reported after short-term meditation training compared to before training (Tang et al., 2010, 2012) as well as for long-term meditators compared to control participants (Kang et al., 2013). For long-term mindfulness meditators compared to control participants, abnormal cerebral metabolism (Fayed et al., 2013) and enhanced structural connectivity have been shown (Luders et al., 2011). These structural differences are likely related to differences in functional connectivity that can be measured during resting state in meditators (e.g. fMRI: FA: Hasenkamp and Barsalou, 2012; short-term integrative body-mind training: Xue et al., 2011), which presumably are a consequence of specific patterns of neuronal activity during intensive meditation training (e.g. Lehmann et al., 2012; EEG study on FA: Saggar et al., 2012).
Lehmann et al. (2012) investigated five different meditation techniques and reported reduced EEG connectivity for Zen meditation, mainly in alpha and beta frequencies when compared to (initial and final) rest. Another study found increased alpha coherence during Zen meditation in novices (Murata et al., 2004). For short-term integrative mind–body training, changes in EEG theta band networks have been observed, in particular, a smaller average path length and larger global clustering coefficients have been reported and interpreted as enhanced local specialization (Xue et al., 2014). However, the available evidence is inconsistent, with some studies reporting increases in functional EEG connectivity (Transcendental meditation: Hebert et al., 2005; Travis et al., 2010; Zen novices: Murata et al., 2004), and some reporting decreases (different meditation techniques including Zen: Lehmann et al., 2001; different techniques, gamma band: Faber et al., 2004; mindfulness-meditation: Berkovich-Ohana et al., 2013), and others showing local specialization (Xue et al., 2014). This topic, therefore, requires further investigation.
Generally, meditation and attentional processes have a close relationship that is evident in descriptions of various meditation techniques (e.g. OM vs. FA), and is further supported by several studies showing that meditation training improves performance in tasks involving attention (Hodgins and Adair, 2010; Slagter et al., 2007; van Leeuwen et al., 2009). On a neuronal level, attentional processing has been closely linked to increased high-frequency oscillatory activity (Gregoriou et al., 2009; Lachaux et al., 2005). For example, studies have suggested that high-frequency gamma oscillations (> 50 Hz) represent attentional mechanisms of visual processing and working memory (Jensen et al., 2007; Jokisch and Jensen, 2007).
In the field of meditation, recent research indicates a role of lower gamma activity in processes involved in various meditation states and techniques (Berkovich-Ohana et al., 2012, 2013; Cahn et al., 2013; Hinterberger et al., 2014; Lehmann et al., 2001; for a review see: Cahn and Polich, 2006; Fell et al., 2010; Lutz et al., 2004). However, high-frequency gamma was not investigated in these studies and, therefore, it remains unclear whether modulations in high-frequency gamma activity can also be found during meditation, as suggested by the relationship between meditation and attention described above.
In the present EEG experiment, we recorded ongoing EEG activity during rest and seated Zen meditation (known as Zazen), and behavioral scores for mindfulness and meditation experience. Zazen means sitting in the position of Buddha, concentrated on the body, the breathing, and to be open to the very moment. We expected meditation experience to be positively correlated with mindfulness ratings. Concerning the EEG data, we took a novel methodological approach compared to other studies, as we analyzed not only sensor and source data but also graph theoretical measures and did it for a – compared to present standards – very broad range of frequencies (2–245 Hz). Although we analyzed the differences between meditation and non-meditation rest, our major interest concerned the further elucidation of the relationship of all these measures with scores of mindfulness in daily life and practical experience. Based on previous findings of meditation-related modulations (either between meditation and non-meditation or experts and novices) within various frequency bands, we expected general effects of meditation on as well as correlations of meditation-relevant parameters (mindfulness and practical experience ratings) with EEG activity without priori restrictions concerning frequency bands. Beyond this local level of investigation, we scrutinized how meditation practice influences the functional network architecture. We computed graph theoretical measures (see Bullmore and Sporns, 2009) at the level of generators. Based on the research cited above, we expected to find differences in connectivity and network properties during meditation compared to non-meditation rest. Further we tested the role of mindfulness in daily life on meditation-driven brain network modulation by calculating correlations between mindfulness scores and global graph theoretical measures for all frequencies. Overall, our study reveals dramatic changes in ongoing oscillatory activity as well as connectivity patterns that appear to be sensitive to the psychological state changes induced by Zen meditation that are particularly related to mindfulness.
Materials and methods
Subjects
The experiment was conducted at the psychophysiological laboratories of the University of Konstanz at the Zentrum für Psychiatrie Reichenau (ZPR). Eleven Zen meditators with various levels of experience took part in the experiment (six female, five male; mean age 50 years, see Table 1). They were recruited from a local Zen meditation community. The average Zen meditation experience was 3418 h or twelve years, ranging from four weeks to 25 years. The summed number of hours of meditation experience over the years was used as data for practical meditation experience. With the exception of one person, all subjects were free of neurological and psychiatric diseases, and all were free of drug and medication use. Omitting this subject from the statistical analysis had no impact on the reported effects. Thus the results described here use the entire sample. Subjects received 25 Euros for their participation. All subjects signed an informed consent form prior to the experiment. The procedures had been previously approved by the local ethics committee.
Table 1.
Details of the participants.
| Gender | Age | Meditation experience in hours | MAAS scores |
|---|---|---|---|
| 6 female/5 male | Mean 50 (range 27–62) | Mean 3418 (range 4–11900) | Mean 38.64 (range 16–55) |
Experimental design and procedure
Before the EEG experiment started, mindfulness in daily life situations was measured using the Mindfulness Attention Awareness Scale (MAAS, Brown and Ryan, 2003; German version by Michalak et al., 2008). The MAAS is a one-dimensional, 15-item scale measuring mindfulness, attention and awareness in the present moment on a six-point Likert scale. Statements such as “I rush through activities without really paying attention to them” were rated from 1 (almost never) to 6 (almost always). For later interpretation, this means that lower scores reflect higher levels of mindfulness. Other related constructs such as acceptance or empathy were omitted (Brown and Ryan, 2003). Meditation experience was also assessed prior to EEG recording. A total number of hours of meditation was calculated for each subject. For the main experiment, EEG data were recorded during meditation and non-meditation rest, respectively. The experiment took place in a dimly lit, electromagnetically shielded room. The EEG cap was placed on subjects' heads and electrodes were filled with electrolyte gel. Impedance for the electrodes was below 30 kΩ. During Zen meditation, subjects sat in their usual meditation position (i.e. half-lotus seat with eyes open) with a meditation cushion on the floor and EEG data were collected for 20 min. During non-meditation rest, subjects sat in a comfortable chair and were instructed to relax, not to meditate, to keep their eyes open and to minimize eye movements. EEG data were recorded for 5 min. Half of the subjects began the experiment with the meditation condition, the other half started with the non-meditation rest condition. Subjects were pseudorandomly assigned to start with one of the two conditions, an important consideration given that gamma power is still high following meditation as opposed to pre-meditation (Lutz et al., 2004). By using a balanced design, we hoped to control for similar carry-over effects. Neither practical experience (t(9) = 0.05951, p = 0.9539) nor MAAS scores differed between these two groups (t(9) = 0.215, p = 0.8346).
Data collection
EEG data were recorded using a 128-channel ANT system (Advanced Neuro Technology, Enschede, Netherlands). An external ground electrode was attached below the right cheekbone. Since muscle activity can be a confounding factor in EEG recordings, with a broad spectrum including higher frequencies, we used electromyography (EMG) recordings during the experiment to control for neck muscle activity that may be elicited by the altered seating position. For this purpose, bipolar electrodes were placed on the right trapezius. Two continuous data sets (20 min meditation, 5 min non-meditation rest) were recorded per subject with a sampling rate of 2048 Hz.
Data analysis
EEG and EMG data were analyzed in MATLAB Version 7.12 (R2011a) with the open source FieldTrip toolbox (Oostenveld et al., 2011). The 20 min of meditation EEG activity were subdivided into intervals of 5 min (allowing us to later normalize the data with 5 min non-meditation rest). Raw EEG data of meditation and non-meditation rest were epoched into segments of 2 s and filtered with a 1 Hz high-pass Butterworth filter. All segments were visually inspected and, in a first pass, all data segments containing large non-physiological artifacts (e.g. channel jumps) were rejected. EEG data were downsampled to 500 Hz. An independent component analysis (ICA) was performed and components were visualized as time series and topographically to identify artifacts from eye movements and heart muscle activity. Components containing these artifacts were removed for all four meditation intervals and the non-meditation rest (on average nine components were removed per subject), and the cleaned raw data were reconstructed. Following ICA correction, a second visual artifact detection was performed and residual segments that still contained artifacts were rejected. On average, this led to meditation data of 204 s (range 92–272 s, standard deviation SD: 49.9 s) and non-meditation data of 174 s (range: 86–272 s; SD: 60.2 s). This difference was not significant (t(10) = − 1.64, p = .13).
Electrode level
Electrode data were transformed into the frequency domain using multitaper Fast Fourier Transformation (FFT; Percival and Walden, 1993). The whole frequency band of 1–245 Hz was divided into low (< 30 Hz) and high frequencies (30–245 Hz), with steps of 1 Hz for low frequencies and 5 Hz for high frequencies. Discrete prolate spheroidal sequence (DPSS) tapering was used with a spectral smoothing of +/− 2 Hz for low frequencies and of +/− 6 Hz for high frequencies. From the complex electrode level Fourier coefficients, power spectra were calculated via the complex modulus applied separately to the four meditation periods and the one non-meditation period. Meditation data were normalized by first subtracting the power spectra of the non-meditation rest from each of the meditation periods and then dividing by them ([powermeditation − powernon-meditation] / powernon-meditation) resulting in four normalized meditation periods. The four meditation periods were averaged before application to statistical analyses.
Source level
The electrode level Fourier coefficients calculated in the previous step were then projected into source space using spatial filters derived from the dynamic imaging of coherent sources beamformer (DICS, Gross et al., 2001). We computed a separate spatial filter per frequency. A standard boundary element model (BEM) and standard electrode positions were used as provided by ANT. Common spatial filters were calculated for the resting and meditation condition for 2982 grid points (1 cm resolution) equally distributed within the brain volume. We could derive source level power spectra via these means and, analogous to the electrode level analysis, meditation data were again normalized using the non-meditation rest. The four normalized meditation periods were averaged for further statistical analyses.
Graph theoretical measures
From the source level Fourier coefficients, spectrally resolved source-level all-to-all connectivity was calculated using the imaginary part of coherence (Marzetti et al., 2008; Nolte et al., 2004). The adjacency matrix was obtained by thresholding the resulting connectivity matrix values > 0.02, which were determined as the lowest threshold at which networks were still fully connected across all subjects. Graph theoretical parameters were calculated for the meditation and the non-meditation rest condition using the Brain Connectivity Toolbox (https://sites.google.com/a/brain-connectivity-toolbox.net/bct/; Rubinov and Sporns, 2010) and custom-made MATLAB code. Global graph theoretical measures were: density, small worldedness, clustering coefficient, and distance (also called path length). Small worldedness was calculated by the ratio of the normalized clustering coefficient (dividing the empirically observed values by a value derived from a corresponding random network with equal amounts of nodes and edges) and the normalized distance. For the frequency bands identified by the global measures, local measures were calculated, including degree and normalized local clustering (dividing the clustering coefficients at each grid point with the global clustering coefficient derived from the corresponding random network; see Bolaños et al., 2013). As for the power data, all graph theoretical values of the four meditation periods were normalized using the non-meditation rest and then averaged before application to statistical analyses.
Statistical analyses
Prior to averaging the normalized meditation periods of sensor power, source power, and global graph measures we calculated an F-test (with cluster correction) to assure that the four periods did not differ significantly from each other. For none of the measures significant clusters were obtained (p > .16). We then tested for these individual averages of the normalized meditation periods of sensor power, source power, and graph measures the association with mindfulness scores (MAAS) as well as meditation experience using correlational analyses by committing them to a nonparametric cluster-based permutation test, which controls for multiple comparisons (Maris and Oostenveld, 2007). The advantage of this approach is that the distribution upon which statistical inference is based is estimated directly from the randomization, rather than depending on a priori assumptions (e.g. normality, etc.). Outputs from power (sensor and source level) as well as graph theoretical analysis (only source level) for the whole frequency range were applied to correlation analyses with mindfulness scores and hours of meditation using an alpha of 0.05 for clustering and 1000 randomizations. The maximum distance for neighbors was set to 30 mm, resulting in an average of 4.1 neighboring electrodes for the sensor data and 72.4 neighboring source coefficients for the source data. In addition, normalized global graph measures were committed to an analogous non-parametric cluster statistics approach, with the difference that in this case spatial information is missing and clustering was only performed across frequencies. For visualization purposes of the effects of global graph measures, we used the same metrics used as test statistic (Pearson correlation) in our nonparametric test of local graph theoretical measures (that putatively drive the global effects, namely degree and local clustering), which we restricted to frequency bands showing maximal effects in the earlier global analyses (160–170 Hz). In order to see the main structures showing the most pronounced effects data were masked using a p < .01.
Although our group of participants showed a wide range of meditation experience and self-reported mindfulness, we also analyzed contrasts between meditation and non-meditation rest again using cluster-based permutation (alpha of 0.05 and 1000 randomizations) with dependent samples t-tests as a test statistic (testing the normalized averages against a matrix of zeros). For the frequency band identified by the analysis of global graph measure (200–210 Hz), dependent-samples t-tests were again applied to local graph measures for visualization (uncorrected). In order to see the main structures showing the most pronounced effects data were masked using a p < .01.
The patterns of results for spectral power were similar for the sensor level analyses and the source level analyses, therefore only the source level results will be reported and discussed. Given the applied analyses, we were able to determine the relationships of meditation-related connectivity and network properties with individual meditation experiences and mindfulness scores, as well as differences to the resting state. Given the strong variability of practical experience and self-reported mindfulness, we focus on the correlational findings while we present the results for the meditation versus non-meditation contrast partly in the Supplementary data.
Results
Mindfulness ratings and meditation experience
Scores for general mindfulness, attention and awareness in the subjects' daily lives, as assessed with the MAAS (German version), were correlated with individual meditation practice experience in hours. Low MAAS scores indicated high levels of mindfulness, attention and awareness in a subject's daily life, and vice versa. Subjects' MAAS scores significantly correlated with their meditation experience, r = − .80, p < .01 (Fig. 1). Age of the subjects neither correlated with practical experience nor MAAS scores.
Fig. 1.
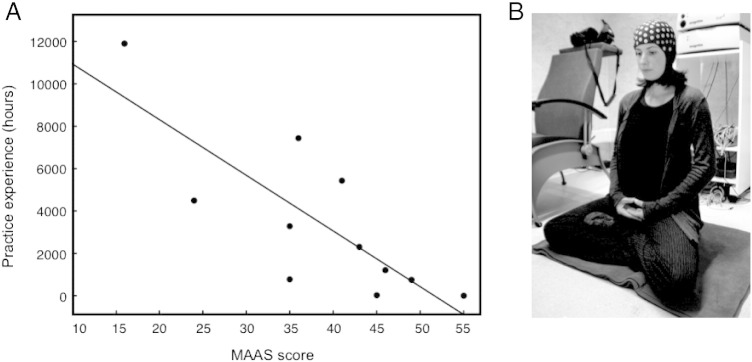
(A) Correlation between individual MAAS scores (n = 11) and amount of Zen meditation experience in hours (r = − .8, p < .01). Low MAAS scores indicate high levels of mindfulness, attention and awareness, and vice versa. (B) Illustration of the experimental setting during meditation.
Correlations of oscillatory changes with mindfulness and practice experience
A correlation analysis was calculated between mindfulness scores (MAAS) and the power data of the source transformed data for all frequencies. No significant correlations were found within the low-frequency range. A significant negative cluster (p = .015) was yielded for the entire high-frequency range, in particular between 100 and 245 Hz (Fig. 2A), indicating that high levels of mindfulness (reflected by low scores) correlate with increased power in the high frequencies. The same correlation analysis with meditation experience in hours also revealed a significant positive cluster for high frequencies (p = .036), indicating that a lot of experience goes along with increased gamma power. The generators underlying this practice effect showed a partly different pattern than the correlation effect with MAAS ratings. This means that results from the previous analysis cannot purely be explained by the amount of practice per se. Sources in which high gamma correlated with MAAS but not practical experience were mainly found in the globus pallidus, left cuneus, left anterior cingulate, right pre- and postcentral gyri (BA 2, 3, 4), bilateral middle frontal gyrus (BA 6, 10), right parahippocampal gyrus, right culmen, right medial frontal gyrus, subcallosal gyrus and thalamus (Fig. 2A). We also calculated the correlational analyses for the non-normalized meditation data and the non-meditation data separately, but none of these correlations reached significance.
Fig. 2.
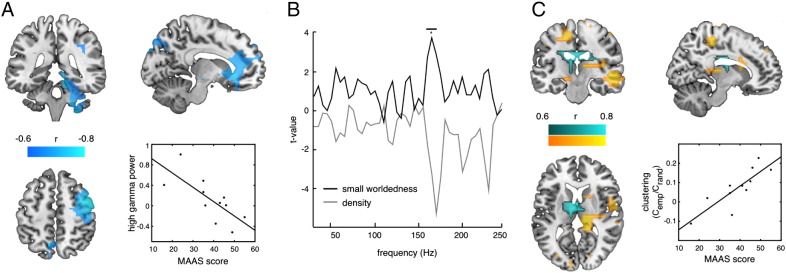
Depiction of the correlations between MAAS scores and oscillatory sources as well as global and local graph theoretical measures during meditation. (A) Sources of correlations between high gamma power (for illustration purposes collapsed across 100 and 245 Hz, uncorrected) and MAAS scores but not practical experience (masked with critical r-value, MNI coordinates: X: − 12, Y: − 38, Z: 54). Also, the scatterplot of the correlation between MAAS scores and high gamma power (100–245 Hz) during meditation extracted at the cuneus (r = − .741, p = .009) is shown. (B) Increased positive correlation between MAAS scores and small worldedness between 160 and 170 Hz. (C) Sources of positive correlations between MAAS scores and local clustering during meditation between 160 and 170 Hz (uncorrected, averaged over frequency, masked with p < .01) excluding (yellow) and including (blue) sources of negative correlations between MAAS and degree during meditation (MNI coordinates: X: − 11, Y: − 20, Z: 10). Also the scatterplot of the correlation between MAAS scores and global clustering during meditation extracted between 160 and 170 Hz (r = .7678, p = .0058) is shown. *p < .05.
Concerning the contrast between meditation and non-meditation rest, a negative cluster was obtained in the low-frequency range (2–30 Hz) with peaks at 3 and 17 Hz (p = .025, Supplementary Fig. S1A). The reduction of power during meditation was mainly localized to somatosensory cortices, the right insula, right middle temporal gyrus, and right inferior, middle and superior frontal gyri (Fig. S1A). No meditation-related modulations of spectral power were observed for higher frequencies.
Correlations of global graph theoretical measures with mindfulness
To examine the relationship of brain connectivity during meditation with mindfulness in daily life, correlation analyses were calculated for individual mindfulness ratings with global and local values. The correlation analyses with mindfulness scores yielded a significant positive cluster for small worldedness (p = .033, Fig. 2B) during meditation between 160 and 170 Hz with a peak at 165 Hz. This effect was driven by clustering (positive cluster; p = .03, Fig. 2C), while no effect was observed for path length. Density showed a trend level of a negative cluster (p = .0639) (Fig. 2B). These positive clusters indicate that at these frequencies – which are below the mediation versus rest effect (see below) – during meditation low levels of mindfulness (reflected by high scores) result in more clustered functional network architectures.
Concerning the general difference of global graph theoretical measures during meditation and non-meditation rest, no effect was found in the low-frequency range. In the high-frequency range, we obtained a significant negative cluster for density (p = 0.005) between 195 and 215 Hz (Suppl. Fig. S1B), meaning that meditation overall went along with disconnections at these high frequencies. Furthermore, a positive cluster was obtained for small worldedness (p = .017, Suppl. Fig. S1B) between 200 and 210 Hz. This effect was again driven by clustering (positive cluster; p = .015, Suppl. Fig. S1C), while no effect was observed for path length (clustering and path length normalized by values obtained from random networks with the same amount of nodes and edges, Suppl. Fig. S1C). Overall, this means that, while connectivity at these high frequencies reduces during meditation, coupling to the immediate neighbors increases.
Correlations of local graph theoretical measures with mindfulness
Local clustering revealed sources mainly in the bilateral thalamus, bilateral cingulate gyrus, and bilateral insula but also in the bilateral pre- and postcentral gyri (BA 3,4), left inferior parietal lobe, and right middle frontal gyrus (BA 6). Degree showed negative correlations with MAAS scores mainly in the bilateral thalamus, bilateral cingulate gyrus, and right cerebellum. Sources that showed only significant correlations between local clustering and MAAS, but not between degree and MAAS, were mainly found in the bilateral paracentral lobule (BA 6, 5, 31), right middle temporal gyrus, right pulvinar nucleus and medial dorsal nucleus of the thalamus, and the right insula (Fig. 2C, see Table 2 for more details).
Table 2.
Sources of correlations between local clustering during meditation and MAAS scores, (A) excluding and (B) including source correlations between degree during meditation and MAAS.
| Sources of local clustering correlating with MAAS | ||||
|---|---|---|---|---|
| (A) Excluding correlations between degrees and MAAS | ||||
| Anatomical structure | Side | Brodmann area | MNI: X, Y, Z | r-Value |
| Paracentral lobule | R | BA 5, 6, 31 | 10, − 30, 50 | 0.93 |
| L | BA 6 | − 8, − 28, 54 | 0.83 | |
| Middle temporal gyrus | R | BA 21 | 52, − 28, − 6 | 0.85 |
| L | BA 37 | − 50, − 50, − 10 | 0.79 | |
| Medial dorsal nucleus | R | 12, − 20, 10 | 0.86 | |
| Pulvinar nucleus | R | 12, − 26, 10 | 0.85 | |
| Insula | R | BA 13 | 38, − 20, 10 | 0.81 |
| Superior parietal lobule | R | BA 7 | 30, − 56, 58 | 0.89 |
| Precuneus | R | BA 7 | 30, − 50, 52 | 0.9 |
| Lingual gyrus | L | BA 18 | − 10, − 90, − 20 | 0.77 |
| (B) Including sources of reduced degrees | ||||
| Region | Side | Brodmann area | MNI: X, Y, Z | r-Value |
| Thalamus | 0, − 10, 10 | 0.93 | ||
| Cingulate gyrus | L | BA 23 | − 10, − 14, 28 | 0.86 |
| R | BA 23 | 6, − 14, 28 | 0.85 | |
| Cuneus | L | BA 18 | − 10, − 80, 20 | 0.84 |
| Pyramis/tuber | R | 38, − 68, − 38 | 0.77 | |
Regarding the general difference of local graph theoretical measures during meditation and non-meditation rest, local clustering was increased between 200 and 210 Hz, in a widely distributed set of sources including the bilateral insula, left caudate, bilateral culmen, rectal gyrus, right inferior frontal gyrus, right superior and middle temporal gyri, left cingulate gyrus, and left middle frontal gyrus. Degrees, capturing the density effect, showed reductions during meditation, mainly in the right insula, right parahippocampal gyrus, anterior cingulate and caudate as well as the cerebellum. Sources that showed only an increase in local clustering but no reduction of degree were found in the bilateral (stronger on the right) insula (BA 13), left cuneus (BA 18) and lingual gyrus (BA 17) (see Suppl. Fig. S1B and Suppl. Table S1 for full details).
EMG recordings
Since muscle activity may produce broadband artifacts that include the higher gamma band (Pope et al., 2009), we measured neck muscle EMG during the rest and meditation conditions. All statistical testing done on EEG power data was also conducted for EMG power. For analysis of EMG data, two subjects were excluded owing to insufficient EMG data arising from technical problems during the experiment. For normalized EMG data, significant positive clusters were found for the lower frequencies (2–10 Hz and 18–19 Hz; p's < .05) and for the high gamma band range (> 90 Hz; p < .01). These effects showed increased EMG gamma activity during meditation compared to non-meditation rest. Concerning the relationship with mindfulness ratings or practice experience, no correlations occurred in any frequency band. We also calculated the correlational analyses for the non-normalized meditation data and the non-meditation data separately and found a positive cluster (p = .039) of correlations between MAAS and high gamma (130–175 Hz), indicating higher gamma during non-normalized meditation being associated with higher MAAS scores, which represent lower mindfulness in everyday life. Concerning the significant effects, it is important to note that these effects were either absent (as the difference between meditation and non-meditation rest in high gamma and positive correlation between non-normalized high gamma during meditation with MAAS) or showed the opposite direction in the EEG data (as the difference between meditation and non-meditation rest in beta range with an increase in EMG and a decrease in EEG). Thus, the available EMG data from the neck electrode does not provide any evidence that the effects found in the high gamma EEG are muscular artifacts.
Discussion
In the present study, source-level oscillatory activity and network properties were investigated in Zen meditators during meditation and rest with a special focus on their relationship with self-reported mindfulness. Since meditation is considered to be an altered state of consciousness and is closely associated with processes of attention and awareness, findings will be discussed with regard to possible implications in this field.
Several findings from this EEG study support the assumption that the meditative state seems to be rather unique in terms of patterns of brain activity. On a behavioral level, we found a significant correlation between MAAS scores and Zen meditation experience, suggesting a development of mindfulness skills with meditation experience. More importantly and interestingly, we uncovered a thus far unreported significant correlation between high gamma source power (starting around 30 Hz, plateau from 100 to 245 Hz) and MAAS scores (and to a lesser extent practice experience). Source analysis suggested the involvement of several cortical and subcortical regions, including somatosensory cortices (BA 1, 3), the anterior cingulate, cuneus, middle and medial frontal regions as well as parahippocampus. Thus, individuals showing high levels of mindful behavior in their daily lives, as measured using the MAAS, also show substantially increased high-frequency gamma power during Zen meditation in these areas. This effect occurred for normalized power data. For the present data, we were not able to disentangle the contributions of longitudinal (non-meditation rest) versus short-term (meditation session) changes as the MAAS scores neither correlated significantly on a cluster level with non-meditation rest nor non-normalized meditation. The lack of correlations with non-normalized meditation or non-meditation rest might be due to higher inter-individual variability for the single conditions, which becomes reduced via normalization. However, we speculate that in general both trait and state differences play a role in meditation as one (state) is most probably a prerequisite for the other (trait) to develop. This assumption is supported by studies showing relevant modulations in brain activity during both meditation (e.g. Berkovich-Ohana et al., 2013) and non-meditation rest (e.g. sleep: Ferrarelli et al., 2013).
The general relevance of high gamma, especially regarding these structures, is further supported by the finding that synchrony in the high frequency range plays a role in synaptic plasticity (Wespatat et al., 2004), suggesting that structural changes may be connected to high-frequency oscillations in the human brain. This is consistent with previous findings from longitudinal fMRI studies that showed increased cortical thickness for meditators in these regions of interest (Grant et al., 2010; Hölzel et al., 2011; Kang et al., 2013; Lazar et al., 2005; Luders et al., 2009), increased gray matter (Leung et al., 2013), and enhanced gyrification (Luders et al., 2012).
Muscular activity is frequently discussed as an artifact explaining high broadband gamma activity (see for a review Muthukumaraswamy, 2013) and body posture has been shown to influence motor cortical excitability (Kantak et al., 2013) as well as cognitive performance (Muehlhan et al., 2014). However, in these studies sitting was compared to standing (Kantak et al., 2013) or supine posture (Muehlhan et al., 2014) while in our study conditions were more similar: participants were in sitting posture in both conditions, although they sat in the lotus position during meditation and in a comfortable chair during resting condition. This difference in body posture was necessary as discussions with Zen meditators preceding the study made it clear that in particular for experienced meditators it would not be feasible to sit in the lotus position without meditating. Given these differences in body posture it is theoretically possible that muscular artifacts affected our data, but there are several reasons why we are confident that this is not the case. First, we recorded EMG from the neck muscle and analyzed the data analogous to the EEG data to rule out possible contamination from the neck muscles. Although we did find significant effects of muscular activity during normalized meditation, both in the lower frequencies and high gamma range, as well as a correlation between MAAS scores and non-normalized meditation, these effects are unlikely to explain our EEG findings: all of the EMG effects were either completely absent in the EEG data or were in the opposite direction and therefore have no apparent value in accounting for the EEG data. Second, related to the first point, muscular artifacts usually show an increase in high broadband gamma activity. In the present study it might be expected that the lotus position during meditation is more physically demanding for novice meditators than long-term meditators. Therefore high gamma would be expected to correlate negatively with practice experience which (at least for the neck muscle) was not the case, but rather the opposite, meaning that a lot of experience goes along with increased high gamma power. Third, the differences between the two body postures also include the lower limbs which are, due to their extreme distance to the scalp electrodes, very unlikely to contribute to scalp EEG in any meaningful way. Also, the data analysis included a spatial filtering step (beamforming) which likely reduces spurious effects from distant artifactual sources even more. Fourth, further candidates for muscular artifacts are head and face muscles which are reported to be broadband, with e.g. peaks around 50–60 Hz for chewing and 30–40 Hz for brow wrinkling. Compared to this range our main power correlation effects are a lot higher, with increased power from 30 to 245 Hz with a plateau between 100 and 245 Hz. Neck muscles are reported to produce a peak frequency around 100 Hz, but this was already ruled out as a contaminating source as described earlier (see Muthukumaraswamy, 2013 for a detailed overview of peak frequencies of muscular artifacts). Fifth, the position change was the same for all participants, making it less likely that our correlation effects with mindfulness scores/practical experience are confounded.
While the modulation of low gamma through meditation has already been reported (Berkovich-Ohana et al., 2012, 2013; Hinterberger et al., 2014; Lutz et al., 2004), the modulation of high gamma has not yet been investigated. However, within the field of attention, studies support the notion that high gamma (> 80 Hz) is associated with attentive processing (e.g. Brovelli et al., 2005; Gregoriou et al., 2009; Ray et al., 2008). For example, using intracranial recordings, attention-dependent modulations of high gamma were shown in modality-specific sensory regions (e.g. somatosensory) and frontal (Ray et al., 2008) and premotor areas (Brovelli et al., 2005).
In general, the connection between meditation training and attentional performance is well established. Assuming that meditation training improves attentional processing as well as mindfulness and given that our participants showed some distribution of MAAS scores and practical experience, it does not come as a surprise that instead of a general condition difference in high gamma we found correlations with MAAS scores as well as practical experience. However, it seems essential to mention that the correlation of gamma power with the MAAS score cannot simply be explained by the amount of meditation experience per se, as this correlation was not only weaker but also involved partly different regions. Instead, this correlation is based on a relationship with the quality of the mental state achieved using meditation, namely mindfulness skills. Although our findings are supported by other studies that have shown a link between high gamma and attention as well as awareness, it has never been directly shown that increased high-frequency gamma power during the meditative state is related to measures of mindfulness. Future research should attempt to confirm these findings and investigate mechanisms of attention involved in OM meditation, which may be closely linked to these patterns of neuronal activity.
Although we stress the findings of correlations between MAAS scores and high gamma frequencies, we want to point out that also for the lower gamma frequencies (< 80 Hz) these correlations showed significant results. As mentioned earlier, modulations in low gamma during meditation of long-term meditators were already reported in previous studies (Berkovich-Ohana et al., 2012, 2013; Cahn et al., 2010, 2013; Hinterberger et al., 2014; Lutz et al., 2004). For example, Lutz et al. (2004) found that long-term meditators show an increase in lower gamma power during meditation compared to rest which is absent in control participants. In the present study we did not find such a difference which might be due to the fact (i) that we did not include a control group and (ii) that our group of meditators had a very wide range of experience. However, similar to what we found, namely positive correlations with self-reported mindfulness (negative correlations with MAAS scores) and practical experience, other studies as well found stronger (low) gamma increases for the more experienced meditators (Cahn et al., 2010; Lutz et al., 2004).
Furthermore, analyzing general differences between meditation and non-meditation rest, we found reduced power between 2 and 30 Hz with peaks in the theta (3 Hz) and beta band (17 Hz) during meditation. Meditation-related theta band (Hinterberger et al., 2014) and beta band reductions, mainly in frontocentral electrodes have also been reported in previous studies (FA meditation, Saggar et al., 2012; FA and OM meditation, Hinterberger et al., 2014) and related to minimal self-awareness and selflessness during meditation (Dor-Ziderman et al., 2013). Our group of participants showed a wide range of variability therefore these findings should be interpreted carefully. Nevertheless, the effects were localized in various regions that have also been reported as playing a role in bodily awareness, the processing of body sensations, and interoceptive awareness (Ott et al., 2011) and show structural differences in meditators (Grant et al., 2010; Lazar et al., 2005; Luders et al., 2012).
Since meditation seems to remarkably alter patterns of brain activity both during meditation and in the long term, functional connectivity is also likely to change in the meditative state. However, recent research is inconsistent as some EEG data show decreased global functional connectivity mainly in alpha and beta bands during meditation (Faber et al., 2004; Lehmann et al., 2012) and others show increased global clustering (Xue et al., 2014). Additionally, increased connectivity was found in EEG (Murata et al., 2004) and fMRI research (Kilpatrick et al., 2011; Xue et al., 2011). In the present study, we investigated connectivity using global and local graph theoretical measures over a broad range of oscillatory frequencies and their relationship with mindfulness.
Remarkably, we found that functional connectivity and network properties between 160 and 170 Hz are correlated with individual ratings of mindfulness, attention and awareness. For this frequency range, it appears that the less mindful a person is (indicated by high MAAS scores) the stronger the disconnection (represented by a negative correlational trend for density) but also the stronger the small worldedness (positive correlation). The effect of small worldedness can generally be driven by changes in clustering or path length of a network (each normalized by analogous measures derived from random networks with the same amount of nodes and edges). Our data shows unambiguously that the effect was driven by clustering that also showed a positive correlation with MAAS scores, while no correlation occurred for path length. This suggests that meditation shapes brain activity in such a way that on a global level it is less functionally connected and more modular (clustered) for persons with low mindfulness scores and vice versa for persons with high mindfulness scores. In other words, the correlations indicate that stronger effects are mainly carried by those meditators who show higher scores of the MAAS and might not have reached an ‘expert’ level yet, assuming that higher mindfulness is one relevant criterion of meditation expertise regardless of whether it might precede or follow practical meditation experience. Interestingly, calculating the sources of correlations between MAAS and local graph theoretical measures revealed that there were some sources in which both positive correlations of MAAS and local clustering and negative correlations of MAAS and degrees occurred (mainly in the bilateral thalamus and bilateral cingulate gyrus). The co-occurrence of both effects indicates that in less mindful persons it is mainly the long-range connections that suffer a decrease, while the communication to the immediate neighbors is undisturbed and even enhanced. It has been suggested that connectivity between the thalamus and paralimbic structures in the gamma band (30–100 Hz) is a crucial ingredient for self-awareness (Lou et al., 2010). Given our results, this might indicate that the less ‘expert’ a meditator is (as measured by MAAS scores, again assuming that mindfulness is one characteristic of meditation expertise) the more additional effort (reflected by the correlations of connectivity/graph measures with MAAS scores between 160 and 170 Hz) is required during meditation to presumably reach an altered state awareness which most likely is due to altered connectivity and network properties.
Analogous processes can be seen during development and learning when a synaptic increase initially occurs that is then followed by neural pruning (see Bruer, 1999, for a review). Thus, this positive correlation between MAAS scores and density and clustering measures may represent the process of specialization during long-term meditation.
The level of expertise (indicated by MAAS scores) however apparently does not play a role for the general condition as evidenced by the missing correlation for the frequency range between 200 and 210 Hz for which the general condition effects were found. Significant disconnection of brain activity during meditation, evident as decreased density, in the high gamma frequency range (200–210 Hz) occurred. This global effect was likely driven by pronounced reductions of degrees mainly in the right insula, right parahippocampal gyrus, the anterior cingulate and the caudate as well as the cerebellum. These findings are in line with other studies reporting reduced connectivity during Zen or mindfulness-meditation, although those studies did not analyze high gamma and only report significant results for low gamma (e.g. Berkovich-Ohana et al., 2013; Faber et al., 2004; Lehmann et al., 2012).
We further found increased small worldedness during meditation as compared to non-meditation rest. This effect was driven by significantly increased clustering while no changes occurred in path length during meditation, compared to non-meditation rest. This suggests that even though during meditation the brain is less functionally connected it at the same time exhibits a more clustered organization. Interestingly, increased local clustering co-occurred with reduced degrees for the relevant frequencies (200–210 Hz) mainly in parts of the insula, cingulate gyrus and the caudate suggesting that for these structures the long-range connections are affected while communication with nearby nodes is enhanced.
Taken together, these findings suggest that Zen meditation is a highly active, energy-consuming state of mind. While mindfulness as a trait may strengthen and develop together with practical experience, the pattern of neuronal activity changes during the state of meditation itself. More specifically, the source power of low frequencies seems to be reduced, indicating that the brain shifts into another mental state, including, for example, altered self-awareness (Dor-Ziderman et al., 2013) as one begins to meditate. The present study adds significant insights to the current meditation literature, which has primarily focused on low gamma effects, by showing a strong relationship between high-frequency gamma power and practitioners' mindfulness ratings. This prominent effect could be localized in multiple brain regions involved in self-processing and body awareness, suggesting that meditators effectively train self-awareness and mindfulness. This is not only reflected in subjective reports (MAAS), but also in specific brain activity. Beyond that, we found remarkable correlations between mindfulness scores and high-frequency network measures (small worldedness, global and local clustering between 160 and 170 Hz), indicating that meditation shapes activity networks through the development of mindfulness skills.
Additionally, we found differences in functional connectivity indicated by graph theoretical measures in the high gamma range (density, small worldedness, global and local clustering between 200 and 210 Hz). The differences indicate that the brain shifts into a state of disconnection and high local specialization (see also Xue et al., 2014, for theta band effects) with emphasis on sources crucially involved in self-awareness and self-regulation.
Overall, these effects suggest increased oscillatory power and connectivity in regions that also show structural changes and differences in short-term and long-term meditators, indicating a continuative process of modulation in the meditating brain and complementing the cultivation of mindfulness on a behavioral level.
Acknowledgments
The work was supported by the Deutsche Forschungsgemeinschaft Grant WE 4156/2-1. The contribution by NW was supported by the European Research Council Grant WIN2CON, ERC StG 283404.
Conflict of interests
None.
Appendix A. Supplementary data
Supplementary material.
References
- Berkovich-Ohana A., Glicksohn J., Goldstein A. Mindfulness-induced changes in gamma band activity — implications for the default mode network, self-reference and attention. Clin. Neurophysiol. 2012;123:700–710. doi: 10.1016/j.clinph.2011.07.048. [DOI] [PubMed] [Google Scholar]
- Berkovich-Ohana A., Glicksohn J., Goldstein A. Studying the default mode and its mindfulness-induced changes using EEG functional connectivity. Soc. Cogn. Affect. Neurosci. 2013:1–9. doi: 10.1093/scan/nst153. [DOI] [PMC free article] [PubMed] [Google Scholar]
- Bolaños M., Bernat E.M., He B., Aviyente S. A weighted small world network measure for assessing functional connectivity. J. Neurosci. Methods. 2013;212:133–142. doi: 10.1016/j.jneumeth.2012.10.004. [DOI] [PubMed] [Google Scholar]
- Brovelli A., Lachaux J., Kahane P., Boussaoud D. High gamma frequency oscillatory activity dissociates attention from intention in the human premotor cortex. Neuroimage. 2005;28:154–164. doi: 10.1016/j.neuroimage.2005.05.045. [DOI] [PubMed] [Google Scholar]
- Brown K.W., Ryan R.M. The benefits of being present: mindfulness and its role in psychological well-being. J. Pers. Soc. Psychol. 2003;84:822–848. doi: 10.1037/0022-3514.84.4.822. [DOI] [PubMed] [Google Scholar]
- Bruer J.T. Neural connections: some you use, some you lose. Phi Delta Kappan. 1999;81:264–277. [Google Scholar]
- Bullmore E., Sporns O. Complex brain networks: graph theoretical analysis of structural and functional systems. Nat. Rev. Neurosci. 2009;10:186–198. doi: 10.1038/nrn2575. [DOI] [PubMed] [Google Scholar]
- Cahn B., Polich J. Meditation states and traits: EEG, ERP, and neuroimaging studies. Psychol. Bull. 2006;132:180–211. doi: 10.1037/0033-2909.132.2.180. [DOI] [PubMed] [Google Scholar]
- Cahn B., Delorme A., Polich J. Occipital gamma activation during Vipassana meditation. Cogn. Process. 2010;11:39–56. doi: 10.1007/s10339-009-0352-1. [DOI] [PMC free article] [PubMed] [Google Scholar]
- Cahn B., Delorme A., Polich J. Event-related delta, theta, alpha and gamma correlates to auditory oddball processing during Vipassana meditation. Soc. Cogn. Affect. Neurosci. 2013;8:100–111. doi: 10.1093/scan/nss060. [DOI] [PMC free article] [PubMed] [Google Scholar]
- Chiesa A., Malinowski P. Mindfulness-based approaches: are they all the same? J. Clin. Psychol. 2011;76:404–424. doi: 10.1002/jclp.20776. [DOI] [PubMed] [Google Scholar]
- Dor-Ziderman Y., Berkovich-Ohana A., Glicksohn J., Goldstein A. Mindfulness-induced selflessness: a MEG neurophenomenological study. Front. Hum. Neurosci. 2013;7:1–17. doi: 10.3389/fnhum.2013.00582. [DOI] [PMC free article] [PubMed] [Google Scholar]
- Faber P., Lehmann D., Gianotti L.R.R., Kaelin M., Pascual-Marqui R.D. International Society for Neuronal Regulation; Winterthur, Switzerland: 2004. Scalp and Intracerebral (LORETA) Theta and Gamma EEG Coherence in Meditation. [Google Scholar]
- Fayed N., Lopez Del Hoyo Y., Andres E., Serrano-Blanco A., Bellón J., Aguilar K., Cebolla A., Garcia-Campayo J. Brain changes in long-term Zen meditators using proton magnetic resonance spectroscopy and diffusion tensor imaging: a controlled study. PLoS One. 2013;8:e58476. doi: 10.1371/journal.pone.0058476. [DOI] [PMC free article] [PubMed] [Google Scholar]
- Fell J., Axmacher N., Haupt S. From alpha to gamma: electrophysiological correlates of meditation-related states of consciousness. Med. Hypotheses. 2010;75:218–224. doi: 10.1016/j.mehy.2010.02.025. [DOI] [PubMed] [Google Scholar]
- Ferrarelli F., Smith R., Dentico D., Riedner B.A., Zennig C., Benca R.M., Lutz A., Davidson R.J., Tononi G. Experienced mindfulness meditators exhibit higher parietal-occipital EEG gamma activity during NREM sleep. PLoS One. 2013;8:e73417. doi: 10.1371/journal.pone.0073417. [DOI] [PMC free article] [PubMed] [Google Scholar]
- Grant J.A., Courtemanche J., Duerden E., Duncan G., Rainville P. Cortical thickness and pain sensitivity in zen meditators. Emotion. 2010;10:43–53. doi: 10.1037/a0018334. [DOI] [PubMed] [Google Scholar]
- Gregoriou G., Gotts S., Zhou H., Desimone R. High-frequency, long-range coupling between prefrontal and visual cortex during attention. Science. 2009;324:1207–1210. doi: 10.1126/science.1171402. [DOI] [PMC free article] [PubMed] [Google Scholar]
- Gross J., Kujala J., Hämäläinen M., Timmermann L., Schnitzler A., Salmelin R. Dynamic imaging of coherent sources: studying neural interactions in the human brain. Proc. Natl. Acad. Sci. U. S. A. 2001;98:694. doi: 10.1073/pnas.98.2.694. [DOI] [PMC free article] [PubMed] [Google Scholar]
- Hasenkamp W., Barsalou L. Effects of meditation experience on functional connectivity of distributed brain networks. Front. Hum. Neurosci. 2012;6:1–14. doi: 10.3389/fnhum.2012.00038. [DOI] [PMC free article] [PubMed] [Google Scholar]
- Hebert R., Lehmann D., Tan G., Travis F., Arenander A. Enhanced EEG alpha time-domain phase synchrony during transcendental meditation: implications for cortical integration theory. Signal Process. 2005;85:2213–2232. [Google Scholar]
- Hinterberger T., Schmidt S., Kamei T., Walach H. Decreased electrophysiological activity represents conscious state of emptiness in meditation. Front. Psychol. 2014;5:1–14. doi: 10.3389/fpsyg.2014.00099. [DOI] [PMC free article] [PubMed] [Google Scholar]
- Hodgins H.S., Adair K.C. Attentional processes and meditation. Conscious. Cogn. 2010;19:872–878. doi: 10.1016/j.concog.2010.04.002. [DOI] [PubMed] [Google Scholar]
- Hölzel B.K., Carmody J., Vangel M., Congleton C., Yerramsetti S.M., Gard T., Lazar S. Mindfulness practice leads to increases in regional brain gray matter density. Psychiatry Res. 2011;191:36–43. doi: 10.1016/j.pscychresns.2010.08.006. [DOI] [PMC free article] [PubMed] [Google Scholar]
- Jensen O., Kaiser J., Lachaux J.P. Human gamma-frequency oscillations associated with attention and memory. Trends Neurosci. 2007;30:317–324. doi: 10.1016/j.tins.2007.05.001. [DOI] [PubMed] [Google Scholar]
- Jokisch D., Jensen O. Modulation of gamma and alpha activity during a working memory task engaging the dorsal or ventral stream. J. Neurosci. 2007;27:3244–3251. doi: 10.1523/JNEUROSCI.5399-06.2007. [DOI] [PMC free article] [PubMed] [Google Scholar]
- Kabat-Zinn J. Mindfulness-based interventions in context: past, present, and future. Clin. Psychol. Sci. Pract. 2006;10:144–156. [Google Scholar]
- Kang D., Jo H., Jung W., Kim S., Jung Y., Choi C., Lee U., An S., Jang J., Kwon J. The effect of meditation on brain structure: cortical thickness mapping and diffusion tensor imaging. Soc. Cogn. Affect. Neurosci. 2013;8:27–33. doi: 10.1093/scan/nss056. [DOI] [PMC free article] [PubMed] [Google Scholar]
- Kantak S.S., Wittenberg G.F., Liao W.W., Magder L.S., Rogers M.W., Waller S.M. Posture-related modulations in motor cortical excitability of the proximal and distal arm muscles. Neurosci. Lett. 2013;533:65–70. doi: 10.1016/j.neulet.2012.10.048. [DOI] [PMC free article] [PubMed] [Google Scholar]
- Kasamatsu A., Hirai T. An electroencephalographic study on the zen meditation (Zazen) Folia Psychiatr. Neurol. Jpn. 1966;20:315–336. doi: 10.1111/j.1440-1819.1966.tb02646.x. [DOI] [PubMed] [Google Scholar]
- Kilpatrick L.A., Suyenobu B.Y., Smith S.R., Bueller J.A., Goodman T., Creswell J.D., Tillisch K., Mayer E.A., Naliboff B.D. Impact of mindfulness-based stress reduction training on intrinsic brain connectivity. Neuroimage. 2011;56:290–298. doi: 10.1016/j.neuroimage.2011.02.034. [DOI] [PMC free article] [PubMed] [Google Scholar]
- Kubota Y., Sato W., Toichi M., Murai T., Okada T., Hayashi A., Sengoku A. Frontal midline theta rhythm is correlated with cardiac autonomic activities during the performance of an attention demanding meditation procedure. Cogn. Brain Res. 2001;11:281–287. doi: 10.1016/s0926-6410(00)00086-0. [DOI] [PubMed] [Google Scholar]
- Lachaux J.P., George N., Tallon-Baudry C., Martinerie J., Hugueville L., Minotti L., Kahane P., Renault B. The many faces of the gamma band response to complex visual stimuli. Neuroimage. 2005;25:491–501. doi: 10.1016/j.neuroimage.2004.11.052. [DOI] [PubMed] [Google Scholar]
- Lazar S.W., Kerr C.E., Wasserman R.H., Gray J.R., Greve D.N., Treadway M.T., McGarvey M., Quinn B.T., Dusek J.A., Benson H., Rauch S.L., Moore C.I., Fischl B. Meditation experience is associated with increased cortical thickness. NeuroReport. 2005;16:1893–1897. doi: 10.1097/01.wnr.0000186598.66243.19. [DOI] [PMC free article] [PubMed] [Google Scholar]
- Lehmann D., Faber P.L., Achermann P., Jeanmonod D., Gianotti L.R., Pizzagalli D. Brain sources of EEG gamma frequency during volitionally meditation-induced, altered states of consciousness, and experience of the self. Psychiatry Res. 2001;108:111–121. doi: 10.1016/s0925-4927(01)00116-0. [DOI] [PubMed] [Google Scholar]
- Lehmann D., Faber P.L., Tei S., Pascual-Marqui R., Milz P., Kochi K. Reduced functional connectivity between cortical sources in five meditation traditions detected with lagged coherence using EEG tomography. Neuroimage. 2012;60:1574–1586. doi: 10.1016/j.neuroimage.2012.01.042. [DOI] [PubMed] [Google Scholar]
- Leung M., Chan C., Yin J., Lee C., So K., Lee T. Increased gray matter volume in the right angular and posterior parahippocampal gyri in loving-kindness meditators. Soc. Cogn. Affect. Neurosci. 2013;8:34–39. doi: 10.1093/scan/nss076. [DOI] [PMC free article] [PubMed] [Google Scholar]
- Lou H., Gross J., Biermann-Ruben K., Kjaer T., Schnitzler A. Coherence in consciousness: paralimbic gamma synchrony of self-reference links to conscious experience. Hum. Brain Mapp. 2010;31:185–192. doi: 10.1002/hbm.20855. [DOI] [PMC free article] [PubMed] [Google Scholar]
- Luders E., Toga A.W., Lepore N., Gaser C. The underlying anatomical correlates of long-term meditation: larger hippocampal and frontal volumes of gray matter. Neuroimage. 2009;45:672–678. doi: 10.1016/j.neuroimage.2008.12.061. [DOI] [PMC free article] [PubMed] [Google Scholar]
- Luders E., Clark K., Narr K., Toga A.W. Enhanced brain connectivity in long-term meditation practitioners. Neuroimage. 2011;57:1308–1316. doi: 10.1016/j.neuroimage.2011.05.075. [DOI] [PMC free article] [PubMed] [Google Scholar]
- Luders E., Kurth F., Mayer E.A., Toga A.W., Narr K., Gaser C. The unique brain anatomy of meditation practitioners: alterations in cortical gyrification. Front. Hum. Neurosci. 2012;6:1–9. doi: 10.3389/fnhum.2012.00034. [DOI] [PMC free article] [PubMed] [Google Scholar]
- Luders E., Kurth F., Toga A.W., Narr K., Gaser C. Meditation effects within the hippocampal complex revealed by voxel-based morphometry and cytoarchitectonic probabilistic mapping. Front. Psychol. 2013;4:1–7. doi: 10.3389/fpsyg.2013.00398. [DOI] [PMC free article] [PubMed] [Google Scholar]
- Luders E., Thompson P., Kurth F., Hong J., Phillips O., Wang Y., Gutman B., Chou Y., Narr K., Toga A.W. Global and regional alterations of hippocampal anatomy in long-term meditation practitioners. Hum. Brain Mapp. 2013;34:3369–3375. doi: 10.1002/hbm.22153. [DOI] [PMC free article] [PubMed] [Google Scholar]
- Lutz A., Greischar L.L., Rawlings N.B., Ricard M., Davidson R. Long-term meditators self-induce high-amplitude gamma synchrony during mental practice. Proc. Natl. Acad. Sci. U. S. A. 2004;101:16369–16373. doi: 10.1073/pnas.0407401101. [DOI] [PMC free article] [PubMed] [Google Scholar]
- Lutz A., Slagter H.A., Dunne J.D., Davidson R.J. Attention regulation and monitoring in meditation. Trends Cogn. Sci. 2008;12:163–169. doi: 10.1016/j.tics.2008.01.005. [DOI] [PMC free article] [PubMed] [Google Scholar]
- Maris E., Oostenveld R. Nonparametric statistical testing of EEG- and MEG-data. J. Neurosci. Methods. 2007;164:177–190. doi: 10.1016/j.jneumeth.2007.03.024. [DOI] [PubMed] [Google Scholar]
- Marzetti L., Del Gratta C., Nolte G. Understanding brain connectivity from EEG data by identifying systems composed of interacting sources. Neuroimage. 2008;42:87–98. doi: 10.1016/j.neuroimage.2008.04.250. [DOI] [PubMed] [Google Scholar]
- Michalak J., Heidenreich T., Ströhle G., Nachtigall C. Die deutsche Version der Mindful Attention and Awareness Scale (MAAS) The German version of the Mindful Attention and Awareness Scale (MAAS)Z. Klin. Psychol. Psychother. 2008;37:200–208. [Google Scholar]
- Muehlhan M.M., Marxen J., Landsiedel H., Malberg, Zaunseder S. The effect of body posture on cognitive performance: a question of sleep quality. Front. Hum. Neurosci. 2014 doi: 10.3389/fnhum.2014.00171. [DOI] [PMC free article] [PubMed] [Google Scholar]
- Murata T., Takahashi T., Hamada T., Omori M., Kosaka H., Yoshida H., Wada Y. Individual trait anxiety levels characterizing the properties of Zen meditation. Neuropsychobiology. 2004;50:189–194. doi: 10.1159/000079113. [DOI] [PubMed] [Google Scholar]
- Muthukumaraswamy S.D. High-frequency brain activity and muscle artifacts in MEG/EEG: a review and recommendations. Front. Hum. Neurosci. 2013 doi: 10.3389/fnhum.2013.00138. [DOI] [PMC free article] [PubMed] [Google Scholar]
- Nolte G., Bai O., Wheaton L., Mari Z., Vorbach S., Hallett M. Identifying true brain interaction from EEG data using the imaginary part of coherency. Clin. Neurophysiol. 2004;115:2292–2307. doi: 10.1016/j.clinph.2004.04.029. [DOI] [PubMed] [Google Scholar]
- Oostenveld R., Fries P., Maris E., Schoffelen J.M. FieldTrip: open source software for advanced analysis of MEG, EEG, and invasive electrophysiological data. Comput. Intell. Neurosci. 2011;2011:1. doi: 10.1155/2011/156869. [DOI] [PMC free article] [PubMed] [Google Scholar]
- Ott U., Hölzel B., Vaitl D. Brain structure and meditation. How spiritual practice shapes the brain. In: Walach H., Schmidt S., Jonas W.B., editors. Neuroscience, Consciousness and Spirituality. Springer; Berlin: 2011. pp. 119–128. (Proceedings of the Expert Meeting in Freiburg/Breisgau 2008). [Google Scholar]
- Pagnoni G., Cekic M. Age effects on gray matter volume and attentional performance in Zen meditation. Neurobiol. Aging. 2007;28:1623–1627. doi: 10.1016/j.neurobiolaging.2007.06.008. [DOI] [PubMed] [Google Scholar]
- Pagnoni G., Cekic M., Guo Y. “Thinking about not-thinking”: neural correlates of conceptual processing during Zen meditation. PLoS One. 2008;3:e3083. doi: 10.1371/journal.pone.0003083. [DOI] [PMC free article] [PubMed] [Google Scholar]
- Percival D.B., Walden A.T. Cambridge University Press; Cambridge, UK: 1993. Spectral Analysis for Physical Applications: Multitaper and Conventional Univariate Techniques. [Google Scholar]
- Pope K.J., Fitzgibbon S.P., Lewis T.W., Whitham E.M., Willoughby J.O. Relation of gamma oscillations in scalp recordings to muscular activity. Brain Topogr. 2009;22:13–17. doi: 10.1007/s10548-009-0081-x. [DOI] [PubMed] [Google Scholar]
- Ray S., Niebur E., Hsiao S.S., Sinai A., Crone N.E. High-frequency gamma activity (80–150 Hz) is increased in human cortex during selective attention. Clin. Neurophysiol. 2008;119:116–133. doi: 10.1016/j.clinph.2007.09.136. [DOI] [PMC free article] [PubMed] [Google Scholar]
- Rubinov M., Sporns O. Complex network measures of brain connectivity: uses and interpretations. Neuroimage. 2010;52:1059–1069. doi: 10.1016/j.neuroimage.2009.10.003. [DOI] [PubMed] [Google Scholar]
- Saggar M., King B., Zanesco A., Maclean K., Aichele S., Jacobs T., Bridwell D., Shaver P., Rosenberg E., Sahdra B., Ferrer E., Tang A., Mangun G., Wallace B., Miikkulainen R., Saron C. Intensive training induces longitudinal changes in meditation state-related EEG oscillatory activity. Front. Hum. Neurosci. 2012;6:1–14. doi: 10.3389/fnhum.2012.00256. [DOI] [PMC free article] [PubMed] [Google Scholar]
- Slagter H.A., Lutz A., Greischar L.L., Francis A.D., Nieuwenhuis S., Davis J.M., Davidson R.J. Mental training affects distribution of limited brain resources. PLoS Biol. 2007;5:e138. doi: 10.1371/journal.pbio.0050138. [DOI] [PMC free article] [PubMed] [Google Scholar]
- Takahashi T., Murata T., Hamada T., Omori M., Kosaka H., Kikuchi M., Yoshida H., Wada Y. Changes in EEG and autonomic nervous activity during meditation and their association with personality traits. Int. J. Psychophysiol. 2005;55:199–207. doi: 10.1016/j.ijpsycho.2004.07.004. [DOI] [PubMed] [Google Scholar]
- Tang Y., Lu Q., Geng X., Stein E., Yang Y., Posner M. Short-term meditation induces white matter changes in the anterior cingulate. Proc. Natl. Acad. Sci. U. S. A. 2010;107:15649–15652. doi: 10.1073/pnas.1011043107. [DOI] [PMC free article] [PubMed] [Google Scholar]
- Tang Y., Lu Q., Fan M., Yang Y., Posner M. Mechanisms of white matter changes induced by meditation. Proc. Natl. Acad. Sci. U. S. A. 2012;109:10570–10574. doi: 10.1073/pnas.1207817109. [DOI] [PMC free article] [PubMed] [Google Scholar]
- Tassi P., Muzet A. Defining the states of consciousness. Neurosci. Biobehav. Rev. 2001;25:175–191. doi: 10.1016/s0149-7634(01)00006-9. [DOI] [PubMed] [Google Scholar]
- Travis F., Shear J. Focused attention, open monitoring and automatic self-transcending: categories to organize meditations from Vedic, Buddhist and Chinese traditions. Conscious. Cogn. 2010:1–9. doi: 10.1016/j.concog.2010.01.007. [DOI] [PubMed] [Google Scholar]
- Travis F., Haaga D., Hagelin J., Tanner M., Arenander A., Nidich S., Gaylord-King C., Grosswald S., Rainforth M., Schneider R. A self-referential default brain state: patterns of coherence, power, and eLORETA sources during eyes-closed rest and transcendental meditation practice. Cogn. Process. 2010;11:21–30. doi: 10.1007/s10339-009-0343-2. [DOI] [PubMed] [Google Scholar]
- van Leeuwen S., Muller N.G., Melloni L. Age effects on attentional blink performance in meditation. Conscious. Cogn. 2009;18:593–599. doi: 10.1016/j.concog.2009.05.001. [DOI] [PubMed] [Google Scholar]
- Wespatat V., Tennigkeit F., Singer W. Phase sensitivity of synaptic modifications in oscillating cells of rat visual cortex. J. Neurosci. 2004;24:9067–9075. doi: 10.1523/JNEUROSCI.2221-04.2004. [DOI] [PMC free article] [PubMed] [Google Scholar]
- Xue S., Tang Y., Posner M. Short-term meditation increases network efficiency of the anterior cingulate cortex. NeuroReport. 2011;22:570–574. doi: 10.1097/WNR.0b013e328348c750. [DOI] [PubMed] [Google Scholar]
- Xue S., Tang Y., Tang R., Posner M. Short-term meditation induces changes in brain resting EEG theta networks. Brain Cogn. 2014;87:1–6. doi: 10.1016/j.bandc.2014.02.008. [DOI] [PubMed] [Google Scholar]
Associated Data
This section collects any data citations, data availability statements, or supplementary materials included in this article.
Supplementary Materials
Supplementary material.