

Summary
The dorsal raphe nucleus (DRN) in the midbrain is a key center for serotonin (5-hydroxytryptamine; 5-HT) expressing neurons. Serotonergic neurons in the DRN have been theorized to encode punishment by opposing the reward signaling of dopamine neurons. Here, we show that DRN neurons encode reward, but not punishment, through 5-HT and glutamate. Optogenetic stimulation of DRN Pet-1 neurons reinforces mice to explore the stimulation-coupled spatial region, shifts sucrose preference, drives optical self-stimulation, and directs sensory discrimination learning. DRN Pet-1 neurons increase their firing activity during reward tasks and this activation can be used to rapidly change neuronal activity patterns in the cortnassociated with 5-HT, they also release glutamate, and both neurotransmitters contribute to reward signaling. These experiments demonstrate the ability of DRN neurons to organize reward behaviors and might provide insights into the underlying mechanisms of learning facilitation and anhedonia treatment.
Keywords: reward, learning, 5-HT, glutamate, Vglut3, optogenetics, brain-machine interface, tetrode recording
Introduction
Reward processing is a fundamental function of the brain. Animal and human behaviors are reinforced by rewards, and the inability to experience rewarding stimuli is a key feature of depression and schizophrenia in humans (Der-Avakian and Markou, 2012). Studies in the last six decades have identified the brain reward system as an interconnected set of brain structures that are important for reward processing. Within this system, dopamine neurons in the midbrain ventral tegmental area (VTA) are believed to play pivotal roles (Wise and Rompre, 1989). The dorsal raphe nucleus (DRN) projects extensively to several reward-related brain areas, and this structure is the major source of 5-HT in the forebrain (Jacobs and Azmitia, 1992; Vertes, 1991). As the 5-HT system is an important target for the treatment of depression and several other major psychiatric disorders (Mann, 1999), studying the functions of DRN neurons in reward signaling might provide insight into the circuit mechanisms of reward processing and may suggest avenues to treating mental disorders.
While there has been much work on reward circuits in the brain, the roles of DRN neurons in reward signaling have been largely overlooked, likely reflecting a wide range of literature reporting conflicting views on the precise relationship between the activity of DRN neurons and animal reward behavior (Kranz et al., 2010). Although DRN neurons are heterogeneous in their neurotransmitter phenotypes, most studies have been focused on the behavioral effects of changing 5-HT levels and many studies have proposed 5-HT as an opponent to dopamine's rewarding activities. Decreasing brain 5-HT levels promotes impulsive behavior that should normally be suppressed in response to situations involving stress or punishment (Clarke et al., 2004; Crockett et al., 2009; Tye et al., 1977). Pharmacological studies suggest that 5-HT opposes the action of dopamine in reward-associated tasks and inhibits the reinforcement effects of intracranial electric self-stimulation (Abler et al., 2012; Amit et al., 1991; Di Matteo et al., 2001; Fletcher et al., 1999). In addition, some DRN neurons are activated by aversive cues or negative rewards (Li et al., 2013; Ranade and Mainen, 2009; Schweimer and Ungless, 2010). Thus, these previous experiments have supported the notion that DRN neurons may encode punishment and mediate behavioral suppression through the release of 5-HT to counter the dopamine system (Cools et al., 2008; Daw et al., 2002; Dayan and Huys, 2009). However, depleting 5-HT impairs reward processing in humans and animals (Miyazaki et al., 2012; Seymour et al., 2012). Several recent electrophysiological studies report that the activity of subsets of DRN neurons is affected by reward size and delay (Bromberg-Martin et al., 2010; Inaba et al., 2013; Miyazaki et al., 2011; Nakamura et al., 2008a; Ranade and Mainen, 2009), suggesting that the DRN might modulate certain aspects of reward processing as well.
Precise activation of DRN neurons can directly test whether the activity of these neurons signifies reward or punishment. In this study, we selectively expressed the light-sensitive cation channel ChannelRhodopsin2 (ChR2) in DRN neurons (Boyden et al., 2005), using the ePet1-Cre mouse line that has been extensively used to drive gene expression in 5-HT neurons (Scott et al., 2005). Unlike slow and diffusive pharmacological manipulations, optogenetic stimulation enables us to precisely activate neurons in the DRN and overcomes the drawback of stimulating the fibers of passage with electrical stimulation. After finding that stimulation of DRN Pet-1 neurons reinforces behavior and guides animal learning, we performed recordings from behaving mice and observed the selective activation of these neurons during reward-associated tasks. Moreover, we combined whole-cell recordings with behavioral assays using mutant mice to show that DRN Pet-1 neurons require glutamate and 5-HT to mediate reward signaling. These results support the concept of DRN as a reward center in the brain and provide important implications for theories of reward and 5-HT function.
Results
Optogenetic activation of DRN Pet-1 neurons produces strong reward
We used an optogenetic approach to stimulate DRN neurons. The gene encoding ChR2-mCherry or mCherry was selectively targeted into DRN neurons of ePet1-Cre mice using a Cre-depen;ouble floxed’ inverted open reading frame (AAV-DIO; Figures 1A and S1A) (Zhang et al., 2010). The Pet-1 gene encodes a transcription factor selectively expressed in brain 5-HT neurons (Hendricks et al., 2003), and the transgenic ePet1-Cre mouse line is commonly used to label brain 5-HT neurons (Scott et al., 2005). Two weeks after virus infusion into the center of the DRN, ChR2-mCherry was robustly expressed throughout the DRN and its distribution pattern resembled that of 5-HT (Figures 1B and S1B). Because of the membrane expression of ChR2-mCherry, we injected AAV-DIO-mCherry to label Pet-1 neurons with mCherry and examined labeling efficiency and selectivity using the immunostaining of tryptophan hydroxylase 2 (Tph2), a marker of central 5-HT neurons (Zhang et al., 2004). Overall 96.9 ± 0.4% of Tph2+ neurons in the DRN were labeled with mCherry and 92.4 ± 0.7% of all mCherry+ neurons exhibited clear Tph2 immunoreactivity (n = 4,669 mCherry+ neurons from 12 brain sections of 3 mice; Figure S1C-E). DRN Pet-1 neurons did not express tyrosine hydroxylase (TH), a marker of dopamine neurons (Figure S1F and G). Whole-cell recordings from brain slices demonstrated that ChR2-mCherry+ neurons in the DRN were reliably activated by blue light pulses to faithfully fire action potentials at a frequency of up to 20 Hz (Figure 1C and S1H-M).
Figure 1. Optogenetic activation of DRN Pet-1 neurons reinforces area-specific exploratory behavior.
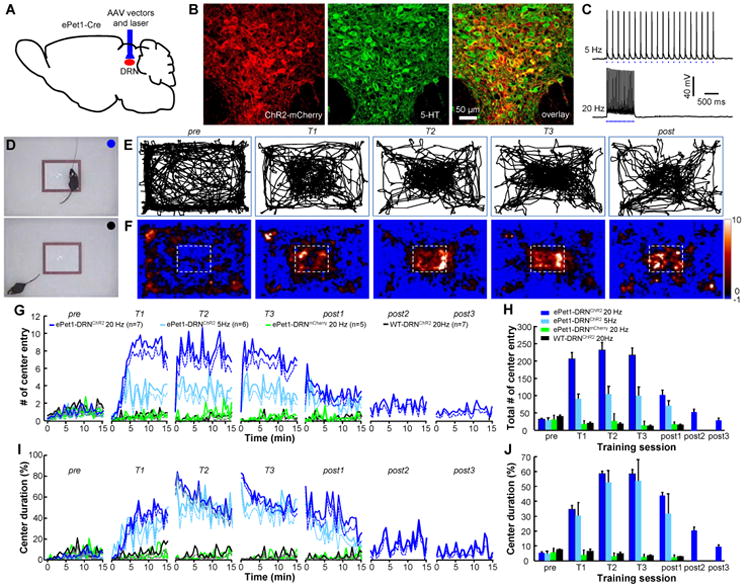
(A-C) ChR2 was selectively expressed in DRN Pet-1 neurons by infusing AAV-DIO-ChR2-mCherry viral vectors into the DRN of ePet1-Cre mice (A), which drive ChR2-mCherry expression (red in B) in 5-HT neurons (green). Recordings from brain slices demonstrate precise neuronal activation with brief blue light pulses at 5 and 20 Hz (C). (D) The method of iClass training. The body positions of an ePet1-DRNChR2 mouse were video-tracked and light pulses were delivered to the DRN through an optical fiber when the mouse entered the marked center subarea of an open field (blue circle, upper image). Light was not applied when the mouse was out of the center area (black circle; lower image). (E and F) The locomotion tracks (E) and heat maps (F) illustrating the spatial exploration of a mouse before (pre), during (T1-T3), and after (post) iClass training sessions. The color scale at the right indicates the duration in a specific area normalized by the average time if the mouse had lacked any spatial preference. (G and H) Plots of the instantaneous rates (G) and the total number (H) of center entries across sessions (30 s per point) for ePet1-DRNChR2 mice, ePet1-DRNmCherry mice, and nontransgenic littermates injected with AAV-DIO-ChR2-mCherry virus (WT-DRNChR2). The dashed lines indicate mean-SEM. The error bars indicate SEM in this and following figures. (I and J) The instantaneous ratio (I) and the mean ratio (J) of center duration across sessions. p<0.001, Tukey's multiple comparisons between ePet1-DRNChR2 groups and control groups. See also Figures S1, S2 and Movies S1, S2.
We investigated the behavioral effects of stimulating DRN Pet-1 neurons using a method named intraCranial light administration in a specific subarea (iClass). In the iClass training sessions, mouse exploration within a marked rectangular subarea of an open field triggered the delivery of blue light pulses to the DRN through an implanted optical fiber (Figure S1B). Normally mice avoid the center area and prefer contact with the walls and corners. Based on the efficiency of driving gene expression in 5-HT neurons and the punishment theory of the 5-HT system, we originally predicted that ePet1-DRNChR2 mice would avoid a designated corner area after coupling to light stimulation (473 nm, 15 ms pulses at 20 Hz). Surprisingly, these mice exhibited a strong preference of the stimulation-coupled corner (Figure S2A and B).
To assay the potential reinforcement effect more stringently, we examined whether mice could be trained to increase exploration in the center subarea of an open field by overcoming the instinctive avoidance of open space (Figures 1D and S2C). All ePet1-DRNChR2 mice dramatically increased center exploration after the start of iClass training using 5 or 20-Hz light pulses, whereas no such effect was observed in control mice lacking functional ChR2 expression in the DRN (Figures 1E, F and S2D-F; Supplementary Movie 1). Minutes after the onset of the first training session (T1), the center entry frequency and exploration time of ePet1-DRNChR were increased 8-fold (Figure 1G-J). Only 6.6 s of optical stimulation over four entries were required to induce a significant change in the exploratory behavior of ePet1-DRNChR2 mice (Figure S2G and H). During the following two days, the exploration frequency and duration in the designated center area were further increased to nearly 12-fold that of the baseline (Figure 1G-J and Supplementary Movie 2). Stimulation at 5 Hz produced a significant increase in center exploration, although the center entry numbers were fewer than those induced through 20-Hz stimulation (Figure 1G-J and S2F). Following one or two 15-min sessions without light stimulation, the ePet1-DRNChR2 mice reduced center exploration and locomotor activity to pre-training levels (Figure 1G-J and S2I, J), indicating that the behavioral effects of iClass training are extinguishable.
Thus, the results of the iClass experiments suggest that activating DRN Pet-1 neurons positively reinforces behaviors and signals reward. We adapted the two-bottle preference test to compare the reward value conferred by the optogenetic activation of DRN Pet-1 neurons relative to the innate valence of ingested sucrose solutions (Domingos et al., 2011). In this test, mice had a choice of licking two contact lickometers to access liquid from the two bottles, which distributed sucrose and water, separately. Mice without light stimulation preferred sucrose solution, and the reward value of sucrose reached a plateau at a concentration of 5% (Figure 2A). For ePet1-DRNChR2 mice, we coupled DRN stimulation with licking for water, but not sucrose solution (20 Hz 1 s or 5 Hz 2 s; Figure 2B). Light coupling at either 5 or 20 Hz allowed water to compete favorably against 0-2% of sucrose, and produced preference scores comparable to those observed with 5% sucrose (Figure 2C and D). This result indicates that the optogenetic stimulation of DRN Pet-1 neurons produces a reward value of over 5% sucrose solution.
Figure 2. Stimulation of DRN Pet-1 neurons shifts sucrose preference and causes operant reinforcement for self-administration.
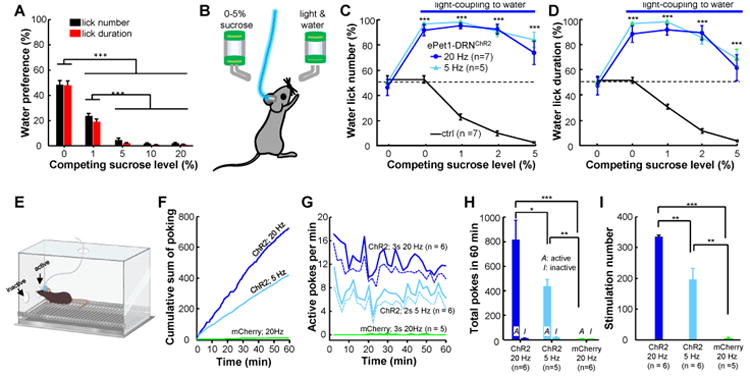
(A) In two-bottle preference tests, wild-type mice exhibited a reduced preference for water when the sucrose concentration was increased in the competing bottle. The preference scores were quantified using either lick numbers (black) or lick duration (red). ***, p < 0.01; One-way ANOVA followed by Tukey's multiple comparisons test; n = 8 mice. (B) The method of testing the effect of DRN neuron activation on shifting sucrose preference. (C and D) Coupling light stimulation to licking for water increased lick numbers (C) and lick duration (D) for water and shifted animal preference away from sucrose. ***, p < 0.001; Two-way ANOVA with Sidak's multiple comparisons between tests with or without light coupling. (E-I) DRN stimulation reinforces operant learning. (E) The method of optical self-stimulation. Mice received DRN light stimulation after nose poking through the ‘active’, but not the ‘inactive’, hole of an operant chamber. (F) Plots of cumulative nose-pokes of individual mice. ChR2-expressing mice, but not the mCherry control animals, vigorously poked the ‘active’ hole for self-stimulation. (G) The rate of active nose pokes across the test sessions of 60 min. ePet1-DRNChR2 mice stably completed ∼12 active pokes/min throughout the test sessions with strong light stimulation (3 s, 20 Hz) and ∼7 pokes/min with weaker stimulation (2 s, 5 Hz), whereas the number of active nose pokes was close to zero for the ePet1-DRNmCherry control mice. (H) Group data showing the total number of active and inactive pokes within a 60-min session. (I) ePet1-DRNChR2 mice earned more than 300 trains of light stimulation with strong stimulation and ∼200 stimulations with weak stimulation, whereas ePet1-DRNmCherry control mice collected only ∼3 stimulations. Due to the 5-s timeout for stimulation delivery, the number of earned stimulations was fewer than that of nose pokes. **, p < 0.01; ***, p < 0.0001; between-group t-tests. See also Movie S3.
We used the traditional method of self-stimulation to determine whether the optogenetic activation of DRN Pet-1 neurons could support self-stimulation with an instrumental action (Olds and Milner, 1954). Several recent studies have found that operant conditioning could be generated with varying success through the optogenetic stimulation of midbrain dopamine neurons (Adamantidis et al., 2011; Kim et al., 2012; Rossi et al., 2013; Witten et al., 2011). Individual mice were placed in a standard chamber equipped with nose-poke ports (Figure 2E). Nose-poke through the ‘active’, but not the ‘inactive’, port caused the passing of brief light pulses to the DRN (20 Hz 3 s or 5 Hz for 2 s), followed by a 5-s timeout period. After one hour of conditioning with either stimulation strength, ePet1-DRNChR2 mice dramatically increased nose poking through the active port (Figure 2F; Supplementary Movie 3). Stronger stimulation evoked ∼700 active pokes and resulted in ∼300 stimulations in an hour, whereas weaker stimulation generated approximately half of the response intensity (Figure 2G-I). As a control, there were <10 inactive pokes for ePet1-DRNChR2 mice and a similar small number of active pokes for ePet1-DRNmCherry control mice.
We further investigated whether the activation of DRN neurons could be used to guide sensory discrimination learning by challenging mice with an olfactory Go/No-go task (Figure 3A). Mice were trained to distinguish between two odors by licking a metal port for reward only after the presentation of an odorant (the odorant is termed CS+ and the action is termed a ‘hit’). The licking response to another odorant (termed CS- and ‘false positive’, respectively) resulted in a penalty of timeout. As a control, water-deprived wild-type mice were trained with 5% sucrose solution as a reward (Figure 3B). These animals took ∼500 training trials in two days to reach a stable performance of ≥90% correct by gradually reducing false positive responses (Figure 3C and D). For the ePet1-DRNChR2 mice that were not water-deprived, licking after CS+ did not result in fluid release, but rather triggered optical stimulation of the DRN (Figure 3B). These mice performed with high motivation and accuracy. All test animals completed 500 trials within a single 4-h training session. The ePet1-DRNChR2 mice reached the initial 90% correct response ratio after only 12 trials and reached a stable performance of ≥90% correct after ∼30 trials (Figures 3C and S3A, B). Only 6 CS- trials were needed for the ratio of false positive responses to decrease to 20% (Figures 3D and S3C). After conditioning with the original odorant pair, all ePet1-DRNChR2 mice learned to establish novel associations within ∼30 trials (Figures 3E and S3D, E). When the valences of the two conditioning odorants were reversed, these mice learned to adjust their responses in ∼100 trials (Figure 3F and S3F, G). As a comparison, the mice trained with sucrose solution completed the switch and reversal learning more slowly (Figure S3H-K). Thus, the optogenetic stimulation of DRN Pet-1 neurons efficiently guides the learning of sensory discrimination.
Figure 3. Activation of DRN Pet-1 neurons efficiently guides sensory discrimination learning.
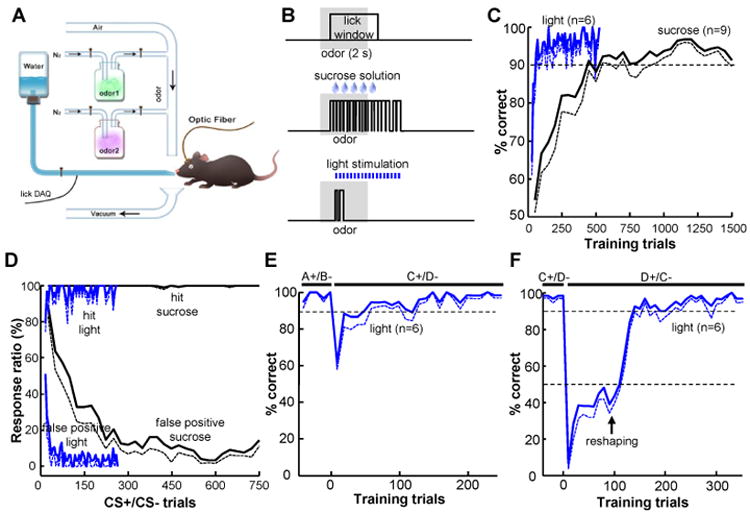
(A and B) The method of olfactory Go/No-go tests. Mice learned to lick a touch lickometer for sucrose solution or DRN stimulation in response to one of two odorants (A). The time lines of actions for reward trials are shown in (B). We used light stimulation of the DRN (3 s, 20 Hz) instead of sucrose solution for ePet1-DRNChR2mice. (C) The learning curves of odor discrimination for mice trained with the reward of sucrose solution or DRN light stimulation. The dashed curves indicate mean-SEM. (D) The mean ratio of hit responses to CS+ odor and false positive responses to CS- odor. (E) Plot of correct ratio of ePet1-DRNChR2 mice in the switch learning phase, during which the original odorant pair (A+/B-) was changed to a novel pair of odorants (C+/D-). (F) Light stimulation enabled efficient learning of the valence reversal of conditioning odor stimuli (from C+/D- to D+/C-). After odor reversal, the mice abandoned licking in response to both odorants. Sucrose solution was automatically released following the current CS+ odors for 2 or 3 trials, and the licking behavior was ‘reshaped’ for later light stimulation. See also Figure S3.
DRN Pet-1 neurons are activated during reward-associated tasks
We performed multi-electrode recordings in behaving mice to examine how DRN Pet-1 neurons respond during reward-associated tasks. The mice were trained to learn Go/No-go olfactory discrimination while head-fixed on a floating spherical treadmill (Figure S4A). A delay (1 s) was inserted between the odor cue (1 s) and the time window for sucrose consumption (2 s). After training, the mice reliably showed licking responses during the sucrose delivery time windows after the presentation of the CS+, but not CS-, odors (Figure S4B). A multichannel optetrode was then targeted at the DRN of head-fixed ePet1-DRNChR2 mice engaged in the task (Figures 4A and S4C, D). To address the difficulties of classifying cell types using electrophysiological and pharmacological properties (Kocsis et al., 2006), we identified Pet-1 cells based on the criteria that brief blue light pulses reliably evoked the firing of action potentials with similar waveforms (Figure 4B).
Figure 4. DRN Pet-1 neurons are activated in response to rewarding stimuli in an olfactory Go/No-go task.
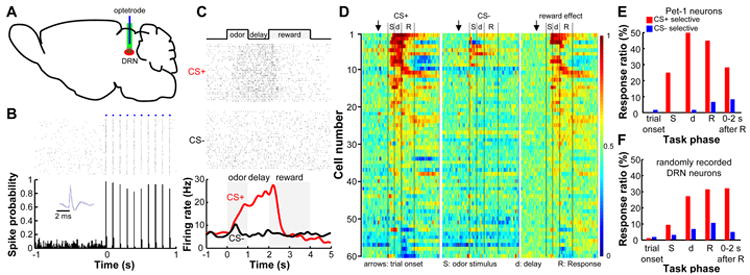
(A) DRN neurons were recorded from behaving mice with optetrodes. (B) Raster plot (upper) and peristimulus time histogram (PSTH; lower, bin width = 10 ms) show that light stimulation reliably evoked spike firing of a DRN neuron. The inset shows that light-evoked (blue) and spontaneous (black) spikes had similar waveforms. (C) Raster plot and PSTH (smoothed with a Gaussian kernel, σ=100 ms) of the activity of a DRN Pet-1 neuron aligned to odor onset. (D) Population activity of DRN Pet-1 neurons in the Go/No-go task. Each row represents the activity of a single neuron. For CS+ and CS- trials (left and middle panels), firing rates were compared with the mean rates before trial onset (arrows) to calculate receiver operating characteristic (ROC) values and are represented with colors. AUC, the area under a ROC curve. An AUC value of 0.5 indicates no difference from the mean activity before trial onset. Reward effect (right panel) was computed by comparing the firing rates of CS+ and CS- trials of the same neurons and an AUC value of 0.5 indicates no selectivity. (E) Distribution of identified DRN Pet-1 neurons with significant selective responses to CS+ or CS- within different phases of Go/No-go tasks. (F) Distribution of response selectivity for the 159 randomly recorded DRN neurons without cell-type identification. See also Figure S4.
A majority of 60 identified Pet-1 neurons were significantly activated during reward-associated tasks (Figure 4C and D). Unlike midbrain dopamine neurons that are transiently activated after the onset of reward-predictive sensory cues (Cohen et al., 2012; Schultz, 1997), DRN Pet-1 neurons typically fired at ∼5 spikes/s before trial onset, increased firing frequency after CS+, gradually reaching an activity peak of ∼18 spikes/s during the delay and sucrose consumption periods, and returned to the baseline before the completion of sucrose consumption (Figures 4C and S4E, F). The amplitude and duration of neuronal activation are comparable to the stimulation parameters used for behavioral assays. We calculated the receiver operating characteristic (ROC) value of the neural activity by comparing the spike firing rates after trial onset to those in a control time window before trial onset (Figure S4G) (Nakamura et al., 2008b). The response strength was then quantified as the area under the ROC curve (AUC). Most of the reward-responsive neurons were not activated following the delivery of reward-negative cues (Figure 4D). Further analysis revealed that ∼65% of the identified Pet-1 neurons (39 out of 60 cells) exhibit a significant reward effect during the period between odor cue and reward delivery.
An additional set of 159 neurons was randomly recorded from the DRN without the confirmation of optical tagging. Many of these cells showed tonic excitation only during reward-associated tasks, although the response patterns were more diverse than the identified Pet-1 neurons (Figure S4H and I). At the population level, the number of DRN neurons selectively recruited during reward tasks gradually increased after the onset of sensory stimuli (Figure S4J). During the specific phases of waiting and sucrose consumption, the responsive ratio reached a maximum of ∼50% for Pet-1 cells and ∼30% for randomly recorded DRN cells (Figure 4E and F). In contrast, only ∼5% of DRN neurons were selectively excited when an odorant was not associated with reward (Figure 4F).
The activity of DRN Pet-1 neurons changes cortical activation patterns
The strong behavioral effects suggest that the activity of DRN Pet-1 neurons can exert rapid physiological influences in the motor cortex. To study whether DRN stimulation could guide the change of cortical activity at the single-neuron level, we carried out recordings from head-fixed mice undergoing an operant brain-machine interface (BMI) task. While in behavioral experiments mice received light stimulation by directly executing a specific physical movement, in the BMI task animals learned to control laser pulses delivery into the DRN through the modulation of neuronal activity in the cortex (Koralek et al., 2012). Tetrode recordings were performed from the vibrissa motor cortical area (vM1) of ePet1-DRNChR2 mice (Figure 5A and S5A). After isolating several single-units from one tetrode, the ensemble activity was used to trigger light stimulation in the DRN (3 s, 20 Hz) when the firing frequency crossed a pre-determined threshold during the presentation of 10 s odorant pulses (Figure 5B). To prevent neuronal run-away firing, odorant pulses were applied only after the ensemble activity was below another threshold approximately equal to the baseline level.
Figure 5. Phasic activation of the DRN Pet-1 neurons efficiently directs the change of activity patterns of individual cortical neurons.
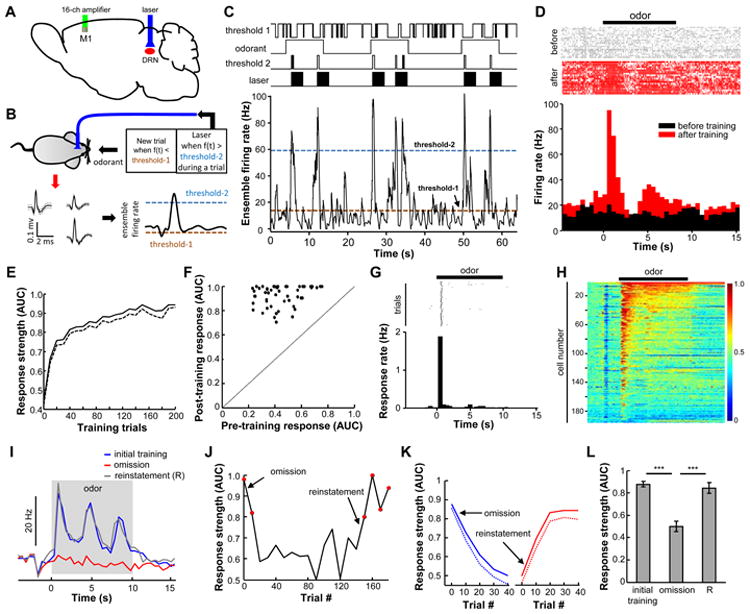
(A) Ensemble spiking activity was recorded from the vM1 of ePet1-DRNChR2 mice implanted with an optical fiber over the DRN for light stimulation. (B) Schematic for the BMI operant task. The ensemble firing rates of vM1 neurons defined odor onset and laser delivery to the DRN. Odorant pulses were applied when the ensemble firing rates were below a pre-determined firing rate (threshold-1). Light pulses (3 s, 20 Hz) were generated when ensemble-firing rates were above a pre-defined high level (threshold-2) during odor presentation. (C) Example traces from a well-trained vM1 ensemble. Neurons responded vigorously and reliably during odorant pulses. (D) Raster plots and PSTH (bin = 0.5 s) showing that an ensemble lacked response to odorants before the BMI task training and responded strongly after training. (E) Averaged learning curve of 52 well-trained ensembles. The dashed line represents mean-SEM. (F) 2-D plot comparing ensemble response strength to the odorant before and after the BMI training. (G) Raster plot and PSTH (bin = 0.5 s), showing the task response frequency of a well-trained vM1 ensemble. Threshold-2 crossing by the ensemble-firing rate was designated as a task response. (H) Heat map showing the ROC representation of PSTH data for all recorded single units (n = 195). (I) Odor-evoked responses of one ensemble were reduced by the omission of light stimulation and recovered after stimulation reinstatement. (J) Time-series plot of response strength showing the effect of stimulation omission and reinstatement on an ensemble. The red dots indicate significant responses (p<0.01; permutation test). (K) Population data showing the effects of stimulation omission and reinstatement across time (n = 14 ensembles from 6 mice). (L) Group data of stimulation omission tests (***, p < 0.001; paired t-test). See also Figure S5.
In this closed-loop setting, changes of firing activity from a single recording site in the cortex determined the occurrence of DRN stimulation and the subsequent reinforcement of cortical activity. Before training, the vM1 cells lacked a clear response to odor stimulation, and the instantaneous firing frequency occasionally crossed the threshold during odorant pulses, resulting in DRN stimulation, which in turn increased the chance of threshold crossing of vM1 neurons. After training, vM1 cells exhibited significant excitation tightly coupled to the onset of odorant pulses (p<0.01; permutation test; n=52 recording sites from 15 mice) (Figures 5C and D and S5B). Neuronal ensembles rapidly increased response strength within 20 trials, slowly reaching a peak with additional training (Figure 5E and F). The change in neuronal activity led to dramatic increase in the events of firing above the reward threshold only during odor pulses (Figure 5G). A majority of sorted single units (137 out of 195) exhibited significant excitatory responses after training, demonstrating learning effects at the level of single neurons (Figure 5H and S5C).
We asked whether mice intentionally controlled M1 activity to receive the light stimulation reward (goal-directed) or whether the actions were habitually produced through previous reinforcement. As goal-directed behaviors, but not habits, are sensitively affected by the contingency of an action on reward delivery and reward expectation (Jog et al., 1999; Koralek et al., 2012), we examined the effect of omitting stimulation after correct responses or administering light stimulation irrespective of target achievement. Both stimulation omission and contingency degradation reduced responses to the chance level after 30-40 trials, and the correct responses could be re-established after 10-20 trials for the reinstatement of stimulation coupling (Figure 5I-L and S5D-G). The omission effect is odor-specific. The introduction of a novel odorant lacking light stimulation did not affect responses to the previously rewarding odorant, and the new odorant was significantly less likely to evoke effective excitatory responses (Figure S5H). Thus, these results suggest that DRN activation guides goal-directed learning and can be exploited to efficiently build neuronal activation patterns in the cortex.
Stimulation of DRN Pet-1 neurons produces glutamate and 5-HT effects
Although the ePet1-Cre mouse line was commonly used to drive gene expression in central 5-HT neurons, it remained unclear whether DRN Pet-1 neurons only release 5-HT. About two thirds of 5-HT neurons in the DRN express VGluT3 (Hioki et al., 2010), a vesicular transporter that is believed to concentrate glutamate into synaptic vesicles (Fremeau et al., 2004; Hioki et al., 2010). We labeled Pet-1 neurons with tdTomato in ePet1-Cre;Ai14 mice and confirmed VGluT3 expression in a substantial number of DRN Pet-1 neurons (Figure 6A and B). VGluT3 is essential for the release of glutamate by auditory hair cells (Seal et al., 2008), but it has not been tested whether DRN Pet-1 neurons use glutamate as a neurotransmitter, and if so, whether the potential glutamate effect requires VGluT3.
Figure 6. DRN Pet-1 neurons release 5-HT and glutamate.
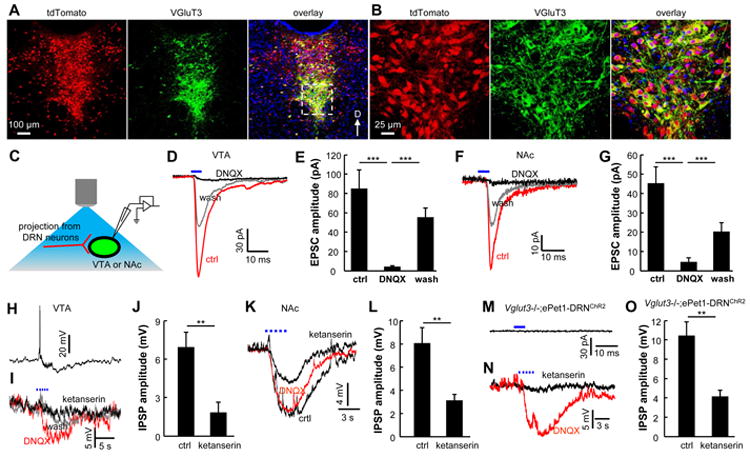
(A and B) In an ePet1-Cre;Ai14 mouse, VGluT3 (green) is expressed in many tdTomato-labeled neurons (red) along the midline. Panels in (B) show the zoom-in view of the dashed rectangular area in (A). (C) Schematic diagram showing the method of optogenetic stimulation and recordings from the VTA or the NAc in brain slices. (D and E) Representative recording traces from a VTA neuron (D) and group data (E) reveal that brief light stimulation of ChR2+ axonal terminals produced fast EPSCs that were reversibly blocked by DNQX (***, p<0.001; paired t-tests; n = 13 cells). (F and G) Glutamatergic EPSCs were also evoked by single-pulse light stimulations in the NAc shell (***, p<0.001; paired t-tests; n=7 cells). (H and I) Current-clamp recordings from a single VTA neuron show that trains of light pulses (3 s, 20 Hz) resulted in brief excitation, followed by slow inhibition (H). The initial excitatory response was blocked DNQX, whereas the slow inhibitory response was largely abolished by ketanserin, which blocks 5-HT2A and 5-HT2C receptors (I). (J) Group data showing the effect of ketanserin on the slow IPSPs (**, p<0.01; paired t-test; n = 6 cells). (K and L) Slow 5-HT effects were also observed in the NAc (**, p<0.01; paired t-test; n = 7 cells). (M and N) Brief light stimulation failed to elicit any fast EPSC from a cell in the VTA of a Vglut3-/-;ePet1-DRNChR2 mouse (M), but repetitive light stimulation (3 s, 20 Hz) evoked slow IPSP that was largely abolished by ketanserin (N). (O) Group data showing that the slow IPSPs were significantly reduced by ketanserin in Vglut3-/-;ePet1-DRNChR2 mice (*, p<0.01; paired t-test; n = 6 cells). See also Figure S6.
The axonal terminals of DRN Pet-1 neurons are densely distributed in the midbrain VTA and the forebrain nucleus accumbens shell (NAc shell; Figure S6A and B), which represent the key components in the reward system (Berridge and Kringelbach, 2008; Berridge et al., 2009). In both iClass assays and conditioned place preference (CPP) tests, we observed a strong reinforcement effect following the optical stimulation of axonal terminals in the VTA of ePet1-DRNChR2 mice (Figure S6C-H). Terminal stimulation in the NAc was ineffective to induce a clear learning effect in iClass assays, but this stimulation did support conditioned place preference (Figure S6F-I). We tested whether the reinforcement effects depended on the potential antidromic activation, by inactivating DRN neurons with intracranial lidocaine injection before training sessions (Stuber et al., 2011). Terminal stimulation in the VTA and NAc remained effective to produce significant reinforcement effects in the assays of iClass or CPP following the soma inactivation in the DRN (Figure S6C-I), suggesting that the reward signaling of DRN Pet-1 neurons might be mediated by their axonal fibers in the VTA and NAc or axonal collaterals outside of these two target areas.
Whole-cell patch-clamp recordings were performed using brain slices of ePet1-DRNChR2 mice to examine the effect of stimulating axonal terminals from DRN Pet-1 neurons on postsynaptic neurons (Figure 6C and S6J-M). In the VTA and NAc, single-pulse light stimulation produced fast excitatory responses that were reversibly abolished by the application of 6,7-dinitroquinoxaline-2,3-dione (DNQX), a selective glutamate receptor antagonist (Figure 6D-G). In both areas, prolonged light stimulation (20 Hz for 3 s) typically produced slow inhibitory responses that were substantially reduced by ketanserin (Figure 6H-L), a drug that blocks 5-HT2A and 5-HT2C receptors. In Vglut3-/-;ePet1-DRNChR2 mice lacking VGluT3 expression (Figure S6N), we detected 5-HT effects but did not observe any fast glutamatergic EPSCs in the 43 cells tested (Figure 6M-O). Thus, DRN Pet-1 neurons release glutamate and 5-HT as neurotransmitters, and VGluT3 is required for glutamate release.
Both glutamate and 5-HT contribute to reward signaling
Since a vast majority of DRN Pet-1 neurons are serotonergic, we studied the role of 5-HT in reward signaling by analyzing the behavioral effects after genetically or chemically depleting brain 5-HT. Tph2-/-;ePet1-DRNChR2 mice lacked Tph2 expression and exhibited a dramatic reduction of 5-HT levels in the DRN (Figure S7A-C). In iClass training tasks with 20-Hz stimulation, knocking out the Tph2 gene mildly reduced the center entry numbers or center duration in certain test sessions, but overall the stimulations produced a qualitatively clear reinforcement effect (Figures 7A-D and S7E and F). Brain 5-HT concentrations were reduced to ∼16% of basal levels following the injection of 4-Chloro-L-phenylalanine (L-pCPA), a tryptophan hydroxylase inhibitor (Figure S7B-D) (Liu et al., 2011). Depletion of 5-HT using L-pCPA similarly had only mild effects on ePet1-DRNChR2 mice (Figure 7A-D and S7E and F).
Figure 7. Data from iClass tests and two-bottle preference tests reveal that both 5-HT and glutamate contribute to reward signaling by DRN Pet-1 neurons.
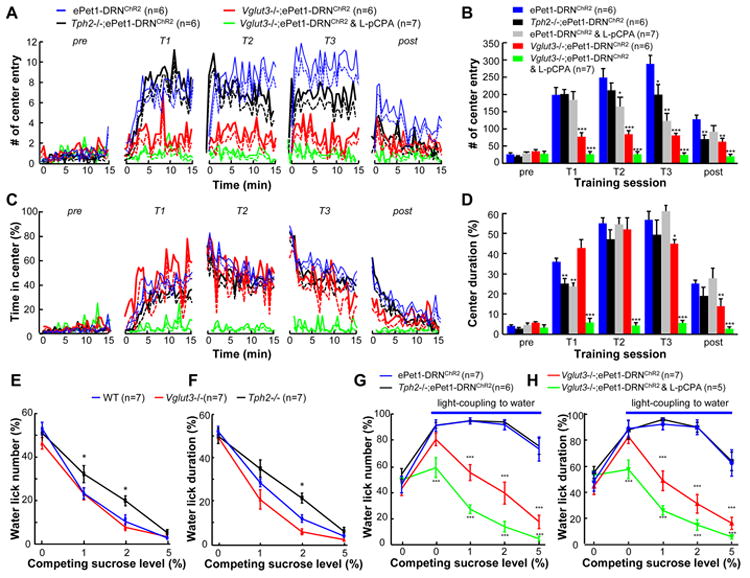
(A and B) In iClass tests, Tph2-/-;ePet1-DRNChR2 mice and L-pCPA-treated ePet1-DRNChR2 mice showed a mild but statistically significant reduction in the center entry number for certain training sessions (T2 or T3). Vglut3-/-;ePet1-DRNChR2 exhibited ∼50% reduction in the number of center entries of all training sessions. L-pCPA injection into Vglut3-/-;ePet1-DRNChR2 mice completely abolished the reward effect produced by the activation of DRN Pet-1 neurons.*, p<0.01; ***, p<0.001; t-tests between test groups and ePet1-DRNChR2 control mice. (C and D) The effect of knocking out the Vglut3 gene and/or depleting 5-HT on the center duration. (E and F) The sucrose preference scores quantified with lick numbers and lick duration, respectively. Both Tph2-/- and Vglut3-/- mice preferred sucrose to water, but the sucrose preference scores of Tph2-/- mice were lower than those of wild-type mice at the concentrations of 1 and 2%. *, p < 0.05; Two-way ANOVA and then Dunnett's multiple comparison tests between mutants and WT. (G and H) Sucrose preference scores show that light stimulation of the DRN Pet-1 neurons in Vglut3-/-;ePet1-DRNChR2 mice produced a reward value of ∼1% sucrose. L-pCPA injection into these mice completely disrupted reward signaling. **, p<0.01; ***, p<0.001; one-way ANOVA and then Tukey's post-hoc test between test groups and ePet1-DRNChR2 control mice. See also Figure S7.
We then investigated the role of glutamate through the analysis of the behavioral phenotypes of Vglut3-/-;ePet1-DRNChR2 mice. In iClass assays, Vglut3-/-;ePet1-DRNChR2 mice exhibited significantly fewer center entries but comparable center exploration time (Figure 7A-D), suggesting that both 5-HT and glutamate play a role and neither of the two transmitters is absolutely essential for the reinforcement effect of DRN Pet-1 neurons. Because both Vglut3 and Tph2 are located on the same chromosome, it is impossible to generate a double mutant through crossbreeding to examine the effect of disrupting both 5-HT and glutamate release. Therefore, we injected L-pCPA into Vglut3-/-;ePet1-DRNChR2 mice to block the transmission of glutamate and 5-HT by DRN Pet-1 neurons. L-pCPA injection completely abolished the reinforcement effect of DRN stimulation on Vglut3-/-;ePet1-DRNChR2 mice (Figure 7A-D and S7E and F).
In two-bottle preference tests without light coupling, both Tph2-/- mice and Vglut3-/- mice preferred sucrose in a concentration-dependent manner (Figure 7 E and F). Coupling DRN stimulation to licking for water (20 Hz 1 s) effectively shifted the sucrose preference of Tph2-/-;ePet1-DRNChR2 mice and produced a reward value comparable to those of ePet1-DRNChR2 mice, whereas knocking out the Vglut3 gene decreased the reward value from 5% to ∼1% sucrose (Figure 7 G and H). Following L-pCPA injection, stimulation coupling became completely ineffective to shift the sucrose preference of Vglut3-/-;ePet1-DRNChR2 mice (Figure 7 G and H), suggesting that 5-HT might contribute to the residual reward value following the disruption of glutamate release.
For self-stimulation tests in which light stimulation (20 Hz, 3s) was produced by each nose poke out of the timeout period (fixed ratio 1; FR1), knocking out Vglut3 alone substantially reduced the number of nose pokes, whereas Tph2-/-;ePet1-DRNChR2 mice responded normally (Figure 8A and S8A). However, the Tph2-/-;ePet1-DRNChR2 mice exhibited significantly weaker response rates than ePet1-DRNChR2 mice when it required 5 or 8 consecutive pokes (FR5 and FR8) to earn light stimulation (Figure 8B-D). Most of the Tph2-/-;ePet1-DRNChR2 mice abandoned nose-poking efforts after 10 minutes of testing (Figure S8A), suggesting that 5-HT is required for maintaining motivation during more difficult tasks.
Figure 8. Mice lacking Tph2 or VGluT3 show impaired acquisition of self-stimulation and olfactory discrimination learning.
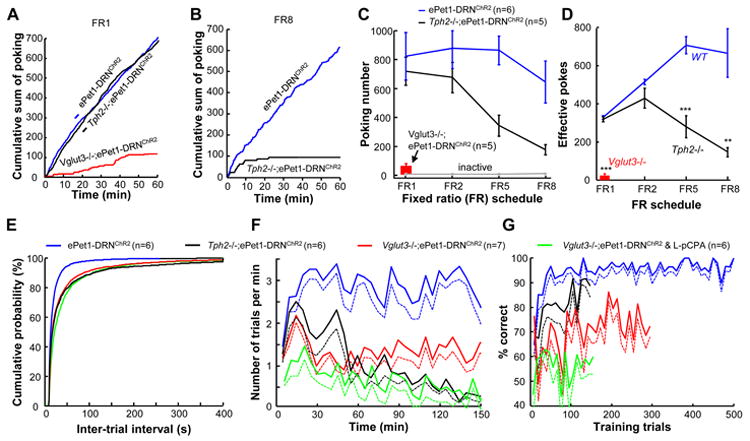
(A-D) The behavioral phenotypes of Tph2 and Vglut3 mutant mice in the tests of light self-administration. Vglut3-/-;ePet1-DRNChR2 mice but not Tph2-/-;ePet1-DRNChR2 mice exhibited a dramatic decrease in nose-poking in tests involving an FR1 schedule (A). Tph2-/-;ePet1-DRNChR2 mice responded with much lower intensity than Tph2+/+;ePet1-DRNChR2 mice in tests involving FR5 and FR8 schedules (B-D). In panel (D), a poke is considered effective if it occurred outside of the timeout period. **, p<0.01; ***, p<0.001; t-tests between test groups (Tph2-/- or Vglut3-/-) and the ePet1-DRNChR2 control group. (E-G) Knocking out either the Tph2 gene or the Vglut3 gene disrupted the olfactory discrimination learning directed by the stimulation of DRN Pet-1 neurons. (E) Plots of cumulative probability against inter-trial intervals for different animal groups. Knocking out the Tph2 or Vglut3 gene significantly increased the time required to initiate a new trial during the Go/No-go olfactory discrimination test (p<0.001; Kolmogorov-Smirnov test between knockout and wild-type mice). (F) Plots of trials per minute for different animal groups engaged in olfactory Go/No-go tasks driven by DRN stimulation. (G) The learning curves of different test groups. The plot for ePet1-DRNChR2 mice is derived from Figure 3C. See also Figure S8.
For Go/No-go olfactory discrimination tests, DRN stimulation was much less effective to drive Tph2-/-;ePet1-DRNChR2 mice and Vglut3-/-;ePet1-DRNChR2 mice to perform the task. Both groups of mutant mice required significantly longer time to initiate a new trial (Figure 8E). In contrast to ePet1-DRNChR2 mice that completed at least 500 trials within a daily 240 min training session, Tph2-/-;ePet1-DRNChR2 mice performed a maximum of 140 trials and abandoned their efforts after 150 min (Figure 8F). Vglut3-/-;ePet1-DRNChR2 mice maintained a lower rate of response throughout the session and completed ∼300 trials. Despite more variable and slower learning, both Tph2 and Vglut3 mutant mice achieved a correct ratio of ∼85% and ∼75%, respectively (Figure 8G and S8B, C). L-pCPA injection into Vglut3-/-;ePet1-DRNChR2 mice completely blocked the learning effect induced by DRN stimulation (Figure 8G).
Discussion
In this study, we investigated whether DRN neurons signal reward or punishment. Multiple behavioral assays reveal that the optogenetic activation of DRN Pet-1 neurons strongly reinforces behavior and efficiently guides learning. Recordings from behaving mice show that DRN Pet-1 neurons increase activity during reward-associated tasks. In addition, the stimulation of these neurons rapidly changes the activation pattern of cortical neurons to establish the predictive association of neuronal activity with a specific sensory stimulus. In slice preparations, the stimulation of DRN Pet-1 neurons produces postsynaptic effects mediated by 5-HT and glutamate receptors. In addition, the reward signaling is disrupted in in mice lacking functional Tph2 and VGluT3. These experiments demonstrate that these DRN Pet-1 neurons encode reward and 5-HT and glutamate contribute to these effects.
Since the pioneering intracranial electric self-stimulation experiments of Olds and Milner (1954), a set of brain structures have been identified as important for reward processing. The reward ‘hotspots’ include the midbrain VTA, the NAc shell, the ventral pallidum, the hypothalamus, the anterior cingulate cortex, and the orbitofrontal cortex (Berridge and Kringelbach, 2008). Neuronal activities in these areas might be integrated to process distinct components of reward, such as hedonia (‘liking’), motivation (‘wanting’), and learning (Berridge et al., 2009). Our behavioral assays show that the optogenetic activation of DRN Pet-1 neurons produces incentive motivation that promotes vigorous self-stimulation and generates high reward value comparable to that of ingested sucrose. In addition, the activation of DRN Pet-1 neurons efficiently guides sensory discrimination learning. These behavioral assays examine both operant and Pavlovian conditioning. The strong behavioral effects in all tests suggest that the DRN is a reward center and should be incorporated into models of the brain reward system.
DRN Pet-1 neurons might signal reward by targeting multiple brain areas, including the established reward centers. In addition to projections to sensory and motor cortical areas, the DRN forms extensive interconnections with essentially all nodes in the reward system (Vertes, 1991; Watabe-Uchida et al., 2012). The effectiveness of stimulating axonal terminals in the VTA and NAc suggests that DRN projections to these two brain areas are involved in reward signaling. However, the particularly strong effects of VTA stimulation do not necessarily indicate that DRN Pet-1 neurons signal reward solely through midbrain dopamine neurons. First, stimulating axonal terminals in the NAc could also reinforce animal behaviors in CPP tests. Moreover, DRN Pet-1 neurons and VTA dopamine neurons have different activation patterns in reward-associated tasks. After learning, dopamine neurons fire transiently following a reward-predicting cue (Cohen et al., 2012; Schultz et al., 1997), whereas DRN Pet-1 neurons exhibit a tonic increase in firing activity until reward delivery. This firing pattern has also been reported for subsets of randomly recorded DRN neurons (Bromberg-Martin et al., 2010; Miyazaki et al., 2011; Nakamura et al., 2008a). The distinct activation patterns suggest that DRN Pet-1 neurons and VTA dopamine neurons might play different roles in reward processing. Although dopamine has been synonymous with reward, previous studies have also revealed dopamine-independent reward behaviors. For example, sucrose remains rewarding for mice without dopamine (Cannon and Palmiter, 2003), and cocaine can produce reward through the 5-HT signaling pathway (Sora et al., 2001). Anatomically, there are strong reciprocal projections between the DRN and VTA (Kalen et al., 1988; Vertes, 1991; Watabe-Uchida et al., 2012). Thus, DRN Pet-1 neurons may target VTA dopamine neurons as well as other brain areas to organize reward behaviors.
The fast learning rates observed in the operant behavioral tests and the BMI-based tasks suggest that DRN neurons can rapidly modify neural circuits and facilitate animal learning. Coupling the stimulation of DRN Pet-1 neurons to the operant action of neuronal activity in the motor cortex, we observed real-time changes in the neuronal activity patterns of mice engaged in BMI tasks. This approach might be used to facilitate learning and memory formation. To control the movement of an external object with brain activity, neuroprosthetics accomplish the challenging task of decoding movement intention through long-term cortical recordings using a large number of electrodes (Koralek et al., 2012; Taylor et al., 2002). Our BMI recordings suggest that the method of coupling DRN stimulation to a given pattern of neuronal activation can increase the efficiency of establishing the neural code for controlling neuroprosthetic devices.
Another key finding of this study is that both 5-HT and glutamate contribute to the reward signaling of DRN Pet-1 neurons. Although DRN Pet-1 neurons have been considered serotonergic, these cells release glutamate and 5-HT. Blocking 5-HT synthesis or glutamate release results in partial impairments in a task-dependent manner. For behavioral tests of iClass, two-bottle preference, and self-stimulation with the FR1 schedule, knocking out Vglut3 but not Tph2 produces more obvious impairments. For Tph2 knockout mice, a clear performance reduction is observed when more efforts and longer intervals are required for earning DRN stimulation, such as in self-stimulation assays involving FR5 and FR8 schedules and olfactory Go/No-go tests. 5-HT might be particularly important for maintaining motivation in response to difficult tasks. Most importantly, the reward effects of stimulating DRN Pet-1 neurons are completely eliminated through the injection of L-pCPA, a tryptophan hydroxylase inhibitor, into VGluT3 knockout mice, suggesting an intersection of the two neurotransmission pathways. Thus, our data from mutant mice and L-pCPA injections strongly suggest that both 5-HT and glutamate contribute to the reward signaling of DRN Pet-1 neurons. Deficits in DRN 5-HT neurons have been implicated in depression of humans and animals (Amat et al., 2005; Krishnan and Nestler, 2008; Mann, 1999; Warden et al., 2012), a core symptom of which is anhedonia (Der-Avakian and Markou, 2012). Our data suggest that both 5-HT and glutamate signaling pathways of DRN neurons could be intervened to manipulate reward processing and treat anhedonia.
Several caveats of our approaches need to be mentioned. We examined the role of 5-HT by genetically and chemically depleting 5-HT. The contribution of glutamate was studied by analyzing the behavioral phenotypes of knocking out the Vglut3gene. We find that VGluT3 is required for the glutamatergic effects of DRN Pet-1 neurons and its mutant exhibits impairments in reward behaviors elicited by selective stimulation of these neurons. However, data from knockout mice might be confounded by developmental compensation. In addition to neurons in the raphe, hair cells in the ear and subsets of neurons in the striatum and cortex express VGluT3 (Herzog et al., 2004; Seal et al., 2008). Vglut3-/- mice exhibit normal locomotor behavior but have deafness and seizure-like electrical activity in the cortex (Seal et al., 2008), suggesting limitations of using these mice to precisely study the functions of glutamate from DRN Pet-1 neurons in reward processing. Clean dissection of the roles of 5-HT and glutamate might be achieved by temporally and spatially controlled conditional knockout of either the Tph2 or Vglut3 gene in the DRN.
How can our findings be reconciled with the published hypotheses that the activity of DRN 5-HT neurons encodes punishment? Both the DRN and the medial raphe nucleus (MRN) contain 5-HT neurons and the DRN is further separated into different subdivisions based on neurotransmitter phenotypes. For example, VGluT3 is expressed in 5-HT neurons in the center but not the two lateral wings of the DRN (Hioki et al., 2010). Since we mainly stimulated neurons in the center of the DRN, it cannot be excluded that some 5-HT neurons in the lateral wings of the DRN and the MRN may encode punishment signals (Lechin et al., 2006). Nevertheless, the punishment theory is largely based on the experiments of prolonged manipulations of global 5-HT levels, which differ from the phasic activation of DRN neurons in terms of temporal and spatial scales. In addition, it had not been firmly established that DRN neurons can release glutamate and early studies neglected the contribution of glutamate. Although the DRN has been reported to be an effective locus that supports electric self-stimulation, the ineffectiveness of 5-HT depletion has led to the suggestion that the reinforcement effect is produced through the stimulation of fibers of passage rather than neurons in the DRN (Deakin, 1980; Simon et al., 1976). While the reasons for these discrepancies between the behavioral studies are unclear, physiological studies have also challenged the simplified view that DRN neurons inhibit dopamine neurons. The optogenetic stimulation of DRN terminals directly excites VTA neurons through the action on glutamate receptors (Figure 6). Recordings in vivo show that 5-HT can exert complex excitation/inhibition patterns in dopamine neurons (Gervais and Rouillard, 2000). The effects of 5-HT and glutamate can be mediated by many receptors at both presynaptic and postsynaptic sites (Conn and Pin, 1997; Dingledine et al., 1999; Hoyer et al., 2002), suggesting a rich repertoire of physiological functions through DRN Pet-1 neurons. Analyzing the roles of these neurons in various microcircuits within the reward system might provide further insights into cellular and circuit mechanisms of reward processing.
Experimental Procedures
Methods and materials are described in details in Supplemental Experimental Procedures.
All experiments were performed on adult mice (10-16 weeks old, both male and female). The three transgenic mouse lines (ePet1-Cre, Tph2-/-, and Vglut3-/-) were crossed to the genetic background of C57BL/6N (Vitalriver Laboratory Animals, Beijing). The Tph2-/-;ePet1-Cre and Vglut3-/-;ePet1-Cre lines were produced by crossing ePet1-Cre mice with Tph2-/- and Vglut3-/- mice, respectively. For transgene expression, adeno-associated viral particles of serotype 9 for AAV-DIO-ChR2-mCherry or AAV-DIO-mCherry were infused into the DRN of ePet1-Cre mice. The mice were allowed to recover for 2-3 weeks before behavioral assays or physiological recordings.
We carried out five different behavioral tests to investigate the reinforcement effect of activating DRN Pet-1 neurons. Blue light pulses, generated by a diode-pumped solid-state laser, were passed to the DRN through an implanted optical fiber (473 nm wavelength, 15 ms pulse duration, 5 or 20 Hz frequency; 20 mW output power measured at the fiber tip with continuous light output; fiber diameter = 200 μm and NA = 0.22). The so-called iClass task was used to examine whether mice could be reinforced to explore a pre-designated area in an open field by coupling optical stimulation of DRN neurons with the mouse behavior of exploring this specific area. Animal positions were monitored by an overhead camera and laser was controlled by a custom-written Matlab program. Two-bottle preference tests were performed to examine whether mouse sucrose preference could be shifted by coupling DRN stimulation with animal licking for water (473 nm, pulse duration 15 ms, 20 Hz for 1 s or 5 Hz for 2 s). The preference scores were calculated as the ratio of the number or duration of licks of the light-coupled water bottle to the total lick number or duration within test sessions. The tests of intracranial optical self-stimulation were carried out by placing mice in an operant chamber equipped with two nose-poke detectors (one ‘active hole’ and one ‘inactive hole’). Nose-poking through the active hole resulted in the delivery of blue light pulses into the DRN through the optical fiber. We examined the effects of photoactivating DRN Pet-1 neurons on learning by subjecting the animals to an olfactory Go/No-go learning paradigm. Mice were trained to touch a lickometer for the reward of sucrose solution or DRN stimulation following the presentation of a specific odorant. Mice needed to inhibit licking following the presentation of another odorant to the punishment of timeout. We used the standard three-chamber unbiased conditioned place preference (CPP) test to evaluate the reward effect of stimulating ChR2+ terminal in the VTA or the NAc. To chemically deplete 5-HT, mice were i.p. injected with L-pCPA twice a day for 3 consecutive days before being subjected to behavioral tests. Brain monoamines were measured using high performance liquid chromatography coupled with electrochemical detection (HPLC-EC).
The methods of slice preparation, whole-cell patch recording, and photostimulation are similar to those described elsewhere (Ren et al., 2011). Briefly, coronal or horizontal brain sections (300 μm thick) were acutely prepared and continuously superfused with artificial cerebrospinal fluid (aCSF). Neurons in the DRN, VTA, or NAc shell were identified with mCherry fluorescence and DIC microscopy. Voltage-clamp and current-clamp recordings were carried out using a computer-controlled amplifier (MultiClamp700B; Molecular Devices). Blue light pulses were delivered by an optical fiber with its tip submerged in aCSF. Drugs (10 μM DNQX, 50 μM picrotoxin, 10 μM ketanserin; all from Sigma) were added to the superfusion aCSF through the dilution of stock solutions.
To record DRN neurons from mice performing olfactory discrimination tasks, water-deprived mice were head-fixed above a spherical treadmill supported by floating air. After the completion of training with the Go/No-go paradigm, we recorded extracellular spiking signals with 16-channel optetrodes comprising 4 tetrodes and an optical fiber (100 μm dia). The significance of neuronal response strength and selectivity was determined with permutation tests using 1000 bootstrap replicates and p < 0.01 was considered statistically significant (Ranade and Mainen, 2009). To record from the M1 cortical area from mice undergoing a brain-machine interface task, we inserted the 16-channel tetrodes into the vM1 area of head-fixed mice and placed an optical fiber above the DRN. Blue light pulses were delivered into the DRN only when the ensemble firing rates from one tetrode crossed a preset threshold during the presence of an odor. The response strengths were calculated by comparing neuronal activity during odorant application to the baseline and their statistical significance were quantified with permutation tests.
For histology and immunohistochemistry, mice were deeply anesthetized with an overdose of pentobarbital and perfused intracardially with 0.1 M phosphate buffer saline, followed by 4% paraformaldehyde. After cryoprotection, coronal sections (35 μm thickness) were incubated with primary rabbit antibodies against 5-HT, Tph2, VGluT3, or TH and then Cy2-conjugated secondary antibodies. Fluorescent signals were collected using a confocal microscope (LSM510 Meta, Zeiss).
Supplementary Material
Figure S1. ePet1-Cre drives gene expression in 5-HT neurons and enables precise optogenetic activation. Related to Figure 1. (A) Diagrams illustrating the angles and tip location of virus-injecting cannulae and optical fibers. (B) A picture showing ChR2-mCherry expression in the DRN. The overlaying placement of an optical fiber was based on the lesion track. Aq, aqueduct. (C and D) In ePet1-Cre mice, infusion of AAV-DIO-mCherry virus resulted in expression of mCherry (red) in Tph2-immunopositive neurons (green) in the DRN. Panels in (D) show zoom-in views of the dashed area in (C). (E) Three coronal sections showing that Pet-1+ neurons were efficiently labeled in the anterior (left), middle, and posterior (right) parts of the DRN. The level of mCherry expression tended to be lower in the two lateral wings. Red, mCherry; green, Tph2 immunoreactivity. (F and G) Pet-1 neurons are not dopaminergic. Pet-1 neurons were labeled by crossing the ePet1-Cre mouse line with the Ai14 reporter line. None of the tdTomato+ Pet-1 neurons were immunopositive to tyrosine hydroxylase (TH), a marker of dopamine neurons. (H and I) Traces from current-clamp recordings (H) and voltage-clamp recordings (I) show the intrinsic properties of a ChR2-mCherry+ neuron in the DRN. Current injections ranged from -40 to 40 pA with a 10 pA interval (H) and voltage commands were applied at 5 mV per step (I). (J) Single brief light pulses (5 ms) elicited a large depolarizing potential and the firing of an action potential in the current-clamp mode (upper) and a strong inward current in the voltage-clamp mode (lower). (K) Sustained light pulses (1 s) resulted in depolarization and action potential firing in the current-clamp mode (upper) and a strong inward current in the voltage-clamp mode (lower). (L) Trains of brief light pulses (blue dots) produced temporally precise firing of action potentials at the frequency of 10 and 50 Hz. Inset shows the zoom-in view of the spiking activity in response to 50 Hz stimulation. (M) The mean ratio of successful spike generation in relationship to light stimulation at different frequencies (n = 8 cells). Error bars indicate SEM in this and following figures.
Figure S2. Coupling light stimulation with animal navigation in a specific subarea reinforces exploration within the stimulation-coupled area. Related to Figure 1. (A) The method of iClass training by coupling light stimulation to animal exploration in a corner (dashed blue box). (B) When DRN stimulation was coupled to the entry of the ePet1-DRNChR2 mouse to the lower right corner (the dashed blue box), the animal explored the stimulated corner much more intensively. (C) The method of iClass training by coupling light stimulation to animal exploration in the center of an open field. (D) Heat maps showing the spatial distribution of exploration time before (pre), during (T1-3) and after (post) iClass trainings on ePet1-DRNChR2 mice (n = 7). The color scale at the right indicates the fold differences between actual time and the time normalized by the total area of the open field, with red indicating higher level of exploration than average (preference) and blue indicating lower levels (avoidance). (E) The iClass training did not have any effect on control animals, which were nontransgenic animals with AAV-DIO-ChR2-mCherry vector injection into the DRN (n = 7 WT-DRNChR2 mice). (F) Heat maps showing that the iClass training with 5 Hz stimulation increased the duration of central exploration (n = 6 ePet1-DRNChR2 mice). Dashed lines indicate mean - SEM. (G) The relationship between the instantaneous ratio of center duration (vertical axis) and the cumulative DRN-stimulation duration (horizontal axis) in the T1 session of ePet1-DRNChR2 mice (n = 7). The dashed horizontal line represents the value of mean + 3SEM calculated from the baseline of pre-training sessions and corresponds to a p value of 0.001. (H) Plot of the instantaneous time ratio in relationship to the cumulative center entries. (I) The instantaneous travel distance for ePet1-DRNChR2 mice (blue, n = 7), WT-DRNChR2 mice (black, n = 7), and ePet1-DRNmCherry mice (green, n = 5). (J) Bar plot shows significantly longer travel distance of ePet1-DRNChR2 mice during the iClass training sessions (*, p<0.05; **, p < 0.01; ***, p<0.001; Tukey's multiple comparisons test between animal groups after two-way ANOVA).
Figure S3. Detailed analyses of olfactory discrimination learning guided by DRN light stimulation or sucrose rewards. Related to Figure 3. (A) The learning curve of an ePet1-DRNChR2 mouse trained with DRN light stimulation. (B) Mean learning curves of the initial 500 trials for mice trained with sucrose solution and the initial 100 trials for mice trained with light stimulation. Dashed lines indicate mean - SEM. Each point represents 10 trials averaged across individual mice trained with sucrose solution and 2 trials for mice with light stimulation. (C) The ratio of hit responses to CS+ odor and that of false positive responses to CS- odor. Each trial block contains CS+ and CS- stimuli that were presented in a pseudorandom order. A total of 500 trials consisted of 250 CS+ trials and 250 CS- trials. (D and E) Learning curve of an ePet1-DRNChR2 mouse (D) and the plot of mean response ratio for all test mice (E) after the original conditioning odors (odor A as CS+ and B as CS-; A+/B-) were switched to a novel pair of conditioning odors (odor C as CS+ and D as CS-; C+/D-). These mice were trained with DRN light stimulation (n = 6 mice). (F and G) The mean learning curve and the ratios of hit and false positive responses of ePet1-DRNChR2 mice challenged with valence reversal of conditioning odor stimuli (from C+/D- to D+/C-). During the initial 20 trials of the reversal (10 CS+ or CS-trials in panel G), mice continued to respond to the now CS- and failed to respond to the now CS+, resulting in 50% correct ratio. Then mice abandoned licking following either CS+ or CS-. After reshaping, mice licked in response to both CS+ and CS- and then rapidly reduced their false positive responses to CS-. (H-K) The performance of wild-type mice with the reward of sucrose solution for the tests of odor switch (H and I) and reversal (J and K). n =9 mice.
Figure S4. Tetrode recordings from the DRN of mice engaged in an olfactory discrimination task. Related to Figure 4. (A) A picture showing the method of tetrode recording from head-fixed behaving mice. A mouse was placed on a spherical treadmill and accessed sucrose solution following one specific odor (CS+, 1s). (B) After training with the Go/No-go paradigm, mice responded with licking for sucrose consumption only after the reward-positive odorant (CS+, top panel) but not the reward-negative odorant (CS-, middle panel). The bottom panel shows the mean instantaneous lick rates during CS+ trials (red) and CS- trials (blue), respectively. The dashed lines indicate the time lines for trial onset, odor delivery, delay, and response time window for licking. (C) The methods of spike sorting. Spiking signals were recorded and single units were sorted using the Spike2 software for tetrode recordings. This program utilizes principle component analysis (PCA, upper panel) and takes advantage of the fact that spikes from the same single cell often appear simultaneously on the four recording points of the same tetrode with slightly different spike waveforms. In this example, two different single units (green and red) were sorted out from one tetrode. Numbers 1-4 indicate 4 recording sites of a tetrode. (C) After recordings, electrolytic lesion was made to confirm that the recording site was located within the DRN. Blue indicates DAPI counterstaining of cell nuclei. Aq: aqueduct. (E) The basal firing rates and peak firing rates of optogenetically confirmed DRN Pet-1 neurons (n=60) as well as DRN cells that were not confirmed with the method of optical tagging (n=159). (F) Distribution of basal firing rates and peak firing rates to CS+ of all recorded DRN neurons. Blue dots indicate positively identified Pet-1 neurons. Black dots indicate randomly recorded DRN cells. (G) ROC curves of a Pet-1 cell for CS+, CS- and net reward effects during different phases of the olfactory discrimination task. (H) Plots of PSTH of a randomly recorded DRN neuron (smoothed lines) and licking events (histogram) of the mouse for CS+ (upper) and CS- (lower) trials. PSTH bin = 100 ms. (I) Heat maps showing the response patterns of 159 DRN cells that were not identified with optetrodes. Although many of these cells were also selectively activated during reward-associated tasks, a more diverse response pattern was observed. Many cells were briefly activated during the onset of both CS+ and CS- trials. Some cells were inhibited by CS+ odors. Color scale at right indicates response intensity for the CS+ and CS- maps (left and middle panels) and CS+/CS- selectivity for the reward effect map (right panel), with a value of 0.5 indicates no response or no selectivity. (J) The distribution of neuronal response selectivity to CS+ and CS- trials during different task phase (trial onset, odor, delay, response, after response). Upper panels show the scatter plots of neuronal response strength as ROC values to CS+ and CS- trials. Each dot indicates one neuron. Lower panels plot the distribution of neuronal response selectivity to CS+ or CS- during each epoch. Response selectivity was calculated as ROC values. Neurons with significant selectivity for CS+ trials are shown in red and those with significant selectivity for CS- trials in blue (permutation test,p < 0.01;.
Figure S5. Optogenetic stimulation of DRN Pet-1 neurons guides rapid neuroprosthesis learning at the level of single neurons. Related to Figure 5. (A) A picture showing the setup for recording and optogenetic stimulation of a head-fixed behaving mouse on a spherical treadmill. Optical fiber was implanted over the DRN and electrodes consisting of 4 tetrodes were targeted at the vM1 cortical area. (B) A heat map showing that ensemble firing activity increased in response to odorant application after training (n = 52 recording sites). (C) Data from three representative recording sites illustrate that cortical neurons often exhibited different response patterns. Some single neurons within a recording site showed strong excitation, whereas others responded more mildly or did not respond at all. Some cells showed tonic activation (left), but others responded with phasic excitation at the onset of odorant application (middle). In additions, some cells responded with more complex patterns of multiple excitation peaks (right). (D) After training, odor-evoked responses of an ensemble were drastically reduced when the contingency between odor pulses and laser stimulation was degraded. Performance returned to pre-degradation level after the coupling between laser and odor-evoked responses was reinstated. Data from single trials were plotted. (E) Time-series plot of the response strength, showing the effect of contingency degradation and stimulation reinstatement. Red dots indicate significant responses (p<0.01; permutation test). AUC, the area under a ROC curve. (F) Population data showing the effects of contingency degradation and reinstatement across time (n = 12 ensembles from 5 mice). (G) Group data of contingency degradation tests (***, p < 0.001; paired t-test). (H) The learning guided by DRN stimulation is odor-specific. After successful training with citral only, citral and ethanol were given in a pseudo-random order. Ethanol were not coupled to light and produced significantly lower level of correct responses (**, p < 0.01; paired t-test; n = 10 ensembles from 4 mice).
Figure S6. Stimulating axonal terminals of DRN Pet-1 neurons in the VTA and the NAc produces reward. Related to Figure 6. (A and B) ChR2-mCherry labeling shows that DRN Pet-1 neurons project their axons heavily to the VTA/SNc (A) and the NAc shell (B) in an ePet1-DRNChR2 mouse. (C) Stimulating axonal terminals of DRN Pet-1 neurons in the midbrain VTA increased animal exploration in the center of open fields for all ePet1-DRNChR2 test mice. The upper three rows show the heat maps of three out of the five test animals. The lower two rows are the heat maps of two out of another five mice that were given lidocaine in the DRN immediately before terminal stimulation in the VTA. (D and E) Plots of the number of center entries (D) and the instantaneous center duration (E) of ePet1-DRNChR2 mice across different iClass sessions, with or without prior lidocaine injection into the DRN. pre, pre-training session; T1 and T2, iClass training sessions 1 and 2; post, extinction session. (F) Group data show that stimulating axon terminals in the VTA but not the NAc reinforced center exploration of ePet1-DRNChR2 mice. VTA stimulation in ePet1-DRNmCherry mice was used as a control. (G-I) Stimulating axonal terminals of DRN Pet-1 neurons in the midbrain VTA or in the NAc causes conditioned place preference. (G) Locomotion tracks show that stimulation of axonal terminals in the VTA or the NAc of ePet1-DRNChR2 mice enhanced exploration in the chamber coupled with light stimulation but reduced exploration in chambers without light stimulation. Similar stimulation of the control ePet1-DRNmCherry mice had no effects. (H and I) Changes in preference for the chamber conditioned (CS+) with VTA (H) or NAc (I) stimulation as well as that for the opposite chamber and the middle chamber. (J) A cell in the VTA of an ePet1-DRNChR2 mouse was filled with 0.5% Neurobiotin in the recording pipette and labeled with Cy3-streptavidin. (K) The voltage traces of the cell shown in (J) in response to different current injections (-40 to 40 pA; 10 pA per step). (L and M) The morphology (green in L) and intrinsic properties of a cell in the NAc of Vglut3-/-;ePet1-DRNChR2 mouse. Red in (L) indicates ChR2-mCherry+ fibers, and blue indicates DAPI counterstaining of cell nuclei. (N) VGluT3 immunoreactivity was present in the DRN of a Vglut3+/+ mouse, but not in that of Vglut3-/- mouse. Both mice were treated with colchicine.
Figure S7. The effects of depleting 5-HT and knocking out Vglut3 on the performance of iClass tests. Related to Figure 7. (A) Coronal sections of wild-type (upper panels) and Tph2-/- mice (lower panels) show that TPH2 knockout mice completely lack Tph2 expression. (B) HPLC-EC analysis of brain monoamine levels. (C) The levels of 5-HT in the whole brain of Tph2 KO mice and L-pCPA-treated mice were significantly reduced to 7% and 16% of control levels of saline-treated wild-type mice (left panel). The levels of 5-Hydroxyindoleacetic acid (5-HIAA), a key metabolite of 5-HT, were similarly reduced. ***, p<0.001; between-group t-tests. n =9 saline-treated mice, 10 Tph2-/- mice, and 10 L-pCPA-treated wild-type mice. (D) L-pCPA treatment slightly reduced brain dopamine and norepinephrine levels. ***, p<0.001; between-group t-tests; n = 10 mice for either group. (E and F) Locomotion tracks (E) and heat maps (F) show that knocking out the Tph2 or Vglut3 gene produced only mild phenotypes in iClass training. However, the reinforcement effect is completely eliminated following the disruption of 5-HT and glutamate release by injecting L-pCPA into Vglut3-/- mice. Tph2-/- and Vglut3-/- genotypes were based on ePet1-Cre background.
Figure S8. Tph2-/- and Vglut3-/- mutant mice exhibited a reduced performance in light self-stimulation tests and olfactory discrimination tests. Related to Figure 8. (A) The rates of poking rates across testing sessions with different schedules of fixed ratio (FR1, FR2, FR5, and FR8). Vglut3 but not Tph2 knockout mice had drastic reduction in the acquisition of self-stimulation with FR1 schedule. Tph2 knockout mice exhibited a much poorer performance with the schedules of FR5 and FR8. WT, Tph2-/- and Vglut3-/- genotypes were based on the ePet1-Cre background. (B and C) Hit and false positive response ratio throughout the Go/No-go training sessions for Tph2-/-; ePet1-DRNChR2 mice (B) and Vglut3-/-;ePet1-DRNChR2 mice (C).
Supplementary Movie: Supplementary Movie S1: A video shows the exploratory behavior of an ePet1-DRNChR2 mouse during the first 15-min long iClass training session (T1). Blue light pulses (15 ms, 20 Hz) were delivered through an optic fiber only when the mouse entered the marked center subarea. The mouse received its first stimulation at the time marked ‘0:00:30′ and its second stimulation at ‘0:02:29′. The mouse was then quickly reinforced to explore the center area after a few more center entries. The video was compressed to play in a 5× fast forward mode and time tags are shown in the bottom left corner. Related to Figure 1.
Supplementary Movie S2: The exploratory behavior during the second iClass training session (T2). The ePet1-DRNChR2 mouse vigorously explored the center section throughout the 15-min training session. Related to Figure 1.
Supplementary Movie S3: Light stimulation of DRN Pet-1 neurons supported strong self-stimulation in an operant chamber. Nose poking of the active hole by the ePet1-DRNChR2 mouse resulted in phasic stimulation (2s, 5 Hz) followed by a 5-s timeout period. The active hole was illuminated during the stimulation (2s) and timeout period (5s). Related to Figure 2.
Acknowledgments
We thank Evan S. Deneris (Case Western Reserve University) for ePet1-Cre mice, K. Deisseroth (Stanford University) for AAV-DIO-ChR2-mCherry construct, D. Duan (University of Missouri) for advice on AAV virus preparation, J. Li (Beijing Institute of Pharmacology and Toxicology) for the analysis of brain monoamine levels. M.L. is supported by grants from the China Ministry of Science and Technology 973 Program (2010CB833902 & 2012CB837700). Z.F.C is supported by a NIAMS grant (AR056318).
Footnotes
Publisher's Disclaimer: This is a PDF file of an unedited manuscript that has been accepted for publication. As a service to our customers we are providing this early version of the manuscript. The manuscript will undergo copyediting, typesetting, and review of the resulting proof before it is published in its final citable form. Please note that during the production process errors may be discovered which could affect the content, and all legal disclaimers that apply to the journal pertain.
References
- Abler B, Gron G, Hartmann A, Metzger C, Walter M. Modulation of frontostriatal interaction aligns with reduced primary reward processing under serotonergic drugs. J Neurosci. 2012;32:1329–1335. doi: 10.1523/JNEUROSCI.5826-11.2012. [DOI] [PMC free article] [PubMed] [Google Scholar]
- Adamantidis AR, Tsai HC, Boutrel B, Zhang F, Stuber GD, Budygin EA, Touriño C, Bonci A, Deisseroth K, de Lecea L. Optogenetic interrogation of dopaminergic modulation of the multiple phases of reward-seeking behavior. J Neurosci. 2011;31:10829–10835. doi: 10.1523/JNEUROSCI.2246-11.2011. [DOI] [PMC free article] [PubMed] [Google Scholar]
- Amat J, Baratta MV, Paul E, Bland ST, Watkins LR, Maier SF. Medial prefrontal cortex determines how stressor controllability affects behavior and dorsal raphe nucleus. Nat Neurosci. 2005;8:365–371. doi: 10.1038/nn1399. [DOI] [PubMed] [Google Scholar]
- Amit Z, Smith BR, Gill K. Serotonin uptake inhibitors: effects on motivated consummatory behaviors. J Clin Psychiatry. 1991;52:55. [PubMed] [Google Scholar]
- Berridge KC, Kringelbach ML. Affective neuroscience of pleasure: reward in humans and animals. Psychopharmacology (Berl) 2008;199:457–480. doi: 10.1007/s00213-008-1099-6. [DOI] [PMC free article] [PubMed] [Google Scholar]
- Berridge KC, Robinson TE, Aldridge JW. Dissecting components of reward: ‘liking’, ‘wanting’, and learning. Curr Opin Pharmacol. 2009;9:65–73. doi: 10.1016/j.coph.2008.12.014. [DOI] [PMC free article] [PubMed] [Google Scholar]
- Bromberg-Martin ES, Hikosaka O, Nakamura K. Coding of task reward value in the dorsal raphe nucleus. J Neurosci. 2010;30:6262–6272. doi: 10.1523/JNEUROSCI.0015-10.2010. [DOI] [PMC free article] [PubMed] [Google Scholar]
- Cannon CM, Palmiter RD. Reward without dopamine. J Neurosci. 2003;23:10827–10831. doi: 10.1523/JNEUROSCI.23-34-10827.2003. [DOI] [PMC free article] [PubMed] [Google Scholar]
- Clarke HF, Dalley JW, Crofts HS, Robbins TW, Roberts AC. Cognitive inflexibility after prefrontal serotonin depletion. Science. 2004;304:878–880. doi: 10.1126/science.1094987. [DOI] [PubMed] [Google Scholar]
- Cohen JY, Haesler S, Vong L, Lowell BB, Uchida N. Neuron-type-specific signals for reward and punishment in the ventral tegmental area. Nature. 2012;482:85–88. doi: 10.1038/nature10754. [DOI] [PMC free article] [PubMed] [Google Scholar]
- Conn PJ, Pin JP. Pharmacology and functions of metabotropic glutamate receptors. Annu Rev Pharmacol Toxicol. 1997;37:205–237. doi: 10.1146/annurev.pharmtox.37.1.205. [DOI] [PubMed] [Google Scholar]
- Cools R, Roberts AC, Robbins TW. Serotoninergic regulation of emotional and behavioural control processes. Trends Cogn Sci. 2008;12:31–40. doi: 10.1016/j.tics.2007.10.011. [DOI] [PubMed] [Google Scholar]
- Crockett MJ, Clark L, Robbins TW. Reconciling the role of serotonin in behavioral inhibition and aversion: acute tryptophan depletion abolishes punishment-induced inhibition in humans. J Neurosci. 2009;29:11993–11999. doi: 10.1523/JNEUROSCI.2513-09.2009. [DOI] [PMC free article] [PubMed] [Google Scholar]
- Daw ND, Kakade S, Dayan P. Opponent interactions between serotonin and dopamine. Neural Netw. 2002;15:603–616. doi: 10.1016/s0893-6080(02)00052-7. [DOI] [PubMed] [Google Scholar]
- Dayan P, Huys QJ. Serotonin in affective control. Annu Rev Neurosci. 2009;32:95–126. doi: 10.1146/annurev.neuro.051508.135607. [DOI] [PubMed] [Google Scholar]
- Deakin JF. On the neurochemical basis of self-stimulation with midbrain raphe electrode placements. Pharmacol Biochem Behav. 1980;13:525–530. doi: 10.1016/0091-3057(80)90275-0. [DOI] [PubMed] [Google Scholar]
- Der-Avakian A, Markou A. The neurobiology of anhedonia and other reward-related deficits. Trends Neurosci. 2012;35:68–77. doi: 10.1016/j.tins.2011.11.005. [DOI] [PMC free article] [PubMed] [Google Scholar]
- Di Matteo V, De Blasi A, Di Giulio C, Esposito E. Role of 5-HT2C receptors in the control of central dopamine function. Trends Pharmacol Sci. 2001;22:229–232. doi: 10.1016/s0165-6147(00)01688-6. [DOI] [PubMed] [Google Scholar]
- Dingledine R, Borges K, Bowie D, Traynelis SF. The glutamate receptor ion channels. Pharmacol Rev. 1999;51:7–62. [PubMed] [Google Scholar]
- Domingos AI, Vaynshteyn J, Voss HU, Ren X, Gradinaru V, Zang F, Deisseroth K, de Araujo IE, Friedman J. Leptin regulates the reward value of nutrient. Nat Neurosci. 2011;14:1562–1568. doi: 10.1038/nn.2977. [DOI] [PMC free article] [PubMed] [Google Scholar]
- Fletcher PJ, Korth KM, Chambers JW. Selective destruction of brain serotonin neurons by 5, 7-dihydroxytryptamine increases responding for a conditioned reward. Psychopharmacology. 1999;147:291–299. doi: 10.1007/s002130051170. [DOI] [PubMed] [Google Scholar]
- Fremeau RT, Jr, Voglmaier S, Seal RP, Edwards RH. VGLUTs define subsets of excitatory neurons and suggest novel roles for glutamate. Trends Neurosci. 2004;27:98–103. doi: 10.1016/j.tins.2003.11.005. [DOI] [PubMed] [Google Scholar]
- Gervais J, Rouillard C. Dorsal raphe stimulation differentially modulates dopaminergic neurons in the ventral tegmental area and substantia nigra. Synapse. 2000;35:281–291. doi: 10.1002/(SICI)1098-2396(20000315)35:4<281::AID-SYN6>3.0.CO;2-A. [DOI] [PubMed] [Google Scholar]
- Hendricks TJ, Fyodorov DV, Wegman LJ, Lelutiu NB, Pehek EA, Yamamoto B, Silver J, Weeber EJ, Sweatt JD, Deneris ES. Pet-1 ETS gene plays a critical role in 5-HT neuron development and is required for normal anxiety-like and aggressive behavior. Neuron. 2003;37:233–247. doi: 10.1016/s0896-6273(02)01167-4. [DOI] [PubMed] [Google Scholar]
- Herzog E, Gilchrist J, Gras C, Muzerelle A, Ravassard P, Giros B, Gaspar P, El Mestikawy S. Localization of VGLUT3, the vesicular glutamate transporter type 3, in the rat brain. Neuroscience. 2004;123:983–1002. doi: 10.1016/j.neuroscience.2003.10.039. [DOI] [PubMed] [Google Scholar]
- Hioki H, Nakamura H, Ma Y, Konno M, Hayakawa T, Nakamura KC, Fujiyama F, Kaneko T. Vesicular glutamate transporter 3-expressing nonserotonergic projection neurons constitute a subregion in the rat midbrain raphe nuclei. J Comp Neurol. 2010;518:668–686. doi: 10.1002/cne.22237. [DOI] [PubMed] [Google Scholar]
- Hoyer D, Hannon JP, Martin GR. Molecular, pharmacological and functional diversity of 5-HT receptors. Pharmacol Biochem Behav. 2002;71:533–554. doi: 10.1016/s0091-3057(01)00746-8. [DOI] [PubMed] [Google Scholar]
- Inaba K, Mizuhiki T, Setogawa T, Toda K, Richmond BJ, Shidara M. Neurons in monkey dorsal raphe nucleus code beginning and progress of step-by-step schedule, reward expectation, and amount of reward outcome in the reward schedule task. J Neurosci. 2013;33:3477–3491. doi: 10.1523/JNEUROSCI.4388-12.2013. [DOI] [PMC free article] [PubMed] [Google Scholar]
- Jacobs BL, Azmitia EC. Structure and function of the brain serotonin system. Physiol Rev. 1992;72:165–229. doi: 10.1152/physrev.1992.72.1.165. [DOI] [PubMed] [Google Scholar]
- Jog MS, Kubota Y, Connolly CI, Hillegaart V, Graybiel AM. Building neural representations of habits. Science. 1999;286:1745–1749. doi: 10.1126/science.286.5445.1745. [DOI] [PubMed] [Google Scholar]
- Kalen P, Skagerberg G, Lindvall O. Projections from the ventral tegmental area and mesencephalic raphe to the dorsal raphe nucleus in the rat. Exp Brain Res. 1988;73:69–77. doi: 10.1007/BF00279662. [DOI] [PubMed] [Google Scholar]
- Kim KM, Baratta MV, Yang A, Lee D, Boyden ES, Fiorillo CD. Optogenetic mimicry of the transient activation of dopamine neurons by natural reward is sufficient for operant reinforcement. PLoS One. 2012;7:e33612. doi: 10.1371/journal.pone.0033612. [DOI] [PMC free article] [PubMed] [Google Scholar]
- Kocsis B, Varga V, Dahan L, Sik A. Serotonergic neuron diversity: identification of raphe neurons with discharges time-locked to the hippocampal theta rhythm. Proc Natl Acad Sci USA. 2006;103:1059–1064. doi: 10.1073/pnas.0508360103. [DOI] [PMC free article] [PubMed] [Google Scholar]
- Koralek AC, Jin X, Long JD, 2nd, Costa RM, Carmena JM. Corticostriatal plasticity is necessary for learning intentional neuroprosthetic skills. Nature. 2012;483:331–335. doi: 10.1038/nature10845. [DOI] [PMC free article] [PubMed] [Google Scholar]
- Kranz GS, Kasper S, Lanzenberger R. Reward and the serotonergic system. Neuroscience. 2010;166:1023–1035. doi: 10.1016/j.neuroscience.2010.01.036. [DOI] [PubMed] [Google Scholar]
- Krishnan V, Nestler EJ. The molecular neurobiology of depression. Nature. 2008;455:894–902. doi: 10.1038/nature07455. [DOI] [PMC free article] [PubMed] [Google Scholar]
- Lechin F, van der Dijs B, Hernandez-Adrian G. Dorsal raphe vs. median raphe serotonergic antagonism. Anatomical, physiological, behavioral, neuroendocrinological, neuropharmacological and clinical evidences: relevance for neuropharmacological therapy. Prog Neuropsychopharmacol Biol Psychiatry. 2006;30:565–585. doi: 10.1016/j.pnpbp.2005.11.025. [DOI] [PubMed] [Google Scholar]
- Li Y, Dalphin N, Hyland BI. Association with reward negatively modulates short latency phasic conditioned responses of dorsal raphe nucleus neurons in freely moving rats. J Neurosci. 2013;33:5065–5078. doi: 10.1523/JNEUROSCI.5679-12.2013. [DOI] [PMC free article] [PubMed] [Google Scholar]
- Liu Y, Jiang Y, Si Y, Kim JY, Chen ZF, Rao Y. Molecular regulation of sexual preference revealed by genetic studies of 5-HT in the brains of male mice. Nature. 2011;472:95–99. doi: 10.1038/nature09822. [DOI] [PMC free article] [PubMed] [Google Scholar]
- Mann JJ. Role of the serotonergic system in the pathogenesis of major depression and suicidal behavior. Neuropsychopharmacol. 1999;21:99S–105S. doi: 10.1016/S0893-133X(99)00040-8. [DOI] [PubMed] [Google Scholar]
- Miyazaki K, Miyazaki KW, Doya K. Activation of dorsal raphe serotonin neurons underlies waiting for delayed rewards. J Neurosci. 2011;31:469–479. doi: 10.1523/JNEUROSCI.3714-10.2011. [DOI] [PMC free article] [PubMed] [Google Scholar]
- Miyazaki KW, Miyazaki K, Doya K. Activation of dorsal raphe serotonin neurons is necessary for waiting for delayed rewards. J Neurosci. 2012;32:10451–10457. doi: 10.1523/JNEUROSCI.0915-12.2012. [DOI] [PMC free article] [PubMed] [Google Scholar]
- Nakamura K, Matsumoto M, Hikosaka O. Reward-dependent modulation of neuronal activity in the primate dorsal raphe nucleus. J Neurosci. 2008a;28:5331–5343. doi: 10.1523/JNEUROSCI.0021-08.2008. [DOI] [PMC free article] [PubMed] [Google Scholar]
- Nakamura K, Matsumoto M, Hikosaka O. Reward-dependent modulation of neuronal activity in the primate dorsal raphe nucleus. J Neurosci. 2008b;28:5331–5343. doi: 10.1523/JNEUROSCI.0021-08.2008. [DOI] [PMC free article] [PubMed] [Google Scholar]
- Olds J, Milner P. Positive reinforcement produced by electrical stimulation of septal area and other regions of rat brain. J Comp Physiol Psychol. 1954;47:419–427. doi: 10.1037/h0058775. [DOI] [PubMed] [Google Scholar]
- Ranade SP, Mainen ZF. Transient firing of dorsal raphe neurons encodes diverse and specific sensory, motor, and reward events. J Neurophysiol. 2009;102:3026–3037. doi: 10.1152/jn.00507.2009. [DOI] [PubMed] [Google Scholar]
- Ren J, Qin C, Hu F, Tan J, Qiu L, Zhao S, Feng G, Luo M. Habenula “cholinergic” neurons co-release glutamate and acetylcholine and activate postsynaptic neurons via distinct transmission modes. Neuron. 2011;69:445–452. doi: 10.1016/j.neuron.2010.12.038. [DOI] [PubMed] [Google Scholar]
- Rossi MA, Sukharnikova T, Hayrapetyan VY, Yang L, Yin HH. Operant Self-Stimulation of Dopamine Neurons in the Substantia Nigra. PLoS One. 2013;8:e65799. doi: 10.1371/journal.pone.0065799. [DOI] [PMC free article] [PubMed] [Google Scholar]
- Schultz W. Dopamine neurons and their role in reward mechanisms. Curr Opin Neurobiol. 1997;7:191–197. doi: 10.1016/s0959-4388(97)80007-4. [DOI] [PubMed] [Google Scholar]
- Schultz W, Dayan P, Montague PR. A neural substrate of prediction and reward. Science. 1997;275:1593–1599. doi: 10.1126/science.275.5306.1593. [DOI] [PubMed] [Google Scholar]
- Schweimer JV, Ungless MA. Phasic responses in dorsal raphe serotonin neurons to noxious stimuli. Neuroscience. 2010;171:1209–1215. doi: 10.1016/j.neuroscience.2010.09.058. [DOI] [PubMed] [Google Scholar]
- Scott MM, Wylie CJ, Lerch JK, Murphy R, Lobur K, Herlitze S, Jiang W, Conlon RA, Strowbridge BW, Deneris ES. A genetic approach to access serotonin neurons for in vivo and in vitro studies. Proc Natl Acad Sci USA. 2005;102:16472–16477. doi: 10.1073/pnas.0504510102. [DOI] [PMC free article] [PubMed] [Google Scholar]
- Seal RP, Akil O, Yi E, Weber CM, Grant L, Yoo J, Clause A, Kandler K, Noebels JL, Glowatzki E, et al. Sensorineural deafness and seizures in mice lacking vesicular glutamate transporter 3. Neuron. 2008;57:263–275. doi: 10.1016/j.neuron.2007.11.032. [DOI] [PMC free article] [PubMed] [Google Scholar]
- Seymour B, Daw ND, Roiser JP, Dayan P, Dolan R. Serotonin selectively modulates reward value in human decision-making. J Neurosci. 2012;32:5833–5842. doi: 10.1523/JNEUROSCI.0053-12.2012. [DOI] [PMC free article] [PubMed] [Google Scholar]
- Simon H, Le Moal M, Cardo B. Intracranial self-stimulation from the dorsal raphe nucleus of the rat: effects of the injection of para-chlorophenylalanine and of alpha-methylparatyrosine. Behav Biol. 1976;16:353–364. doi: 10.1016/s0091-6773(76)91486-3. [DOI] [PubMed] [Google Scholar]
- Sora I, Hall FS, Andrews AM, Itokawa M, Li XF, Wei HB, Wichems C, Lesch KP, Murphy DL, Uhl GR. Molecular mechanisms of cocaine reward: combined dopamine and serotonin transporter knockouts eliminate cocaine place preference. Proc Natl Acad Sci USA. 2001;98:5300–5305. doi: 10.1073/pnas.091039298. [DOI] [PMC free article] [PubMed] [Google Scholar]
- Stuber GD, Sparta DR, Stamatakis AM, van Leeuwen WA, Hardjoprajitno JE, Cho S, Tye KM, Kempadoo KA, Zhang F, Deisseroth K, Bonci A. Excitatory transmission from the amygdala to nucleus accumbens facilitates reward seeking. Nature. 2011;475:377–380. doi: 10.1038/nature10194. [DOI] [PMC free article] [PubMed] [Google Scholar]
- Taylor DM, Tillery SI, Schwartz AB. Direct cortical control of 3D neuroprosthetic devices. Science. 2002;296:1829–1832. doi: 10.1126/science.1070291. [DOI] [PubMed] [Google Scholar]
- Tye NC, Everitt BJ, Iversen SD. 5-Hydroxytryptamine and punishment. Nature. 1977;268:741–743. doi: 10.1038/268741a0. [DOI] [PubMed] [Google Scholar]
- Vertes RP. A PHA-L analysis of ascending projections of the dorsal raphe nucleus in the rat. J Comp Neurol. 1991;313:643–668. doi: 10.1002/cne.903130409. [DOI] [PubMed] [Google Scholar]
- Warden MR, Selimbeyoglu A, Mirzabekov JJ, Lo M, Thompson KR, Kim SY, Adhikari A, Tye KM, Frank LM, Deisseroth K. A prefrontal cortex-brainstem neuronal projection that controls response to behavioural challenge. Nature. 2012;492:428–432. doi: 10.1038/nature11617. [DOI] [PMC free article] [PubMed] [Google Scholar]
- Watabe-Uchida M, Zhu L, Ogawa SK, Vamanrao A, Uchida N. Whole-brain mapping of direct inputs to midbrain dopamine neurons. Neuron. 2012;74:858–873. doi: 10.1016/j.neuron.2012.03.017. [DOI] [PubMed] [Google Scholar]
- Wise RA, Rompre PP. Brain dopamine and reward. Annu Rev Psychol. 1989;40:191–225. doi: 10.1146/annurev.ps.40.020189.001203. [DOI] [PubMed] [Google Scholar]
- Witten IB, Steinberg EE, Lee SY, Davidson TJ, Zalocusky KA, Brodsky M, Yizhar O, Cho SL, Gong S, Ramakrishnan C. Recombinase-driver rat lines: tools, techniques, and optogenetic application to dopamine-mediated reinforcement. Neuron. 2011;72:721–733. doi: 10.1016/j.neuron.2011.10.028. [DOI] [PMC free article] [PubMed] [Google Scholar]
- Zhang F, Gradinaru V, Adamantidis AR, Durand R, Airan RD, de Lecea L, Deisseroth K. Optogenetic interrogation of neural circuits: technology for probing mammalian brain structures. Nat Protoc. 2010;5:439–456. doi: 10.1038/nprot.2009.226. [DOI] [PMC free article] [PubMed] [Google Scholar]
- Zhang X, Beaulieu JM, Sotnikova TD, Gainetdinov RR, Caron MG. Tryptophan hydroxylase-2 controls brain serotonin synthesis. Science. 2004;305:217. doi: 10.1126/science.1097540. [DOI] [PubMed] [Google Scholar]
Associated Data
This section collects any data citations, data availability statements, or supplementary materials included in this article.
Supplementary Materials
Figure S1. ePet1-Cre drives gene expression in 5-HT neurons and enables precise optogenetic activation. Related to Figure 1. (A) Diagrams illustrating the angles and tip location of virus-injecting cannulae and optical fibers. (B) A picture showing ChR2-mCherry expression in the DRN. The overlaying placement of an optical fiber was based on the lesion track. Aq, aqueduct. (C and D) In ePet1-Cre mice, infusion of AAV-DIO-mCherry virus resulted in expression of mCherry (red) in Tph2-immunopositive neurons (green) in the DRN. Panels in (D) show zoom-in views of the dashed area in (C). (E) Three coronal sections showing that Pet-1+ neurons were efficiently labeled in the anterior (left), middle, and posterior (right) parts of the DRN. The level of mCherry expression tended to be lower in the two lateral wings. Red, mCherry; green, Tph2 immunoreactivity. (F and G) Pet-1 neurons are not dopaminergic. Pet-1 neurons were labeled by crossing the ePet1-Cre mouse line with the Ai14 reporter line. None of the tdTomato+ Pet-1 neurons were immunopositive to tyrosine hydroxylase (TH), a marker of dopamine neurons. (H and I) Traces from current-clamp recordings (H) and voltage-clamp recordings (I) show the intrinsic properties of a ChR2-mCherry+ neuron in the DRN. Current injections ranged from -40 to 40 pA with a 10 pA interval (H) and voltage commands were applied at 5 mV per step (I). (J) Single brief light pulses (5 ms) elicited a large depolarizing potential and the firing of an action potential in the current-clamp mode (upper) and a strong inward current in the voltage-clamp mode (lower). (K) Sustained light pulses (1 s) resulted in depolarization and action potential firing in the current-clamp mode (upper) and a strong inward current in the voltage-clamp mode (lower). (L) Trains of brief light pulses (blue dots) produced temporally precise firing of action potentials at the frequency of 10 and 50 Hz. Inset shows the zoom-in view of the spiking activity in response to 50 Hz stimulation. (M) The mean ratio of successful spike generation in relationship to light stimulation at different frequencies (n = 8 cells). Error bars indicate SEM in this and following figures.
Figure S2. Coupling light stimulation with animal navigation in a specific subarea reinforces exploration within the stimulation-coupled area. Related to Figure 1. (A) The method of iClass training by coupling light stimulation to animal exploration in a corner (dashed blue box). (B) When DRN stimulation was coupled to the entry of the ePet1-DRNChR2 mouse to the lower right corner (the dashed blue box), the animal explored the stimulated corner much more intensively. (C) The method of iClass training by coupling light stimulation to animal exploration in the center of an open field. (D) Heat maps showing the spatial distribution of exploration time before (pre), during (T1-3) and after (post) iClass trainings on ePet1-DRNChR2 mice (n = 7). The color scale at the right indicates the fold differences between actual time and the time normalized by the total area of the open field, with red indicating higher level of exploration than average (preference) and blue indicating lower levels (avoidance). (E) The iClass training did not have any effect on control animals, which were nontransgenic animals with AAV-DIO-ChR2-mCherry vector injection into the DRN (n = 7 WT-DRNChR2 mice). (F) Heat maps showing that the iClass training with 5 Hz stimulation increased the duration of central exploration (n = 6 ePet1-DRNChR2 mice). Dashed lines indicate mean - SEM. (G) The relationship between the instantaneous ratio of center duration (vertical axis) and the cumulative DRN-stimulation duration (horizontal axis) in the T1 session of ePet1-DRNChR2 mice (n = 7). The dashed horizontal line represents the value of mean + 3SEM calculated from the baseline of pre-training sessions and corresponds to a p value of 0.001. (H) Plot of the instantaneous time ratio in relationship to the cumulative center entries. (I) The instantaneous travel distance for ePet1-DRNChR2 mice (blue, n = 7), WT-DRNChR2 mice (black, n = 7), and ePet1-DRNmCherry mice (green, n = 5). (J) Bar plot shows significantly longer travel distance of ePet1-DRNChR2 mice during the iClass training sessions (*, p<0.05; **, p < 0.01; ***, p<0.001; Tukey's multiple comparisons test between animal groups after two-way ANOVA).
Figure S3. Detailed analyses of olfactory discrimination learning guided by DRN light stimulation or sucrose rewards. Related to Figure 3. (A) The learning curve of an ePet1-DRNChR2 mouse trained with DRN light stimulation. (B) Mean learning curves of the initial 500 trials for mice trained with sucrose solution and the initial 100 trials for mice trained with light stimulation. Dashed lines indicate mean - SEM. Each point represents 10 trials averaged across individual mice trained with sucrose solution and 2 trials for mice with light stimulation. (C) The ratio of hit responses to CS+ odor and that of false positive responses to CS- odor. Each trial block contains CS+ and CS- stimuli that were presented in a pseudorandom order. A total of 500 trials consisted of 250 CS+ trials and 250 CS- trials. (D and E) Learning curve of an ePet1-DRNChR2 mouse (D) and the plot of mean response ratio for all test mice (E) after the original conditioning odors (odor A as CS+ and B as CS-; A+/B-) were switched to a novel pair of conditioning odors (odor C as CS+ and D as CS-; C+/D-). These mice were trained with DRN light stimulation (n = 6 mice). (F and G) The mean learning curve and the ratios of hit and false positive responses of ePet1-DRNChR2 mice challenged with valence reversal of conditioning odor stimuli (from C+/D- to D+/C-). During the initial 20 trials of the reversal (10 CS+ or CS-trials in panel G), mice continued to respond to the now CS- and failed to respond to the now CS+, resulting in 50% correct ratio. Then mice abandoned licking following either CS+ or CS-. After reshaping, mice licked in response to both CS+ and CS- and then rapidly reduced their false positive responses to CS-. (H-K) The performance of wild-type mice with the reward of sucrose solution for the tests of odor switch (H and I) and reversal (J and K). n =9 mice.
Figure S4. Tetrode recordings from the DRN of mice engaged in an olfactory discrimination task. Related to Figure 4. (A) A picture showing the method of tetrode recording from head-fixed behaving mice. A mouse was placed on a spherical treadmill and accessed sucrose solution following one specific odor (CS+, 1s). (B) After training with the Go/No-go paradigm, mice responded with licking for sucrose consumption only after the reward-positive odorant (CS+, top panel) but not the reward-negative odorant (CS-, middle panel). The bottom panel shows the mean instantaneous lick rates during CS+ trials (red) and CS- trials (blue), respectively. The dashed lines indicate the time lines for trial onset, odor delivery, delay, and response time window for licking. (C) The methods of spike sorting. Spiking signals were recorded and single units were sorted using the Spike2 software for tetrode recordings. This program utilizes principle component analysis (PCA, upper panel) and takes advantage of the fact that spikes from the same single cell often appear simultaneously on the four recording points of the same tetrode with slightly different spike waveforms. In this example, two different single units (green and red) were sorted out from one tetrode. Numbers 1-4 indicate 4 recording sites of a tetrode. (C) After recordings, electrolytic lesion was made to confirm that the recording site was located within the DRN. Blue indicates DAPI counterstaining of cell nuclei. Aq: aqueduct. (E) The basal firing rates and peak firing rates of optogenetically confirmed DRN Pet-1 neurons (n=60) as well as DRN cells that were not confirmed with the method of optical tagging (n=159). (F) Distribution of basal firing rates and peak firing rates to CS+ of all recorded DRN neurons. Blue dots indicate positively identified Pet-1 neurons. Black dots indicate randomly recorded DRN cells. (G) ROC curves of a Pet-1 cell for CS+, CS- and net reward effects during different phases of the olfactory discrimination task. (H) Plots of PSTH of a randomly recorded DRN neuron (smoothed lines) and licking events (histogram) of the mouse for CS+ (upper) and CS- (lower) trials. PSTH bin = 100 ms. (I) Heat maps showing the response patterns of 159 DRN cells that were not identified with optetrodes. Although many of these cells were also selectively activated during reward-associated tasks, a more diverse response pattern was observed. Many cells were briefly activated during the onset of both CS+ and CS- trials. Some cells were inhibited by CS+ odors. Color scale at right indicates response intensity for the CS+ and CS- maps (left and middle panels) and CS+/CS- selectivity for the reward effect map (right panel), with a value of 0.5 indicates no response or no selectivity. (J) The distribution of neuronal response selectivity to CS+ and CS- trials during different task phase (trial onset, odor, delay, response, after response). Upper panels show the scatter plots of neuronal response strength as ROC values to CS+ and CS- trials. Each dot indicates one neuron. Lower panels plot the distribution of neuronal response selectivity to CS+ or CS- during each epoch. Response selectivity was calculated as ROC values. Neurons with significant selectivity for CS+ trials are shown in red and those with significant selectivity for CS- trials in blue (permutation test,p < 0.01;.
Figure S5. Optogenetic stimulation of DRN Pet-1 neurons guides rapid neuroprosthesis learning at the level of single neurons. Related to Figure 5. (A) A picture showing the setup for recording and optogenetic stimulation of a head-fixed behaving mouse on a spherical treadmill. Optical fiber was implanted over the DRN and electrodes consisting of 4 tetrodes were targeted at the vM1 cortical area. (B) A heat map showing that ensemble firing activity increased in response to odorant application after training (n = 52 recording sites). (C) Data from three representative recording sites illustrate that cortical neurons often exhibited different response patterns. Some single neurons within a recording site showed strong excitation, whereas others responded more mildly or did not respond at all. Some cells showed tonic activation (left), but others responded with phasic excitation at the onset of odorant application (middle). In additions, some cells responded with more complex patterns of multiple excitation peaks (right). (D) After training, odor-evoked responses of an ensemble were drastically reduced when the contingency between odor pulses and laser stimulation was degraded. Performance returned to pre-degradation level after the coupling between laser and odor-evoked responses was reinstated. Data from single trials were plotted. (E) Time-series plot of the response strength, showing the effect of contingency degradation and stimulation reinstatement. Red dots indicate significant responses (p<0.01; permutation test). AUC, the area under a ROC curve. (F) Population data showing the effects of contingency degradation and reinstatement across time (n = 12 ensembles from 5 mice). (G) Group data of contingency degradation tests (***, p < 0.001; paired t-test). (H) The learning guided by DRN stimulation is odor-specific. After successful training with citral only, citral and ethanol were given in a pseudo-random order. Ethanol were not coupled to light and produced significantly lower level of correct responses (**, p < 0.01; paired t-test; n = 10 ensembles from 4 mice).
Figure S6. Stimulating axonal terminals of DRN Pet-1 neurons in the VTA and the NAc produces reward. Related to Figure 6. (A and B) ChR2-mCherry labeling shows that DRN Pet-1 neurons project their axons heavily to the VTA/SNc (A) and the NAc shell (B) in an ePet1-DRNChR2 mouse. (C) Stimulating axonal terminals of DRN Pet-1 neurons in the midbrain VTA increased animal exploration in the center of open fields for all ePet1-DRNChR2 test mice. The upper three rows show the heat maps of three out of the five test animals. The lower two rows are the heat maps of two out of another five mice that were given lidocaine in the DRN immediately before terminal stimulation in the VTA. (D and E) Plots of the number of center entries (D) and the instantaneous center duration (E) of ePet1-DRNChR2 mice across different iClass sessions, with or without prior lidocaine injection into the DRN. pre, pre-training session; T1 and T2, iClass training sessions 1 and 2; post, extinction session. (F) Group data show that stimulating axon terminals in the VTA but not the NAc reinforced center exploration of ePet1-DRNChR2 mice. VTA stimulation in ePet1-DRNmCherry mice was used as a control. (G-I) Stimulating axonal terminals of DRN Pet-1 neurons in the midbrain VTA or in the NAc causes conditioned place preference. (G) Locomotion tracks show that stimulation of axonal terminals in the VTA or the NAc of ePet1-DRNChR2 mice enhanced exploration in the chamber coupled with light stimulation but reduced exploration in chambers without light stimulation. Similar stimulation of the control ePet1-DRNmCherry mice had no effects. (H and I) Changes in preference for the chamber conditioned (CS+) with VTA (H) or NAc (I) stimulation as well as that for the opposite chamber and the middle chamber. (J) A cell in the VTA of an ePet1-DRNChR2 mouse was filled with 0.5% Neurobiotin in the recording pipette and labeled with Cy3-streptavidin. (K) The voltage traces of the cell shown in (J) in response to different current injections (-40 to 40 pA; 10 pA per step). (L and M) The morphology (green in L) and intrinsic properties of a cell in the NAc of Vglut3-/-;ePet1-DRNChR2 mouse. Red in (L) indicates ChR2-mCherry+ fibers, and blue indicates DAPI counterstaining of cell nuclei. (N) VGluT3 immunoreactivity was present in the DRN of a Vglut3+/+ mouse, but not in that of Vglut3-/- mouse. Both mice were treated with colchicine.
Figure S7. The effects of depleting 5-HT and knocking out Vglut3 on the performance of iClass tests. Related to Figure 7. (A) Coronal sections of wild-type (upper panels) and Tph2-/- mice (lower panels) show that TPH2 knockout mice completely lack Tph2 expression. (B) HPLC-EC analysis of brain monoamine levels. (C) The levels of 5-HT in the whole brain of Tph2 KO mice and L-pCPA-treated mice were significantly reduced to 7% and 16% of control levels of saline-treated wild-type mice (left panel). The levels of 5-Hydroxyindoleacetic acid (5-HIAA), a key metabolite of 5-HT, were similarly reduced. ***, p<0.001; between-group t-tests. n =9 saline-treated mice, 10 Tph2-/- mice, and 10 L-pCPA-treated wild-type mice. (D) L-pCPA treatment slightly reduced brain dopamine and norepinephrine levels. ***, p<0.001; between-group t-tests; n = 10 mice for either group. (E and F) Locomotion tracks (E) and heat maps (F) show that knocking out the Tph2 or Vglut3 gene produced only mild phenotypes in iClass training. However, the reinforcement effect is completely eliminated following the disruption of 5-HT and glutamate release by injecting L-pCPA into Vglut3-/- mice. Tph2-/- and Vglut3-/- genotypes were based on ePet1-Cre background.
Figure S8. Tph2-/- and Vglut3-/- mutant mice exhibited a reduced performance in light self-stimulation tests and olfactory discrimination tests. Related to Figure 8. (A) The rates of poking rates across testing sessions with different schedules of fixed ratio (FR1, FR2, FR5, and FR8). Vglut3 but not Tph2 knockout mice had drastic reduction in the acquisition of self-stimulation with FR1 schedule. Tph2 knockout mice exhibited a much poorer performance with the schedules of FR5 and FR8. WT, Tph2-/- and Vglut3-/- genotypes were based on the ePet1-Cre background. (B and C) Hit and false positive response ratio throughout the Go/No-go training sessions for Tph2-/-; ePet1-DRNChR2 mice (B) and Vglut3-/-;ePet1-DRNChR2 mice (C).
Supplementary Movie: Supplementary Movie S1: A video shows the exploratory behavior of an ePet1-DRNChR2 mouse during the first 15-min long iClass training session (T1). Blue light pulses (15 ms, 20 Hz) were delivered through an optic fiber only when the mouse entered the marked center subarea. The mouse received its first stimulation at the time marked ‘0:00:30′ and its second stimulation at ‘0:02:29′. The mouse was then quickly reinforced to explore the center area after a few more center entries. The video was compressed to play in a 5× fast forward mode and time tags are shown in the bottom left corner. Related to Figure 1.
Supplementary Movie S2: The exploratory behavior during the second iClass training session (T2). The ePet1-DRNChR2 mouse vigorously explored the center section throughout the 15-min training session. Related to Figure 1.
Supplementary Movie S3: Light stimulation of DRN Pet-1 neurons supported strong self-stimulation in an operant chamber. Nose poking of the active hole by the ePet1-DRNChR2 mouse resulted in phasic stimulation (2s, 5 Hz) followed by a 5-s timeout period. The active hole was illuminated during the stimulation (2s) and timeout period (5s). Related to Figure 2.