An ideal gas model of air bubble dynamics in vessels informs an understanding of the tempo of embolism formation in stems.
Abstract
A cavitation event in a vessel replaces water with a mixture of water vapor and air. A quantitative theory is presented to argue that the tempo of filling of vessels with air has two phases: a fast process that extracts air from stem tissue adjacent to the cavitated vessels (less than 10 s) and a slow phase that extracts air from the atmosphere outside the stem (more than 10 h). A model was designed to estimate how water tension (T) near recently cavitated vessels causes bubbles in embolized vessels to expand or contract as T increases or decreases, respectively. The model also predicts that the hydraulic conductivity of a stem will increase as bubbles collapse. The pressure of air bubbles trapped in vessels of a stem can be predicted from the model based on fitting curves of hydraulic conductivity versus T. The model was validated using data from six stem segments each of Acer mono and the clonal hybrid Populus 84K (Populus alba × Populus glandulosa). The model was fitted to results with root mean square error less than 3%. The model provided new insight into the study of embolism formation in stem tissue and helped quantify the bubble pressure immediately after the fast process referred to above.
Vulnerability curves (VCs) have been viewed as a good measure of the drought resistance of woody stems (Cochard et al., 2013). Increasing drought increases the xylem tension (T) and eventually induces cavitation of the water in conduits when the T exceeds a certain threshold (Sperry and Tyree, 1988; Sperry et al., 1996). A cavitated vessel first fills with water vapor and eventually fills with air at atmospheric pressure because of Henry’s law, which describes gas equilibrium at the water/air interface. The time required for the progress mainly depends on the penetration rate of air into the recently cavitated vessel lumen via diffusion through the liquid phase.
Previous studies were made about how fast bubbles disappear in embolized stems because of the solubility of air in water when water pressure exceeds atmospheric pressure, and the process takes 10 to 100 h depending on conditions (Tyree and Yang, 1992; Yang and Tyree, 1992). The tempo of bubble disappearance was measured by following the rise in stem hydraulic conductivity (kh) versus time. The theory of Yang and Tyree (1992) relied on the same principles used in this article (Henry’s law, Fick’s law, and the ideal gas law), but modeling and experiments were done at pressures between 1 and 3 times atmospheric pressure rather than subatmospheric pressure (negative pressure). However, much less is known about the tempo of bubble formation in recently cavitated vessels (Brodersen et al., 2013). If the progress of embolus formation takes several minutes, then no changes in conductivity could be observed with available techniques, but if it takes hours, then the tempo of bubbles can be studied by rapidly inducing cavitation with increasing T and after cavitation induction measuring the influence of T on stem kh as T is reduced gradually to zero. If air bubbles are at a pressure (bubble pressure [Pb*]) lower than a threshold near atmospheric pressure, bubbles ought to collapse when T decreases according to the ideal gas law and Henry’s law (see theory below). The consequence of bubble collapse will be partial filling of vessels with water and the rest with air bubbles. The partial filling of water in a recently cavitated vessel ought to increase the lumen conductivity from zero and connect the embolized vessel to adjacent conductive vessels and, hence, ought to increase the conductivity of the stem by an additional flow pathway (Wheeler et al., 2005; Hacke et al., 2006). The vascular system of stems is a complicated network with vessels of different lengths, diameters, and orientation (Evert, 2006), and the complex vessel network makes the additional pathway possible. Therefore, bubble collapse could be detected through the impact of T on the kh of the stems in a way that is very similar to the methods used by Yang and Tyree (1992) but requires a more sophisticated centrifuge technique to induce embolism.
Many studies have assumed that the bubble pressure in newly cavitated vessels ought to be near atmospheric pressure, and no corrections for bubble pressure have been taken in measuring percentage loss of conductivity (PLC) when T is lower than a critical threshold (Li et al., 2008; Wang et al., 2014a). As a result of bubble collapse, the measured kh under a mild T should be higher than that under high T (greater than 0.5 MPa). And the lower the initial bubble pressure, the more bubbles collapse with decreasing T.
The aim of this study is to construct a model that estimates average bubble pressure in partly embolized stems from the functional dependence of kh on T, and with this model, we can further our understanding of the tempo of bubble formation in stems. Here, we will argue that the tempo of bubble formation is in two phases: an initial rapid phase (seconds to minutes to complete) followed by a much slower phase (many hours to complete). Since there is no method for measuring the rapid phase, the rapid phase will be described theoretically below. Next, a theory will be developed that allows the estimation of the pressure of air in recently formed bubbles in vessels during the slow phase. An experimental validation of the model will follow that will yield values of bubble pressure within the first 1 to 2 h following the fast phase of embolism formation in vessels.
THEORIES AND MODELS
The Theory of Fast Embolus Equilibrium following Cavitation Events
Water-filled vessel lumina usually occupy about 10% (8.6% in Acer mono and 15.1% in Populus 84K [Populus alba × Populus glandulosa]) of the volume of wood. The remainder of the wood can be divided between air, water, and solids distributed between living and dead cells in woody xylem tissue; how much of the volume is air depends on prior history. Immediately following the rapid cavitation of a fraction (α) of the water volume (vessels), the vessel lumina will be filled primarily with water vapor. Some simple calculations demonstrate that, within a few seconds or minutes, a cavitated vessel will reach a quasi-stable pressure below atmospheric pressure by drawing from air dissolved in the immediate vicinity of the cavitated vessel. Three mechanisms are considered for air entry into a newly cavitated vessel: (1) the air derived from the dissolved air in the water of the cavitated vessel before the cavitation event happened, (2) mass flow through the pit pore that seeds cavitation, and (3) diffusion of air from surrounding tissue.
Based on the equilibrium partial pressure of water vapor above liquid water plus the solubility of air in water (Henry’s law), the first mechanism contributes about 3.2 kPa of water vapor (at 298 K), 1.2 kPa of nitrogen, and 0.6 kPa of oxygen if the water in the embolized vessel is saturated with air and if all of it contributes to the embolus following the cavitation event. The nitrogen and oxygen partial pressures have to be viewed as upper bound estimates, because some of the dissolved air may be drawn up into the transpiration stream before it can escape into the cavitated vessel.
For the second mechanism, we can suppose that the mechanism of cavitation is air seeding from an adjacent vessel already filled with air. Air seeding is supposed to occur through the largest pit membrane pore at the T that is big enough to pull the air/water interface through a hypothetical pore of the pit membrane. If this pore remains filled with air following the cavitation event, then the pore could deliver air by pneumatic flow of air from the vessel that seeds the cavitation to the newly cavitated vessel. Calculation based on this model of pneumatic flow reveals that the process would take days to completely fill the cavitated vessel and, hence, can be ignored (Supplemental Appendix S1), and most researchers assume that the pore-seeding embolism will fill with water within seconds after the cavitation event.
The third mechanism requires us to invoke Henry’s law to calculate how much air might be delivered from endogenous sources (from within the stem excluding the cavitated vessels). Here, we will assume that no air comes from exogenous sources (from outside the stem). First, we consider the final equilibrium from endogenous sources, then we will approximate the time to reach this early equilibrium. It is worth noting that the air in fibers and extracellular spaces may also be a major source of air in this progress; however, we followed the standard practice of flushing stems with degassed water to eliminate air in vessels and surrounding fibers. Solving Henry’s law for a void forming a volume fraction α of space surrounded by air-saturated water yields the following relationship (Supplemental Appendix S1):
 |
(1) |
where PG is the partial pressure of gas species G at equilibrium, PG* is the partial pressure of nitrogen or oxygen in the atmosphere, KG is the Henry’s law constant of gas G, RT is the gas constant times Kelvin temperature, and α is the fraction of the water volume that has cavitated. The final bubble pressure in the embolized vessels should be  , where
  and
and  can be computed from Equation 1 and
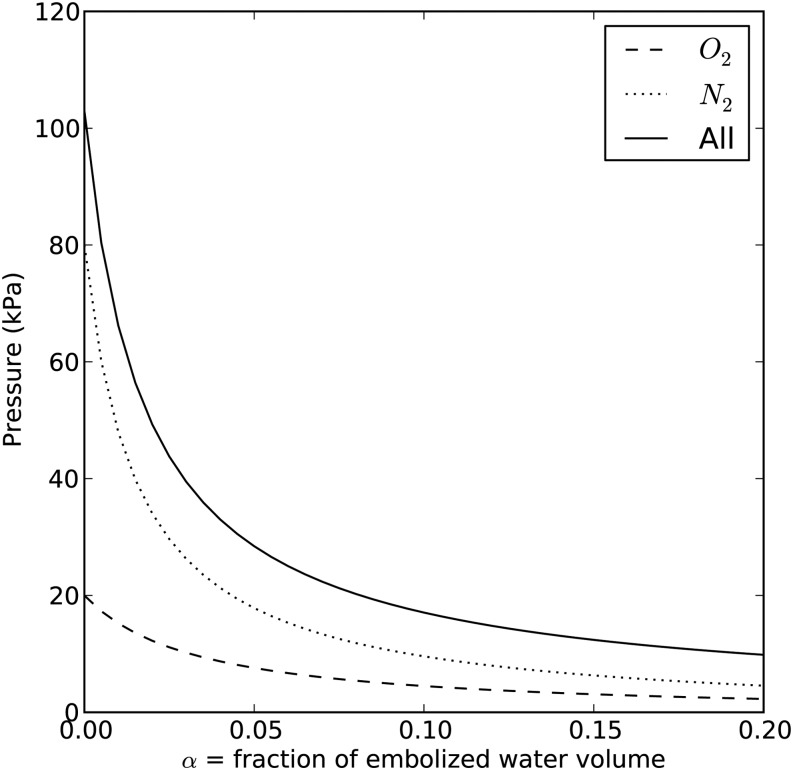
  is the saturated water vapor pressure (3.2 kPa at 298 K). Figure 1 shows the relationship between α and the theoretical initial bubble pressure in stem. The curves in Figure 1 are upper bounded estimates of the early equilibrium pressure, because it is assumed that the surrounding water was saturated with air, as determined by PG* . But in the experiments presented below, stems were flushed with partly degassed solution, so the amount of gas in the surrounding tissue would have been below the saturation level (PG*).
Figure 1.
Relationship between the fraction of embolized water volume and partial pressure in the embolized vessels. The dotted line represents the partial pressure of nitrogen, the dashed line represents that of oxygen, and the solid line represents the sum of the partial pressure of oxygen, nitrogen, and saturated water vapor pressure (3.2 kPa at 298 K). This figure ignores the 1% contribution of argon to the gas mix in air.
The initial equilibration time was calculated using a simplified model for the diffusion of gas from a cylindrical shell surrounding recently cavitated vessels (Supplemental Fig. S1). Assume that α of the water volume instantly cavitated and that the cavitated vessels are evenly distributed throughout the stem. In a 1-cm segment of wood, each cavitated vessel of radius r would draw air from a cylindrical shell of water of radius R, such that the volume of the water shell = 1 cm π(R2 − r2)β cm3 of water, where β is the fraction of the wood volume that is water and 2R is the average distance between cavitated vessels. The maximum distance that air in solution would have to diffuse to the cell surface is x = R − r. The mean time t that it takes for half of the air molecules to diffuse through water at distance x is proportional to the distance squared: x2 = 2DGt, where DG is the diffusion coefficient of gas species G in water (DG of oxygen and nitrogen in water are 2.10E-5 and 1.88E-5, respectively). Using a typical value of vessel radius = 15 μm, α = 0.05 (5% of water embolized) and DG can be assigned an estimated maximum distance of diffusion to be about x ≅ 55 μm and the time for more than half the air to diffuse into the newly cavitated vessel to be ≅2 s, so 99% equilibrium would occur in less than 14 s (about six half-times). A more rigorous solution of the problem produced a result that was quite close to this estimate (Supplemental Fig. S2; Supplemental Appendix S1). If a smaller percentage of vessels cavitate, then the diffusion distance, x, for endogenous gas would be increased, making the t increase proportional to the square of x. For example, if 15% of the vessel cavitated instead of 50%, then x would increase by a factor of 3 and t would increase by a factor of 9.
We argue here that there should be a fast and a slow equilibrium phase. The fast phase is caused by localized equilibrium over a short x distance. By the time the fast equilibrium is completed, all subsequent Henry’s law equilibrium has to be satisfied by diffusion over a much longer distance. For a 1-cm-diameter stem, this distance is roughly 5 mm (versus about 0.05 mm for the fast equilibrium) for air to diffuse from exogenous sources outside the stem. Since the time for equilibrium is proportional to the square of x, it follows that the slow equilibrium time will be (5/0.05)2 = 104 times longer. So if the fast phase takes 10 s, the slow phase will be 105 s, or about 1 d.
In conclusion, we expect the initial equilibration of bubble pressure to be quite fast (10–100 s), depending on the percentage of vessels cavitated. In contrast, the time for exogenous sources of air (outside the stem) to diffuse into the stem should be much longer. The back of the envelope calculation in the previous paragraph suggests that this time is quite long. Some experimental validation about the time it might take can be gained from the time it takes air bubbles to dissolve in stems (Tyree and Yang, 1992). From tables 2 and 3 in Tyree and Yang (1992), it can be seen that the time for all bubbles to dissolve when the applied pressure is 14 kPa is about 150 h, and it is about 15 h when the applied pressure is 150 kPa for stems about the size used in the cavitron. If we equate full recovery to about three half-times, as measured by Tyree and Yang (1992), then the time for recovery will be up to 16 h near atmospheric pressure. We anticipated similar half-times for the reverse process of bubble formation. In the second article in this series, we measured the tempo experimentally, and the time needed was more than 1 d. The experimental conclusions of the above experiments were in agreement with theoretical models based on Henry’s and Fick’s laws.
Single-Vessel Model without T Gradients
The single-vessel model could be an ideal gas law model provided that the number of moles of gas in the bubble is constant. In this special case, the bubble volume (Vb) or bubble length (Lb) can be computed from absolute bubble pressure (Pb) and absolute water pressure (Pw) in or adjacent to the vessel. Assuming cylindrical geometry for vessels, we can say that:
 |
(2a) |
When the bubble completely fills the entire vessel, it has a pressure = Pb* and it occupies the entire length of the vessel (Lv). As the bubble collapses to Lb < Lv, the bubble pressure increases (Pb > Pb*) according to the ideal gas relation in Equation 2a. However, we have already argued above that gases quickly equilibrate between a vacuum void and surrounding tissue and that the equilibration time is generally less than 10 s (for more exact solutions, see Supplemental Appendix S1). But the time required to do measurements of changes in kh resulting from changes in Lb is much greater than 100 s. Bubble pressure will equilibrate with water adjacent to the bubble, and any increase in bubble pressure will result in the rapid movement of air from the bubble to the surrounding solution, which would invalidate the application of the ideal gas law. So we have to appeal again the Henry’s law to explain changes in bubble size.
Taking into account Henry’s law solubility together with the ideal gas law yields the following solution, where the numbers of moles of water and air are conserved in the vicinity of the embolus:
 |
(2b) |
with the restriction that Lb ≤ Lv if the right terms yield a larger value of Lb. Equation 2a is similar to Equation 2b except for the last term generated by Henry’s law considerations, where α = the initial fraction of embolized volume with initial bubble pressure, Pb*, and KA is the equivalent Henry’s law constant for air = a value based on 20% oxygen and 80% nitrogen. Equation 2b is maybe wrong by 1% or 2%, because it does not account for the amount of air/water entering the vessel as the bubble collapses. The bubble collapse could be a little more if water enters with air dissolved below the equilibrium concentration for Pb or could collapse less if the water that enters is more saturated with air. But in most solutions, the error will be just a few percentage points.
At final equilibrium, Pb should be higher than Pw because of the surface tension (γ) and contact angle (θ) between the water/air interface and the vessel wall of the lumen with diameter Dv. In this article, we assigned θ = 45° as typical, which ranged between 42° and 55° in various species (Zwieniecki and Holbrook, 2000). Hence, the bubble pressure is always higher than the water pressure by capillary pressure (PC):
 |
(3a) |
 |
(3b) |
T is typically reported relative to barometric pressure (Pbaro), whereas Pw is the absolute pressure; hence, we have Pw = −T + barometric pressure, and hence:
 |
(3c) |
The bubble pressure will change depending of changes in Pw (or T) and the number of moles of air in the bubble. In this article, the bubble volume change is computed by assuming that Henry’s law equilibration happens continuously between Pb and the surrounding water.
The total resistance of a vessel (Rv) consists of lumen resistance (RL) and pit resistance (RP). The lumen resistance is proportional to the length of water in the lumen, while the pit resistance is proportional to the reciprocal length of water (Hacke et al., 2006). So, resistance of a vessel with Lv and water length (Lw) will be:
 |
(4a) |
 |
(4b) |
 |
(4c) |
where RL,0 and RP,0 represent the lumen resistance and pit resistance of a nonembolized vessel, respectively. We use the generally accepted and empirical approximation that lumen resistance is equal to pit resistance in any vessel regardless of Lv (Hacke et al., 2006); hence, when we assume that RL,0 = RP,0 and from Equations 4a, 4b, and 4c, we get:
 |
(5) |
where Rv,0 = RL,0 + RP,0. The value of water length = Lv − Lb can be substituted into Equation 5. If we want an expression for single-vessel conductivity (kh,s), then by definition of conductivity and resistance kh,s = Lv/Rv, we have:
 |
(6) |
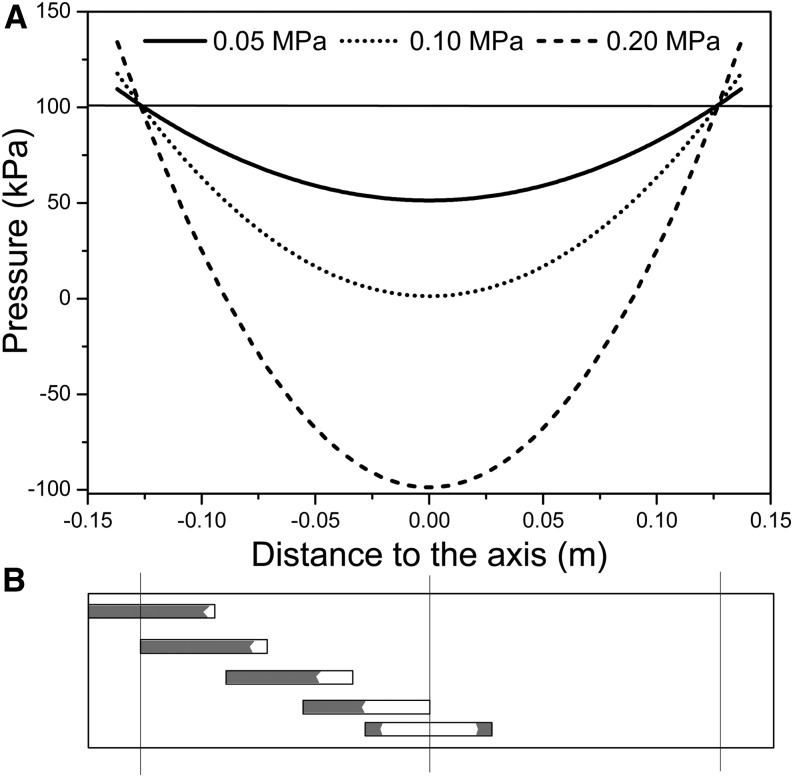
Ultimately, the value of kh,s depends on Pw or T. The conductivity of a stem segment can be equated to the sum of many kh,s values in series and parallel. When kh is measured in a conductivity apparatus (gravimetric method; Li et al., 2008), Pw is above barometric pressure and it changes linearly with distance in the stem, so that embolized vessels at different locations in the stem would have only slightly different values of kh,s. In contrast, if kh is measured in a cavitron, then T or Pw is a quadratic function of radial position in the stem relative to the axis of rotation in the centrifuge (Cochard, 2002; Cai et al., 2010; Hacke et al., 2015), so the location of the vessel affects the value of Pw and, hence, the value of kh,s changes more dramatically with position, as shown in Figure 2. In this article, kh of whole stems was measured in a centrifuge; hence, individual vessel kh,s values were modulated by changes in T near the vessel. Most readers can skip the detailed derivation of how kh of a whole stem depends on the collective behavior of individual kh,s values in the cavitron (Supplemental Fig. S3; Supplemental Appendix S2), because the most important thing is to realize that kh measured in a Cochard cavitron will change with the maximum tension at the center of rotation (Tc) at the axis of rotation in a cavitron and that other values of T in the stem will be a quadratic function of Tc. Another important thing to remember is that Tc is consistently more than the average tension ( ) experienced by vessels. The ratio of
  to Tc is always equal to 2:3.
Figure 2.
Pressure distribution in a cavitron and the pattern of bubble collapse due to pressure distribution. A, Absolute pressure distribution of three different Tc values: 0.05, 0.1, and 0.2 MPa. Average T values are always two-thirds of the Tc T. B, Bubble collapse in vessels located in different regions in stems.
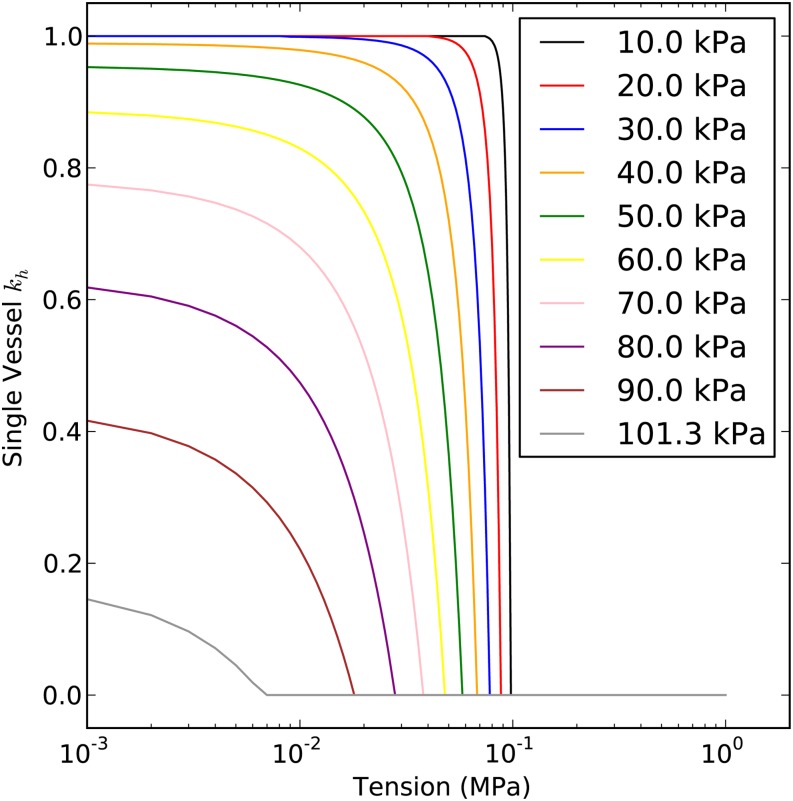
The behavior of Equation 6 is plotted in Figure 3. When T
>
 , the vessel lumen is fully embolized and the kh,s = 0, but as soon as T
<
 , the theoretical kh begins to rise because of bubble collapse. Each curve in Figure 3 represents how kh will change with T from low to high initial bubble pressure, Pb*, in Henry’s law equilibrium with surrounding tissue; at the three lowest bubble pressures, the bubble completely dissolves as T approaches 0. In contrast, at high Pb* values, the bubble is only partly dissolved in the surrounding tissue. The reader should note that the recovery of conductivity happens only if the restored water in embolized vessels is adjacent to functional vessels. In a highly embolized stem, say PLC greater than 90%, this assumption may not be true, but for simplicity, we ignore this issue in the rest of this article. Addressing this real case would require specific knowledge of the three-dimensional interconnectivity of vessels, and such knowledge is not available.
Figure 3.
Solution of Equation 6. This single-vessel model shows how kh changes with T. The y axis is the ratio of an embolized vessel to the kh of a water-filled vessel. In this solution, PC = 7 kPa and Pb* was assigned values of 10 to 101.3 kPa, as shown in the key.
RESULTS
Sensitivity Analysis of the Hydraulic Recovery Model
Standard sensitivity analysis of the model output (kh) to the model parameters is needed to reveal which model parameters are most important in a hydraulic recovery curve (i.e. a plot of how much kh increases in response to a decline in Tc). As discussed above and in Supplemental Appendix S2, we know that four parameters affect the final output of the model: (1) average bubble pressure, (2) fraction of embolized vessels in the stem, (3) Lv, and (4) vessel diameter, which determines the capillary pressure. The relationship between the model output and the parameters can be studied by keeping three of them constant while changing the fourth parameter.
Impact of the Bubble Pressure
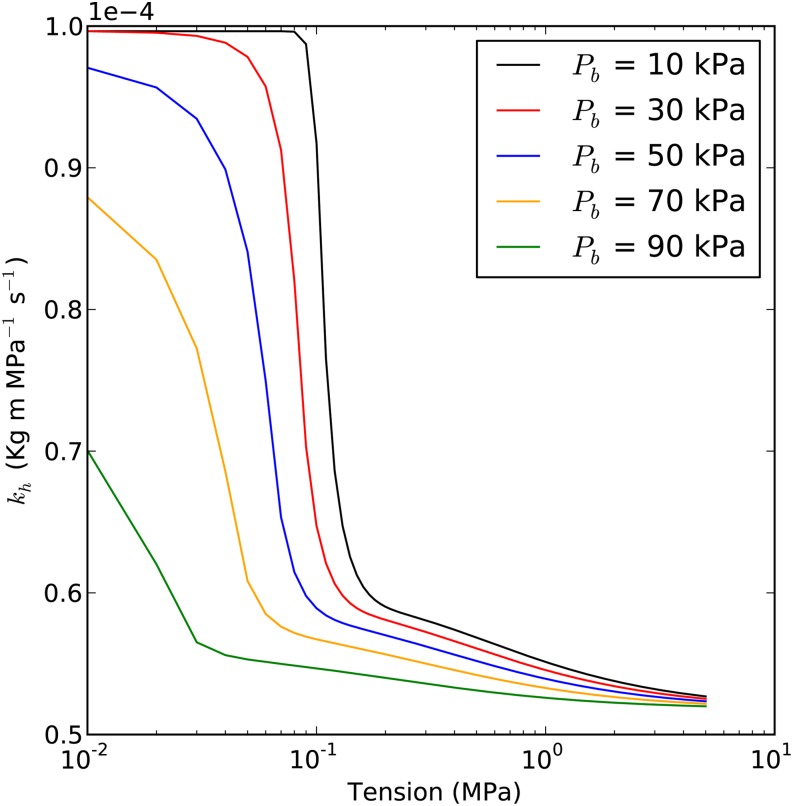
According to the fast embolus equilibrium model, when the stem is under high T, say 1 MPa in the center, cavitated vessels will be filled with a mixture of water vapor and a subatmospheric partial pressure of nitrogen and oxygen. The model predicts that the kh measured in a cavitron should increase as the centrifugal T decreases, because the bubbles will collapse in response to the rise of the Pw. The impact of initial bubble pressure on how the stem kh changes with T is shown in Figure 4. Figure 4 also provides the theoretical basis for measuring bubble pressure through curve fitting, as explained in “Results.”
Figure 4.
Prediction of the kh curve versus T. Each curve is based on a different initial Pb* value (10, 30, 50, 70, and 90 kPa) in the embolized vessels in the theoretical stem. Maximum kh was set to 1E-4 kg m MPa−1 s−1 for each curve; average Lv was 5 cm; capillary pressure was 12 kPa; and the fraction of embolized vessels (ε) was 50% in the embolized segment (regions B–D in Supplemental Fig. S4, namely the portion of the segment that is not immersed in water).
According to the analysis in Figure 1, it seems likely that the initial Pb* should be around 30 kPa when about 5% of the water volume is embolized (about 50% PLC, assuming that vessels make up 10% of the water volume). Figure 3 clearly shows that kh should be nearly independent of Tc until Tc fell below 0.2 MPa. Then, kh sharply increased with decreased Tc from 0.2 to 0.01 MPa. The T axis is plotted on a log scale to display the data more clearly; otherwise, the plots would just show rapidly rising curves near the origin of the plot without much separation in the curves (plot not shown). The curves of kh versus Tc rose faster in Figure 4 than in Figure 3 because, in a cavitron, the vessels far from the rotation axis were at lower T than near the axis of rotation, so the bubbles far from the axis start collapsing before the bubbles in vessels near the axis of rotation.
Impact of the Fraction of Embolized Vessels
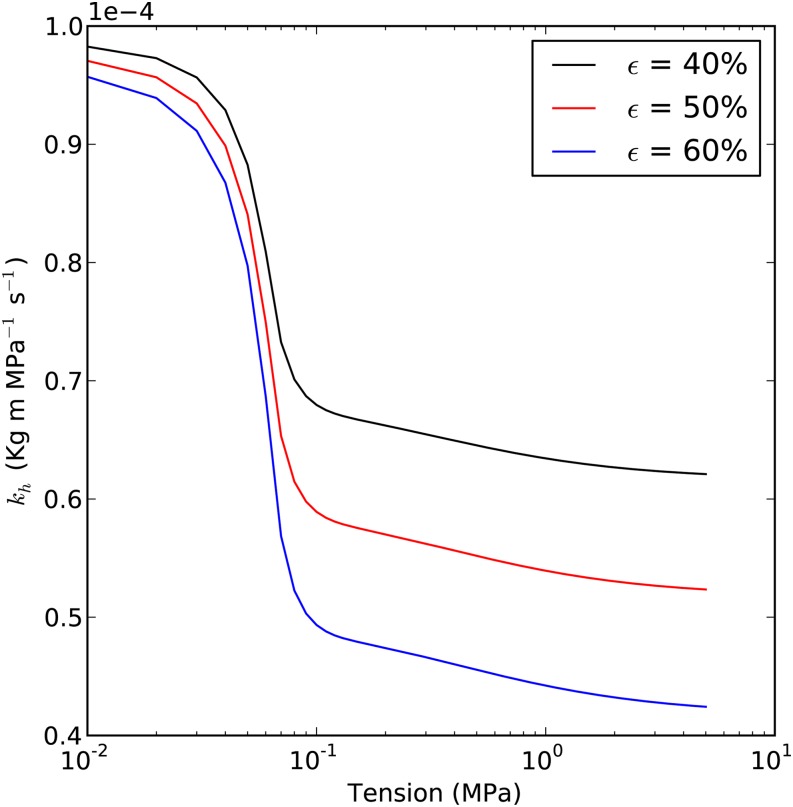
Based on the argument in Figure 1 (Eq. 1), it seems unlikely that ε could change without Pb* changing as well, since ε affects the fraction of embolized water, α. Figure 5 shows the prediction assuming that it is possible to change ε independently of Pb*. It is worth noting that there should be a fairly close correlation between ε and the PLC observed at any given Tc.
Figure 5.
Prediction of the kh curve with different values of ε. The relationship between PLC and the fraction of vessels cavitated is given by PLC/100 = ε. Each curve is based on a different ε value (40%, 50%, and 60%). Maximum kh is 1E-4 kg m MPa−1 s−1; average Lv is 5 cm; capillary pressure is 12 kPa; and Pb* is 50 kPa.
Impact of Lv
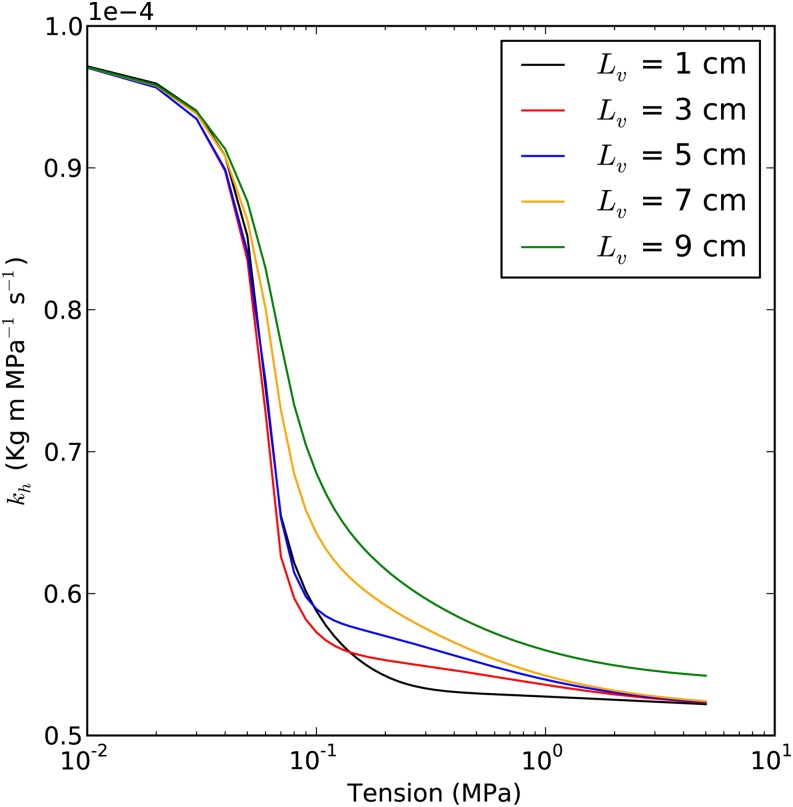
Figure 6 demonstrated that the modeled value of kh was relatively independent of Lv. This is probably because we assumed that lumen resistance and pit-membrane resistance were equal independent of the Lv, which agrees with the general empirical results (Hacke et al., 2006).
Figure 6.
Prediction of the kh curve with different average Lv values. Each curve is based on a different average Lv of the stem (1, 3, 5, 7, and 9 cm, as shown in the key). Maximum kh is 1E-4 kg m MPa−1 s−1; average Pb*) is 50 kPa; capillary pressure is 12 kPa; and ε in the embolized segment is 50%.
Impact of Vessel Diameter
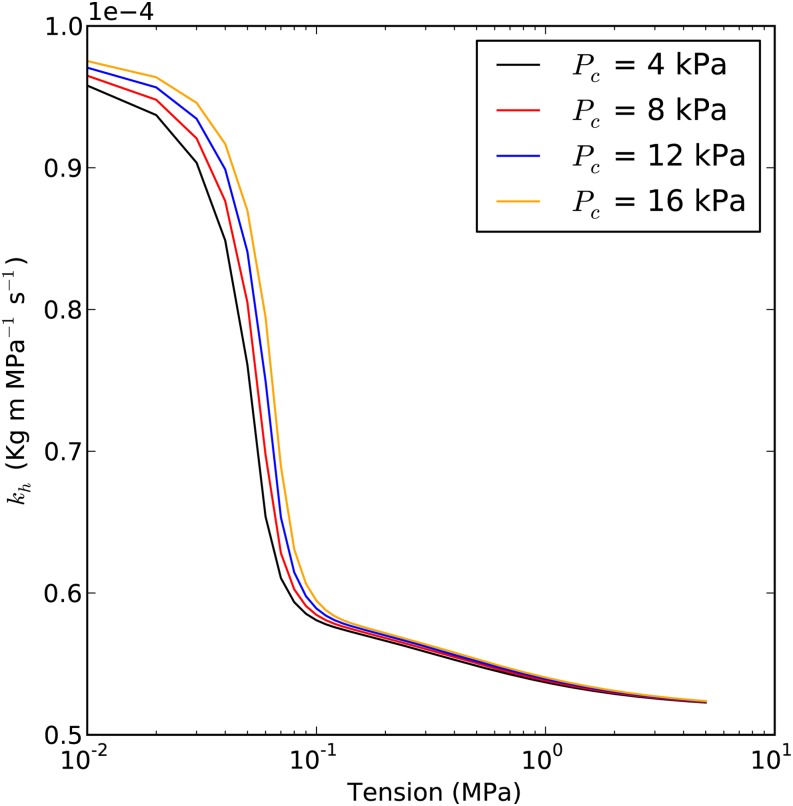
Vessel diameter affects the capillary pressure in cavitated vessels; hence, it had some impact on the theoretical hydraulic recovery curve. According to Equation 3a, PC is inversely proportional to vessel diameter. Figure 7 demonstrated that the maximum error caused by PC is about 0.6% kPa−1. Bubbles collapsed more with small-diameter vessels than with large-diameter vessels because of the higher values of PC.
Figure 7.
Prediction of the kh curve with different PC levels. Different PC values (4, 8, 12, and 16 kPa) were used for each curve. Maximum kh is 1E-4 kg m MPa−1 s−1; average Pb* is 50 kPa; average Lv is 5 cm; and ε in the embolized segment is 50%. The vessel diameter that corresponds to each PC depends on cosθ (θ = π/4). So the vessel diameters are 50.89, 25.44, 16.96, and 12.72 μm for PC values of 4, 8, 12, and 16 kPa, respectively.
Experimental Results: Curve Fitting to Yield Pb*
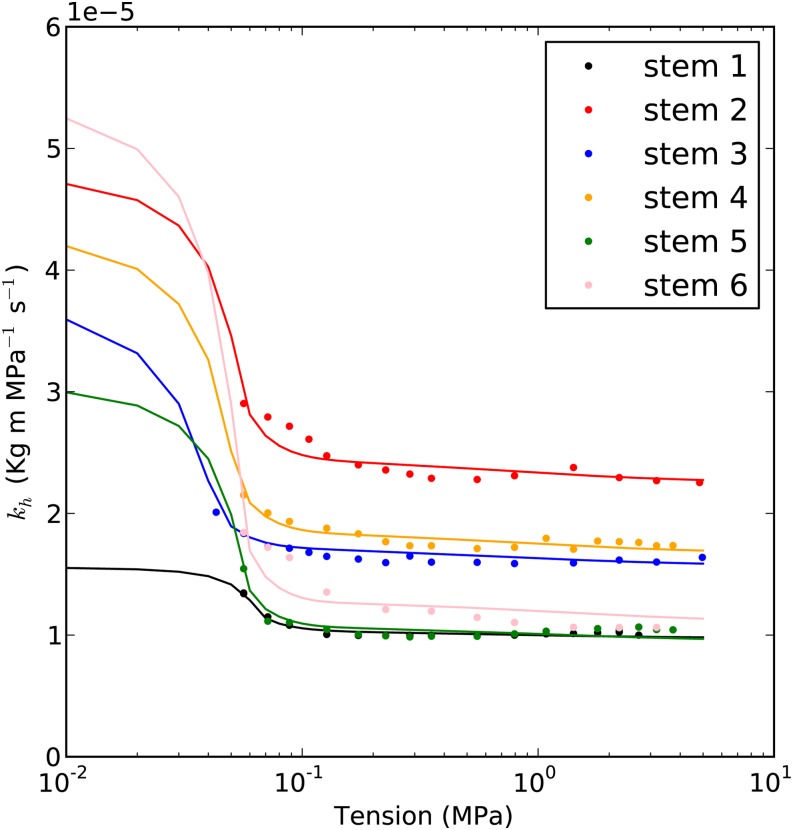
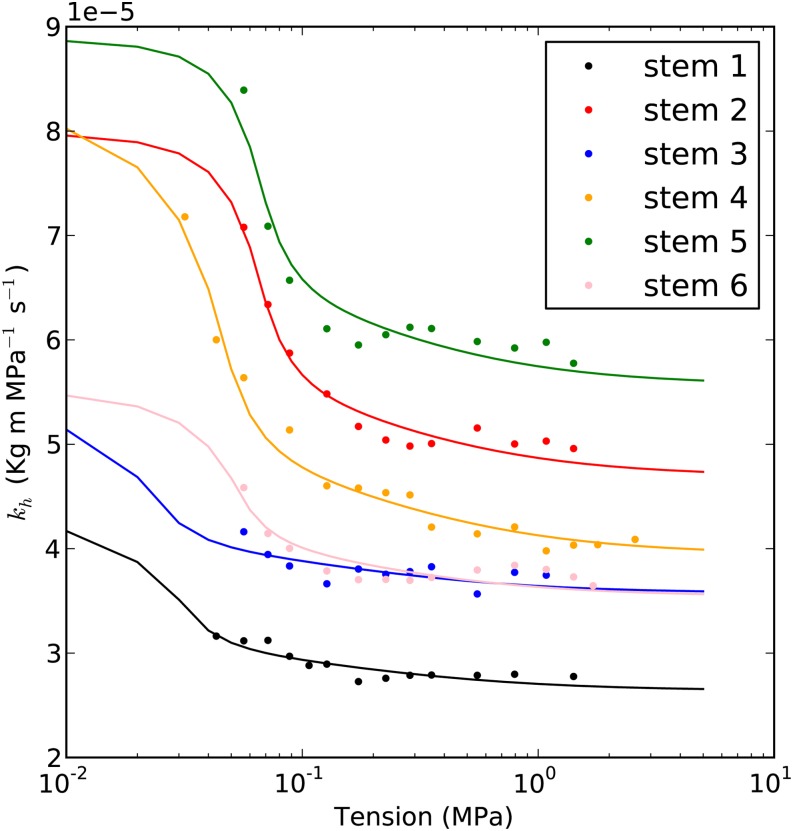
The hydraulic recovery model (Supplemental Appendix S2) was used to fit the results of six A. mono and six Populus 84K stems, as shown in Figures 8 and 9. The fitting involved finding the bubble pressure before bubble collapse, Pb*, that minimized the root mean square error in the fitted line. The average root mean square error was generally less than 3%, as shown in Table I. The mean ± sd bubble pressure in Table I was 54 ± 14 kPa. All the bubble pressures estimated were lower than the atmospheric pressure.
Figure 8.
Examples of kh curve fittings of A. mono. The circles are the kh values measured in the cavitron, and the lines are the best fit curves. The details of the curves are as shown in Table I.
Figure 9.
Examples of kh curve fittings of Populus 84K. The circles are the kh values measured in the cavitron, and the lines are the best fit curves. The details of the curves are as shown in Table I.
Table I. Results of the kh curve fitting of six A. mono stems and six Populus 84K stems.
kmax is the maximum kh of the stem; cavitron PLC is the experimental PLC measured in a centrifuge; Sperry PLC is the PLC under atmospheric pressure predicted by the model; central PLC is the PLC at the central region of the stem predicted by the model; ERMS is the route mean square error of the curve fitting; Tform is the time used to induce embolism in the stem; and Trecovery is the total time used to measure the curve.
| Parameter | Stem 1 | Stem 2 | Stem 3 | Stem 4 | Stem 5 | Stem 6 |
|---|---|---|---|---|---|---|
| A. mono | ||||||
| kmax (E-5 kg m MPa−1 s−1) | 1.57 | 5.02 | 4.28 | 4.69 | 3.28 | 5.96 |
| Cavitron PLC (%) | 39.55 | 57.00 | 65.88 | 66.08 | 72.60 | 82.70 |
| Sperry PLC (%) | 0.76 | 4.47 | 13.57 | 7.80 | 6.45 | 9.04 |
| Central PLC (%) | 42.66 | 61.49 | 71.07 | 71.28 | 78.32 | 89.21 |
| Pb* (kPa) | 44.59 | 53.81 | 67.11 | 57.82 | 52.71 | 54.45 |
| ERMS (%) | 1.77 | 2.78 | 1.60 | 2.20 | 4.58 | 4.03 |
| Tform (h) | 0.41 | 0.41 | 0.22 | 0.36 | 0.82 | 0.35 |
| Trecovery (h) | 0.75 | 0.53 | 0.82 | 0.48 | 0.65 | 0.82 |
| Populus 84K | ||||||
| kmax (E-5 kg m MPa−1 s−1) | 5.25 | 8.07 | 7.07 | 9.13 | 8.95 | 5.68 |
| Cavitron PLC (%) | 51.59 | 43.62 | 51.31 | 58.64 | 39.49 | 39.32 |
| Sperry PLC (%) | 16.12 | 0.92 | 21.95 | 9.16 | 0.65 | 2.54 |
| Central PLC (%) | 55.65 | 47.05 | 55.35 | 63.26 | 42.60 | 42.41 |
| Pb* (kPa) | 57.76 | 72.45 | 34.45 | 37.25 | 77.44 | 38.48 |
| ERMS (%) | 1.72 | 1.82 | 2.06 | 2.18 | 2.48 | 2.59 |
| Tform (h) | 0.56 | 0.20 | 0.47 | 0.53 | 0.26 | 0.49 |
| Trecovery (h) | 0.77 | 0.33 | 0.48 | 0.82 | 0.27 | 0.29 |
The results of 12 fittings showed that more than 70% of the kh change happened when the Tc was lower than 0.1 MPa. In terms of Pw, a Tc of 0.1 MPa corresponds to Pw of 0 kPa. The kh value was stable when T was higher than 0.3 MPa. On average, the kh recovered 31% ± 8% and 68% ± 14% (means ± se) of theoretical maximum recovery in A. mono and Populus 84K, respectively, when we decreased the T as shown in Figures 8 and 9. The minimum value of Tc used for measuring kh was 0.045 MPa. The T profile is quadratic (Fig. 2), so Tc = 0.045 corresponded to a mean T of 0.030 MPa, because the mean was always two-thirds of Tc.
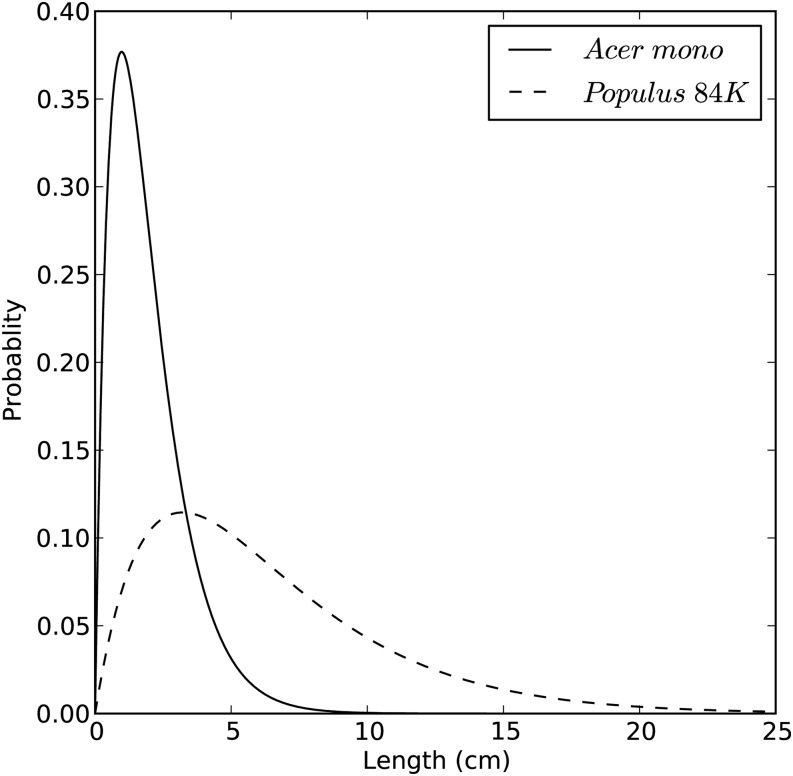
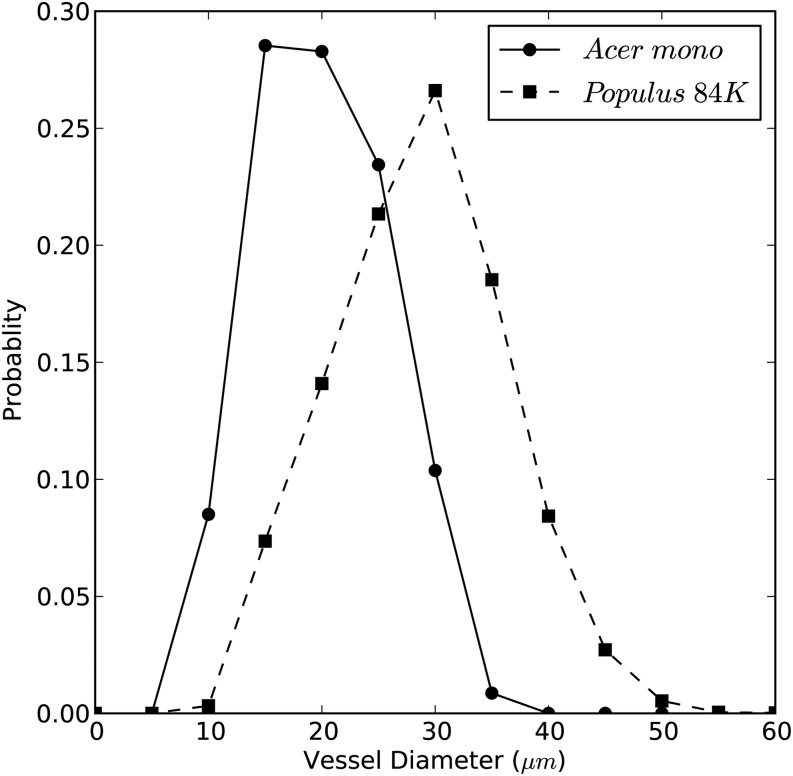
Lv and vessel diameter distributions measured in A. mono and Populus 84K are shown in Figures 10 and 11, respectively. A. mono had significantly shorter vessels at 2.851 ± 0.030 cm (n = 6) than Populus 84K at 5.797 ± 0.144 cm (n = 6). The mean vessel diameters were also significantly less in A. mono than in Populus 84K, 20.07 ± 0.09 µm (n = 3,575) versus 28.70 ± 0.11 µm (n = 4,307), respectively.
Figure 10.
Lv distributions in A. mono and Populus 84K. Lv frequency was computed by using Px = k2xe−kx, where k is the extinction coefficient of the stem and x is the Lv. The values of k for A. mono and Populus 84K were 1.0246 and 0.3113, respectively.
Figure 11.
Vessel diameter distribution in A. mono and Populus 84K. The average diameters of A. mono and Populus 84K were 20.07 and 28.7 μm (arithmetic means), respectively.
DISCUSSION
Impact of the Model Parameters and Estimation of Pb*
Sensitivity analysis of our hydraulic recovery model revealed little impact of Lv on the determination of kh. The estimated impact of using the mean Lv above rather than a Lv distribution biased our results by less than 0.1% (data not shown).
Vessel diameter distributions were as shown in Figure 11, and from Figure 7, we know that the maximum error caused by capillary pressure is 0.6% kPa−1. Therefore, using the arithmetic mean of diameter generated a 0.09% error on the result compared with using a vessel diameter distribution (data not shown).
As shown in Figures 4 and 5, the primary factors controlling hydraulic recovery curves were Pb* and ε. The value of ε was equated to the initial PLC at high Tc before the T was reduced (with the segment under water excluded). As the hydraulic recovery model predicted, the lower the Pb*, the more bubbles collapsed and the more kh recovered in a stem at constant ε values. As a result, the relative change of kh was mainly determined by Pb*. However, it must be remembered that Pb* and ε are not totally independent of each other (Fig. 1; Eq. 1) after the fast phase of embolism formation.
Only the conductivity values measured in the cavitron were used to predict Pb* in stems. Data used to fit kh versus T curves cover a sufficient range of values to make accurate predictions of Pb* (Tc from 0.032 to 1 MPa). Within the T range, kh recovered 31% and 68% of the theoretical maximum recovery in A. mono and Populus 84K, respectively. The Pb* calculated for Populus 84K was more accurate than for A. mono; but the likely error was not enough to alter the basic conclusion that, when cavitation was produced in a cavitron over a period of 1 h, relatively stable Pb* resulted that was significantly less than the atmospheric pressure (100 kPa for the elevation of the university laboratory) based on Student’s t test (P < 10−4 for both species).
The purpose of this article was to present the hydraulic recovery model and show by curve fitting of data (kh versus T) that values of initial bubble pressure can be derived from the fitted curves. The values of bubble pressure were higher than anticipated by us (54 kPa [Table I] versus about 35 kPa [Fig. 1]), but the reason for this will be explained in the next article in this series, where we measure the tempo of increase in Pb*.
The Impact of Bubble Pressure on kh and Vulnerability Curves
The model predicted that kh will increase whenever Tc is decreased below about 0.3 MPa. The model results also predict that the lower the Pb*, the more kh depends on T. The value of kh was most sensitive to decreases in Tc between 0.2 to 0.01 MPa. The results of A. mono and Populus 84K revealed that the model was validated by our data. Fitting the model to experimental data allowed the computation of Pb* in embolized vessels. The hydraulic recovery model is an equilibrium model that indicates the final equilibrium, but it can be imagined that water has to flow into the stem to refill the vessels as the bubbles collapse; hence, we must address the issue of equilibration time to get an accurate value of kh after a change in T.
Bubble collapse in stems involves the absorption of water into stems, and the water absorption will influence the kh value measured in a centrifuge, resulting in an overestimation of kh. The overestimation is a result of the assumption of steady state (i.e. that all water that enters the high-pressure end of the stem segment flows through to the low-pressure end). But if some of the water stays behind to fill part of the vessels (or other rehydrating regions), then the flow is overestimated at any given pressure drop, resulting in a kh that is too high, as we measured the influx flow in a cavitron. Therefore, accurate measurement of kh can be done only after this absorption process is completed. Preliminary measurements suggested to us that a 30-min wait was long enough to achieve stable kh values at the smallest Tc = 0.03 MPa but became much faster as Tc increased. The water absorption also happens when the Sperry rotor is used to induce cavitation, and the standard protocol for kh measurements in a conductivity apparatus is to correct the measurements of kh for this background absorption rate (Hacke et al., 2000; Torres-Ruiz et al., 2012). In the following article of this series, a model of water absorption in the stem is presented, giving a better view of the kinetics of water absorption in stems due to bubble collapse.
Cochard (2002) and Li et al. (2008) both observed no difference in kh measured in a stem at the target Tc versus the kh measured later at a smaller Tc while stems were spinning in a centrifuge, using the original Cochard rotor or a functionally similar rotor fabricated by modifying a Sperry rotor (Li et al., 2008). Similar results were found during the testing of the Cochard cavitron in 2006 (M.T. Tyree, unpublished data). These observations contrast with the results of this article and deserve more analysis. In Li et al. (2008), no data were given, so the range of Tc over which kh was measured was not given; in the earlier study (figure 4 in Cochard, 2002), it is clear that relative changes in kh were measured from Tc = 1.8 to 0.1 MPa; this range should have been sufficient to detect the beginning of a trend (compare Figures 8 and 9), but the se values of Cochard’s early measurements were quite high (0.05–0.15), so no trend was detectable. The experiment has to be continued down to Tc = 0.03 MPa to discern the trend, and the trend has to be discerned in individual stem segments because the variance of the mean kh is so large that it obscures the relationship. Proving the trends reported in this article also requires that kh be measured with high precision on multiple measurements of kh at a given Tc (se < 0.02 and n > 10 is desirable). During the course of our investigation, techniques were improved; hence, some of the later experiments described here had higher precision values, with an se closer to 0.004 in kh (Wang et al., 2014b).
In our experiments, the minimum T used for the measurement of kh ranged from 0.032 to 0.057 MPa, but during gravity-flow measurements, the applied water pressure is 2 to 3 kPa above barometric pressure (i.e. a T of −0.002 to −0.003). Using our model, we extended the theoretical calculations to include how positive pressure (negative T) would affect kh measured by gravity flow. The results of these model calculations are reported in Table I (Sperry PLC). We compare the Sperry PLC with the average cavitron value (cavitron PLC) and the theoretical value near the axis of rotation (central PLC). The deviation of the theoretical Sperry PLC values compared with the cavitron PLC values in Table I is quite large and probably the worst case possible, because the Sperry method arrives at the PLC values shown in Table I through various steps. In each step, the sample is spun to a higher T and then removed for measurement in a conductivity apparatus. After each kh measurement in a conductivity apparatus, more air-saturated water is perfused through the stem, restoring the water-filled spaces near the vessels to a concentration near a saturated value (Henry’s law). So when the stem is spun again, the quick equilibrium happens again and the bubble pressure of each embolized vessel would increase. In contrast, the model predicts what would happen if a high PLC were induced in a stem segment in one step and then moved immediately to a conductivity apparatus. Our model predicts that the Cochard VC will be different from the Sperry VC, but the stepwise measurements in the gravity method will make the bubble pressure rise to atmospheric pressure faster. Besides, the bubble collapse affected VC by decreased PLC (y axis), but T (x axis) was less affected because of the steep slope at P50 (for xylem pressure or tension at 50% loss of hydraulic conductivity). Therefore, no significant difference was observed between the two methods (Li et al., 2008).
In theory, the P50 (positive value) of a cavitron VC is lower than that of a Sperry VC (each point measured at equilibrium) because of the collapse of bubbles starting at a pressure less than 101.3 kPa (the standard atmospheric pressure at sea level). Even if the pressure is 101.3 kPa, there would be some collapse due to the impact of surface T on PC and the 2% or 3% extra bubble compression resulting from gravity-flow measurements at 2 or 3 kPa above atmospheric pressure. But gravity-flow and cavitron-flow measurements are uncertain because of the uncertainty of temperature and stem rehydration. The measurement of kh changes 2.3% °C−1 because of the influence of the temperature dependence of viscosity. Also, stems dehydrated in a centrifuge and then returned to a lower T or atmospheric pressure tended to rehydrate for the first 30 to 60 min, causing an overestimation/underestimation of flow and kh unless care was taken to correct for rehydration affects. Readers should consult Torres-Ruiz et al. (2012) and Wang et al. (2014b) for methods of dealing with these problems in the gravity-flow method and cavitron method of measuring kh, respectively.
CONCLUSION
In conclusion, the model predicts that the bubble pressure in recently cavitated vessels affects how much kh changes with Tc in a cavitron. Lv and vessel diameter have little impact on the shape of hydraulic recovery curves (Figs. 5 and 6). The kh increased due to the collapse of air bubbles in stems when the central T decreased, and the bubble pressure could be estimated by our model with an error of less than 3%. It is also worth noting that bubble collapse will not affect very much the value of P50 measured by Sperry’s technique. This follows because bubble collapse influences most the y axis value of a vulnerability curve (PLC), but near P50 the curve is quite steep, so a large change in PLC results in a small change of the x axis value (T or negative pressure).
These models provide new insight into the tempo of bubble pressure and bubble formation in recently cavitated stems (i.e. that there should be a rapid rise in Pb* within 1 min of cavitation followed by a much slower rise after 1 d). The next article of this series (Y. Wang, J. Liu, and M.T. Tyree, unpublished data) will more fully address the time needed for bubble pressure to rise in the slow phase of the equilibration with air external to the stem.
MATERIALS AND METHODS
Branches (more than 1 m long) of a hybrid Populus 84K (Populus alba × Populus glandulosa) and Acer mono were sampled from and near the Northwest A&F University campus, and segments were excised while immersed in water. Segments with basal diameter of 5.5 to 7.5 mm were trimmed to 27.4 cm in length under water. The segments were flushed with 10 mm KCl for 30 min under pressure of 200 kPa (300 kPa absolute pressure). The liquid we used to flush the stem was filtered by a 0.02-µm filter and degassed under 40 kPa (absolute pressure) with a vacuum pump. Approximately 50% PLC was rapidly induced in a Cochard cavitron by spinning to a T of 2.2 MPa for Populus 84K and 4.2 MPa for A. mono. Then the central T was decreased to yield an absolute pressure higher than a perfect vacuum for at least 30 min (typically at 0.057 MPa in centrifuge T at the axis of rotation) to make sure that equilibrium was attained (i.e. that the period of water absorption had ceased). The kh of the segments was measured from the low to high T values shown in Table II. Each T was held for 3 to 10 min until the stems were equilibrated (stable kh measured). An improved regression method was used to calculate kh to obtain a 4 to 5 times higher precision (Wang et al., 2014b). Preliminary experiments were done to determine how long T had to be held constant to get stable kh values. These results indicated that 30 min was enough at 0.045 MPa and 3 to 10 min was enough for T values greater than 0.1 MPa.
Table II. The rpm and Tc in the cavitron we used.
The maximum rpm used for Populus 84K was 5,000, and that for A. mono was 7,000.
Python(x,y) 2.7.5 was used to program the model, and the data acquired for kh versus Tc was used to fit the model to estimate the average pressure of air bubbles in the stem by the least squares package in Python. The code for the model can be found in Supplemental Appendix S3.
Vessel Parameters
Lv was measured by the air-injection method described by Cohen et al. (2003) and Wang et al. (2014a). Briefly, long shoots were cut with a sharp razor blade and injected with compressed air at ΔP = 100 kPa (200 kPa absolute pressure) from the distal end; air was collected from the basal end immersed in water. Stem segments (20 cm long) were sequentially excised until bubbles were observed emerging from the distal end, and the flow rate of air bubbles (Q = ΔV/ΔT) was measured by water displacement. The stem was progressively shortened, and Q was measured at each length as above. The air conductance of cut-open vessels, C, was calculated from:
 |
as described by Cohen et al. (2003) and fitted into C = C0 × e−kx, where C0 is the maximum conductance as x approaches 0, k is an extinction coefficient, and x is the length of the stem. The k values were computed from the slope the curve of ln(C) versus x; and according to the theory of Cohen et al (2003), the most common Lv, Lmode, equals k−1 and mean Lv is calculated by Lmean = 2Lmode. Six stems were measured to calculate to average Lv of A. mono and Populus 84K.
Vessel diameters were measured on 25-μm-thick sections that were stained and photographed using a microscope (Leica DM4000B). Image-analysis software (Win CELL 2012; Regent Instruments Canada) was used to measure the diameter of hundreds of vessels, and arithmetic means were used to calculate capillary pressure by Equation 3a. Diameters were calculated from vessel area assuming circular geometry. The sum of vessel areas divided by wood area containing the vessels yielded values relative to the vessel fraction in both species.
Supplemental Data
The following supplemental materials are available.
Supplemental Figure S1. A model of cylindrical diffusion.
Supplemental Figure S2. The equilibrium time of cylindrical diffusion.
Supplemental Figure S3. Pressure equilibration in a vessel.
Supplemental Figure S4. The model of a stem in a cavitron.
Supplemental Appendix S1. Rapid equilibration of cylindrical diffusion.
Supplemental Appendix S2. A hydraulic recovery model.
Supplemental Appendix S3. The python code of a hydraulic recovery model.
Supplementary Material
Acknowledgments
We thank Feng Feng for help in collecting samples and maintaining the flushing apparatus.
Glossary
- VC
vulnerability curve
- kh
hydraulic conductivity
- T
tension
- Pb*
bubble pressure
- PLC
percentage loss of conductivity
- kh,s
single-vessel conductivity
- Pb
absolute bubble pressure
- Pw
absolute water pressure
- Tc
tension at the center of rotation
- ε
fraction of embolized vessels
- Lv
vessel length
- Lb
bubble length
- PC
capillary pressure
- PG*
partial pressure of nitrogen or oxygen in the atmosphere
Footnotes
This work was supported by a 5-year 1,000-talents research grant (to M.T.T.).
References
- Brodersen CR, McElrone AJ, Choat B, Lee EF, Shackel KA, Matthews MA (2013) In vivo visualizations of drought-induced embolism spread in Vitis vinifera. Plant Physiol 161: 1820–1829 [DOI] [PMC free article] [PubMed] [Google Scholar]
- Cai J, Hacke U, Zhang S, Tyree MT (2010) What happens when stems are embolized in a centrifuge? Testing the cavitron theory. Physiol Plant 140: 311–320 [DOI] [PubMed] [Google Scholar]
- Cochard H. (2002) A technique for measuring xylem hydraulic conductance under high negative pressures. Plant Cell Environ 25: 815–819 [Google Scholar]
- Cochard H, Badel E, Herbette S, Delzon S, Choat B, Jansen S (2013) Methods for measuring plant vulnerability to cavitation: a critical review. J Exp Bot 64: 4779–4791 [DOI] [PubMed] [Google Scholar]
- Cohen S, Bennink J, Tyree M (2003) Air method measurements of apple vessel length distributions with improved apparatus and theory. J Exp Bot 54: 1889–1897 [DOI] [PubMed] [Google Scholar]
- Evert RF. (2006) Esau’s Plant Anatomy: Meristems, Cells, and Tissues of the Plant Body: Their Structure, Function, and Development, Ed 3 John Wiley & Sons, New York [Google Scholar]
- Hacke UG, Sperry JS, Pittermann J (2000) Drought experience and cavitation resistance in six shrubs from the Great Basin, Utah. Basic Appl Ecol 1: 31–41 [Google Scholar]
- Hacke UG, Sperry JS, Wheeler JK, Castro L (2006) Scaling of angiosperm xylem structure with safety and efficiency. Tree Physiol 26: 689–701 [DOI] [PubMed] [Google Scholar]
- Hacke UG, Venturas MD, MacKinnon ED, Jacobsen AL, Sperry JS, Pratt RB (2015) The standard centrifuge method accurately measures vulnerability curves of long-vesselled olive stems. New Phytol 205: 116–127 [DOI] [PubMed] [Google Scholar]
- Li Y, Sperry JS, Taneda H, Bush SE, Hacke UG (2008) Evaluation of centrifugal methods for measuring xylem cavitation in conifers, diffuse- and ring-porous angiosperms. New Phytol 177: 558–568 [DOI] [PubMed] [Google Scholar]
- Sperry JS, Saliendra NZ, Pockman WT, Cochard H, Cruiziat P, Davis SD, Ewers FW, Tyree MT (1996) New evidence for large negative xylem pressures and their measurement by the pressure chamber method. Plant Cell Environ 19: 427–436 [Google Scholar]
- Sperry JS, Tyree MT (1988) Mechanism of water stress-induced xylem embolism. Plant Physiol 88: 581–587 [DOI] [PMC free article] [PubMed] [Google Scholar]
- Torres-Ruiz JM, Sperry JS, Fernández JE (2012) Improving xylem hydraulic conductivity measurements by correcting the error caused by passive water uptake. Physiol Plant 146: 129–135 [DOI] [PubMed] [Google Scholar]
- Tyree MT, Yang S (1992) Hydraulic conductivity recovery versus water pressure in xylem of Acer saccharum. Plant Physiol 100: 669–676 [DOI] [PMC free article] [PubMed] [Google Scholar]
- Wang R, Zhang L, Zhang S, Cai J, Tyree MT (2014a) Water relations of Robinia pseudoacacia L.: do vessels cavitate and refill diurnally or are R-shaped curves invalid in Robinia? Plant Cell Environ 37: 2667–2678 [DOI] [PubMed] [Google Scholar]
- Wang Y, Burlett R, Feng F, Tyree M (2014b) Improved precision of hydraulic conductance measurements using a Cochard rotor in two different centrifuges. Journal of Plant Hydraulics 1: e-0007 [Google Scholar]
- Wheeler JK, Sperry JS, Hacke UG, Hoang N (2005) Inter-vessel pitting and cavitation in woody Rosaceae and other vesselled plants: a basis for a safety versus efficiency trade-off in xylem transport. Plant Cell Environ 28: 800–812 [Google Scholar]
- Yang S, Tyree MT (1992) A theoretical model of hydraulic conductivity recovery from embolism with comparison to experimental data on Acer saccharum. Plant Cell Environ 15: 633–643 [Google Scholar]
- Zwieniecki MA, Holbrook NM (2000) Bordered pit structure and vessel wall surface properties: implications for embolism repair. Plant Physiol 123: 1015–1020 [DOI] [PMC free article] [PubMed] [Google Scholar]
Associated Data
This section collects any data citations, data availability statements, or supplementary materials included in this article.


