

Abstract
Cell-type specific gene silencing by histone H3 lysine 27 and lysine 9 methyltransferase complexes PRC2 and G9A-GLP is crucial both during development and to maintain cell identity. Although studying their interaction partners has yielded valuable insight into their functions, how these factors are regulated on a network level remains incompletely understood. Here, we present a new approach that combines quantitative interaction proteomics with global chromatin profiling to functionally characterize repressive chromatin modifying protein complexes in embryonic stem cells. We define binding stoichiometries of 9 new and 12 known interaction partners of PRC2 and 10 known and 29 new interaction partners of G9A-GLP, respectively. We demonstrate that PRC2 and G9A-GLP interact physically and share several interaction partners, including the zinc finger proteins ZNF518A and ZNF518B. Using global chromatin profiling by targeted mass spectrometry, we discover that even sub-stoichiometric binding partners such as ZNF518B can positively regulate global H3K9me2 levels. Biochemical analysis reveals that ZNF518B directly interacts with EZH2 and G9A. Our systematic analysis suggests that ZNF518B may mediate the structural association between PRC2 and G9A-GLP histone methyltransferases and additionally regulates the activity of G9A-GLP.
Multicellular organisms consist of a plethora of divergent cell types of vastly different appearance and function, even though the cells share a common genome. To achieve phenotypic variety, genes whose expression would interfere with the physiology of particular cell types must be epigenetically silenced. Chromatin modifying complexes play a major role in this epigenetic regulation. Two histone methyltransferase complexes of particular importance in early mammalian development are Polycomb repressive complex 2 (PRC2)1 and histone-lysine N-methyltransferase EHMT2 (G9A)-histone-lysine N-methyltransferase EHMT1 (GLP), which together promote cell type specific gene silencing by adding repressive posttranslational modifications to histone tails at promoters of target genes (1). PRC2 contains one of two alternative methyltransferase subunits, EZH2 or EZH1. In addition, PRC2 comprises EED and SUZ12, which regulate the RNA-binding and methyltransferase activities of EZH2, as well as one of two histone binding proteins, RBBP4 or RBBP7 (2). PRC2 catalyzes trimethylation of lysine 27 on histone H3 (H3K27me3), a repressive histone mark found on facultative heterochromatin. On the other hand, the G9A-GLP complex dimethylates H3 at lysine 9 (H3K9me2) and works together with the widely interspersed zinc finger protein WIZ. The H3K9me2 mark is, in turn, recognized by various heterochromatin proteins, which help promote formation of a compact, inactive chromatin state (3). The essential nature of PRC2 and G9A-GLP in mouse development has been illustrated by deletions of subunits, which result in severe growth defects and embryonic lethality (4–7). Furthermore, proper expression levels of each are important for maintaining cellular homeostasis, as under- and overexpression of PRC2 and G9A-GLP components are associated with various cancer types and a poor prognosis (8–10).
Despite their importance, how PRC2 and G9A-GLP protein complexes are regulated or targeted to chromatin is not fully understood (11). Drosophila PRC2 binds to well-characterized Polycomb response elements (PREs), but attempts to identify a corresponding consensus DNA sequence in mammals have been unsuccessful. PRC2 does exhibit a preference toward unmethylated CpG islands, and PRC2-recruiting genomic regions have been identified. However, these findings cannot account for the majority of PRC2 binding sites in the mammalian genome (1). Studying PRC2 interaction partners has yielded valuable insight into PRC2 targeting mechanisms. Roles in PRC2 targeting to chromatin have been established for long non-coding RNAs, notably RepA/Xist, HOTAIR, Kcnq1ot1 and Meg3 (12, 13). Several protein interactors have also been shown to target PRC2, including JARID2, the Polycomb-like proteins PHF1/PCL1, MTF2/PCL2, PHF19/PCL3, the zinc finger containing protein AEBP2, as well as the germline factor PRDM14 (14–24). Furthermore, esPRC2p48, an ESC-specific PRC2 subunit, facilitates reprogramming into the pluripotent state (20).
The G9A-GLP-WIZ complex is also known to have a variety of interaction partners. For example, corepressor UHRF1 targets G9A to the promoter of the cell cycle regulator p21 in mESCs (25). G9A has also been linked to the CtBP corepressor machinery (26). G9A may interact with the H3K9 methylation binding proteins CDYL, CBX3, and CBX5 (27–29). Furthermore, G9A binds several zinc-finger proteins (ZNF), including ZNF200, ZNF217, and EVII, which could in principle help recruit G9A complexes to specific genomic sites, though evidence for a role in targeting is currently lacking (30–32). G9A itself promotes DNA methylation by binding the de novo DNA methyltransferases (DNMT) DNMT3A and DNMT3B (33), and cooperates with the maintenance DNA methyltransferase DNMT1 at replication foci (34). Intriguingly, one recent study showed that the G9A-complex and PRC2 structurally and functionally interact (35), opening up the possibility of direct interactions between two of the most important histone methyltransferase complexes for facultative heterochromatin.
These studies illustrate how identification of interaction partner networks can shed light on gene regulatory pathways. Here, we search for new interaction partners using quantitative, stable isotope labeling of amino acids in cell culture (SILAC)-based affinity proteomics, which is currently regarded as one method of choice for discovery of interaction partners and determination of stoichiometries (36, 37), and which has thus far never been used to study PRC2 or G9A interactomes. In the SILAC approach, whole proteomes are metabolically labeled with amino acids synthesized from different non-radioactive isotopes (38), allowing the reliable estimation of relative protein ratios by analysis of up to three samples in the same mass spectrometer run (39–41). Similarly, in a recently developed technique called global chromatin profiling (42), peptides containing amino acids labeled with stable isotopes are used as standards to determine the abundance of various histone tail modifications in bulk chromatin. Employing SILAC affinity proteomics in combination with global chromatin profiling, we present complex protein interactomes of PRC2 and G9A-GLP, map interaction hubs, and report a novel zinc-finger interaction partner that regulates the function of G9A.
EXPERIMENTAL PROCEDURES
Cell Culture and SILAC Labeling
Ezh2, Ezh1 and Suz12 cDNAs were cloned into pEF1α FLAGbio-puro and stably expressed in mESCs (FLAGbio-EZH2 in Ezh2−/− (43), FLAGbio-EZH1 and -SUZ12 in J1) also expressing BirA from pEF1α BirAV5-neo. G9a cDNA was cloned into pBD101 (kindly provided by B. C. Del Rosario) and stably expressed in F1–2.1 female ES cells carrying rtTA (a gift from R. Jaenisch) (44). Cells were grown on a layer of irradiated DR4 mouse embryonic fibroblasts under selective pressure of 400 μg/ml neomycin, 1 μg/ml puromycin and/or 200 μg/ml hygromycin where applicable and split every second day. For the last three passages before harvesting, mESCs were grown in Dulbecco's Modified Eagle's Medium devoid of arginine and lysine (Invitrogen, Grand Island, NY), supplemented with 15% fetal bovine serum (Gibco, Grand Island, NY) dialyzed with a cut-off of 10 kDa, 15 mm Hepes pH 7.6, 45 mm NaHCO3, glucose to a final concentration of 4.5 mg/ml, 0.1 mm non-essential amino acids (Gibco), 2 mm Glutamine (Gibco), 100 units/ml penicillin/streptomycin (Gibco), 50 μm β-mercaptoethanol (Gibco), 1000 units/ml leukemia inhibitory factor (Millipore, Billerica, MA) and 30 g/l methionine, 42g/l arginine and 73g/l lysine (Cambridge Isotope Laboratories, Tewksbury, MA). The latter two were added either in light (Arg0/Lys0), medium (13C6 arginine (Arg6)/D4 lysine (Lys4)) or heavy (13C6-15N4 arginine (Arg10)/13C6-15N2 lysine (Lys8)) form. G9A-3xFLAG expression was induced with 1 μg/ml doxycycline for 24 h before harvesting.
Immunoprecipitation
Per condition, 2 × 15 cm plates were grown to 80% confluency, washed once with and scraped in 20 ml ice cold PBS (8.1 mm Na2HPO4, 1.45 mm KH2PO4, 137 mm NaCl, 2.7 mm KCL, pH 7.4). Pelleted cells were incubated in 10 ml buffer A (10 mm Hepes pH 7.5, 10 mm KCl, 1.5 mm MgCl2, 0.5 mm PMSF) for 15 min with frequent vortexing. Nuclei were pelleted (10 min, 2500 g), lysed in 500 μl RIPA buffer (50 mm TrisCl pH 7.5, 150 mm NaCl, 0.5% Na-deoxycholate, 0.5% IGPAL-CA-630 (Sigma-Aldrich, St. Louis, MO), 0.1% SDS, 5% glycerol, complete proteinase inhibitors (Roche, Indianapolis, IN)) and debris was removed by centrifugation (10 min, 16,000 g). Protein content of supernatants was determined with the Pierce© BCA protein assay. 60 μl Dynabeads MyOne streptavidin C1 (Invitrogen) or M2 FLAG agarose beads (Sigma-Aldrich), equilibrated in RIPA buffer, were added to 2 mg of supernatant and samples were rotated for 1 h at 4 °C. Beads were captured on a magnetic rack or collected by centrifugation (3 min, 2.5 rpm), washed once with 1 ml wash buffer (50 mm TrisCl pH 7.5, 150 mm NaCl, 5% glycerol, complete proteinase inhibitors (Roche)) + 0.05% IGPAL-CA-630, resuspended in 1 ml wash buffer + 1 mm MgCl2, + 0.1 mm CaCl2, + 20 units Turbo DNase (Ambion, Grand Island, NY), incubated at 25 °C for 20 min and washed once more with 1 ml wash buffer. Beads incubated with light, medium and heavy labeled lysates were combined in 80 μl of freshly prepared trypsin-urea buffer (2 m urea, 50 mm TrisCl pH 7.5, 1 mm DTT, 5 μg/ml sequencing grade trypsin (Promega, Madison, WI)) and incubated for 1 h at 25 °C with 1000 rpm. The supernatant was collected and the beads were washed twice with 2 m urea, 50 mm TrisCl pH 7.5. Elution and washes were combined and reduced by adding 4 mm DTT (30 min, 25 °C, 1000 rpm). Proteins were alkylated with 10 mm iodoacetamide (Sigma-Aldrich) (45 min, 25 °C, 1000 rpm) protected from light, digested overnight at 25 °C with 0.5 μg trypsin and acidified with formic acid (1% final concentration). Samples were applied on C18 StageTips (45) that had been conditioned with 100 μl 90% acetonitrile/0.1% formic acid and equilibrated twice with 100 μl 0.1% formic acid (3 min, 4000 g). StageTips were washed twice with 100 μl 0.1% formic acid and peptides were eluted with 60 μl 90% acetonitrile/0.1% formic acid and dried in a speed vac.
Affinity Proteomics Mass Spectrometry (APMS) Analysis
APMS peptide samples were reconstituted in 9 μl of solvent A (3% acetonitrile/0.1% formic acid) and 4 μl were analyzed on an EASY-nLC 1000 UHPLC system (Thermo Fisher Scientific, Waltham, MA) coupled via a 20 cm C18 column (Picofrit, New Objective, Woburn, MA, PF360–75-10-N-5; packed in-house with 1.9 μm ReproSil-Pur C18-AQ medium, Dr. Maisch GmbH, r119.aq) to a benchtop Orbitrap Q Exactive mass spectrometer (Thermo Fisher Scientific) as described (46). Peptides were separated at a flow rate of 200 nL/min with a linear 84 min gradient from 6 to 30% solvent B (90% acetonitrile, 0.1% formic acid), followed by a linear 9 min gradient from 30 to 60% solvent B. Each sample was run for 150 min, including sample loading and column equilibration times. Data was acquired in data dependent mode using Xcalibur 2.2 software. MS1 Spectra were measured with a resolution of 70,000, an AGC target of 3e6 and a mass range from 300 to 1800 m/z. Up to 12 MS2 spectra per duty cycle were triggered at a resolution of 17,500, an AGC target of 5e4, an isolation window of 2.5 m/z and a normalized collision energy of 25.
All raw data were analyzed with MaxQuant software version 1.3.0.5 (47) using a mouse UniProt Mouse database (release 2013_12; containing 51,195 entries), and MS/MS searches were performed with the following parameters: Oxidation of methionine, deamidation of asparagine and protein N-terminal acetylation as variable modifications; carbamidomethylation as fixed modification; Trypsin/P as the digestion enzyme; precursor ion mass tolerances of 20 p.p.m. for the first search (used for nonlinear mass re-calibration) and 6 p.p.m. for the main search, and a fragment ion mass tolerance of 20 p.p.m. For identification, we applied a maximum FDR of 1% separately on protein and peptide level. We required 2 or more unique/razor peptides for protein identification and a ratio count of 2 or more for protein quantification per biological replicate measurement. To determine relative enrichment of proteins in bait versus control samples, SILAC protein ratios were calculated as the median of all unique/razor peptides for each protein group. To identify significant interactors we filtered for proteins that were quantified in at least 2 or more biological replicates and calculated moderated t test p values corrected by the Benjamini Hochberg method, as described previously (48). To determine stoichiometries of interactors relative to the bait protein we used an approach adapted from (49). iBAQ intensities were calculated using MaxQuant by summing the intensities of all tryptic peptides for each protein and dividing this number by the number of theoretically observable peptides. Within each SILAC triple labeling experiment, iBAQ intensities of enriched proteins in the medium and heavy channels were corrected for background binding intensities in the light SILAC control channel by subtracting the light channel iBAQ intensities from the medium and heavy channel iBAQ intensities, respectively. Intensities of peptides assigned to different isoforms were combined. To obtain molar ratios of interactors to bait proteins, corrected interactor iBAQ intensities were divided by bait iBAQ intensities in each SILAC experiment. For biological interpretation we required that protein stoichiometries were calculated independently in n-1 replicates.
The raw mass spectrometry data have been deposited in the public proteomics repository MassIVE and are accessible at ftp://MSV000078980@massive.ucsd.edu when providing the username “MSV000078980” and password “ZNF518B” (http://massive.ucsd.edu).
shRNA Knock-down Experiments
Lentiviral shRNAs were obtained from The RNAi Consortium (50) (supplemental Table S3). J1 mESCs were infected as described previously (51) with the following modifications: J1 cells were plated onto gelatinized 24 well plates at 100,000 cells per well in 400 μl mESC media containing 8 μg/ml polybrene. 20 μl lentiviral shRNA stock (titer ≥0.5*108/20 μl) were added and plates were centrifuged for 30 min, 2,400 g, 25 °C. Cells were resuspended by pipetting and ∼25,000 irradiated DR4 MEFs were added per well. 24 h and 3 days after infection, media was replaced with media containing 1 μg/ml puromycin. Cells were split into 6-well plates and 96-well plates 4 days after infection. 6 days after infection, cells in 6-well plates were scraped in ice cold PBS, pelleted and frozen in liquid nitrogen. RNA was extracted from 96-well plates with Trizol (Invitrogen) and treated with TURBO DNase (Ambion). Knock-down efficiencies were determined by qPCR from total extracted RNA. First strand cDNA synthesis was performed from 5 μg RNA using Superscript III (Invitrogen) and 50 ng/μl random hexamers (Promega) in a total volume of 20 μl according to the manufacturer's instructions. Gene-specific primer sequences were obtained from The RNAi Consortium or designed using Primer BLAST(52) (supplemental Table S3). qPCR was performed in triplicates using 2 μl of each cDNA synthesis reaction per replicate, 12.5 pmol gene-specific primers and 2x SYBRgreen master mix (Bio-Rad, Hercules, CA) in 25 μl reactions in a Bio-Rad qPCR machine. Standard curves using RNA from control treated cells served to determine the amplification efficiency of each primer pair. Expression levels were compared with expression in control cells and normalized by Gapdh.
Global Chromatin Profiling
Cell pellets were lysed, histones were extracted and 50 μg of histones per sample were derivatized as described (42). Peptides were resuspended in 50 μl 3% ACN/5% FA solvent and diluted 1:20 with a defined mixture of synthetic modified H3 peptides isotopically labeled with 13C6, 15N4 arginine in 50 μl 3% ACN/5% FA. Targeted LCMS and data analysis in a Skyline (53) document—using spectra of synthetic peptides from preliminary experiments as a reference—and clustering in GENE-E were performed as reported previously (42). Percent occupancy of H3 marks was calculated using the known concentrations of the synthetic peptides in the defined mixture.
In Vitro Interaction Studies
Ezh2, Ezh1, Suz12, G9a, GLP, Wiz, Znf518a, Znf518b, and Wdr5 cDNAs were cloned into pET30 or pET28 (T7-tag), and expressed using the TnT® Coupled Reticulocyte Lysate System (Promega) according to the manufacturer's instructions and with Easytag [35S]-Methionine (Perkin-Elmer, Waltham, MA) if radioactive labeling was desired. To remove nucleic acids, 20 μg RNase A (Invitrogen), 100 units RNase I (Ambion) and 2 units TURBO DNase (Ambion) were added after translation and reactions were incubated for an additional 5 min at 30 °C. Reaction products were analyzed by SDS-PAGE and relative protein amounts were determined with Quantity One software (Bio-Rad) taking the number of methionines in each protein into account. Immunoprecipitations were performed as described (54). Briefly, reactions containing the T7-tagged bait or empty pET28 vector were mixed with the radioactively labeled putative interactor at equimolar amounts and incubated for 30 min at 30 °C. Immunoprecipitation buffer (50 mm Tris-Cl, pH 7.5, 10 mm MgCl2, 100 mm NaCl, 1 mm EDTA, 10% glycerol, 1 mm DTT, and proteinase inhibitors (Roche)) was added to 90 μl. Complexes were immunoprecipitated at 4 °C for 2 h with 10 μl ProtG Dynabeads (Invitrogen) which had been preincubated with 0.5 μl anti-T7 antibody, 0.1 mg/ml BSA (NEB, Ipswich, MA) and 0.1 mg/ml yeast tRNA (Ambion) for at least 1 h, and had subsequently been washed 3× and resuspended in immunoprecipitation buffer. Following immunoprecipitation, beads were washed four times with immunoprecipitation buffer containing 300 mm NaCl and twice with 10 mm TrisOAc pH 7.5, 1 mm MgCl2, 10% glycerol, 1 mm DTT. Proteins were separated by 10% SDS-PAGE and visualized by exposure of the dried gel to a phosphoimager screen.
RESULTS AND DISCUSSION
SILAC Affinity Proteomics Identifies Novel PRC2 Interaction Partners
To define the PRC2 interactome in mouse embryonic stem cells (mESC) using SILAC affinity purification mass spectrometry (APMS), we prepared nuclear extracts of various mESC lines stably expressing in vivo biotin-tagged EZH2, EZH1 or SUZ12, taking advantage of an in vivo biotinylation system described previously (43). This system required two expression vectors, one carrying the bacterial biotinylase BirA, and the other carrying the gene of interest with a short BirA recognition peptide tag. Cells expressing biotin-tagged EZH2, EZH1 or SUZ12 at physiological or subphysiological levels (supplemental Fig. 1) were cultured in medium (Arg6/Lys4) or heavy (Arg10/Lys8) SILAC media, whereas control cells expressing only BirA were cultured in light media (Arg0/Lys0). Extracts were subjected to affinity purifications with streptavidin-coated magnetic beads. To preclude isolation of proteins bound indirectly to PRC2 via chromatin fragments, we treated the beads with DNase after the first wash step. We then combined beads from all three samples, isolated bound peptides by tryptic digestion, and subjected the samples to high performance LC-MS/MS (Fig. 1A). In total, we analyzed five biological replicates for EZH2 and EZH1 and four for SUZ12, constituting a total of 14 experiments (supplemental Fig. 2). To determine interaction partners of these bait proteins that are reproducibly and significantly enriched, we then plotted the average detected protein ratios against the Benjamini-Hochberg-adjusted moderated t test p value. Proteins with a fold-enrichment value of ≥2.0 in the test samples relative to controls and with an FDR-adjusted p value ≤0.05 were called interaction partners (Fig. 1B–1D, upper panels and supplemental Table S1).
Fig. 1.

SILAC affinity purification mass spectrometry establishes the G9A complex and zinc finger proteins ZNF518A and ZNF518B as novel EZH2 interactors in mouse embryonic stem cells. A, SILAC labeling strategy and experimental overview. B, C, and D, Volcano plots of LC-MS/MS data of streptavidin affinity purifications with biotin-tagged EZH2, EZH1 and SUZ12, respectively. Relative protein abundance levels in the bait versus control pull-downs are plotted on the x axis as averaged log2 SILAC ratios across n biological replicates. Negative log10 transformed Benjamini-Hochberg FDR-corrected moderated t test p values are plotted on the y axis. Significantly enriched proteins (p < 0.05; >2-fold linear SILAC ratio) are represented by red dots, all others by black dots. Dotted lines indicate 2-fold regulation (x axis) and a moderated t test p value of 0.05. Calculated stoichiometries of identified interaction partners relative to the respective bait in purified complexes are displayed below. Abundance levels of enriched proteins are determined by calculating iBAQ intensities, which are the sum of intensities of all tryptic peptides for each protein divided by the number of theoretically observable peptides, corrected for background binding by subtracting intensities derived from control pull-downs. Relative stoichiometries are calculated by scaling the abundance levels of interaction partners by the abundance of the bait protein. Note that relative stoichiometries are plotted in log10. Error bars indicate the standard deviation of independently calculated relative stoichiometries across n replicates.
Significantly enriched in all three affinity purifications (EZH1, EZH2, SUZ12) were the known PRC2 core components (EZH2/1, SUZ12, EED, and RBBP4/7)—as well as most known interaction partners in mESCs—JARID2, MTF2, AEBP2, and esPRC2p48. Furthermore, the uncharacterized protein GM340, which has been shown to interact with PRC2 component EED in HeLa cells (49), also bound to EZH2 and EZH1 in mESCs. Similarly, DNA methyltransferase DNMT3b, a known PRC2 interaction partner in HeLa cells (55), was enriched in our SUZ12 affinity purifications. The recovery of this full suite of known protein interaction partners demonstrated the validity of our experimental approach.
Functional interplay between PRC2 and the G9A-complex had been suspected previously, and physical binding has been reported recently (35), though much remains unknown about the mechanisms and purpose of the interaction. The identification of C10orf12 as a common interaction partner of PRC2 and G9A-GLP (56) also hinted at a connection between them, but because the interaction was detected in crosslinked cells, indirect interactions via chromatin could not be excluded. By our orthogonal SILAC approach, we also detected highly reproducible interactions with all documented core members of the G9A-complex, G9A, GLP, and WIZ. Furthermore, EZH2 interacted with two variants of histone H1, a hallmark of condensed chromatin, which is known to bind EZH2 and stimulate its enzymatic activity (57, 58).
In addition to the known interacting proteins, our method revealed several novel interaction partners. In the EZH2 affinity purifications, we identified the heterochromatin proteins CBX3 (HP1γ) and CBX5 (HP1α), both of which recognize H3K9 methylation marks and bind G9A (28, 29). In EZH1 purifications, CBX3 was also detected reproducibly. Finally, we identified two zinc finger proteins of unknown function, ZNF518A and ZNF518B, which are expressed in a variety of mouse and human tissues (59). These proteins were consistently enriched in EZH2 affinity purifications (Fig. 1B), and were also found in the EZH1 purifications, albeit not consistently enough to comply with our p value requirement (Fig. 1C). In the SUZ12 purifications, ZNF518A and ZNF518B did not turn up (Fig. 1D). These findings suggest that ZNF518A and ZNF518B may interact more closely with EZH2 than SUZ12.
Analysis of Stoichiometries for the PRC2 Interactome
Information regarding relative ratios of PRC2 subunits and interacting factors is of high relevance and interest, as it is predicted that PRC2 may interact with different complexes in different contexts and would therefore show substoichiometric proteomic associations. This might be especially true for some of these novel interactions identified in our screen, if these candidates function with PRC2 in a restricted developmental or genomic context. Therefore, we determined the relative stoichiometries of proteins in the PRC2 interactome with respect to the baits, using a surrogate of protein abundance derived from the observed MS intensities of the constituent peptides. This method, referred to as iBAQ, sums the observed intensities of all tryptic peptides for each protein and divides it by the number of theoretically observable peptides in order to normalize for differences in protein size (49, 60). iBAQ quantification is suitable to obtain standard deviations of less than 34% for relative protein stoichiometry measurements as recently shown for the well-characterized 26S proteasome protein complex (61). Because our goal in this study was to distinguish core components from substoichiometric binders, we deemed the precision of the iBAQ approach sufficient instead of using more accurate and precise targeted stable isotope dilution mass spectrometry assays (62) that are higher in costs and lower in throughput. A potential compromise of the iBAQ approach is that protein quantities tend to be underestimated for low abundance proteins (63), yet this should not affect our ability to classify substoichiometric binding partners that bind for example at greater than 10-fold bait/interaction partner ratios. Relative stoichiometry values for each protein in a complex were calculated by dividing the iBAQ values (obtained using the program Max Quant (47, 64) of co-enriched proteins by those of the bait proteins. We determined average stoichiometries of all identified interaction partners for which stoichiometry values could be obtained in at least n-1 replicates (Fig. 1B–1D lower panels; supplemental Tables S1 and S2). As expected of core subunits, SUZ12 bound to both EZH2 and EZH1 at a ratio of 1:1; RBBP4 bound to EZH2, EZH1, and SUZ12 at ratios between 1.4:1 and 2.1:1. Unexpectedly, EED was present at slightly substoichiometric amounts with respect to EZH2, EZH1 and SUZ12 (about 30%). The PRC2 complex core components EZH2/EED/Suz12/RBBP4 have been described to bind at a 1:1:1:1 ratio in complexes purified by size exclusion chromatography (65). Using EED as a bait protein, Smits et al. quantified a 1:1:1:0.6 stoichiometry for EZH2/EED/Suz12/RBBP4 by means of iBAQ quantification (49). Because the sequence coverage for EED was relatively high in our study at levels of 36% on average and the coefficient of variation for relative stoichiometries was in between 0.3 and 0.4 across all replicates, we assume that differences in subunit composition may occur because of complex dissociation during affinity purification or because of enrichment of not fully assembled protein complexes. The ratios of other known PRC2 interaction partners ranged from 5 to 40%. In contrast, ratios of previously unknown interaction partners ranged from 0.2% to 6.0%, providing a rationale why these interactions have thus far evaded detection. The only exception was mitochondrial protein, DBT, which was present at nearly 1:1 stoichiometry with EZH2 (Fig. 1B). The substoichiometric nature of many of the detected interactions means that they are either context-dependent or exhibit a high off-rate, resulting in poor recovery after affinity purification. G9A, GLP and WIZ bound to PRC2 components in very similar amounts, suggesting that the entire complex was bound and highlighting the accuracy of the method.
G9A Interactomics Also Reveal PRC2 and ZNF518A/B
We sought to validate the physical association between PRC2 and the G9A-complex by performing reciprocal anti-FLAG immunoprecipitations with SILAC-labeled nuclear extract prepared from mESCs stably expressing subendogenous levels of doxycycline-inducible G9A-3xFLAG supplemental Fig. 1. The same cell line carrying the empty expression vector served as a negative control and we performed a total of six SILAC experiments supplemental Fig. 2. In accordance with the PRC2 affinity purification results, PRC2 core components EZH2, EZH1, SUZ12, EED, and RBBP4, as well as known PRC2 interactors MTF2 and GM340, were all significantly enriched in the G9A-3xFLAG immunoprecipitations (Fig. 2A and supplemental Table S1). The SILAC mESC G9A interactome also contained documented G9A interactors DNA methyltransferase DNMT1, corepressors UHRF1 and CDYL, and heterochromatin proteins CBX3 and CBX5 (25, 27–29, 34), supporting the validity of our approach.
Fig. 2.

PRC2 and zinc finger proteins ZNF518A and ZNF518B interact with G9A. A, Volcano plot of LC-MS/MS data of anti-FLAG immunoprecipitations with G9A-3xFLAG in mouse embryonic stem cells. Significantly enriched proteins (p < 0.05; >twofold linear SILAC ratio) are represented by red dots, all others by black dots. B, Bar diagram showing calculated stoichiometries of G9A interaction partners relative to G9A.
In addition to known interactors, we identified many novel G9A-binding factors (Fig. 2A). Intriguingly, the two EZH2-binding zinc finger proteins ZNF518A and ZNF518B also bound to G9A. Also novel were additional readers of H3K9 methylation: CDYL's paralogue CDYL2, the heterochromatin protein CBX1, and the CBX5 interacting zinc finger protein POGZ (29). Other zinc finger proteins, ZNF462, ZNF568, and ZNF644, were also enriched in G9A-3xFLAG immunoprecipitations. Two of them, ZNF462 and ZNF644 had previously been shown to interact with CDYL. The transcriptional repressor MIER2, which we found to be associated with G9A, had also been reported to bind CDYL (27). Similarly, new G9A interactors CSNK2A1 and LCOR were already known to share binding partners with G9A, namely EVII and CtBPs, respectively (32, 66, 67). These and other novel G9A interaction partners indicate that G9A may be linked to diverse gene silencing pathways. Of note are CpG-binding protein MBD3 (68), Polycomb group protein MBTD1 (69), MTA1, which is a component of the repressive chromatin remodeling complex NuRD (70), and ATF7IP/MCAF1, which is thought to promote heterochromatin formation in concert with another H3K9 methyltransferase, SETDB1 (71). Because we included a DNase digestion step in the immunoprecipitation protocol, it is highly unlikely that the crosstalk with other silencing mechanisms occurred indirectly via DNA.
Stoichiometry analysis of G9A interaction partners (Fig. 2B and supplemental Table S1 and S2) showed that WIZ and GLP were present at ratios of 1.09 and 0.65, respectively, with respect to G9A. ZNF462 and CBX3 were bound at intermediate ratios (0.58 and 0.33). All other interactors were associated with less than 10% of G9A molecules. EZH2, SUZ12 and EED were detected at stoichiometries of 1–3%.
The PRC2-G9A Interaction Network is Highly Interconnected
To visualize the reciprocal and intertwined binding events of core histone methyltransferase complex components, we combined the data from all our APMS experiments with protein interaction data deposited in the STRING database (72) and visualized them using Cytoscape (73). We mapped the resulting PRC2-G9A interaction network with the baits being represented by big circles and interaction partners by smaller circles (Fig. 3). For simplicity, only factors with at least two interaction partners—either identified by us or documented in the STRING database—among the identified proteins are displayed. Stoichiometric G9A-complex core components G9A, GLP and WIZ bound to all tested PRC2 components. The same applies to CBX3, which bound to G9A at a molar ratio of ∼1:3. In contrast, ZNF462, which was associated with almost 60% of G9A molecules in our assay, was not detected in APMS experiments with PRC2 members. One interpretation of this finding might be that PRC2 and ZNF462 do not bind to the G9A-complex at the same time. However, PRC2 members and G9A not only share several binding partners (RBBP4, MTF2, GM340, CBX3, LCOR, ZNF518A, ZNF518B in addition to core complex components), but other G9A binding partners have also been previously found associated with PRC2 itself or its binding partners (55, 74, 75). Taken together with previously published data, our analysis indicates that PRC2 and G9A complexes are highly interconnected and are linked to similar additional gene silencing mechanisms.
Fig. 3.

Integrated PRC2-G9A interaction network analysis defines common interactors. Interactions of EZH2, EZH1, SUZ12, and G9A identified by SILAC affinity purification mass spectrometry (APMS) are displayed in the indicated colors. Bait proteins analyzed by APMS in this study are shown as large nodes. The topology of the core components in the network is defined by binding stoichiometries observed in this study and was manually curated to improve visibility. Experimentally verified interactions documented in the STRING protein interaction database are shown in gray. Only proteins with two or more interaction partners within this network are represented to show the most important binding partners.
ZNF518B is a Positive Regulator of G9A Function
The low stoichiometries of the newly identified interaction partners with respect to their baits raised the question of whether they are functionally important. To elucidate whether there are mechanistic interactions between the components of the mESC PRC2-G9A interactome, we employed global chromatin profiling, a state-of-the-art technique that measures the abundance of histone marks in bulk chromatin by high-resolution targeted mass spectrometry (42). Using lentiviral shRNAs, we individually knocked down 15 proteins of interest that were identified as central components in our PRC2-G9A interactome analysis: The core subunits of PRC2 (EZH2, EZH1, SUZ12, EED, RBBP4, RBBP7) and the G9A-complex (G9A, GLP, WIZ), previously identified mESC PRC2 interaction partners (JARID2, MTF2, AEBP2 and esPRC2p48), as well as the two zinc finger proteins, ZNF518A and ZNF518B, which interact with both complexes. Depending on the availability of shRNA constructs with documented knock-down properties, we infected mESCs with up to three different shRNA lentiviruses per gene of interest in separate experiments. Cells infected with the empty lentiviral vector or shRNA directed against RFP served as controls, which were infected in triplicates. Other samples were prepared in duplicates, with the exception of cells infected with shRNA directed against Glp, because only one such shRNA possessing any knock-down efficiency was available; those were therefore also infected in triplicates. We determined the knock-down efficiencies of individual shRNAs by gene-specific qPCR normalized against Gapdh mRNA (supplemental Figure 3). Subsequently, we measured the abundance of 42 histone H3 tail modification signatures in 91 individual samples by targeted high-resolution mass spectrometry using heavy isotope labeled peptide standards for every modification signature (supplemental Figure 4). First, we clustered the resulting global chromatin modification data by modifications to H3K27 and H3K36 to determine whether PRC2 interactors regulate H3K27 methylation levels (Fig. 4A; both residues fall on the same peptide during the analysis). This gave rise to two major clusters: Cluster 1 consisted of EZH2, SUZ12 and EED knock-down experiments, and was characterized by severe loss of H3K27me2 and H3K27me3 and a corresponding increase in H3K27me0 and H3K27ac, in agreement with PRC2-EZH2 being the major histone methyltransferase complex catalyzing H3K27me2/3 in mESCs. All other samples formed the second cluster, including samples treated with one of the three shRNAs against EED, which only possessed moderate knock-down efficiency. Depletion of EZH1 or any PRC2 interactor had no consistent negative effect on global H3K27me2/3, in agreement with the fact that EZH1 knock-out mice are viable and demonstrate no deficiency of H3K27me2/3 (76). Conversely, JARID2 depletion resulted in a moderate increase of bulk H3K27me2/3in vivo. This finding is in agreement with earlier reports (19, 21), though JARID2 is known to enhance PRC2's methyltransferase activity in in vitro biochemical assays (17, 77). In sum, these data support the idea that PRC2 is the sole H3K27me2/3 histone methyltransferase in mammalian cells.
Fig. 4.

ZNF518B is a positive regulator of H3K9me2. Global chromatin profiling by targeted high-resolution mass spectrometry was used to investigate changes in histone H3 tail modification signatures caused by individual shRNA-mediated knock-down of PRC2 components EZH2, EZH1, SUZ12, EED, RBBP4, and RBBP7, PRC2 interaction partners JARID2, MTF2, AEBP2, and esPRC2p48, G9A complex members G9A, GLP, and WIZ, and novel G9A and EZH2 interactors ZNF518A and ZNF518B. Empty vector and RFP knock-down served as negative controls. A, and B, Heatmaps showing changes in H3K27K36 and H3K9K14 modifications, respectively. Quantified modified histone peptides are displayed as rows and knock-down experiments as columns. Horizontal color bars indicate protein complex membership and residual gene expression on mRNA level after individual lentiviral based knock-down with up to 3 different shRNAs per target gene. Two major clusters are observed after hierarchical clustering of columns. C, Effect of shRNA-mediated knock-down on H3K9me2 levels, normalized to empty vector control. The effect size of reduced H3K9me2 correlates with the residual expression level of ZNF518B.
Clustering of the data by modifications on H3K9 and H3K14 also resulted in two major groupings (Fig. 4B). In line with the G9A-complex catalyzing H3K9me2, all three G9A-complex members clustered together, because their depletion resulted in loss of H3K9me2 and increase in H3K9me0 and H3K9ac. The loss in H3K9me2 was not as pronounced as H3K27me2/3 loss upon depletion of PRC2 components, most likely because a number of other H3K9 histone methyltransferases exist in mammalian cells, including SETDB1 and SUV39H1 (78), which may partially compensate. Remarkably, despite binding to G9A only at a ratio of ∼1:30 in the purified complex, knock-down of zinc finger protein ZNF518B led to a similar significant loss of H3K9me2 (Fig. 4C) and increase in H3K9me0 and H3K9ac. All three ZNF518B shRNAs therefore clustered with shRNAs targeting G9A-complex members. Moreover, the negative effect on H3K9me2 directly correlated with the knock-down efficiency of the shRNAs. These observations establish ZNF518B as a novel positive regulator of global H3K9me2.
To confirm that ZNF518B binds the G9A-complex and to investigate whether it also binds EZH2 as suggested by the mass spectrometry data, we performed in vitro immunoprecipitation experiments. In vitro translated 35S labeled G9A, GLP, WIZ, EZH2, EZH1, or SUZ12 were mixed with in vitro translated T7-tagged ZNF518B or translation reactions containing the empty expression vector, and were then immunoprecipitated with anti-T7 antibody bound to magnetic beads. 35S labeled WDR5, a member of the activating chromatin modifying MLL-complex, served as a negative control (Fig. 5A). Both G9A and WIZ bound strongly to ZNF518B, validating the affinity proteomics results. In the reciprocal immunoprecipitation, 35S labeled ZNF518B also bound to T7-tagged G9A. GLP bound to ZNF518B as well, but to a lesser extent. No deletion of a single domain abolished ZNF518B binding to G9A, hinting at redundancy of G9A interaction domains. Deletion of either the N- or the C terminus of ZNF518B resulted in loss of its binding to WIZ, possibly because both domains are required for this interaction and/or proper folding (Fig. 5B). Interestingly, we were able to recapitulate the mass spectrometry data in our immunoprecipitations with PRC2 components: EZH2 and EZH1, but not SUZ12 associated with ZNF518B in vitro, showing that no direct interaction exists between ZNF518B and SUZ12 (Fig. 5A). These results also indicate that ZNF518B might play a role in linking G9A to PRC2.
Fig. 5.
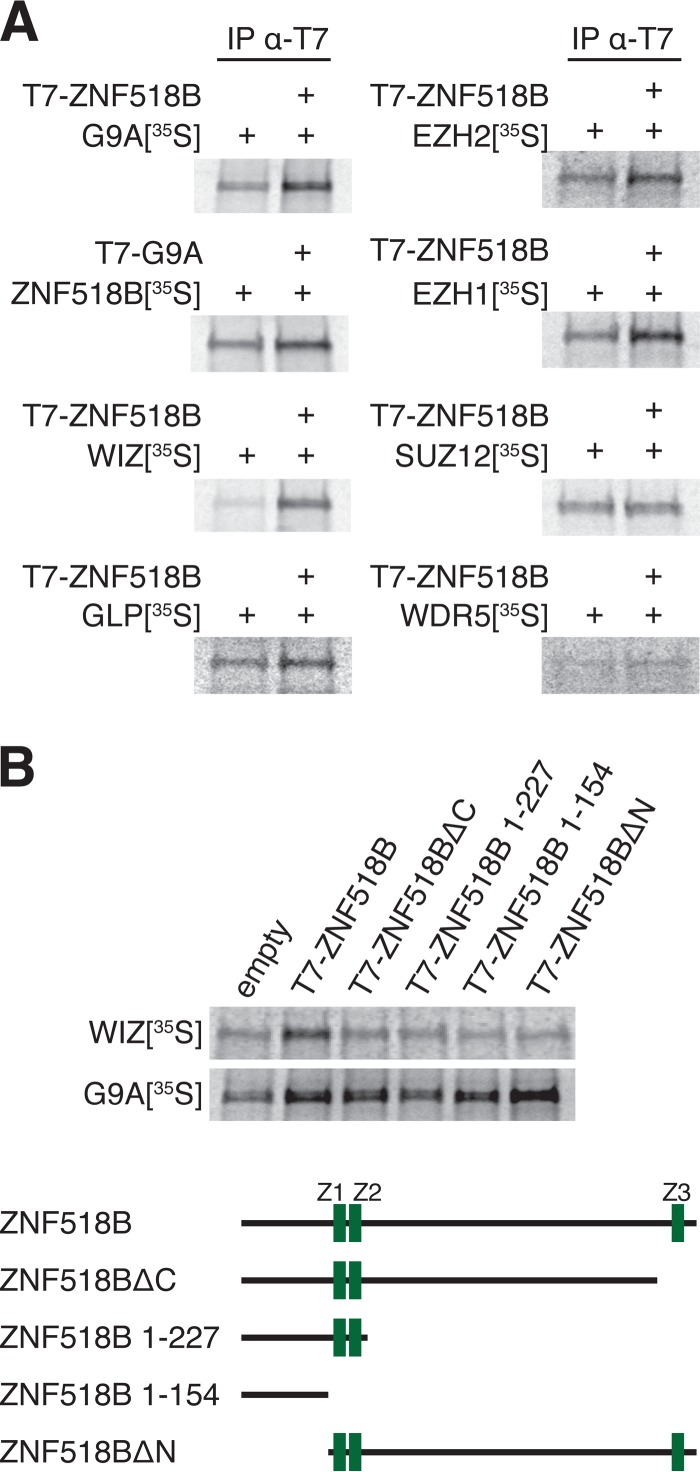
ZNF518B interacts with G9A complex members and EZH2/EZH1 in vitro. A, Autoradiography of anti-T7 immunoprecipitation experiments using in vitro translated T7-tagged ZNF518B or G9A and 35S-labeled G9A, ZNF518B, WIZ, GLP, EZH2, EZH1, SUZ12, or MLL complex component WDR5 as indicated. In vitro translation reactions containing empty pET28 expression vector were used in negative controls. B, Autoradiography of anti-T7 immunoprecipitation experiments using T7-tagged ZNF518B deletion mutants and 35S-labeled G9A or WIZ. Schematic representations of full-length ZNF518B and deletion mutants are shown below; zinc fingers (Z1-Z3) are represented in green.
CONCLUSIONS
In summary, we have performed quantitative high precision affinity proteomics mass spectrometry experiments with components of two major repressive histone methyltransferase complexes, PRC2 and the G9A-complex. We confirmed a physical interaction between those two complexes in mESCs and identified several new interaction partners of PRC2 and G9A, including two previously uncharacterized zinc finger proteins, ZNF518A and ZNF518B, which interact with both complexes. These newly discovered interactors bind PRC2 and G9A at substoichiometric ratios. We then performed an integrated network analysis to identify the central components of the two complexes. These interaction partners were individually depleted using shRNAs, and we investigated the resulting impact on 42 different histone modification signatures by global chromatin profiling. This combined approach of stoichiometric mapping of interaction partners and global monitoring of histone modifying enzyme activities confirmed well established chromatin repression mechanisms and revealed ZNF518B as a new strong positive regulator of G9A function. We also confirmed that ZNF518B interacts with the G9A-complex and the two alternative PRC2 methyltransferase subunits, EZH2 and EZH1, in vitro. The mechanism by which ZNF518B positively regulates H3K9me2 remains to be elucidated. Because it contains three zinc fingers and is therefore a candidate DNA binding protein, it is conceivable that it could help targeting G9A to its genomic loci. This hypothesis could be tested by mapping of ZNF518B binding sites by genome wide ChIP experiments and comparing them to known G9A binding sites or by investigating the effect of ZNF518B knock-down on G9A binding to its loci. It is also possible that ZNF518B directly stimulates G9A and/or GLP activity. Alternatively, it could help to stabilize the G9A complex or any of its members. Considering that ZNF518B has a measurable effect on H3K9me2 despite its substoichiometric association with G9A, the interaction is probably transient with only a small percentage of G9A-complexes being bound by ZNF518B at any given time. Our data demonstrate that even an interaction partner that is detected at only substoichiometric levels in the purified complex can have a profound impact on the activity of a chromatin modifying enzyme.
Supplementary Material
Footnotes
Author contributions: VM: derivation of transgenic cell lines, affinity purifications, knock-down experiments, immunoprecipitation experiments, data analysis, designed experiments, wrote manuscript; CF, JT, AC: global chromatin profiling MS experiments, data analysis; JQ: APMS experiments; AS, PD: derivation of transgenic cell lines; NC, CC: technical guidance; JJ: global chromatin profiling MS experiments, data analysis, designed experiments, wrote manuscript; SO, SC: supervised research; PM: APMS experiments, data analysis, designed experiments, wrote manuscript; JL: designed experiments, supervised research, wrote manuscript.
* This work was supported by grants from the National Institutes of Health (R01-DA36895), Rett Syndrome Research Trust, and International Rett Syndrome Foundation to J.T.L. J.T.L. is also in Investigator of the Howard Hughes Medical Institute. V.K.M. was supported by a fellowship of the German Research Foundation.
 This article contains supplemental Tables S1 to S3.
1 The abbreviations used are:
- PRC2
- polycomb repressive complex 2
- G9A
- histone-lysine N-methyltransferase EHMT2
- GLP
- histone-lysine N-methyltransferase EHMT1
- ZNF518B
- zinc finger protein 518B
- SILAC
- stable isotope labeling of amino acids in cell culture
- APMS
- affinity proteomics mass sepctrometry
- mESCs
- mouse embryonic stem cells.
REFERENCES
- 1. Simon J. A., Kingston R. E. (2013) Occupying chromatin: Polycomb mechanisms for getting to genomic targets, stopping transcriptional traffic, and staying put. Mol. Cell 49, 808–824 [DOI] [PMC free article] [PubMed] [Google Scholar]
- 2. Di Croce L., Helin K. (2013) Transcriptional regulation by Polycomb group proteins. Nat. Struct. Mol. Biol. 20, 1147–1155 [DOI] [PubMed] [Google Scholar]
- 3. Shinkai Y., Tachibana M. (2011) H3K9 methyltransferase G9a and the related molecule GLP. Genes Dev. 25, 781–788 [DOI] [PMC free article] [PubMed] [Google Scholar]
- 4. O'Carroll D., Erhardt S., Pagani M., Barton S. C., Surani M. A., Jenuwein T. (2001) The polycomb-group gene Ezh2 is required for early mouse development. Mol. Cell. Biol. 21, 4330–4336 [DOI] [PMC free article] [PubMed] [Google Scholar]
- 5. Pasini D., Bracken A. P., Jensen M. R., Lazzerini Denchi E., Helin K. (2004) Suz12 is essential for mouse development and for EZH2 histone methyltransferase activity. EMBO J. 23, 4061–4071 [DOI] [PMC free article] [PubMed] [Google Scholar]
- 6. Tachibana M., Sugimoto K., Nozaki M., Ueda J., Ohta T., Ohki M., Fukuda M., Takeda N., Niida H., Kato H., Shinkai Y. (2002) G9a histone methyltransferase plays a dominant role in euchromatic histone H3 lysine 9 methylation and is essential for early embryogenesis. Genes Dev. 16, 1779–1791 [DOI] [PMC free article] [PubMed] [Google Scholar]
- 7. Tachibana M., Ueda J., Fukuda M., Takeda N., Ohta T., Iwanari H., Sakihama T., Kodama T., Hamakubo T., Shinkai Y. (2005) Histone methyltransferases G9a and GLP form heteromeric complexes and are both crucial for methylation of euchromatin at H3-K9. Genes Dev. 19, 815–826 [DOI] [PMC free article] [PubMed] [Google Scholar]
- 8. Deb G., Singh A. K., Gupta S. (2014) EZH2: Not EZHY (Easy) to Deal. Mol Cancer Res. 12, 639–653 [DOI] [PMC free article] [PubMed] [Google Scholar]
- 9. Marchesi I., Giordano A., Bagella L. (2014) Roles of enhancer of zeste homolog 2: from skeletal muscle differentiation to rhabdomyosarcoma carcinogenesis. Cell Cycle 13, 516–527 [DOI] [PubMed] [Google Scholar]
- 10. Shankar S. R., Bahirvani A. G., Rao V. K., Bharathy N., Ow J. R., Taneja R. (2013) G9a, a multipotent regulator of gene expression. Epigenetics 8, 16–22 [DOI] [PMC free article] [PubMed] [Google Scholar]
- 11. Kim J., Kim H. (2012) Recruitment and biological consequences of histone modification of H3K27me3 and H3K9me3. ILAR J. 53, 232–239 [DOI] [PMC free article] [PubMed] [Google Scholar]
- 12. Brockdorff N. (2013) Noncoding RNA and Polycomb recruitment. Rna 19, 429–442 [DOI] [PMC free article] [PubMed] [Google Scholar]
- 13. Zhao J., Ohsumi T. K., Kung J. T., Ogawa Y., Grau D. J., Sarma K., Song J. J., Kingston R. E., Borowsky M., Lee J. T. (2010) Genome-wide identification of polycomb-associated RNAs by RIP-seq. Mol. Cell 40, 939–953 [DOI] [PMC free article] [PubMed] [Google Scholar]
- 14. Cai L., Rothbart S. B., Lu R., Xu B., Chen W. Y., Tripathy A., Rockowitz S., Zheng D., Patel D. J., Allis C. D., Strahl B. D., Song J., Wang G. G. (2013) An H3K36 methylation-engaging Tudor motif of polycomb-like proteins mediates PRC2 complex targeting. Mol. Cell 49, 571–582 [DOI] [PMC free article] [PubMed] [Google Scholar]
- 15. Li X., Isono K., Yamada D., Endo T. A., Endoh M., Shinga J., Mizutani-Koseki Y., Otte A. P., Casanova M., Kitamura H., Kamijo T., Sharif J., Ohara O., Toyada T., Bernstein B. E., Brockdorff N., Koseki H. (2011) Mammalian polycomb-like Pcl2/Mtf2 is a novel regulatory component of PRC2 that can differentially modulate polycomb activity both at the Hox gene cluster and at Cdkn2a genes. Mol. Cell. Biol. 31, 351–364 [DOI] [PMC free article] [PubMed] [Google Scholar]
- 16. Kim H., Kang K., Kim J. (2009) AEBP2 as a potential targeting protein for Polycomb Repression Complex PRC2. Nucleic Acids Res. 37, 2940–2950 [DOI] [PMC free article] [PubMed] [Google Scholar]
- 17. Li G., Margueron R., Ku M., Chambon P., Bernstein B. E., Reinberg D. (2010) Jarid2 and PRC2, partners in regulating gene expression. Genes Dev. 24, 368–380 [DOI] [PMC free article] [PubMed] [Google Scholar]
- 18. Pasini D., Cloos P. A., Walfridsson J., Olsson L., Bukowski J. P., Johansen J. V., Bak M., Tommerup N., Rappsilber J., Helin K. (2010) JARID2 regulates binding of the Polycomb repressive complex 2 to target genes in ES cells. Nature 464, 306–310 [DOI] [PubMed] [Google Scholar]
- 19. Peng J. C., Valouev A., Swigut T., Zhang J., Zhao Y., Sidow A., Wysocka J. (2009) Jarid2/Jumonji coordinates control of PRC2 enzymatic activity and target gene occupancy in pluripotent cells. Cell 139, 1290–1302 [DOI] [PMC free article] [PubMed] [Google Scholar]
- 20. Zhang Z., Jones A., Sun C. W., Li C., Chang C. W., Joo H. Y., Dai Q., Mysliwiec M. R., Wu L. C., Guo Y., Yang W., Liu K., Pawlik K. M., Erdjument-Bromage H., Tempst P., Lee Y., Min J., Townes T. M., Wang H. (2011) PRC2 complexes with JARID2, MTF2, and esPRC2p48 in ES cells to modulate ES cell pluripotency and somatic cell reprogramming. Stem Cells 29, 229–240 [DOI] [PMC free article] [PubMed] [Google Scholar]
- 21. Shen X., Kim W., Fujiwara Y., Simon M. D., Liu Y., Mysliwiec M. R., Yuan G. C., Lee Y., Orkin S. H. (2009) Jumonji modulates polycomb activity and self-renewal versus differentiation of stem cells. Cell 139, 1303–1314 [DOI] [PMC free article] [PubMed] [Google Scholar]
- 22. Chan Y. S., Goke J., Lu X., Venkatesan N., Feng B., Su I. H., Ng H. H. (2013) A PRC2-dependent repressive role of PRDM14 in human embryonic stem cells and induced pluripotent stem cell reprogramming. Stem Cells 31, 682–692 [DOI] [PubMed] [Google Scholar]
- 23. Payer B., Rosenberg M., Yamaji M., Yabuta Y., Koyanagi-Aoi M., Hayashi K., Yamanaka S., Saitou M., Lee J. T. (2013) Tsix RNA and the germline factor, PRDM14, link X reactivation and stem cell reprogramming. Mol. Cell 52, 805–818 [DOI] [PMC free article] [PubMed] [Google Scholar]
- 24. Yamaji M., Ueda J., Hayashi K., Ohta H., Yabuta Y., Kurimoto K., Nakato R., Yamada Y., Shirahige K., Saitou M. (2013) PRDM14 ensures naive pluripotency through dual regulation of signaling and epigenetic pathways in mouse embryonic stem cells. Cell Stem Cell 12, 368–382 [DOI] [PubMed] [Google Scholar]
- 25. Kim J. K., Esteve P. O., Jacobsen S. E., Pradhan S. (2009) UHRF1 binds G9a and participates in p21 transcriptional regulation in mammalian cells. Nucleic Acids Res. 37, 493–505 [DOI] [PMC free article] [PubMed] [Google Scholar]
- 26. Ueda J., Tachibana M., Ikura T., Shinkai Y. (2006) Zinc finger protein Wiz links G9a/GLP histone methyltransferases to the co-repressor molecule CtBP. J. Biol. Chem. 281, 20120–20128 [DOI] [PubMed] [Google Scholar]
- 27. Escamilla-Del-Arenal M., da Rocha S. T., Spruijt C. G., Masui O., Renaud O., Smits A. H., Margueron R., Vermeulen M., Heard E. (2013) Cdyl, a new partner of the inactive X chromosome and potential reader of H3K27me3 and H3K9me2. Mol. Cell. Biol. 33, 5005–5020 [DOI] [PMC free article] [PubMed] [Google Scholar]
- 28. Ruan J., Ouyang H., Amaya M. F., Ravichandran M., Loppnau P., Min J., Zang J. (2012) Structural basis of the chromodomain of Cbx3 bound to methylated peptides from histone h1 and G9a. PLoS One 7, e35376. [DOI] [PMC free article] [PubMed] [Google Scholar]
- 29. Nozawa R. S., Nagao K., Masuda H. T., Iwasaki O., Hirota T., Nozaki N., Kimura H., Obuse C. (2010) Human POGZ modulates dissociation of HP1alpha from mitotic chromosome arms through Aurora B activation. Nat. Cell Biol. 12, 719–727 [DOI] [PubMed] [Google Scholar]
- 30. Nishida M., Kato M., Kato Y., Sasai N., Ueda J., Tachibana M., Shinkai Y., Yamaguchi M. (2007) Identification of ZNF200 as a novel binding partner of histone H3 methyltransferase G9a. Genes Cells 12, 877–888 [DOI] [PubMed] [Google Scholar]
- 31. Banck M. S., Li S., Nishio H., Wang C., Beutler A. S., Walsh M. J. (2009) The ZNF217 oncogene is a candidate organizer of repressive histone modifiers. Epigenetics 4, 100–106 [DOI] [PMC free article] [PubMed] [Google Scholar]
- 32. Bard-Chapeau E. A., Gunaratne J., Kumar P., Chua B. Q., Muller J., Bard F. A., Blackstock W., Copeland N. G., Jenkins N. A. (2013) EVI1 oncoprotein interacts with a large and complex network of proteins and integrates signals through protein phosphorylation. Proc. Natl. Acad. Sci. U.S.A. 110, E2885–2894 [DOI] [PMC free article] [PubMed] [Google Scholar]
- 33. Epsztejn-Litman S., Feldman N., Abu-Remaileh M., Shufaro Y., Gerson A., Ueda J., Deplus R., Fuks F., Shinkai Y., Cedar H., Bergman Y. (2008) De novo DNA methylation promoted by G9a prevents reprogramming of embryonically silenced genes. Nat. Struct. Mol. Biol. 15, 1176–1183 [DOI] [PMC free article] [PubMed] [Google Scholar]
- 34. Esteve P. O., Chin H. G., Smallwood A., Feehery G. R., Gangisetty O., Karpf A. R., Carey M. F., Pradhan S. (2006) Direct interaction between DNMT1 and G9a coordinates DNA and histone methylation during replication. Genes Dev. 20, 3089–3103 [DOI] [PMC free article] [PubMed] [Google Scholar]
- 35. Mozzetta C., Pontis J., Fritsch L., Robin P., Portoso M., Proux C., Margueron R., Ait-Si-Ali S. (2014) The histone H3 lysine 9 methyltransferases G9a and GLP regulate polycomb repressive complex 2-mediated gene silencing. Mol. Cell 53, 277–289 [DOI] [PubMed] [Google Scholar]
- 36. Blagoev B., Kratchmarova I., Ong S. E., Nielsen M., Foster L. J., Mann M. (2003) A proteomics strategy to elucidate functional protein-protein interactions applied to EGF signaling. Nat. Biotechnol 21, 315–318 [DOI] [PubMed] [Google Scholar]
- 37. Hubner N. C., Mann M. (2011) Extracting gene function from protein-protein interactions using Quantitative BAC InteraCtomics (QUBIC). Methods 53, 453–459 [DOI] [PubMed] [Google Scholar]
- 38. Ong S. E., Blagoev B., Kratchmarova I., Kristensen D. B., Steen H., Pandey A., Mann M. (2002) Stable isotope labeling by amino acids in cell culture, SILAC, as a simple and accurate approach to expression proteomics. Mol. Cell Proteomics 1, 376–386 [DOI] [PubMed] [Google Scholar]
- 39. Trinkle-Mulcahy L., Boulon S., Lam Y. W., Urcia R., Boisvert F. M., Vandermoere F., Morrice N. A., Swift S., Rothbauer U., Leonhardt H., Lamond A. (2008) Identifying specific protein interaction partners using quantitative mass spectrometry and bead proteomes. J. Cell Biol. 183, 223–239 [DOI] [PMC free article] [PubMed] [Google Scholar]
- 40. Lee M. N., Roy M., Ong S. E., Mertins P., Villani A. C., Li W., Dotiwala F., Sen J., Doench J. G., Orzalli M. H., Kramnik I., Knipe D. M., Lieberman J., Carr S. A., Hacohen N. (2013) Identification of regulators of the innate immune response to cytosolic DNA and retroviral infection by an integrative approach. Nat. Immunol. 14, 179–185 [DOI] [PMC free article] [PubMed] [Google Scholar]
- 41. Sancak Y., Markhard A. L., Kitami T., Kovacs-Bogdan E., Kamer K. J., Udeshi N. D., Carr S. A., Chaudhuri D., Clapham D. E., Li A. A., Calvo S. E., Goldberger O., Mootha V. K. (2013) EMRE is an essential component of the mitochondrial calcium uniporter complex. Science 342, 1379–1382 [DOI] [PMC free article] [PubMed] [Google Scholar]
- 42. Jaffe J. D., Wang Y., Chan H. M., Zhang J., Huether R., Kryukov G. V., Bhang H. E., Taylor J. E., Hu M., Englund N. P., Yan F., Wang Z., Robert McDonald E., 3rd, Wei L., Ma J., Easton J., Yu Z., deBeaumount R., Gibaja V., Venkatesan K., Schlegel R., Sellers W. R., Keen N., Liu J., Caponigro G., Barretina J., Cooke V. G., Mullighan C., Carr S. A., Downing J. R., Garraway L. A., Stegmeier F. (2013) Global chromatin profiling reveals NSD2 mutations in pediatric acute lymphoblastic leukemia. Nat. Genet. 45, 1386–1391 [DOI] [PMC free article] [PubMed] [Google Scholar]
- 43. Kim J., Cantor A. B., Orkin S. H., Wang J. (2009) Use of in vivo biotinylation to study protein-protein and protein-DNA interactions in mouse embryonic stem cells. Nat. Protoc. 4, 506–517 [DOI] [PubMed] [Google Scholar]
- 44. Luikenhuis S., Wutz A., Jaenisch R. (2001) Antisense transcription through the Xist locus mediates Tsix function in embryonic stem cells. Mol. Cell. Biol. 21, 8512–8520 [DOI] [PMC free article] [PubMed] [Google Scholar]
- 45. Rappsilber J., Mann M., Ishihama Y. (2007) Protocol for micro-purification, enrichment, pre-fractionation and storage of peptides for proteomics using StageTips. Nat. Protoc. 2, 1896–1906 [DOI] [PubMed] [Google Scholar]
- 46. Mertins P., Qiao J. W., Patel J., Udeshi N. D., Clauser K. R., Mani D. R., Burgess M. W., Gillette M. A., Jaffe J. D., Carr S. A. (2013) Integrated proteomic analysis of post-translational modifications by serial enrichment. Nat. Methods 10, 634–637 [DOI] [PMC free article] [PubMed] [Google Scholar]
- 47. Cox J., Mann M. (2008) MaxQuant enables high peptide identification rates, individualized p.p.b.-range mass accuracies and proteome-wide protein quantification. Nat. Biotechnol. 26, 1367–1372 [DOI] [PubMed] [Google Scholar]
- 48. Udeshi N. D., Mani D. R., Eisenhaure T., Mertins P., Jaffe J. D., Clauser K. R., Hacohen N., Carr S. A. (2012) Methods for quantification of in vivo changes in protein ubiquitination following proteasome and deubiquitinase inhibition. Mol. Cell. Proteomics 11, 148–159 [DOI] [PMC free article] [PubMed] [Google Scholar]
- 49. Smits A. H., Jansen P. W., Poser I., Hyman A. A., Vermeulen M. (2013) Stoichiometry of chromatin-associated protein complexes revealed by label-free quantitative mass spectrometry-based proteomics. Nucleic Acids Res. 41, e28. [DOI] [PMC free article] [PubMed] [Google Scholar]
- 50. Root D. E., Hacohen N., Hahn W. C., Lander E. S., Sabatini D. M. (2006) Genome-scale loss-of-function screening with a lentiviral RNAi library. Nat. Methods 3, 715–719 [DOI] [PubMed] [Google Scholar]
- 51. Guttman M., Donaghey J., Carey B. W., Garber M., Grenier J. K., Munson G., Young G., Lucas A. B., Ach R., Bruhn L., Yang X., Amit I., Meissner A., Regev A., Rinn J. L., Root D. E., Lander E. S. (2011) lincRNAs act in the circuitry controlling pluripotency and differentiation. Nature 477, 295–300 [DOI] [PMC free article] [PubMed] [Google Scholar]
- 52. Ye J., Coulouris G., Zaretskaya I., Cutcutache I., Rozen S., Madden T. L. (2012) Primer-BLAST: a tool to design target-specific primers for polymerase chain reaction. BMC Bioinformatics 13, 134. [DOI] [PMC free article] [PubMed] [Google Scholar]
- 53. MacLean B., Tomazela D. M., Shulman N., Chambers M., Finney G. L., Frewen B., Kern R., Tabb D. L., Liebler D. C., MacCoss M. J. (2010) Skyline: an open source document editor for creating and analyzing targeted proteomics experiments. Bioinformatics 26, 966–968 [DOI] [PMC free article] [PubMed] [Google Scholar]
- 54. Surovtseva Y. V., Churikov D., Boltz K. A., Song X., Lamb J. C., Warrington R., Leehy K., Heacock M., Price C. M., Shippen D. E. (2009) Conserved telomere maintenance component 1 interacts with STN1 and maintains chromosome ends in higher eukaryotes. Mol. Cell 36, 207–218 [DOI] [PMC free article] [PubMed] [Google Scholar]
- 55. Vire E., Brenner C., Deplus R., Blanchon L., Fraga M., Didelot C., Morey L., Van Eynde A., Bernard D., Vanderwinden J. M., Bollen M., Esteller M., Di Croce L., de Launoit Y., Fuks F. (2006) The Polycomb group protein EZH2 directly controls DNA methylation. Nature 439, 871–874 [DOI] [PubMed] [Google Scholar]
- 56. Alekseyenko A. A., Gorchakov A. A., Kharchenko P. V., Kuroda M. I. (2014) Reciprocal interactions of human C10orf12 and C17orf96 with PRC2 revealed by BioTAP-XL cross-linking and affinity purification. Proc. Natl. Acad. Sci. U.S.A. 111, 2488–2493 [DOI] [PMC free article] [PubMed] [Google Scholar]
- 57. Martin C., Cao R., Zhang Y. (2006) Substrate preferences of the EZH2 histone methyltransferase complex. J. Biol. Chem. 281, 8365–8370 [DOI] [PubMed] [Google Scholar]
- 58. Kuzmichev A., Jenuwein T., Tempst P., Reinberg D. (2004) Different EZH2-containing complexes target methylation of histone H1 or nucleosomal histone H3. Mol. Cell 14, 183–193 [DOI] [PubMed] [Google Scholar]
- 59. Flicek P., Amode M. R., Barrell D., Beal K., Billis K., Brent S., Carvalho-Silva D., Clapham P., Coates G., Fitzgerald S., Gil L., Giron C. G., Gordon L., Hourlier T., Hunt S., Johnson N., Juettemann T., Kahari A. K., Keenan S., Kulesha E., Martin F. J., Maurel T., McLaren W. M., Murphy D. N., Nag R., Overduin B., Pignatelli M., Pritchard B., Pritchard E., Riat H. S., Ruffier M., Sheppard D., Taylor K., Thormann A., Trevanion S. J., Vullo A., Wilder S. P., Wilson M., Zadissa A., Aken B. L., Birney E., Cunningham F., Harrow J., Herrero J., Hubbard T. J., Kinsella R., Muffato M., Parker A., Spudich G., Yates A., Zerbino D. R., Searle S. M. (2014) Ensembl 2014. Nucleic Acids Res. 42, D749–755 [DOI] [PMC free article] [PubMed] [Google Scholar]
- 60. Schwanhausser B., Busse D., Li N., Dittmar G., Schuchhardt J., Wolf J., Chen W., Selbach M. (2011) Global quantification of mammalian gene expression control. Nature 473, 337–342 [DOI] [PubMed] [Google Scholar]
- 61. Fabre B., Lambour T., Bouyssié D., Menneteau T., Monsarrat B., Burlet-Schiltz O., Bousquet-Dubouch M. P. (2014) Comparison of label-free quantification methods for the determination of protein complexes subunits stoichiometry. EuPA Open Proteomics 4, 82–86 [Google Scholar]
- 62. Schmidt C., Lenz C., Grote M., Luhrmann R., Urlaub H. (2010) Determination of protein stoichiometry within protein complexes using absolute quantification and multiple reaction monitoring. Anal. Chem. 82, 2784–2796 [DOI] [PubMed] [Google Scholar]
- 63. Ahrne E., Molzahn L., Glatter T., Schmidt A. (2013) Critical assessment of proteome-wide label-free absolute abundance estimation strategies. Proteomics 13, 2567–2578 [DOI] [PubMed] [Google Scholar]
- 64. Cox J., Neuhauser N., Michalski A., Scheltema R. A., Olsen J. V., Mann M. (2011) Andromeda: a peptide search engine integrated into the MaxQuant environment. J. Proteome Res. 10, 1794–1805 [DOI] [PubMed] [Google Scholar]
- 65. Ciferri C., Lander G. C., Maiolica A., Herzog F., Aebersold R., Nogales E. (2012) Molecular architecture of human polycomb repressive complex 2. eLife 1, e00005. [DOI] [PMC free article] [PubMed] [Google Scholar]
- 66. Fernandes I., Bastien Y., Wai T., Nygard K., Lin R., Cormier O., Lee H. S., Eng F., Bertos N. R., Pelletier N., Mader S., Han V. K., Yang X. J., White J. H. (2003) Ligand-dependent nuclear receptor corepressor LCoR functions by histone deacetylase-dependent and -independent mechanisms. Mol. Cell 11, 139–150 [DOI] [PubMed] [Google Scholar]
- 67. Shi Y., Sawada J., Sui G., Affar el B., Whetstine J. R., Lan F., Ogawa H., Luke M. P., Nakatani Y., Shi Y. (2003) Coordinated histone modifications mediated by a CtBP co-repressor complex. Nature 422, 735–738 [DOI] [PubMed] [Google Scholar]
- 68. Hendrich B., Bird A. (1998) Identification and characterization of a family of mammalian methyl-CpG binding proteins. Mol. Cell. Biol. 18, 6538–6547 [DOI] [PMC free article] [PubMed] [Google Scholar]
- 69. Eryilmaz J., Pan P., Amaya M. F., Allali-Hassani A., Dong A., Adams-Cioaba M. A., Mackenzie F., Vedadi M., Min J. (2009) Structural studies of a four-MBT repeat protein MBTD1. PLoS One 4, e7274. [DOI] [PMC free article] [PubMed] [Google Scholar]
- 70. Xue Y., Wong J., Moreno G. T., Young M. K., Cote J., Wang W. (1998) NURD, a novel complex with both ATP-dependent chromatin-remodeling and histone deacetylase activities. Mol. Cell 2, 851–861 [DOI] [PubMed] [Google Scholar]
- 71. Ichimura T., Watanabe S., Sakamoto Y., Aoto T., Fujita N., Nakao M. (2005) Transcriptional repression and heterochromatin formation by MBD1 and MCAF/AM family proteins. J. Biol. Chem. 280, 13928–13935 [DOI] [PubMed] [Google Scholar]
- 72. Franceschini A., Szklarczyk D., Frankild S., Kuhn M., Simonovic M., Roth A., Lin J., Minguez P., Bork P., von Mering C., Jensen L. J. (2013) STRING v9.1: protein-protein interaction networks, with increased coverage and integration. Nucleic Acids Res. 41, D808–D815 [DOI] [PMC free article] [PubMed] [Google Scholar]
- 73. Shannon P., Markiel A., Ozier O., Baliga N. S., Wang J. T., Ramage D., Amin N., Schwikowski B., Ideker T. (2003) Cytoscape: a software environment for integrated models of biomolecular interaction networks. Genome Res. 13, 2498–2504 [DOI] [PMC free article] [PubMed] [Google Scholar]
- 74. Yao Y. L., Yang W. M. (2003) The metastasis-associated proteins 1 and 2 form distinct protein complexes with histone deacetylase activity. J. Biol. Chem. 278, 42560–42568 [DOI] [PubMed] [Google Scholar]
- 75. Zhang Y., Yang X., Gui B., Xie G., Zhang D., Shang Y., Liang J. (2011) Corepressor protein CDYL functions as a molecular bridge between polycomb repressor complex 2 and repressive chromatin mark trimethylated histone lysine 27. J. Biol. Chem. 286, 42414–42425 [DOI] [PMC free article] [PubMed] [Google Scholar]
- 76. Shen X., Liu Y., Hsu Y. J., Fujiwara Y., Kim J., Mao X., Yuan G. C., Orkin S. H. (2008) EZH1 mediates methylation on histone H3 lysine 27 and complements EZH2 in maintaining stem cell identity and executing pluripotency. Mol. Cell 32, 491–502 [DOI] [PMC free article] [PubMed] [Google Scholar]
- 77. Cifuentes-Rojas C., Hernandez A. J., Sarma K., Lee J. T. (2014) Regulatory Interactions between RNA and Polycomb Repressive Complex 2. Mol. Cell 55, 171–185 [DOI] [PMC free article] [PubMed] [Google Scholar]
- 78. Black J. C., Van Rechem C., Whetstine J. R. (2012) Histone lysine methylation dynamics: establishment, regulation, and biological impact. Mol. Cell 48, 491–507 [DOI] [PMC free article] [PubMed] [Google Scholar]
Associated Data
This section collects any data citations, data availability statements, or supplementary materials included in this article.