Abstract
We describe a novel hybridization assay that employs a unique class of energy tunable, bulge loop-containing competitor strands (C*) that hybridize to a probe strand (P). Such initial “pre-binding” of a probe strand modulates its effective “availability” for hybridizing to a target site (T). More generally, the assay described here is based on competitive binding equilibria for a common probe strand (P) between such tunable competitor strands (C*) and a target strand (T).
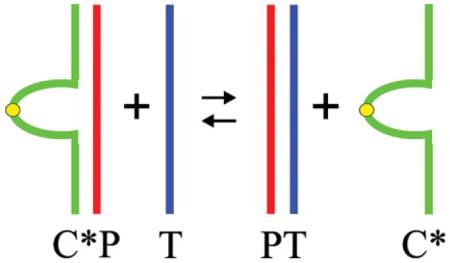
We demonstrate that loop variable, energy tunable families of C*P complexes exhibit enhanced discrimination between targets and mismatched targets, thereby reducing false positives/negatives. We refer to a C*P complex between a C* competitor single strand and the probe strand as a “tuning fork,” since the C* strand exhibits branch points (forks) at the duplex-bulge interfaces within the complex. By varying the loop to create families of such “tuning forks,” one can construct C*P “energy ladders” capable of resolving small differences within the target that may be of biological/functional consequence. The methodology further allows quantification of target strand concentrations, a determination heretofore not readily available by conventional hybridization assays. The dual ability of this tunable assay to discriminate and quantitate targets provides the basis for developing a technology we refer to as a “DNA Meter.” Here we present data that establish proof-of-principle for an in solution version of such a DNA Meter. We envision future applications of this tunable assay that incorporate surface bound/spatially resolved DNA arrays to yield enhanced discrimination and sensitivity.
Keywords: novel hybridization assay, DNA meter, DNA arrays
INTRODUCTION
Watson-Crick, canonical GC, and AT pairing interactions represent the molecular code by which two complementary nucleic acid sequence domains recognize and bind/hybridize to one another.1,2 This selective recognition pattern forms the basis for many fundamental biological processes, while also being the foundation for numerous applications in modern molecular medicine and biotechnology.3,4 These applications include diagnostic protocols, gene probing and expression modulation, primer design in polymerase chain reaction, sequencing methodologies, assays for gene transcripts, and secondary structural elements, as well as modulation of functional/regulatory sequence domains.4 More recently, probe-target hybridization assays have been used for large scale mapping of actively transcribed genes in entire cell lines (the so called transcriptome), different tissue types in systems biology applications, and to identify genetic changes in cancerous tissues.5–7
The ability to minimize errors in hybridization-based assays depends on the capacity to resolve relatively small energy differences between complexes formed between canonically correct complementary sequence matches and secondary “hits” that may be energetically compromised only marginally by mismatches, lesions, and other modestly destabilizing alterations. Traditional hybridization-based methods used single stranded probes (P) complementary to single stranded target sequences (T).8 Such approaches frequently lacked the stringency to differentiate between P-T perfect matches (primary “hits”) and energetically similar yet imperfect P-M mismatches (secondary “hits”), thereby resulting in false positives that compromise many applications. To address this limitation, second generation hybridization-based approaches employed duplex probes in which the target sequence had to displace a competitor strand (C) in a P-C duplex probe construct in which the probe strand was “pre-hybridized,” including internally folded P-C complexes such as Molecular Beacons.9 This approach created a competitive equilibrium (e.g., strand exchange, strand displacement, strand invasion) situation that increased stringency.9,10 While an improvement, this approach was limited by the design of competitor strands that could yield the refined energy tuning required to resolve minimally destabilizing yet diagnostically and biologically consequential imperfections in the P-T complex, while, at the same time, not altering the Watson-Crick recognition pattern in the probe. Modifying the Watson-Crick recognition pattern could in principle expand the repertoire; however, at the cost of increasing the error inherent in the protocol.
Here we describe and demonstrate the feasibility of a hybridization assay that employs a unique class of competitor strands (C*) which allows for enhanced energy tuning of the competitor-probe (C*P) complexes without altering the Watson-Crick recognition elements of the probe for the target (T) domain. In our design, tunable competitor strands hybridize with the probe strand to form bulge-loop complexes, . The subscript i refers to the number of nucleotides (e.g., thymidines) in the bulge loop, the variation of which allows for energy tuning that dictates how strongly a given competitor strand (e.g., ) competes with the target strand, T, for binding to the probe strand, P. Since the bulge-loop complexes have two-dimensional topologies that resemble branch points (forks) at the duplex-bulge interfaces, we call these constructs “tuning forks.” This tuning fork technology allows one to construct an energy ladder of duplex probes, thereby facilitating both quantification and resolution of small differences of biological/functional consequence within the target. We demonstrate that this new family of complexes exhibits tunable discrimination between targets and mismatched targets, and provides a means of target quantification. This dual ability of the tunable assay to discriminate and quantitate targets provides the basis for developing a technology we refer to as a “DNA Meter.”
The specific example used for proof-of-principle employs an arbitrary 22mer target sequence (T). We show that this target strand preferentially and, in a concentration dependent manner, displaces a complementary 22-mer probe strand (P) from a mixture of competitor-probe complexes () in order of the tunable stabilities of the complexes. We detect and score the competitive equilibia associated with this assay using conventional optical and/or calorimetric observables of the strand displacement products. We further show that the complexes discriminate between a matched target (T) and mismatched target (M) DNA. Since our methodology also allows quantification of target strand concentrations, our data provide an in-solution proof-of-principle for the concept of a DNA meter.
MATERIALS AND METHODS
Materials
Oligonucleotides were either synthesized on a 10lmole scale by standard phosphoramidite chemistry using an Äkta DNA synthesizer or purchased from IDT. Oligonucleotides were purified by repeated DMT on/DMT off reverse phase HPLC, as previously described.11,12 The purities of the oligonucleotides were assessed by analytical HPLC and ion spray mass spectroscopy, and were found to be better than 98% pure by mass spectroscopy. Purified oligonucleotides where dialyzed using dispo-dialyzers with MWCO 500 Da (Spectrum, CA) against at least two changes of buffer containing 10 mM Cacodylic acid/Na-Cacodylate, and 0.1 mM Na2 EDTA, pH 6.8 and sufficient NaCl to yield a final concentration of 100 mM in Na+ ions. Extinction coefficients at 260 nm of the probe, P, and the target strand, T, were determined by phosphate assay under denaturing conditions (90°C)13,14 and were found to be: ε(T) = 190,400 M−1 cm−1; ε(P) = 186,200 M−1 cm−1. For all competitor oligonucleotides, , extinction coefficients were determined from continuous variation titrations (Job plots) with the complementary probe oligonucleotide and were found to be: , , and . Individual competitor oligonucleotides, , are identified by the number, i, of thymidines, in the loop domain, i.e., refers to a competitor oligonucleotide with 6 thymines in the loop domain. The mismatch target strand (M) contained a THF abasic site lesion in place of a guanidine at position 6 resulting in an extinction coefficient at 260 nm and 90°C of ε(M) = 180,000 M−1 cm−1.
DSC Studies
DSC studies were conducted, as previously described, using a Nano-DSCII differential scanning calorimeter (Calorimetry Science Corporation, Utah) with a nominal cell volume of 0.3 ml.15 Individual competitor-probe, , or probe-target, PT, complexes, at concentrations of 50 μM in strand, were repeatedly scanned between 0°C and 90/95°C with a constant heating rate of 1°C/min, while continuously recording the excess power required to maintain sample and reference cells at the same temperature. DNA strand exchange measurements were performed by combining increasing amounts of target strand, T, with mixtures of pre-formed competitor-probe complexes , , and at a strand concentration of 20 μM and scanning repeated between 0°C and 90/95 °C at a constant heating rate of 1°C /min. For each target strand concentration tested, a fresh , and and T mixture was prepared. Samples were kept on ice, to minimize strand exchange prior to measurement. After conversion of the measured excess power values to heat capacity units and subtractions of buffer/buffer scans, the raw DSC traces were normalized for DNA concentration and analyzed using Origin software. The calorimetric enthalpy (ΔHcal) was derived by integration of the excess heat capacity curve, and ΔCp was derived from the difference in the linearly extrapolated pre- and post-transition baselines at Tm. ΔS was derived from ΔH/Tm, and corrected for DNA strand concentration assuming “bimolecular” behavior as outlined by Marky and Breslauer.16 Here the Tm is defined as the temperature at the midpoint of the integrated excess heat capacity curve for a given conformational transition.
UV Absorption Studies
UV spectra and temperature dependent changes in UV absorption were measured using an AVIV model 400 UV/VIS spectrophotometer (Aviv Biomedical, Lakewood, NJ). Temperature dependent changes in UV absorption at 260 nm were recorded with an averaging time of 5 s and a 1 nm bandwidth while the temperature was raised in a stepwise manner in steps of 0.5°C with 1 min equilibration time. Oligonucleotide concentrations were 0.7 or 2 μM in strand. DNA strand exchange measurements were performed in a manner similar to the DSC experiments described above by pre-forming competitor-probe complexes at 2 μM concentration of each strand and adding 2 μM of target strand to the cuvette at 5°C immediately prior to performing the melt. Multiplex strand exchange was performed by combining the preformed competitor-probe complexes , , and at a concentration of 0.7 μM each and adding increasing amounts of target strand T to this mixture. For each target strand concentration tested, fresh , , or mixtures were prepared. Samples were kept on ice, to slow down/prevent strand exchange prior to measurement.
Simulations
The interactions of target, probe, and competitor strands are described by four coupled equilibria, plus the equation of mass balance. Target association with probe is described by , whereas the competitor-probe association is described by , where i = 6, 12, 24. In these equations, Pf is the concentration of single-stranded probe, (T) is the concentration of single-stranded target and (PT) is the concentration of probe-target duplex. () represents the concentration of single-stranded competitor and () represents the concentration of competitor-probe complex, where i corresponds to the number of thymines in the competitor loop. These equations may be rewritten as and , where Ttot is the total strand concentration of target and represents the total strand concentration of each competitor, including duplex and single-strand forms. Substituting these equations into the equation of mass balance: , we arrive at a single equation that can be solved for Pf for a given set of Ki, Ptot, and . The values of Ptot, Ttot, and are defined by the experimental conditions. The values of Ki are determined at each temperature using the values for ΔH and ΔS determined from DSC curves, under the assumption of a single two-state transition, and of a temperature-independent heat capacity change. Using these values of Ki, Pf values were determined at each temperature, for each set of experimental conditions, by Newton-Raphson iteration. These equations for Pf were then used to solve for each of the individual (PT), (), and fractional saturations. All theoretical simulations were performed and plotted using MatLab (version 7.14.0, 2012, The Math-Works, Natick, Massachusetts) routines written by one of us (WB).
RESULTS AND DISCUSSION
The Experimental System
As part of our ongoing research on the differential properties of non-canonical DNA conformations associated with disease states, we have designed and characterized families of DNA bulge loop complexes with centrally located extrahelical bulge loops of increasing loop size.12,17–20 A subset of such DNA constructs with all-thymidine (all-T) bulge loops of variable size in the so-called competitor strand (Ci*) (Scheme 1) provides the energy tunable component of the assay described herein. Increasing loop size allows systematic manipulation (i.e., tuning) of the relative stabilities of each competitor-probe (Ci* P) complex. The 11 Watson-Crick base pairs on either side of the variable length thymidine domain remain the same, while the size of the all-T bulge loop increases across the family of Ci * constructs. The sequence and length of the upstream and downstream base paired domains can be changed to accommodate complementarity towards any desired target sequence, T. Changing the size of the loop domain modulates the interactions between the different competitor strands and the common probe strand. In the demonstration system reported here, a second 22mer, complementary to the probe strand, is designated as the target strand T. A sequence variant of the 22mer target strand in which one of the guanines is replaced by a tetrahydrofuran abasic site lesion (F) provides a mismatch target (M). We show how the individual components of our system behave in isolation, and we characterize the more complex behavior of mixtures of these molecules. The data reveal that the competitor-probe complexes are able to a) quantitate target and b) discriminate between a matched target strand (T) and a mismatched target strand (M). The dual ability of this tunable assay to discriminate and quantitate targets illustrates the characteristics required for the development of a functional “DNA Meter” technology.
SCHEME 1.
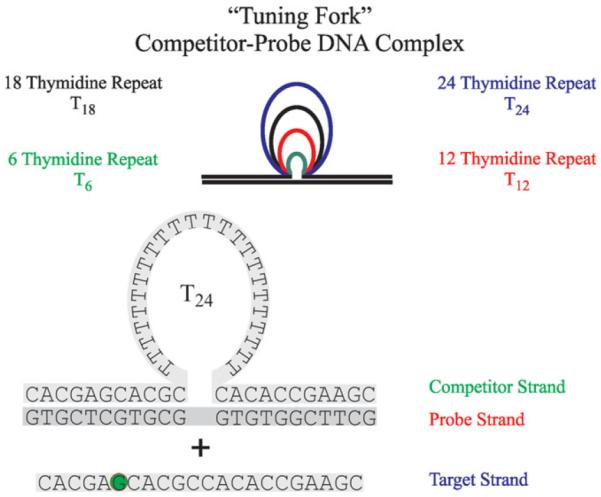
Schematic representation of the different competitor-probe bulge loop complexes used in this study. The example of the C*24P complex plus added target strand (T) shows details of the sequences used in our studies. The green circle in the target strand indicates the guanidine that was replaced by a THF abasic site lesion to form the mismatch target (M) studied here.
Characterizing the “Tuning Fork” Competitor-Probe System: Increasing Loop Size Modulates Competitor-Probe Complex Stability in a Predictable Manner
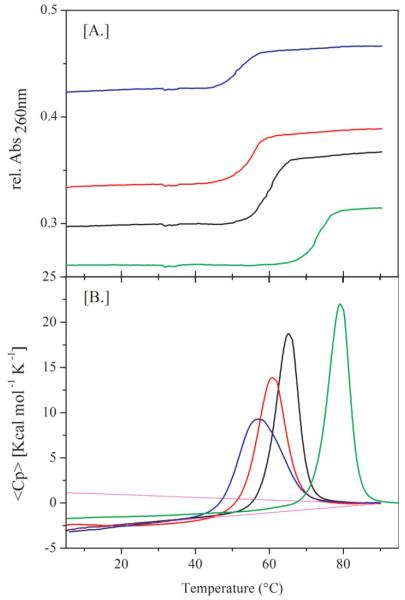
Figure 1A shows optical melting curves for a series of competitor-probe complexes, in which the size of the all-T bulge loop is increased from 6 to 24. The corresponding calorimetric denaturation curves are shown in Figure 1B, and the resulting thermodynamic data derived from these measurements are listed in Table I. Also shown for comparison is the melting curve of the 22mer probe-target complex (PT). Note that the melting temperatures for the different competitor-probe complexes, , are lower than that of the probe-target complex, PT, a feature reflective of the bulge-induced destabilization. Further note that the melting temperatures of the different complexes decrease monotonically with increasing loop size. The thermodynamic data reveal this decrease in Tm to be entropy-driven. The dominance of the entropic contribution of loop size on the Tm of the complexes is expected, as larger loop size will increase the degrees of freedom of forming a bulge loop.21 We find that the enthalpy change continues to decrease for very large unstructured all-T bulge loops, in contrast to the behavior of all-T hairpin loops.22–27 In short, the larger the all-T bulge loop, the lower the Tm, the lower the enthalpy change (ΔH), and the smaller the free energy change (ΔG) for denaturing the competitor-probe complex. While this is interesting differential behavior, the more significant observation from a practical perspective is that the interactions between the probe and the competitor strands can be tuned in a predictable manner through changes in the size of an extrahelical loop domain that is not directly involved in the hybridization recognition process. Below we describe the impact of the competitor strand on the ability of the target strand to recognize/bind the probe strand.
FIGURE 1.
A,B: (A) Optical and (B) calorimetric melting curves of the different competitor-probe complexes showing the impact of loop size on melting behavior. (=black, =red, =blue) Also shown for comparison are the melting curves for the probe-target complex (green).
Table I.
DSC Derived Thermodynamic Parameters for Probe-Target and Competitor-Probe Complexesa
| Probe-Target Complexes | ||||
| Tm (°C) | ΔHcal(kcal mol−1) | ΔScal (cal mol−1 K−1)b | ΔCp (cal mol−1 K−1) | |
| PT | 79.1 ± 0.3 | 172.2 ± 4.4 | 465.9 ± 23.3 | 1100 ± 220 |
| PM | 69.6 ± 0.3 | 155.5 ± 4.0 | 430.7 ± 21.5 | 800 ± 200 |
| Competitor-Probe Complexes | ||||
| Tm (°C) | ΔHcal(kcal mol−1) | ΔScal (cal mol−1 K−1)b | ΔCp (cal mol−1 K−1) | |
| 65.2 ± 0.3 | 153.5 ± 3.9 | 432.7 ± 21.6 | 1060 ± 210 | |
| 60.5 ± 0.3 | 147.3 ± 3.7 | 416.4 ± 20.8 | 1330 ± 260 | |
| 56.5 ± 0.3 | 140.8 ± 3.4 | 405.9 ± 20.3 | 1230 ± 250 | |
Strand Concentration Ct = 50 μM. Data are for the dissociation reaction.
Standard state entropy is for a hypothetical 1M strand reference state.
Detection and Modulation of Strand Displacement and Product Formation
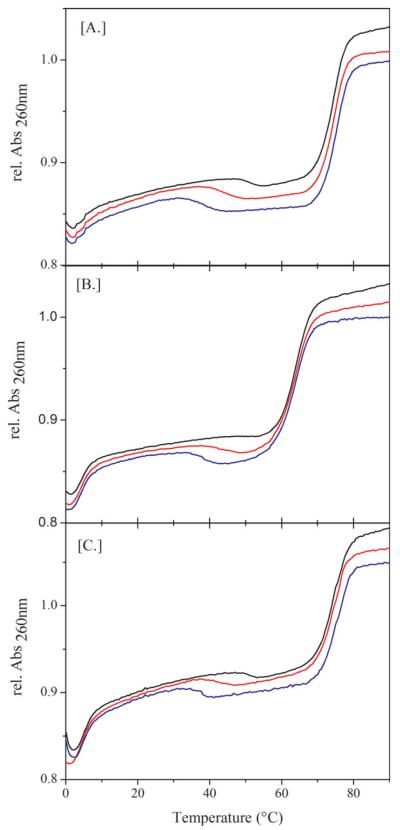
As shown in Figure 2A, the addition of an equimolar amount of complementary target strand, T, to a pre-formed complex results in characteristic changes in the UV-melting curves. Specifically, the high-temperature melting transitions no longer correlate with melting of the complexes. Instead, the temperature traces show initial irreversible hypochromic changes in absorbance at temperatures lower than that of the corresponding melting transition. This observation reflects displacement of the competitor strand by the target strand. The subsequent higher temperature hyperchromic transition corresponds to melting of the newly formed PT complex, which occurs at the same temperature, independent of the competitor strand displaced. After heating past the initial hypochromic transition once, only the high temperature hyperchromic effect due to melting of the PT duplex remains in subsequent heating and cooling scans. Consistent with this interpretation, we previously have reported such hypochromic changes at low temperature followed by hyperchromic absorbance changes at high temperature for strand exchange and strand displacement reactions.18 Using differential scanning calorimetry, we observe similar temperature-dependent transitions, with strand displacement reflected by a small exothermic transition (results not shown). It is noteworthy that the temperature of the initial hypochromic strand displacement transition decreases with increasing loop size/decreasing Tm of the original complex. In other words, the loop size dependent modulation of the stability of the competitor-probe complex correlates with a similar modulation in the temperature at which the irreversible strand displacement reaction occurs. Hence, for this system, modulating the thermal stability of the competitor-probe complex also modulates the thermal signature of the strand displacement reaction.
FIGURE 2.
A–C: (A) UV Strand displacement with matched Target and (B) THF containing mismatched Target and (C) discrimination between match and mismatch target strand. In this experiment a preformed duplex containing an equimolar mixture of 0.7 μM probe and 0.7 μM competitor (-Black , –Red, - Blue) is mixed with 0.7 μM target strand. As the temperature is raised from 0°C to 95°C, the curves obtained in the figures are obtained. In Figure 2A, the target is fully complementary with the probe. In Figure 2B, the target contains a single mismatch. In Figure 2C 0.7 μM of fully complementary and of mismatched targets are added simultaneously.
Competitor Displacement by Imperfect/Mismatched Target Strands
To further probe how the nature of the interactions between the probe strand and the target strand impacts strand displacement, we performed similar displacement experiments with a “mismatch target” strand containing a single tetrahydrofuran (THF) abasic site in place of guanidine. A THF abasic site lesion causes disruption of DNA duplex stability.28–32 This impact is reflected here in a lower melting temperature of the strand-displacement single “mismatch” PM product complex compared with the thermal stability of the corresponding perfect-match PT complex. Stable interactions between the mismatch strand and the probe strand can cause a false positive in conventional hybridization assays. As shown in Figure 2B, strand displacement by the mismatch target occurs at essentially the same temperature as the corresponding strand displacement reaction by the matched target, while the melting point of the mismatch complex is lowered compared to the fully matched complex. This result suggests that the temperature of the strand displacement reaction is influenced by factors other than the nature/stability of the final product probe strand-target strand complex. We propose that the formation of a stable initiation complex33,34 between the probe strand and the incoming (mismatch) target strand determines the temperature at which displacement occurs, and that transient base pair opening rather than full melting of the competitor-probe complex suffices to initiate complex formation. If such initiation complex formation is the critical step in strand displacement, then strand displacement by a mismatch target can occur, if the mismatch-probe complex is energetically more stable than the competitor-probe complex.
To test the ability of the complexes to distinguish between a target and a mismatched target strand (i.e., which would avoid a false positive), we incubated the preformed complexes with an equimolar amount of matched “target” and an equivalent amount of THF containing “mismatched” target strands. As shown in Figure 2C, only the matched target strand is able to displace the competitor strands under these conditions, while the mismatched target strand remains single stranded, unable to bind the probe strand. These results demonstrate the ability of our competitive binding probes to distinguish between closely related target and mismatched target strands when both are present, a feature crucial for successful application of the DNA “tuning fork” assay technology described here.
A Mixture of DNA Tuning Forks as the Basis for a DNA Meter
Conceptualization and development of a DNA meter requires: (a) distinguishing target from mismatch molecules; and (b) defining the concentration of the target and/or mismatch molecules. As demonstrated in the previous section, tuning fork technology utilizing a single competitor-probe complex, C*P, can distinguish target from mismatch, thereby fulfilling the first criterion of a DNA meter. One approach that also quantitates the amount of target present (the second criterion) involves simultaneously interrogating/binding/recognizing target strands using a mixture of multiple, differentially stable, competitor-probe complexes (). Such multiple DNA tuning forks used within the same experimental measurement create an energy ladder. As elaborated on below, such an energy ladder mixture of tuning fork competitor-probe complexes produces a multiplex assay that satisfies both criteria, thereby providing proof of principle for a primitive DNA meter.
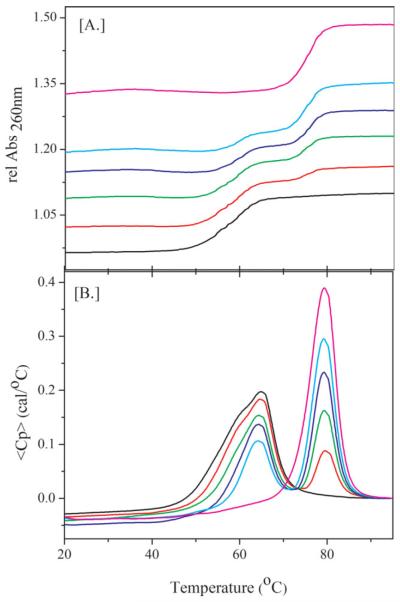
To demonstrate the use of such multiplexed interrogation of target strand recognition, we combined an equimolar mixture of the various competitor-probe complexes (, , and ) differing in loop size, and titrated the resulting mixture with increasing amounts of target strand. As shown in Figure 3A, for UV absorption, and in Figure 3B, for DSC detection, target recognition is detected by either characteristic changes in the UV absorbance or heat observables. These measurements allow us to track the progress in the displacement reaction by monitoring the disappearance of the competitor-probe signal for the different competitor-probe complexes and the appearance of the newly formed probe-target complex at higher temperature. Inspection of Figures 3A and 3B reveals that upon titration of the complexes with target, T, the signals for the complexes decrease, while simultaneously the PT signal at higher temperature appears and increases in intensity. The increase in the PT signal is proportional to the amount of target added, while the disappearance of the competitor-probe signal is not uniform over the range of the composite competitor-probe melting transitions. Instead, the competitor-probe signals, in both the UV and the DSC traces, initially disappear from the low temperature side of the composite melting curve. Upon further titration with target, the composite competitor-probe signals disappear sequentially in order of the thermal stability of the individual competitor-probe complexes in the mixture. At low amounts of target DNA, only the least stable complex undergoes displacement by the target, while the more stable and competitor-probe complexes remain unaffected. At intermediate target concentrations, all of the and a fractional amount of the complexes undergo strand displacement, while the most stable competitor-probe complex remains unchanged. Only at the highest concentration of target stand are all competitor strands displaced from the probe strand and exchanged with the target DNA. This concentration-dependent, sequential displacement in response to changes in target concentration, in the order of least stable () to most stable (), allows our multiplex assay to detect target strand as well as to quantify the amount of target strand present. Hence we have demonstrated that DNA tuning fork, energy ladder assays define a primitive DNA meter that can both distinguish target from mismatch (Figure 2C) and quantitate target over a range of concentrations (Figure 3).
FIGURE 3.
A,B (A) Multiplexed strand displacement with increasing amounts of matched Target monitored by UV absorption and (B) differential scanning calorimetry. For (A), All samples contained 0.7 μM each of , and . For (B), All samples contained 20 μM each of , and . For both (A) and (B), the ratios of Target to were 0 (black), 0.5 (red), 1.0 (green), 1.5 (blue), 2.0 (Cyan), and 3.0 (purple).
Thermodynamic Simulations: How Experimental Data Define Target Concentrations
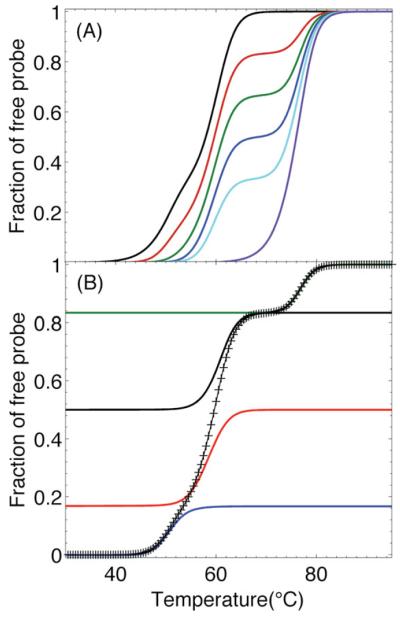
To better understand the target concentration-dependent changes in the shapes of the temperature dependent UV absorbance curves and DSC thermograms shown in Figure 3, we have simulated the experimental melting curves. To this end, we used the simplifying assumptions that all transitions are at equilibrium and two-state in nature, while allowing for temperature-dependent transition enthalpy changes (i.e., ΔCp≠0).35–38 The thermodynamic parameters required for the simulations were obtained from our DSC curves of the isolated and PT complexes shown in Figure 1B and listed in Table I. While the two-state assumption may be overly simplistic for complex DNA constructs like the duplexes, the simulations nevertheless recreate most of the essential features of the observed experimental response. Figure 4 shows the results of these simulations under the conditions of the UV absorption experiments. The data are reported as the fraction of probe that is free, to more closely mimic the shapes of the UV curves. Comparison of the curves in Figures 3A and 4A reveals that the transitions predicted by the simulations occur at temperatures indistinguishable from the transitions observed by UV spectroscopy. In Figure 4B, we show how the fraction of free probe can be parsed into contributions from the successive displacement and melting of , , and competitor-probe duplexes, followed at higher temperature by the melting of PT duplex. Therefore, the simplified model upon which the simulations are based, provides a reasonable theoretical underpinning to quantify the nature and concentration of the target strand, a requirement for developing a DNA meter biosensor. In terms of practical applications, we note that any type of measurement that provides a difference in signal between free probe and bound probe has the potential for utilization in a DNA meter.
FIGURE 4.
A,B: Simulations of the fraction of free probe under the conditions of the UV experiments shown in Figure 3a. (A) All samples contained 0.7 μM each of P, , , and . From left to right, the ratios of T to P were 0, 0.5, 1.0, 1.5, 2.0, and 3.0, which are the same ratios as for the experimental data in Figure 3. (B) Breakdown of the simulated curve for a ratio of 0.5 Target to Probe (+) into contributions from (blue curve), (red curve), (black curve), and T (green curve).
Tuning Forks, Energy Ladders, Multiplexed Assays, and Future Manifestations
The data presented in Figures 2 and 3 in conjunction with the simulations shown in Figure 4 reveal that it is possible to use conventional in-solution techniques (e.g., UV melting and differential scanning calorimetry) in conjunction with an energy ladder produced by tunable competitor-probe duplexes to yield a multiplexed assay. For in-solution detection methodologies, there is a limit on the number of independently contributing components that can be resolved experimentally. This constraint limits the number of component competitor-probe complexes that can be studied at one time, thereby limiting the resolution of the assay, as well as the useful dynamic range for concentration determination. The use of intrinsic or extrinsic fluorescent markers sensitive to which strands interact allows extension of the number of components that can be experimentally resolved in solution. Even with the use of fluorescent markers, there are limits to the resolution that one can achieve in conventional in-solution analyses. The large differences in ΔΔG’s of the loop series presented here are necessary to discriminate the energy ladder in solution by the techniques employed. However, if the probes are positionally discriminated, the same energy ladder concept could be applied with much smaller range of perturbations among the probes. In other words, the utility of the multiplexed DNA tuning fork displacement approach will be further empowered when different competitor-probe complexes are spatially separated and covalently attached to a surface, rather than distributed in solution. Spatially resolved surface bound competitor-probe complexes39,40 will facilitate probing for target recognition and quantification at high resolution over a wide dynamic range, limited only by the range of possible competitor-probe interactions one can devise.
A schematic of a DNA meter with surface-attached tuning fork probes using fluorescence detection is cartooned in Figures 5 and 6. In this conceptual illustration, individual sensor elements provide discrimination based on the position of individual probes within the surface array, obviating the need for the simultaneous monitoring of multiple fluorophores. Consider a DNA meter with multiple surface probes for each target sequence of a particular nucleic acid of interest, and with multiple target sequences. The DNA meter would respond in a characteristic pattern of “on” signals to increasing concentrations of the nucleic acid of interest. However, this pattern will be perturbed if one of the target sequences has a single nucleotide polymorphism (SNP) or other alteration. In this case, all of the probes for that particular target will turn on at higher concentrations than anticipated, compared to the probes for the other targets. If probes are present that are complementary to the SNP, then they will be turned on at lower concentrations. Consequently, the multiplexing capability of a DNA meter should enable accurate and sensitive detection of SNPs over a wide dynamic range. Tunable probes corresponding to known SNPs can used to define the nature of the SNP.
FIGURE 5.
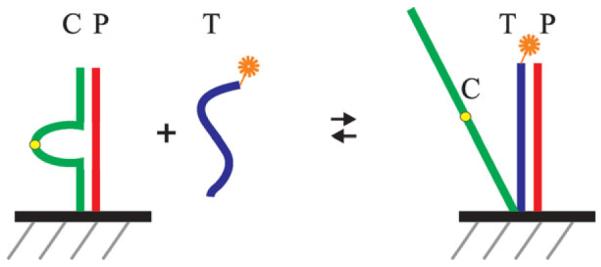
The action of surface tuning fork probes. Strands P and C are attached via neighboring groups on the surface. C is partially complementary to P. The target strand T binds P and displaces C.
FIGURE 6.
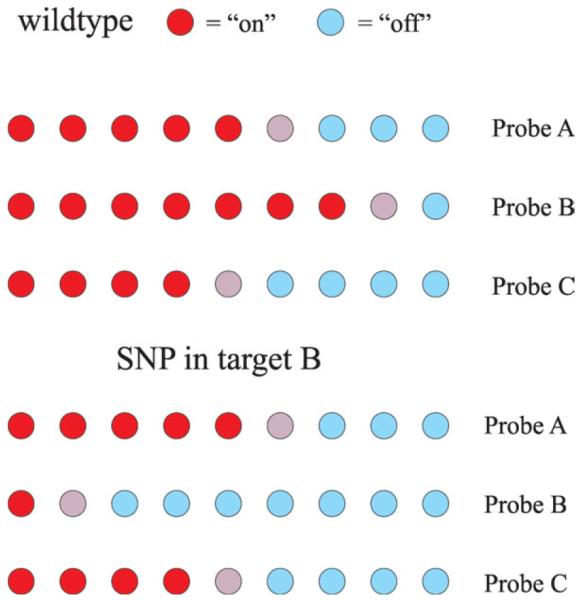
Illustration of how the DNA meter can be used to determine SNPs. Targets A, B, and C are on the same amplicon, and probes A, B, and C are for these respective targets. For the wildtype, a characteristic pattern of tunable probes turned “on” is observed. When a SNP occurs in target B, fewer probes for this target are turned “on” and the characteristic pattern is disrupted.
CONCLUDING REMARKS
A well-recognized limitation of hybridization-based assays is that defects in the Watson-Crick recognition code, such as mismatched or bulged out bases, can be accommodated with relatively small energy penalties, resulting in the misrecognition of target sites. To overcome such challenges, we have described here an approach based on the selective tuning of the energetics of probe-target recognition that preserves the canonical Watson-Crick recognition code. Specifically, we have demonstrated that one can tune the energetics of probe-target recognition through competing interactions between the probe and a family of competitor strands that bind to the probe strand with a tunable range of interaction energies modulated via altering the size of a non-interacting loop domain on the competitor strand. In such an approach, the competitor strand acts as “masking tape” that shields the probe from interaction with the target, unless the target is able to displace the “masking tape” competitor strand. We have shown that by selectively tuning the strength of the interaction between the “masking tape” competitor strand and the probe, one can modulate/tune the probe-target interactions without altering the probe-target recognition code. In the specific manifestation demonstrated here, the competitor strand element used to modulate the stability of the overall competitor/probe complex is extrahelical, thereby ensuring that the Watson-Crick recognition interface of the probe strand is not altered. Using this strategy, we have demonstrated that one is able to enhance stringency without compromising target identification. For the functional and topological reasons noted above, we refer to such a family of competitor “masking tape” probe complexes as “DNA tuning forks”.
In the context of diagnostic applications, such competitive hybridization equilibria can facilitate target discrimination (i.e., help reduce the incidence of false positives), and can allow one to quantify target concentrations with high sensitivity (i.e., with minimal false negatives). In our example, the single extrahelical tuning element, the all-T loop, is located in the center of the competitor-probe strand. However, there is no a priori requirement for such placement of the extrahelical tuning element, nor is there a requirement for only one tuning element within a competitor strand. In principle, the extrahelical tuning element or elements can be located anywhere within the competitor strand, and they can be composed of any nucleotides and nucleotide analogs that destabilize competitor-probe interactions relative to probe-target interactions. This freedom to vary the composition, nature, and number of extrahelical tuning elements without directly impacting the probe-target recognition provides flexibility in the design of suitable DNA tuning forks for any given DNA Meter application. For example, one can tune the resolution of the assay by adjusting the range of competitor-probe interaction strengths to optimize recognition and quantification of target concentration required for a given application. Coarse resolution for rapid screening can be achieved by choosing competitors that differ widely in their interaction energies with the probe strand. Fine resolution for differentiating at the single nucleotide level (for SNP detection) can be achieved by choosing competitors that differ by small increments in their interaction energies with the probe strand.
In summary, we have demonstrated for an arbitrary 22mer target sequence that the target strand preferentially, and in a concentration dependent manner, displaces a complementary probe strand from a mixture of competitor-probe complexes in the order of their stability, and that this displacement can in turn be used to provide a quantitation of target concentration. We further show that such competitor-probe complexes discriminate between a matched target DNA and a mismatched target DNA. Our proof-of-principle results are based on classical optical and calorimetric observables for in-solution conditions. We underscore, however, that attachment to surfaces and/or the use of intrinsic or extrinsic fluorescent markers sensitive to strand hybridization will reduce sample constraints and enhance the use of this assay for practical applications. Future embodiments of this approach envision the use of fluorescent detection and/or surface arrays that will function as DNA meters.
Acknowledgments
Contract grant sponsor: NIH
Contract grant number: GM23509
Contract grant number: GM34469
Contract grant number: CA47995
Contract grant sponsor: NSF
Contract grant number: CBET-1033788
Contract grant sponsor: NIH
Contract grant number: AI074089
REFERENCES
- 1.Watson JD, Crick FH. Nature. 1953;171:964–967. doi: 10.1038/171964b0. [DOI] [PubMed] [Google Scholar]
- 2.Watson JD, Crick FH. Nature. 1953;171:737–738. doi: 10.1038/171737a0. [DOI] [PubMed] [Google Scholar]
- 3.Alberts B. Molecular Biology of the Cell. Garland Science; New York: 2008. [Google Scholar]
- 4.Cantor CR, Smith C, Human Genome Project . Genomics : the science and technology behind the Human Genome Project. Wiley; New York: 1999. [Google Scholar]
- 5.Lamb J, Crawford ED, Peck D, Modell JW, Blat IC, Wrobel MJ, Lerner J, Brunet JP, Subramanian A, Ross KN, Reich M, Hieronymus H, Wei G, Armstrong SA, Haggarty SJ, Clemons PA, Wei R, Carr SA, Lander ES, Golub TR. Science. 2006;313:1929–1935. doi: 10.1126/science.1132939. [DOI] [PubMed] [Google Scholar]
- 6.Luo B, Cheung HW, Subramanian A, Sharifnia T, Okamoto M, Yang X, Hinkle G, Boehm JS, Beroukhim R, Weir BA, Mermel C, Barbie DA, Awad T, Zhou X, Nguyen T, Piqani B, Li C, Golub TR, Meyerson M, Hacohen N, Hahn WC, Lander ES, Sabatini DM, Root DE. Proc Natl Acad Sci USA. 2008;105:20380–20385. doi: 10.1073/pnas.0810485105. [DOI] [PMC free article] [PubMed] [Google Scholar]
- 7.Subramanian A, Tamayo P, Mootha VK, Mukherjee S, Ebert BL, Gillette MA, Paulovich A, Pomeroy SL, Golub TR, Lander ES, Mesirov JP. Proc Natl Acad Sci USA. 2005;102:15545–15550. doi: 10.1073/pnas.0506580102. [DOI] [PMC free article] [PubMed] [Google Scholar]
- 8.Gillespie D, Spiegelman S. J Mol Biol. 1965;12:829–842. doi: 10.1016/s0022-2836(65)80331-x. [DOI] [PubMed] [Google Scholar]
- 9.Tyagi S, Kramer FR. Nat Biotech. 1996;14:303–308. doi: 10.1038/nbt0396-303. [DOI] [PubMed] [Google Scholar]
- 10.Vallee-Belisle A, Ricci F, Plaxco KW. J Am Chem Soc. 2012;134:2876–2879. doi: 10.1021/ja209850j. [DOI] [PMC free article] [PubMed] [Google Scholar]
- 11.Völker J, Klump HH, Breslauer KJ. Proc Natl Acad Sci USA. 2001;98:7694–7699. doi: 10.1073/pnas.141221298. [DOI] [PMC free article] [PubMed] [Google Scholar]
- 12.Völker J, Makube N, Plum GE, Klump HH, Breslauer KJ. Proc Natl Acad Sci USA. 2002;99:14700–14705. doi: 10.1073/pnas.222519799. [DOI] [PMC free article] [PubMed] [Google Scholar]
- 13.Snell FD, Snell CT. Colorimetric Methods of Analysis, Including Some Turbidimetric and Nephelometric Methods. R. E. Krieger Pub. Co.; Huntington, New York: 1972. [Google Scholar]
- 14.Plum GE. Curr Protoc Nucleic Acid Chem 2001. doi: 10.1002/0471142700.nc0703s00. Chapter 7, Unit 7 3. [DOI] [PubMed] [Google Scholar]
- 15.Privalov G, Kavina V, Freire E, Privalov PL. Anal Biochem. 1995;232:79–85. doi: 10.1006/abio.1995.9957. [DOI] [PubMed] [Google Scholar]
- 16.Marky LA, Breslauer KJ. Biopolymers. 1987;26:1601–1620. doi: 10.1002/bip.360260911. [DOI] [PubMed] [Google Scholar]
- 17.Lee BJ, Barch M, Castner EW, Jr., Völker J, Breslauer KJ. Biochemistry. 2007;46:10756–10766. doi: 10.1021/bi7005674. [DOI] [PubMed] [Google Scholar]
- 18.Völker J, Klump HH, Breslauer KJ. J Am Chem Soc. 2007;129:5272–5280. doi: 10.1021/ja070258q. [DOI] [PubMed] [Google Scholar]
- 19.Völker J, Plum GE, Klump HH, Breslauer KJ. J Am Chem Soc. 2009;131:9354–9360. doi: 10.1021/ja902161e. [DOI] [PMC free article] [PubMed] [Google Scholar]
- 20.Völker J, Gindikin V, Klump HH, Plum GE, Breslauer KJ. J Am Chem Soc. 2012;134:6033–6044. doi: 10.1021/ja3010896. [DOI] [PMC free article] [PubMed] [Google Scholar]
- 21.Scheffler IE, Elson EL, Baldwin RL. J Mol Biol. 1970;48:145–171. doi: 10.1016/0022-2836(70)90225-1. [DOI] [PubMed] [Google Scholar]
- 22.Haasnoot CAG, De Bruin SH, Hilbers CW, Van Der Marel GA, Van Boom JH. Proc Int Symp Biomol Struct Interactions. Suppl J Biosci. 1985;8:767–780. [Google Scholar]
- 23.Paner TM, Amaratunga M, Benight AS. Biopolymers. 1992;32:881–892. doi: 10.1002/bip.360320714. [DOI] [PubMed] [Google Scholar]
- 24.Paner TM, Riccelli PV, Owczarzy R, Benight AS. Biopolymers. 1996;39:779–793. doi: 10.1002/(SICI)1097-0282(199612)39:6%3C779::AID-BIP5%3E3.0.CO;2-S. [DOI] [PubMed] [Google Scholar]
- 25.Senior MM, Jones RA, Breslauer KJ. Proc Natl Acad Sci USA. 1988;85:6242–6246. doi: 10.1073/pnas.85.17.6242. [DOI] [PMC free article] [PubMed] [Google Scholar]
- 26.Shen Y, Kuznetsov SV, Ansari A. J Phys Chem B. 2001;105:12202–12211. [Google Scholar]
- 27.Vallone PM, Paner TM, Hilario J, Lane MJ, Faldasz BD, Benight AS. Biopolymers. 1999;50:425–442. doi: 10.1002/(SICI)1097-0282(19991005)50:4<425::AID-BIP8>3.0.CO;2-B. [DOI] [PubMed] [Google Scholar]
- 28.Gelfand CA, Plum GE, Grollman AP, Johnson F, Breslauer KJ. Biopolymers. 1996;38:439–445. doi: 10.1002/(SICI)1097-0282(199604)38:4%3C439::AID-BIP1%3E3.0.CO;2-U. [DOI] [PubMed] [Google Scholar]
- 29.Gelfand CA, Plum GE, Grollman AP, Johnson F, Breslauer KJ. Biochemistry. 1998;37:7321–7327. doi: 10.1021/bi9803372. [DOI] [PubMed] [Google Scholar]
- 30.Rachofsky EL, Seibert E, Stivers JT, Osman R, Ross JB. Biochemistry. 2001;40:957–967. doi: 10.1021/bi001665g. [DOI] [PubMed] [Google Scholar]
- 31.Sagi J, Guliaev AB, Singer B. Biochemistry. 2001;40:3859–3868. doi: 10.1021/bi0024409. [DOI] [PubMed] [Google Scholar]
- 32.Vesnaver G, Chang CN, Eisenberg M, Grollman AP, Breslauer KJ. Proc Natl Acad Sci USA. 1989;86:3614–3618. doi: 10.1073/pnas.86.10.3614. [DOI] [PMC free article] [PubMed] [Google Scholar]
- 33.Porschke D, Eigen M. J Mol Biol. 1971;62:361–381. doi: 10.1016/0022-2836(71)90433-5. [DOI] [PubMed] [Google Scholar]
- 34.Eigen M, Porschke D. J Mol Biol. 1970;53:123–141. doi: 10.1016/0022-2836(70)90049-5. [DOI] [PubMed] [Google Scholar]
- 35.Chalikian TV, Völker J, Plum GE, Breslauer KJ. Proc Natl Acad Sci USA. 1999;96:7853–7858. doi: 10.1073/pnas.96.14.7853. [DOI] [PMC free article] [PubMed] [Google Scholar]
- 36.Holbrook JA, Capp MW, Saecker RM, Record MT., Jr Biochemistry. 1999;38:8409–8422. doi: 10.1021/bi990043w. [DOI] [PubMed] [Google Scholar]
- 37.Rouzina I, Bloomfield VA. Biophys J. 1999;77:3252–3255. doi: 10.1016/S0006-3495(99)77156-0. [DOI] [PMC free article] [PubMed] [Google Scholar]
- 38.Rouzina I, Bloomfield VA. Biophys J. 1999;77:3242–3251. doi: 10.1016/S0006-3495(99)77155-9. [DOI] [PMC free article] [PubMed] [Google Scholar]
- 39.Service RF. Science. 1998;282:396–399. doi: 10.1126/science.282.5388.396. [DOI] [PubMed] [Google Scholar]
- 40.Marshall A, Hodgson J. Nat Biotechnol. 1998;16:27–31. doi: 10.1038/nbt0198-27. [DOI] [PubMed] [Google Scholar]


