

Abstract
Motivation: Numerous in silico methods predicting peptide binding to major histocompatibility complex (MHC) class I molecules have been developed over the last decades. However, the multitude of available prediction tools makes it non-trivial for the end-user to select which tool to use for a given task. To provide a solid basis on which to compare different prediction tools, we here describe a framework for the automated benchmarking of peptide-MHC class I binding prediction tools. The framework runs weekly benchmarks on data that are newly entered into the Immune Epitope Database (IEDB), giving the public access to frequent, up-to-date performance evaluations of all participating tools. To overcome potential selection bias in the data included in the IEDB, a strategy was implemented that suggests a set of peptides for which different prediction methods give divergent predictions as to their binding capability. Upon experimental binding validation, these peptides entered the benchmark study.
Results: The benchmark has run for 15 weeks and includes evaluation of 44 datasets covering 17 MHC alleles and more than 4000 peptide-MHC binding measurements. Inspection of the results allows the end-user to make educated selections between participating tools. Of the four participating servers, NetMHCpan performed the best, followed by ANN, SMM and finally ARB.
Availability and implementation: Up-to-date performance evaluations of each server can be found online at http://tools.iedb.org/auto_bench/mhci/weekly. All prediction tool developers are invited to participate in the benchmark. Sign-up instructions are available at http://tools.iedb.org/auto_bench/mhci/join.
Contact: mniel@cbs.dtu.dk or bpeters@liai.org
Supplementary information: Supplementary data are available at Bioinformatics online.
1 Introduction
Cytotoxic T-cell lymphocytes (CTLs) play a pivotal role in the immune control in vertebrates. CTLs scan the surface of cells and are able to recognize and destroy cells harboring intracellular threats. They do this by interacting with complexes of peptides and major histocompatibility complex (MHC) class I molecules presented on the cell surface.
Many events influence which peptides from a given non-self protein will become epitopes, including processing by the proteasome and TAP (Androlewicz et al., 1993; Rock and Goldberg, 1999; Rock et al., 1994; Sijts and Kloetzel, 2011), peptide trimming (Serwold et al., 2002; Weimershaus et al., 2013) and T-cell precursor frequencies (Jenkins and Moon, 2012; Wang et al., 2007). However, the single most selective event is binding to the MHC class I (MHC-I) molecule (Yewdell and Bennink, 1999). Given this, large efforts have been dedicated over the last decades to the development of prediction methods capable of accurately predicting peptide binding to MHC-I molecules (Hattotuwagama et al., 2004; Hoof et al., 2009; Karosiene et al., 2012; Lundegaard et al., 2008; Nielsen et al., 2007; Shen et al., 2014; Wan et al., 2006).
The large number of different methods poses a significant challenge for the end-user in terms of selecting which method is most suitable to solve a given question. Several articles have been published with the aim of dealing with this, using different strategies such as conducting a large-scale benchmark of prediction tools (Lin et al., 2008a, 2008b; Zhang et al., 2009a, 2012), benchmarks where prediction methods are trained and evaluated on identical datasets (Peters et al., 2006), making large, static benchmark datasets available (Peters et al., 2006) or by hosting a machine learning competition that serves as a benchmark itself (Zhang et al., 2011).
Such large-scale benchmarks of prediction tools are essential for researchers looking to make use of the predictions, as well as for tool developers, as it allows them to evaluate how novel prediction algorithms and training strategies increase predictive performance. However, performing such benchmarks in an optimal manner, where all participating methods are trained and evaluated on identical datasets, is a highly computationally complex task, limiting participation to expert users. Another issue is the time lag between when the benchmark is performed and when the manuscript describing the results is published. During this time, developers may have updated or improved their prediction tools, meaning some of the benchmark results are instantly outdated. Finally, when it comes to static benchmark datasets, a risk of ‘overfitting’ exists leading to development of sub-optimal methods lacking generalizability to novel data. This is simply due to the fact that the same data are used repeatedly to evaluate and select the most optimal methods.
Another critical issue of benchmark studies relates to the transparency of both the data used in the study and the evaluation measures. The machine learning competition in immunology (MLI) 2010 hosted by Zhang et al. (2011) was a well-supported competition, gathering a total of 20 participating prediction tools. Likewise, the 2012 MLI competition attracted significant attention from the community with 32 submissions for the competition (bio.dfci.harvard.edu/DFRMLI/HTML/natural.php). Being the first of their kind, these benchmarks have been of high relevance for both users and developers of MHC-I binding prediction tools. However, for both end-users and tool developers, certain aspects of the competitions were sub-optimal. For instance, the benchmark data for the 2010 competition of MHC-I binding prediction methods were generated using a commercial assay used in few academic settings with a criterion for binding that could not readily be compared with more commonly used KD/IC50/half-life data. Likewise, the MLI 2012 competition of ligands eluted from MHC-I molecules did not clarify up front how negative peptides would be chosen, how peptides for different lengths would be dealt with, nor how the performance would be scored. As participants in these competitions, we felt that it was unfortunate that this information was not provided up front and that the best way to reduce such uncertainties was to completely automate the benchmarking process to make it completely transparent.
Here, we seek to provide a complimentary approach to benchmarking prediction tools that addresses some of the issues listed above. Our approach consists of two steps. First, we have developed a framework for the automated benchmarking of MHC-I binding prediction methods. Earlier similar approaches have been taken to evaluate prediction of protein structure (Eyrich et al., 2001; Kryshtafovych et al., 2014; Tai et al., 2014). The participating methods are run via a RESTful web service (henceforth referred to as servers) hosted locally for each participating method, making the effort involved in joining the benchmark minimal for tool developers. The benchmark is run weekly on data newly submitted to the Immune Epitope Database (IEDB) (Vita et al., 2010), thus making the source and nature of the evaluation data fully transparent. Furthermore, to achieve the maximum degree of transparency, the benchmark evaluation criteria are outlined explicitly. The results of all benchmark evaluations are made publicly available, giving the public access to frequent, up-to-date performance evaluations of all participating methods.
Second, to overcome the problem of selection bias in the data that are included in the IEDB (which is often pre-selected based on certain prediction algorithms), we have developed an approach that selects a set of peptides that is highly informative in the sense that different prediction methods disagree on how well the peptides bind. We plan to run this approach once a year and test a set of the resulting peptides. To provide complete transparency, the script selecting the peptides in the benchmark will be made publically available. The script takes a list of peptides and returns a subset of the peptides that should be measured experimentally. The resulting peptides and measurements can then be submitted to the IEDB where they will automatically be identified and included in the benchmark. Every step from peptide selection to comparison of predicted and experimental values is performed without manual intervention.
2 Materials and methods
2.1 Participating prediction methods
Four prediction methods participated in the initial run of the automated MHC-I server benchmark. All the methods predict peptide-MHC-I binding affinity and are trained on binding affinity data. SMM (Peters and Sette, 2005), ANN (Lundegaard et al., 2008) and ARB (Bui et al., 2005) are hosted at the La Jolla Institute for Allergy & Immunology and NetMHCpan (Hoof et al., 2009) is hosted at the Center for Biological Sequence Analysis at the Technical University of Denmark. The different methods are described in detail in the Supplementary Material.
2.2 Data
Data for the benchmark are retrieved from the IEDB. Because of the nature of submissions to the IEDB, where journal articles are curated for peptide-MHC binding data, a multitude of measurement data types are currently found in the IEDB database. To ensure that as much data as possible can be included in the benchmark, we currently support five different measurement types: KD (thermodynamic constant), IC50 (inhibitory concentration to outcompete 50% of a high affinity reference ligand, can approximate KD), EC50 (concentration needed to half-saturate the receptor, approximates KD), t1/2 (half-life of binding) and binary (peptides solely classified as positive or negative for binding based on some threshold that is consistent within the curated reference). As IC50 and EC50 measurements can approximate KD, these three data types are combined and will be referred to as IC50 henceforth.
The benchmark is performed only on peptides of lengths 8–11 that are annotated to bind one of the MHC molecules available in the NetMHCpan method. The benchmark therefore only includes measurements to exactly identified MHC molecules (excluding, for instance, the imprecise serotype HLA-A2, which could refer to different HLA molecules identified by complete two-field typing such as HLA-A*02:01 or HLA-A*02:06). NetMHCpan was chosen for this filtering as this method provides predictions for by far the most MHC molecules including all molecules covered by the other methods. A list of supported alleles can be found at: http://tools.iedb.org/auto_bench/mhci/alleles.
The IEDB makes new data publically available on a weekly basis, and the weekly benchmark is run on this new data prior to its public release, ensuring that participating methods will not have the opportunity to train on the benchmark data (except if a group has access to the data outside of the IEDB).
2.3 Benchmark setup
The automated benchmark is set up in a decentralized fashion, where each participating method is hosted externally as a RESTful web service. We chose this type of setup because it grants the most flexibility to participating developers. Developers are free to implement their prediction methods on their own servers and may make changes to their implementations as they see fit. They may also retrain their methods as often as they see fit and are indeed encouraged to do so. The IEDB releases datasets that were used to train the predictions methods hosted on their site. These can be found at http://tools.iedb.org/main/datasets/. Note that although the use of the latest IEDB training dataset is encouraged, it is not a requirement for participation. Developers are also free to add data from other sources to their own training datasets. The only requirements for participants are that their web services must accept input and deliver output in defined formats. For RESTful web service templates and other details, see http://tools.iedb.org/auto_bench/mhci/join.
Once data have been retrieved from the IEDB, each peptide and the corresponding allele will be sent to each participating prediction method in a customizable format and the benchmark server will retrieve the individual predictions. All measurements and predictions are stored in databases on the benchmark server.
2.4 Evaluation
The data are split into homogenous evaluation datasets consisting of unique combinations of measurement type, allele and length. As an example, all peptides reported in a single reference that have length 10, were measured for binding to the MHC molecule HLA-A*02:01 and had their measurements reported as half-life make up one evaluation dataset. An evaluation dataset must have at least 10 measurement data points and at least two positive and two negative measurement data points to be included in the benchmark. Each server is evaluated on each evaluation dataset using the area under the receiver operating curve (AUC) and the Spearman rank correlation coefficient (SRCC). For AUC evaluations, continuous measurement data are categorized as follows: for IC50 data, measurements less than 500 nM are considered positive, for t1/2 data, measurements over 2 h are considered positive. In the case of SRCC evaluations, both continuous and binary measurement data were used.
For each evaluated dataset, a percentage rank score is calculated for each participating server. The rank scores lie between 0 and 100, with the best performing server scoring 100, the worst performing server scoring 0 and the remaining servers receiving scores evenly spaced between 0 and 100. Thus, for an evaluated dataset where predictions for three servers are available, the scores 100, 50 and 0 are assigned. When predictions from four servers are available, the scores 100, 67, 33 and 0 are assigned and so on. In the case of ties, all methods receive the highest rank score. For example, in a benchmark with four servers where two servers have equal performance and are ranked to be second best, the scores 100, 67, 67, and 0 are assigned. Each server receives a percentage rank score based on its AUC performance and a percentage rank score based on its SRCC performance.
For each server, an overall ranking score is calculated, summarizing its overall performance across all MHC molecules, peptide lengths and measurement data types. The ranking score is calculated as the average of the percentage rank scores of the individual evaluation datasets covered by the given method. Evaluated datasets must have predictions from at least two servers to be included in the calculation of the ranking score. In addition to the overall ranking score, AUC and SRCC ranking scores are also calculated and are based solely on either AUC or SRCC performances, respectively. Using this schema, servers are not penalized for only covering a subset of the datasets included in the benchmark, yet servers that provide predictions for poorly understood MHC molecules with few measurement data points available for training, are also not penalized for doing so. When new data are benchmarked, each server receives both a weekly ranking score, based only on datasets submitted that given week, and a cumulative ranking score that takes into account datasets submitted within the past 3 months.
2.5 Generation of an information rich peptide dataset
As peptide data submitted to the IEDB might have a certain bias due to selection strategies applied by the originating publications, we included an additional dataset with large divergences between predicted binding values of different prediction servers to complement the IEDB data. For this dataset, only 9mer peptides were included. The peptide set was constructed to highlight differences in performance between the three best performing servers in the initial IEDB benchmark (ANN, NetMHCpan and SMM). Predictions for 6000 unique 9mer peptides to HLA-A*02:01, HLA-B*07:02, HLA-B*35:01, HLA-B*44:03, HLA-B*53:01 and HLA-B*57:01 were generated from NetMHCpan, SMM and ANN. These predictions were then used to assign each peptide a rank score for each server and allele. In this case, we assigned the peptide with the strongest predicted binding a rank score of 1.
Divergently predicted peptides were selected by comparing the rank scores of the top 1% scoring peptides for a server with the rank scores of the same peptides for each other server in a pairwise fashion. For each pairwise comparison, the 10 peptides with the largest difference in rank were selected for the performance test dataset. This was repeated for each of the six MHC molecules. As we are only comparing the top 1% scoring peptides for a server, comparing server A with B is distinct from comparing server B with A and will in most cases yield a new subset of peptides.
Although this selection scheme provides 60 data points (10 peptides selected from each of the six pairwise method comparisons) to compare servers per allele, in practice many of the selected peptides provided data points for multiple pairwise comparisons at the same time. For example, if servers A and B agree strongly in their predictions for a peptide but disagree with server C, the same peptide provides a data point for both the A–C and B–C pairwise comparison. Therefore, the number of unique divergently predicted peptides for each allele was less than 60. The number of selected peptides per allele ranged from 28 to 43, with a total of 208 being selected for all six MHC molecules combined.
In addition to the set of divergently predicted peptides, we also generated a set of peptides for which all servers tended to agree in their predictions of the peptides being strong binders, weak binders or non-binders. The strong binders were selected by assigning each peptide a single rank score equal to the worst rank score it achieved across all three servers. As an example, a peptide that received the ranks 1, 5 and 20 would be assigned the rank 20. Using this ranking, the 10 highest ranked peptides were selected. All peptides selected, apart from one, had rank scores in the top 2%. Weak binders were selected by identifying peptides with rank scores within the 3–5% interval for each of the three servers. Five of these peptides were then selected randomly. For non-binders, a summed rank score was calculated for each peptide by summing its rank scores from each server. The five peptides with the numerically largest summed rank scores were then selected. Using the approach, 20 peptides (10 strong binders, five weak binders and five non-binders) were selected per allele. We term these peptides consistently predicted peptides. Some of these peptides overlapped with the divergent peptides and were discarded. In summary, a total of 104 consistently predicted peptides were added to the final dataset.
2.6 Binding affinity measurements
The peptide-MHC binding assay has been described in detail elsewhere (Sidney et al., 2001). Briefly, purified MHC molecules, test peptides and a radiolabeled probe peptide are incubated for 2 days at room temperature in the presence of human B2-microglobulin and a cocktail of protease inhibitors. After the 2-day incubation, binding of the radiolabeled peptide to the corresponding MHC-I molecule is determined by capturing peptide-MHC complexes on W6/32 antibody (anti-HLA-A, B and C) coated plates and measuring the bound cpm using a microscintillation counter.
3 Results
3.1 Initial IEDB benchmark
The automated MHC-I server benchmark was initially performed on data added to the IEDB from January 1, 2013 to March 1, 2014. During this time, 71 references containing MHC ligand assays were added to the IEDB. These references were either direct submissions to the IEDB or data curated from journal articles. The 71 IEDB references were parsed for peptide binding affinity measurement data with supported measurement types, MHC molecules and peptide lengths. After filtering for peptides with appropriate lengths and measurements against accepted MHC molecules, 36 datasets, from 12 different IEDB references, contained sufficient data to be evaluated. These 36 evaluated datasets contained 3791 peptide-MHC measurements spread across 14 MHC molecules. Performance scores for each server on these 36 datasets are listed in Table 1.
Table 1.
Server performance values for the initial IEDB benchmark
| IEDB reference | Allele | Peptide length | Peptide count | Positive count | Measurement type | NetMHCpan |
SMM |
ANN |
ARB |
||||
|---|---|---|---|---|---|---|---|---|---|---|---|---|---|
| SRCC | AUC | SRCC | AUC | SRCC | AUC | SRCC | AUC | ||||||
| 1026840 | HLA-A*02:01 | 9 | 24 | 14 | IC50 | 0.340 | 0.671 | 0.327 | 0.636 | 0.265 | 0.593 | 0.402 | 0.693 |
| 1026941 | HLA-A*02:01 | 9 | 10 | 6 | IC50 | 0.677 | 0.917 | 0.791 | 0.958 | 0.864 | 1.000 | 0.717 | 0.917 |
| 1026371 | HLA-A*02:01 | 9 | 85 | 49 | t1/2 | 0.559 | 0.812 | 0.557 | 0.811 | 0.576 | 0.819 | 0.563 | 0.811 |
| 1026840 | HLA-A*02:01 | 9 | 24 | 7 | t1/2 | 0.439 | 0.739 | 0.382 | 0.748 | 0.321 | 0.689 | 0.447 | 0.706 |
| 1026840 | HLA-A*02:01 | 9 | 357 | 76 | Binary | 0.576 | 0.906 | 0.568 | 0.900 | 0.547 | 0.886 | 0.564 | 0.898 |
| 1026941 | HLA-A*02:01 | 9 | 10 | 6 | Binary | 0.711 | 0.917 | 0.782 | 0.958 | 0.853 | 1.000 | 0.711 | 0.917 |
| 1026371 | HLA-A*02:01 | 10 | 22 | 12 | t1/2 | 0.152 | 0.567 | 0.144 | 0.558 | 0.191 | 0.583 | 0.106 | 0.533 |
| 1026891 | HLA-A*11:01 | 9 | 22 | 19 | Binary | 0.094 | 0.579 | 0.115 | 0.596 | 0.136 | 0.614 | −0.115 | 0.404 |
| 1026840 | HLA-A*24:02 | 9 | 20 | 12 | IC50 | 0.209 | 0.667 | 0.400 | 0.771 | 0.209 | 0.635 | 0.046 | 0.500 |
| 1026840 | HLA-A*24:02 | 9 | 357 | 49 | Binary | 0.444 | 0.873 | 0.405 | 0.839 | 0.438 | 0.868 | 0.404 | 0.836 |
| 1026891 | HLA-A*24:02 | 9 | 21 | 16 | Binary | 0.129 | 0.587 | 0.000 | 0.500 | 0.037 | 0.525 | 0.000 | 0.500 |
| 1026840 | HLA-A*30:01 | 9 | 349 | 8 | Binary | 0.160 | 0.809 | 0.151 | 0.791 | 0.141 | 0.771 | 0.108 | 0.708 |
| 1026840 | HLA-A*30:02 | 9 | 56 | 35 | IC50 | 0.011 | 0.483 | 0.121 | 0.569 | 0.134 | 0.601 | 0.269 | 0.661 |
| 1026840 | HLA-A*30:02 | 9 | 56 | 14 | t1/2 | 0.053 | 0.503 | 0.065 | 0.502 | 0.185 | 0.554 | 0.152 | 0.523 |
| 1026840 | HLA-A*30:02 | 9 | 360 | 109 | Binary | 0.425 | 0.767 | 0.361 | 0.728 | 0.403 | 0.753 | 0.249 | 0.661 |
| 1026840 | HLA-A*68:01 | 9 | 35 | 13 | IC50 | 0.631 | 0.843 | 0.625 | 0.794 | 0.651 | 0.843 | 0.526 | 0.774 |
| 1026840 | HLA-A*68:01 | 9 | 35 | 19 | t1/2 | −0.316 | 0.322 | −0.425 | 0.253 | −0.407 | 0.266 | −0.385 | 0.308 |
| 1026840 | HLA-A*68:01 | 9 | 436 | 43 | Binary | 0.385 | 0.873 | 0.374 | 0.863 | 0.383 | 0.871 | 0.336 | 0.791 |
| 1026371 | HLA-B*07:02 | 9 | 43 | 17 | t1/2 | 0.858 | 0.952 | 0.790 | 0.959 | 0.839 | 0.964 | 0.529 | 0.783 |
| 1026840 | HLA-B*07:02 | 9 | 296 | 25 | binary | 0.375 | 0.889 | 0.387 | 0.903 | 0.385 | 0.899 | 0.366 | 0.880 |
| 1026371 | HLA-B*07:02 | 10 | 25 | 9 | t1/2 | 0.663 | 0.785 | 0.577 | 0.729 | 0.583 | 0.736 | 0.568 | 0.715 |
| 1026891 | HLA-B*40:01 | 9 | 20 | 9 | Binary | 0.671 | 0.889 | 0.532 | 0.808 | 0.619 | 0.859 | 0.566 | 0.828 |
| 1026897 | HLA-B*40:01 | 9 | 18 | 5 | Binary | 0.466 | 0.800 | 0.562 | 0.862 | 0.466 | 0.800 | 0.466 | 0.800 |
| 1026897 | HLA-B*40:01 | 10 | 12 | 2 | Binary | 0.648 | 1.000 | 0.648 | 1.000 | 0.648 | 1.000 | 0.722 | 1.000 |
| 1026897 | HLA-B*55:02 | 9 | 11 | 3 | Binary | 0.645 | 0.917 | — | — | — | — | — | — |
| 1026840 | HLA-B*58:01 | 9 | 35 | 17 | IC50 | 0.362 | 0.716 | 0.319 | 0.668 | 0.267 | 0.650 | 0.209 | 0.546 |
| 1026840 | HLA-B*58:01 | 9 | 35 | 5 | t1/2 | 0.162 | 0.553 | 0.151 | 0.613 | 0.224 | 0.627 | 0.180 | 0.593 |
| 1026840 | HLA-B*58:01 | 9 | 437 | 46 | Binary | 0.385 | 0.862 | 0.400 | 0.879 | 0.380 | 0.857 | 0.361 | 0.840 |
| 1026891 | HLA-B*58:01 | 9 | 20 | 12 | Binary | 0.637 | 0.875 | 0.442 | 0.760 | 0.638 | 0.875 | 0.584 | 0.844 |
| 1026897 | HLA-B*58:01 | 9 | 25 | 5 | Binary | 0.485 | 0.850 | 0.541 | 0.890 | 0.485 | 0.850 | 0.416 | 0.800 |
| 1026897 | HLA-B*58:01 | 10 | 18 | 3 | Binary | 0.330 | 0.756 | 0.101 | 0.578 | 0.129 | 0.600 | 0.537 | 0.889 |
| 1026891 | HLA-C*03:04 | 9 | 20 | 11 | Binary | 0.706 | 0.909 | — | — | — | — | — | — |
| 1026840 | HLA-C*07:01 | 9 | 18 | 12 | IC50 | −0.181 | 0.542 | −0.013 | 0.389 | 0.166 | 0.611 | — | — |
| 1026840 | HLA-C*07:01 | 9 | 439 | 31 | Binary | 0.248 | 0.780 | 0.134 | 0.654 | 0.229 | 0.758 | — | — |
| 1026891 | HLA-C*07:02 | 9 | 20 | 7 | Binary | 0.245 | 0.648 | 0.391 | 0.736 | 0.409 | 0.747 | — | — |
| 1026891 | HLA-C*08:01 | 9 | 20 | 12 | Binary | 0.566 | 0.833 | — | — | — | — | — | — |
| Total: | 3791 | 738 | Average: | 0.388 | 0.761 | 0.355 | 0.733 | 0.376 | 0.749 | 0.353 | 0.722 | ||
Each dataset has a unique combination of allele, peptide length and measurement type. Only datasets with a peptide count of at least 10 and at least 2 positive and 2 negative measurements are reported.
To summarize the overall performance of different methods, we calculated percentage rank scores for each of the 33 datasets for which predictions were made by two or more different methods (Supplementary Table S1). As shown in the ranking scores depicted in Figure 1, the ANN and NetMHCpan servers were the best performing with comparable ranking scores, followed by SMM and finally ARB. Comparing the rank scores in Supplementary Table S1 to the absolute SRCC and AUC scores in Table 1, it becomes apparent that averages over the ranks are preferable as an overall summary of relative prediction performance given the fact that not all methods cover the same datasets. For example, the ARB server was unable to provide predictions for three datasets covering the molecules HLA-C*07:01 and HLA-C*07:02. Only a small number of training data are available for these MHC molecules, and as such, it is expected that servers will perform poorly on these datasets, as was indeed the case for the three other methods. Thus, methods attempting to make predictions for poorly characterized MHC molecules would be punished unequally when considering average absolute performance measures, while the use of rank scores, which are centered around 50 for all datasets, avoids this bias.
Fig. 1.
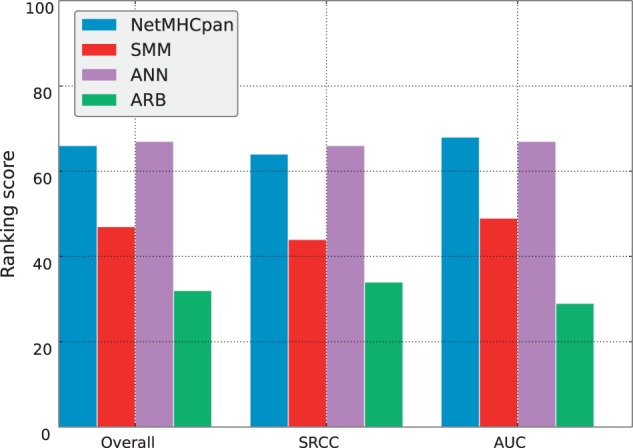
Ranking scores for the initial IEDB benchmark. The scores for each server are calculated based on AUC performance, SRCC performance and both performance measures
3.2 Weekly IEDB benchmarks
After the initial IEDB benchmark, the automated framework began running weekly benchmarks on March 21, 2014. Figure 2 shows the accumulative number of peptides benchmarked after each weekly benchmark. In general, less than 20 measurements are added to the IEDB each week, stemming from curated scientific literature. These measurements are often distributed among different MHC molecules or lengths, or are measured using different assays, meaning they are not large enough to meet the inclusion criteria for a benchmark dataset. This can be seen in Figure 2, as in most weeks, no new data are included. However, based on past experience and the submission statistics from 2013, every 3–6 months a large amount of data are added to the IEDB, often in a single submission. Data from these large submissions make up the bulk of the measurement data run by the automated benchmark. Figure 3 shows the number of unique alleles in the automated benchmark with at least a single evaluated dataset. The number of unique alleles will likely increase with upcoming large data submissions to the IEDB.
Fig. 2.

The accumulated number of peptide-MHC measurements benchmarked by the automated benchmarking framework during its first 2 months. A total of 311 new measurements were identified and run during this time period
Fig. 3.

The number of unique alleles benchmarked by the automated benchmarking framework
Cumulative ranking scores for each participating server were calculated each week during the first 2 months of automated weekly benchmarks. The scores are plotted in Figure 4. As benchmarks are run so frequently with the automated framework, there was a risk that the top-performing server (which users will be recommended for their prediction) also changes frequently. Figure 4 shows that this is not the case, as each server’s position in terms of ranking score is relatively stable. This is at least partially due to the fact that during the first 2 months of weekly benchmarks, only seven new datasets were benchmarked. This corresponds to roughly 20% of the datasets present in the initial IEDB benchmark. As the cumulative ranking score takes into account all datasets submitted within the three previous months, the newly added datasets did not have enough weight to significantly impact the performance rankings.
Fig. 4.
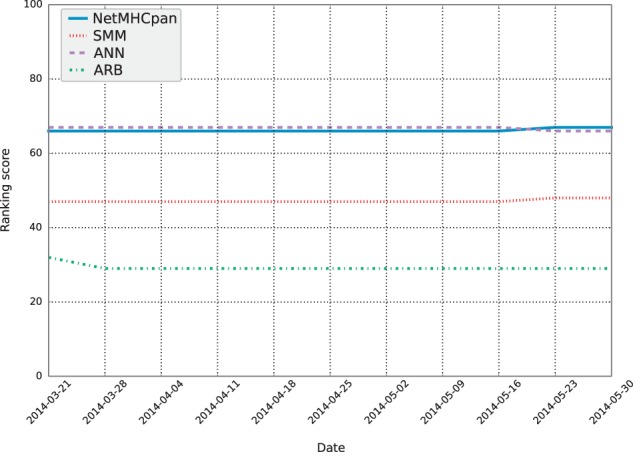
The accumulated ranking score for each participating server, calculated after each weekly benchmark run during the first 2 months
3.3 Dedicated dataset benchmark
The results above demonstrate that the continuous addition of data to the IEDB provides a stream of benchmark datasets that can be used to compare prediction performances of MHC-I binding prediction methods in an automated manner. On the other hand, there are downsides to relying on IEDB datasets for benchmarking. Peptides in the IEDB datasets are often chosen because of their high predicted affinity. It is thus possible that gaps in our knowledge remain for peptides in poorly covered sequence spaces. Also, for many peptides, all methods make very similar predictions, and such data points will not help discriminate which methods perform better. To deal with these issues, we generated a dedicated peptide dataset by making predictions for a large number of peptides and asking which peptides would be most information rich when it comes to differentiating between individual prediction methods (see Section 2 for details). A total of 312 unique peptide-MHC combinations were selected of which 208 were divergently predicted peptides and 104 were consistently predicted peptides (Supplementary Table S2). We term this set of peptides the dedicated dataset. The peptides were synthesized and binding affinities were measured for each peptide-MHC combination and submitted to the IEDB as a regular data submission. The measurement data can be found online at: http://www.iedb.org/refid/1028554.
Submitting the dedicated dataset to the IEDB triggered its inclusion in the same prediction evaluation pipeline that is used for all other IEDB submissions. AUC and SRCC performance metrics for each server for five of the MHC molecules are listed in Table 2 and corresponding percentage rank scores in Supplementary Table S3. The HLA-B*53:01 dataset was automatically excluded from the benchmark as none of the peptides in the dataset were measured to be positive binders. The average rank scores for the dedicated dataset are displayed in Figure 5 and show that ANN was the best performing server with an overall ranking score of 70, followed by NetMHCpan with 63, SMM with 53 and finally ARB with a low score of 13.
Table 2.
Server performance values for the dedicated dataset benchmark
| IEDB reference | Allele | Peptide length | Peptide count | Positive count | Measurement type | NetMHCpan |
SMM |
ANN |
ARB |
||||
|---|---|---|---|---|---|---|---|---|---|---|---|---|---|
| SRCC | AUC | SRCC | AUC | SRCC | AUC | SRCC | AUC | ||||||
| 1028554 | HLA-A*02:01 | 9 | 44 | 7 | IC50 | 0.696 | 0.888 | 0.581 | 0.898 | 0.620 | 0.828 | 0.507 | 0.761 |
| 1028554 | HLA-B*07:02 | 9 | 52 | 6 | IC50 | 0.617 | 0.772 | 0.661 | 0.851 | 0.698 | 0.884 | 0.654 | 0.757 |
| 1028554 | HLA-B*35:01 | 9 | 56 | 3 | IC50 | 0.364 | 0.679 | 0.206 | 0.591 | 0.273 | 0.566 | 0.260 | 0.642 |
| 1028554 | HLA-B*44:03 | 9 | 46 | 3 | IC50 | 0.457 | 0.612 | 0.466 | 0.752 | 0.559 | 0.651 | 0.249 | 0.558 |
| 1028554 | HLA-B*57:01 | 9 | 53 | 10 | IC50 | 0.619 | 0.863 | 0.331 | 0.765 | 0.519 | 0.944 | 0.124 | 0.628 |
| Total: | 251 | 29 | Average: | 0.551 | 0.763 | 0.449 | 0.771 | 0.534 | 0.775 | 0.359 | 0.669 | ||
Fig. 5.
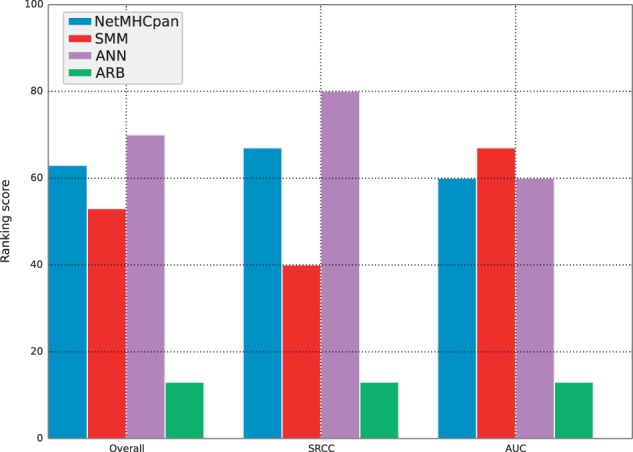
Ranking scores calculated based on performance values from the dedicated dataset benchmark
Thus, the overall performance ranking of the methods in the initial IEDB benchmark and the dedicated dataset benchmark is in agreement. An interesting observation is that the SMM method performed much better in terms of AUC than in terms of SRCC performance. This trend was also true for the initial IEDB benchmark above and was observed by us on other occasions previously. This suggests that the neural-network-based methods, compared with the SMM method, are better at correctly ranking individual peptides beyond the classification task into binders and non-binders.
3.4 Online results
The automated MHC-I server benchmark is run weekly on new data submitted to the IEDB. As such, server rankings are updated each time a sufficient amount of new measurement data are identified and run through the benchmark pipeline. Up-to-date performance evaluations of each server can be found online at http://tools.iedb.org/auto_bench/mhci/weekly/. A screenshot of the results page is shown in Figure 6. The overall conclusion from running this benchmark for a period of 2 months is hence that the relative performance ranking from best to worst of the four participating predictions methods is NetMHCpan and ANN closely tied with overall ranking scores of 67 and 66, respectively, followed by SMM with a score of 48 and finally ARB with a score of 29. These results are based on a large dataset covering 17 HLA alleles and more than 4000 peptide-MHC measurements and are hence expected to be as unbiased as possible given the fact that prediction methods in many situations are used to guide peptide selection prior to experimental validation.
Fig. 6.

A screenshot of the results page for the automated MHC-I benchmark. The individual dates may be clicked on to view detailed information on the evaluation datasets benchmarked that week
4 Discussion
Prediction of peptide binding to MHC molecules has over the last decades become a key and critical component of most rational epitope discovery projects, and large efforts have been invested in developing methods with high accuracy in making such predictions. Given the large number of available methods, it is difficult for the end user to judge which method is optimal for a given task. Here, we have designed a pipeline for the automated benchmarking of methods predicting peptide binding to MHC-I molecules, where methods are evaluated on data submitted to the IEDB prior to the data being made publicly available. To enable easy access to participation in the benchmark, the requirements to join are limited to a minimum and participants are only required to set up and host a simple RESTful web service. The benchmark is run on a weekly basis, and the results are reported at a publicly available website in terms of both an overall and easy interpretable performance score for each participating method, as well as in terms of the detailed performance numbers for each method for each benchmark dataset included in the evaluation. This type of reporting makes the evaluation and calculation of evaluation scores fully transparent to the community.
While setting up the automated benchmarking framework, we chose to include only a limited set of methods initially. We chose four representative methods, with two matrix-based methods (SMM and ARB) and two neural-network-based methods (ANN and NetMHCpan) where one was a pan-specific method. Moving forward, we will add multiple additional methods, including SMMPMBEC (Kim et al., 2009), an updated version of SMM that has shown superior predictive performance compared with SMM in previous benchmarks; IEDB consensus (Moutaftsi et al., 2006), the consensus method currently recommended at the IEDB Analysis Resource (Kim et al., 2012) as well as the consensus method NetMHCcons (Karosiene et al., 2012) and the pan-specific method PickPocket (Zhang et al., 2009b).
In creating a scoring scheme for the automated benchmark, we wanted to utilize a metric that both accurately reflects performance and is easily understood. For ease of comparison, we wanted to create a single summary metric that allows users to compare two or more methods. However, we acknowledge that a single summary ranking will not in all situations accurately reflect performances. We are currently aware of at least two weaknesses that may become problematic in the future. As there is no penalty for not providing predictions for any given allele, it is currently possible for a method to obtain a high ranking score by opting to only participate on alleles for which the method is known to have a strong performance. Although this is currently not a problem, we are prepared to alter the scoring scheme if this becomes a practical issue. This will entail introducing a set of ‘representative alleles’ for which a large amount of training data are available and for which all participating methods must provide predictions or suffer a penalty. Another weakness is that each dataset has an equal impact on the final ranking scores, in spite of the fact that some datasets will inherently be more difficult to predict correctly than others (Kim et al., 2014). Inspired by the evaluation strategy used in CASP (Cozzetto et al., 2009), we are considering adding an evaluation weight to each dataset based on the Z score of the performance evaluations. Thus, a dataset where all methods have similar performances will be weighted low, whereas a dataset where some methods perform well and others poorly will be weighted high.
Another critical issue for the automated benchmark relates to how performance should be reported for methods that join the benchmark at different times. In the benchmarks described here, this has not been a critical issue, as all methods have been part of the automated benchmark from the beginning. In the future when novel methods will join the benchmark at different time points, it is critical to define how the performances of the different methods will be reported. Ideally, the performance reported for the different methods participating in the benchmark should be evaluated on an identical dataset for the performance values to be comparable. On the other hand, it would be important for the method developers joining the benchmark to see the performance of their method compared with others as quickly as possible. To deal with this issue, the following enrollment and evaluation strategy has been implemented. The overall benchmark performance score is calculated in a time window of 3 months. Novel methods can join the benchmark at any point but will only be included in the cumulative ranking comparison with other methods after participating in the benchmark for 3 months. This way, all methods are evaluated on identical datasets when it comes to the overall ranking score. Performance measures on individual datasets will be available with no time delay and all participating servers will receive weekly ranking scores as soon as new data are benchmarked. An archive of historical benchmark datasets and server evaluations is kept and made publicly available.
The results presented in Table 1 show that server performance rankings may vary substantially between different datasets. For example, of the six HLA-A*02:01 9mer datasets, ANN was the top performing method for three datasets yet in last place for the other three. Given the small size and heterogeneous sources of some datasets, such variability is not unexpected. We expect that the 3-month accumulated ranking scores will help minimize the inherent performance variations by giving users ranking scores based on a large number of datasets. We strongly recommend that users refer to these scores when choosing which prediction tool to use.
It is important to keep in mind that the ranking scores do not provide information about the absolute predictive performance of the methods. The scores are only meaningful in the context of each other, as they show how the methods rank among each other. For example, a method with a ranking score of 100 is per definition the best performing method across all datasets. However, the method may have achieved this with AUC scores of 0.75 and SRCC scores of 0.5, as long as the rest of the methods scored lower. On the other hand, a method with a ranking score of 0 may still provide good predictions, the other methods simply performed better.
The benchmark has been running stably since March 2014 with four participating prediction methods (SMM, ANN, NetMHCpan and ARB). The overall conclusion taken from the benchmark results is that the best performing method is NetMHCpan with an accumulated overall ranking score of 67, followed by ANN with a score of 66, SMM scoring 48 and ARB scoring 29.
We believe this pipeline will be an important help for future prediction tool developers as both the benchmark evaluation data and predictions from all participating servers are made publicly available to the community. Given the minimal effort involved in joining the benchmark, we expect that the pipeline will act as the common benchmark platform for evaluation of future peptide-MHC-I binding prediction methods. The use of a common benchmark platform will be of significant importance to the end-user working within epitope discovery, enabling an educated selection of which prediction tool to use for the given task at hand.
This is the first automated benchmark platform developed within the field of immunoinformatics. In the future, we expect to expand the platform to cover other aspects of epitope identification, including prediction of naturally processed ligands, T-cell epitopes and B-cell epitopes.
Funding
This study was supported in whole or in part with Federal funds from the National Institutes of Allergy and Infectious Diseases, National Institutes of Health, Department of Health and Human Services, under Contract No. HHSN272201200010C. M.N. is a researcher at the Argentinean national research council (CONICET).
Conflict of Interest: none declared.
Supplementary Material
References
- Androlewicz M.J., et al. (1993) Evidence that transporters associated with antigen processing translocate a major histocompatibility complex class I-binding peptide into the endoplasmic reticulum in an ATP-dependent manner. Proc. Natl Acad. Sci. USA, 90, 9130–9134. [DOI] [PMC free article] [PubMed] [Google Scholar]
- Bui H.-H., et al. (2005) Automated generation and evaluation of specific MHC binding predictive tools: ARB matrix applications. Immunogenetics, 57, 304–314. [DOI] [PubMed] [Google Scholar]
- Cozzetto D., et al. (2009) Evaluation of template-based models in CASP8 with standard measures. Proteins, 77(Suppl. 9), 18–28. [DOI] [PMC free article] [PubMed] [Google Scholar]
- Eyrich V.A., et al. (2001) EVA: continuous automatic evaluation of protein structure prediction servers. Bioinformatics, 17, 1242–1243. [DOI] [PubMed] [Google Scholar]
- Hattotuwagama C.K., et al. (2004) Quantitative online prediction of peptide binding to the major histocompatibility complex. J. Mol. Graph. Model.,22, 195–207. [DOI] [PubMed] [Google Scholar]
- Hoof I., et al. (2009) NetMHCpan, a method for MHC class I binding prediction beyond humans. Immunogenetics, 61, 1–13. [DOI] [PMC free article] [PubMed] [Google Scholar]
- Jenkins M.K., Moon J.J. (2012) The role of naive T cell precursor frequency and recruitment in dictating immune response magnitude. J. Immunol., 188, 4135–4140. [DOI] [PMC free article] [PubMed] [Google Scholar]
- Karosiene E., et al. (2012) NetMHCcons: a consensus method for the major histocompatibility complex class I predictions. Immunogenetics, 64, 177–186. [DOI] [PubMed] [Google Scholar]
- Kim Y., et al. (2009) Derivation of an amino acid similarity matrix for peptide: MHC binding and its application as a Bayesian prior. BMC Bioinformatics,10, 394. [DOI] [PMC free article] [PubMed] [Google Scholar]
- Kim Y., et al. (2012) Immune epitope database analysis resource. Nucleic Acids Res., 40, W525–W530. [DOI] [PMC free article] [PubMed] [Google Scholar]
- Kim Y., et al. (2014) Dataset size and composition impact the reliability of performance benchmarks for peptide-MHC binding predictions. BMC Bioinformatics, 15, 241. [DOI] [PMC free article] [PubMed] [Google Scholar]
- Kryshtafovych A., et al. (2014) CASP prediction center infrastructure and evaluation measures in CASP10 and CASP ROLL. Proteins, 82(Suppl. 2), 7–13. [DOI] [PMC free article] [PubMed] [Google Scholar]
- Lin H.H., et al. (2008a) Evaluation of MHC class I peptide binding prediction servers: applications for vaccine research. BMC Immunol., 9, 8. [DOI] [PMC free article] [PubMed] [Google Scholar]
- Lin H.H., et al. (2008b) Evaluation of MHC-II peptide binding prediction servers: applications for vaccine research. BMC Bioinformatics, 9(Suppl. 12), S22. [DOI] [PMC free article] [PubMed] [Google Scholar]
- Lundegaard C., et al. (2008) NetMHC-3.0: accurate web accessible predictions of human, mouse and monkey MHC class I affinities for peptides of length 8-11. Nucleic Acids Res., 36, W509–W512. [DOI] [PMC free article] [PubMed] [Google Scholar]
- Moutaftsi M., et al. (2006) A consensus epitope prediction approach identifies the breadth of murine T(CD8+)-cell responses to vaccinia virus. Nat. Biotechnol., 24, 817–819. [DOI] [PubMed] [Google Scholar]
- Nielsen M., et al. (2007) NetMHCpan, a method for quantitative predictions of peptide binding to any HLA-A and -B locus protein of known sequence. PLoS One, 2, e796. [DOI] [PMC free article] [PubMed] [Google Scholar]
- Peters B., Sette A. (2005) Generating quantitative models describing the sequence specificity of biological processes with the stabilized matrix method. BMC Bioinformatics, 6, 132. [DOI] [PMC free article] [PubMed] [Google Scholar]
- Peters B., et al. (2006) A community resource benchmarking predictions of peptide binding to MHC-I molecules. PLoS Comput. Biol., 2, e65. [DOI] [PMC free article] [PubMed] [Google Scholar]
- Rock K.L., Goldberg a L. (1999) Degradation of cell proteins and the generation of MHC class I-presented peptides. Annu. Rev. Immunol., 17, 739–779. [DOI] [PubMed] [Google Scholar]
- Rock K.L., et al. (1994) Inhibitors of the proteasome block the degradation of most cell proteins and the generation of peptides presented on MHC class I molecules. Cell, 78, 761–771. [DOI] [PubMed] [Google Scholar]
- Serwold T., et al. (2002) ERAAP customizes peptides for MHC class I molecules in the endoplasmic reticulum. Nature, 419, 480–483. [DOI] [PubMed] [Google Scholar]
- Shen W.-J., et al. (2014) MHC binding prediction with KernelRLSpan and its variations. J. Immunol. Methods, 406, 10–20. [DOI] [PubMed] [Google Scholar]
- Sidney J., et al. (2001) Measurement of MHC/peptide interactions by gel filtration. Curr. Protoc. Immunol., Chapter 18, Unit 18.3. [DOI] [PubMed] [Google Scholar]
- Sijts E.J. a M., Kloetzel P.M. (2011) The role of the proteasome in the generation of MHC class I ligands and immune responses. Cell. Mol. Life Sci., 68, 1491–1502. [DOI] [PMC free article] [PubMed] [Google Scholar]
- Tai C.-H., et al. (2014) Assessment of template-free modeling in CASP10 and ROLL. Proteins, 82(Suppl. 2), 57–83. [DOI] [PMC free article] [PubMed] [Google Scholar]
- Vita R., et al. (2010) The immune epitope database 2.0. Nucleic Acids Res., 38, D854–D862. [DOI] [PMC free article] [PubMed] [Google Scholar]
- Wan J., et al. (2006) SVRMHC prediction server for MHC-binding peptides. BMC Bioinformatics, 7, 463. [DOI] [PMC free article] [PubMed] [Google Scholar]
- Wang X.-F., et al. (2007) Selective identification of HLA-DP4 binding T cell epitopes encoded by the MAGE-A gene family. Cancer Immunol. Immunother., 56, 807–818. [DOI] [PMC free article] [PubMed] [Google Scholar]
- Weimershaus M., et al. (2013) Peptidases trimming MHC class I ligands. Curr. Opin. Immunol., 25, 90–96. [DOI] [PubMed] [Google Scholar]
- Yewdell J.W., Bennink J.R. (1999) Immunodominance in major histocompatibility complex class I-restricted T lymphocyte responses. Annu. Rev. Immunol., 17, 51–88. [DOI] [PubMed] [Google Scholar]
- Zhang H., et al. (2009a) Pan-specific MHC class I predictors: a benchmark of HLA class I pan-specific prediction methods. Bioinformatics, 25, 83–89. [DOI] [PMC free article] [PubMed] [Google Scholar]
- Zhang H., et al. (2009b) The PickPocket method for predicting binding specificities for receptors based on receptor pocket similarities: application to MHC-peptide binding. Bioinformatics, 25, 1293–1299. [DOI] [PMC free article] [PubMed] [Google Scholar]
- Zhang G.L., et al. (2011) Machine learning competition in immunology—prediction of HLA class I binding peptides. J. Immunol. Methods, 374, 1–4. [DOI] [PubMed] [Google Scholar]
- Zhang L., et al. (2012) Toward more accurate pan-specific MHC-peptide binding prediction: a review of current methods and tools. Brief. Bioinform., 13, 350–364. [DOI] [PubMed] [Google Scholar]
Associated Data
This section collects any data citations, data availability statements, or supplementary materials included in this article.